1
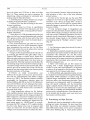
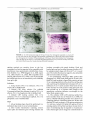
C
H
A
P
T
E
R
24
Two-Dimensional Difference
Gel Electrophoresis: Application for
the Analysis of Differential
Protein Expression in Multiple
Biological Samples
John F. Timms
Healthcare), with a third dye (Cy2) introduced, allowing simultaneous analysis of three samples on a single
gel. In expression profiling experiments, one dye is
used to label an internal standard to be run on all gels
against pairs of test samples labelled with the other two
dyes. This allows the direct comparison of ratios of
expression across multiple samples and gels, improving the ability to distinguish biological variation from
gel-to-gel variation. Because the labelling strategy
employed is compatible with downstream identification of gel spots by mass spectrometry (MS) (Tonge et
al., 2001; Gharbi et al., 2002), 2D-DIGE is of particular
use as a reproducible, high-throughput proteomic technology. This article describes the necessary materials
and instrumentation, experimental design, and work
flow for the preparation and labelling of samples for
2D-DIGE analysis. Image capture, analysis, and spot
picking for MS identification are also described.
I. I N T R O D U C T I O N
Fluorescence two-dimensional difference gel electrophoresis (2D-DIGE) is a recently developed 2D gelbased proteomics technique that provides a sensitive,
rapid, and quantitative analysis of differential protein
expression between biological samples. Developed
by Minden and co-workers (Unlu et al., 1997), the
technique utilizes charge- and mass-matched chemical
derivatives of spectrally distinct fluorescent cyanine
dyes (Cy3 and Cy5), which are used to covalently label
lysine residues in different samples prior to mixing
and separation on the same 2D gel. Resolved, labelled
proteins are then detected at appropriate excitation
and emission wavelengths using a multiwavelength
fluorescence detection device and the signals compared. As well as reducing the number of gels that
need to be run, differential labelling and mixing mean
that samples are subjected to the same handling procedures and microenvironments during 2D separation,
raising the confidence with which protein changes
can be detected and quantified. Because fluorescence
detection also provides a superior linear dynamic
range of detection and sensitivity to other methods
(Patton, 2000), this technology is suited to the analysis
of biological samples with their large dynamic ranges
of protein abundance.
The 2D-DIGE methodology is now commercialized
as the Ettan DIGE proteomics system (GE
Cell Biology
II. MATERIALS A N D
INSTRUMENTATION
The CyDye DIGE fluors N-hydroxysuccinimidyl
(NHS) esters of Cy2 (Prod. Code RPK0272), Cy3 (Prod.
No. RPK0273), and Cy5 (Prod. No. RPK0275) are from
GE Healthcare. NHS-Cy3 and NHS-Cy5 are also
synthesized in-house following the original published
protocol (Unlu et al., 1997), with modifications
189
Copyright 2006, Elsevier Science (USA).
All rights reserved.
190
PROTEINS
(unpublished
data). Anhydrous
9 9 . 8 % N,Ndimethylformamide (DMF, Cat No. 22,705-6) is from
Aldrich, urea (Cat. No. U-0631), dithiothreitol (DTT,
Cat. No. D-9163), thiourea (Cat. No. T-8656), and Llysine (Cat. No. L-5626) are from Sigma. 1.5 M Tris
solution, pH 8.8 (Prod. No. 20-79000-10), 1 M Tris solution, pH 6.8 (Prod. No. 20-7901-10), and 10x
Tris-glycine SDS electrophoresis buffer (Prod. No. 2064) are from Severn Biotech Ltd. Phosphate-buffered
saline (PBS, Cat No. 14190-094) is from GIBCO.
Nonidet P-40 (NP-40, Prod. No. 56009D2L), bromphenol blue (Prod. No. 200173J), methanol (Prod. No.
10158BG), and glacial acetic acid (Prod. No. 27013BV)
are from VWR. 3-[(3-Cholamidopropyl)-dimethylammonio]-l-propanesulfonate (CHAPS, Cat No. B2006)
and sodium dodecyl sulphate (SDS, Cat. No. B2008)
are from Melford Laboratories Ltd. Coomassie protein
assay reagent (Prod. No. 1856210) is from Pierce, S&S
weighing papers (Cat. No. Z13411-2) are from Aldrich,
and low-gelling temperature agarose (Cat. No. 05075)
is from Fluka.
Ampholines (pH 3.5-10, Cat. No. 80-1125-87), Pharmalyte (pH 3-10, Cat. No. 17-0456-01), Immobiline
DryStrip reswelling tray (Cat. No. 80-6465-32), Immobiline DryStrip IEF gels (IPG strips, Cat. No. 17-600245), Multiphor II electrophoresis unit (Cat. No.
18-1018-06), Ettan DALT low fluorescence glass plates
(27 x 22 cm, Cat. No. 80-6475-58), Plus One Repel
Silane (Cat. No. 17-1332-01), Plus One Bind Silane (Cat.
No. 17-1330-01), reference markers (Cat. No. 18-114334), Ettan DALT 12-gel caster, separation unit, and
power supply (Cat. Nos. 80-6467-22 and 80-6466-27),
Typhoon 9400 imager (Cat. No. 60-0038-54), Ettan Spot
Picker (Cat. No. 18-1145-28), and DeCyder differential
analysis software (Cat. No. 56-3202-70) are from
GE Healthcare. SYPRO Ruby protein gel stain (Cat.
No. S-12000) is from Molecular Probes, and colloidal
Coomassie brilliant blue G-250 tablets (CBB, Cat
No. K26283182) are from Merck. The Immobilon-P
polyvinylidene fluoride transfer membrane (PVDF,
Cat. No. IPVH00010) is from Millipore.
III. PROCEDURES
A. Experimental Design
The following steps are guidelines for the design of
2D-DIGE expression profiling experiments. Several
experiments are outlined to illustrate how samples can
be fluorescently labelled and mixed for 2D gel separation and image analysis so that statistically meaningful data can be acquired. The throughput of the
technique is, however, dependent upon the 2D gel
running, image capture, and analysis capabilities of
the laboratory. We routinely run 12-gel experiments
providing accurate differential expression data for 24
samples, including an internal standard run on all gels
for accurate spot matching and quantitation. The same
gels are then poststained and proteins of interest are
picked for MS identification. 2D-DIGE is applicable for
the analysis of total cell lysates and complex protein
mixtures from cultured cells, whole tissues, sorted or
fractionated cells, whole organisms (E. coli, S. pombe, C.
elegans, etc.), cellular subfractions (membrane, nuclear,
cytoplasmic, etc.), or affinity-purified protein fractions.
Steps
1. Three spectrally distinct fluorescent CyDyes
(Cy2, Cy3, and Cy5) can be used for differential
labelling of protein samples. In the simplest expression
profiling experiment, two individual samples are
labelled with two different dyes, mixed, and resolved
on a single 2D gel (see Section III,B). Because the same
protein isoforms in each sample will comigrate, one
can accurately measure differential expression as the
ratio of the fluorescence intensities of comigrating
spots. Thus, the problem of gel-to-gel variation is
avoided. This type of single gel experiment is useful
where only limited sample quantities are available,
e.g., laser capture dissection-procured normal and
cancer cells (Zhou et al., 2002).
2. To obtain statistically meaningful expression
changes, at least triplicate samples should be labelled
and analysed on separate gels. These may be biological replicates, e.g., three separately grown cell cultures
or tissue from three individual animals, or may be
experimental replicates, where three aliquots of the
same sample are compared across different gels. Differential expression can then be taken as an average
fold change (e.g., the average spot intensity ratio
between differentially labelled spots matching across
all three gels) with statistical confidence provided by
applying a t test. Of note we have found considerable
interanimal variation in liver lysates from mice
(unpublished data), and it is therefore advisable to
analyse samples from at least five individual animals
for each treatment or condition to provide statistically
meaningful data.
3. 2D-DIGE analysis is further improved by
running a Cy-labelled internal standard on all gels
against pairs of test samples, labelled with the other
two CyDyes. This increases the ability to distinguish
biological variation from gel-to-gel variation by
increasing the confidence with which spots can be
matched across gels and by allowing the direct comparison of expression ratios across samples. An equal
TWO-DIMENSIONAL DIFFERENCEGEL ELECTROPHORESIS
pool of all samples (including biological replicates) is
best employed as an internal standard as it will contain
proteins present in all samples. It is created simply by
mixing and labelling equal amounts of protein from
every sample and should provide sufficient material
for the number of gels to be run. Equal amounts of standard and test samples are then resolved on each gel.
4. In an experiment comparing 100 ~g of protein
from cell A and cell B, lysates from triplicate cultures
are prepared and protein concentrations determined
(six samples). For simplicity, samples are adjusted to
the same protein concentration by adding lysis buffer.
Then 100 ~g of each is labelled with Cy3 or Cy5 as
shown in Table I. A pool consisting of a mixture of
50 ~tg of each of all the replicate samples (300 ~tg total)
is labelled with Cy2. Following labelling, the samples
are mixed appropriately for separation on three 2D
gels as shown in Table I. This scheme controls for dye
bias, although labelling combinations are interchangeable so long as each gel is loaded with samples labelled
with distinct dyes. This experiment generates nine
images for matching, cross-comparison, and statistical
analysis in the biological variance analysis (BVA)
module of DeCyder software.
5. For complex comparisons we recommend
running 12 gels at once. This allows imaging within a
day and fits with our downstream laboratory work
flow. Although more gels can be run in an individual
experiment, consistency may be compromised by
running gels at different times or on different electrophoresis units, or may be impractical depending on
man power, resources, and automation. Still, it is possible to compare 24 different samples in a single 12-gel
2D-DIGE experiment. For example, our laboratory was
able to analyse lysates from two cell lines subjected
to growth factor stimulation for four different time
periods (8 conditions) using triplicate cultures (Gharbi
et al., 2002). The 24 lysates generated were labelled
with Cy3 or Cy5 and run in pairs against the internal
standard (a pool of all samples) labelled with Cy2. This
generated 36 images for DeCyder BVA analysis, with
an image acquisition time o f - 8 h using a Typhoon
9400 imager.
E x a m p l e of Differential Labelling, Mixing,
and Loading for Statistical Comparison of Protein
Expression in Two Cell Lines Using 2D-DIGE
TABLE I
Gel 1
Gel 2
Gel 3
Cy3
Cy5
Cy2
100 ~tg A, replicate 1
100 ~tg B, replicate 2
100 ~tg A, replicate 3
100 ~tg B, replicate 1
100 ~tg A, replicate 2
100 ~tg B, replicate 3
100 ~tg pool
100 ~tg pool
100 ~tg pool
191
B. Preparation of CyDye-Labelled Samples for
2D Electrophoresis
The following procedure can be applied for the
preparation and labelling of multiple samples for 2DDIGE comparative protein expression analysis. The
procedure is based on the Ettan DIGE System (GE
Healthcare), with some modifications. The protocol is
designed to generate differentially labelled samples
that are compatible with all systems for 2D gel electrophoretic separation. The principles and applications
of 2D gel electrophoresis are discussed in more detail
elsewhere in this volume. For brevity, the sample
preparation is outlined for 24-cm pH 3-10 NL-immobilised pH gradient (IPG) gels. Accordingly, final
volumes, protein loads, and IPG buffers may differ
depending on the size and pH range of the firstdimension gels.
Solutions
1. CyDyes (NHS-Cy2,-Cy3,-Cy5): From lyophilized
powder (stored at-20~
reconstitute to I mM stock
by dissolving in the appropriate volume of anhydrous
DMF. Keep stock solutions in the dark at -20~ they
are stable for up to 4 months.
2. Lysis buffer: 8 M urea, 2 M thiourea, 4% (w/v)
CHAPS, 0.5% NP-40 (w/v), 10 mM Tris-HC1, pH 8.3.
To make 100 ml, dissolve 48 g of urea and 15.2 g of
thiourea in 50 ml of distilled H 2 0 . Add 4 g CHAPS,
0.5 g NP-40, and 0.67 ml of 1.5 M Tris, pH 8.8, solution. This should give a final pH of 8.3. Make up
to final volume, aliquot, and store at-20~
Do not
heat.
3. 40% (w/v) CHAPS: To make 50 ml, dissolve 20 g
CHAPS in distilled H 2 0 and complete to 50 ml. Store
at room temperature.
4. 10% (w/v) NP-40: To make 50 ml, dilute 5 g of
100% NP-40 in distilled H20 and complete to 50 ml.
Store at room temperature.
5. L-lysine solution: 10 mM L-lysine in H 2 0 . Dissolve
9.1 mg in 5 ml distilled H20. Aliquot and store at
-20~
6. DTT solution: 1.3 M DTT in H20. To make 10 ml,
dissolve 2 g DTT in distilled H20 and complete to
10 ml. Aliquot and store at -20~ Do not heat.
7. Ampholines/Pharmalyte mix: Mix equal volumes of
ampholines (pH 3.5-10) and Pharmalyte (pH 3-10).
Store at 4~ These broad pH range IPG buffers can be
replaced with narrow range buffers depending on the
first-dimension pH range.
8. Bromphenol blue: 0.2% (w/v) bromphenol blue in
H20. To make 10 ml, weigh 20 mg bromphenol blue
and complete to 10 ml with distilled H20. Filter and
store at room temperature.
19 2
PROTEINS
Steps
1. Wash cultured or fractionated cells, whole organisms, or tissues in PBS or, if possible, a low-salt buffer
that does not compromise cellular integrity. Salts
should be kept to a minimum so drain well. Subcellular or affinity-purified fractions should be prepared at high protein concentration (>2.5 mg/ml) in a
low-salt buffer (<10 mM) or dialysed against a low-salt
buffer.
2. Lyse cells in lysis buffer using appropriate physical disruption (sonnication, grinding, homogenisation, repeated passage through a 25-gauge needle). Do
not let samples heat up. A volume of buffer should be
used to give a final protein concentration of at least
I mg/ml. For cellular fractions in a known volume of
low-salt buffer and at >2.5 mg/ml, add urea, thiourea,
10% NP-40, 40% CHAPS, and 1.5 M Tris, pH 8.8, solution to give final concentrations of 8 M urea, 2 M
thiourea, 4% (w/v) CHAPS, 0.5% (w/v) NP-40, and
10 mM Tris (same as lysis buffer). Rotate on a wheel at
room temperature until reagents have dissolved.
Because the volume is increased substantially upon
reagent addition, amounts should be calculated for
2.5 times the original sample volume. Thus, for a 1-ml
sample, add 1.2 g urea, 0.38 g thiourea, 250 ~tl 40%
CHAPS, 125 ~tl 10% NP-40, 16.67 ~tl 1.5 M Tris, pH 8.8,
and make to 2.5 ml with lysis buffer. Use weighing
papers to avoid static during weighing. The final
pH should b e - 8 . 3 , the optimum for NHS-CyDye
labelling.
3. Determine protein concentrations using Pierce
Coomassie protein assay reagent according to the
manufacturer's instructions, using BSA in lysis
buffer to generate a standard curve. It is recommended
that at least four replicate assays are performed for
each sample for accurate protein determination.
Dilute concentrated samples with lysis buffer if necessary. For ease, samples should be adjusted to the
same protein concentration at this point using lysis
buffer.
4. Aliquot desired amount of sample into tubes for
CyDye labelling. Typically we label 100 ~tg of protein
in triplicate using a random combination of Cy3 and
Cy5 across the sample set (See Experimental Design).
Mix equal amounts of protein from each sample to
create an internal standard. This is labelled with Cy2
and should provide enough material for the number
of gels to be run (100 ~tg/gel).
5. Label samples by the addition of 4 pmol of
the appropriate CyDye per microgram of protein
(400 pmol/100 ~tg, equivalent to 4 ~tM for a 1-mg/ml
sample). CyDye stocks can be diluted with anhydrous
DMF to avoid pipetting submicroliter volumes. Incu-
bate samples on ice in the dark for 30 min. Note that
protein lysates are viscous so ensure thorough mixing
at all steps to avoid non-uniform labelling.
6. Quench reactions by adding a 20-fold molar
excess of L-lysine. For 400 pmol CyDye, add 0.8 ~tl of
10 mM L-lysine solution. Incubate on ice in the dark
for 10 min.
7. Mix Cy3- and Cy5-1abelled samples appropriately and add a 100-~tg aliquot of the Cy2-1abelled pool
(to give 300 ~tg total protein). Note that the final
volume should be less than that required for
reswelling of IPG strips (450 ~tl for 24-cm strips). This
reswelling volume dictates the practical lower limit for
sample protein concentrations.
8. Reduce samples by adding 1.3 M DTT to a
final concentration of 65 mM (22 ~tl). Add carrier
ampholines/Pharmalyte mix to a final concentration
of 2% (v/v) (9 ~tl) and 1 ~tl of 0.2% bromphenol blue.
Adjust volume to 450 ~tl with lysis buffer. Spin samples
briefly.
9. Rehydrate Immobiline DryStrip pH 3-10 NL gels
with samples overnight in the dark at room temperature in a reswelling tray according to the manufacturer's instructions (passive rehydration method).
Other methods of sample loading (cup loading, rehydration under voltage) can also be applied depending
on user preference.
10. Perform 2D electrophoresis following guidelines for the type of system employed, but see Section
III,C for recommended modifications.
Comments
1. Primary amines and reducing agents should be
avoided as they interfere with CyDye labelling. These
include carrier ampholines/Pharmalytes and DTT,
which are therefore added after labelling but prior to
2D-PAGE.
2. It is often necessary to use protease, kinase, and
phosphatase inhibitors for the preparation of lysates
and cellular fractions. We have found that aprotinin
(17 ~tg/ml), pepstatin A (1 ~tg/ml), leupeptin (1 ~tg/
ml), EDTA (1 mM), okadaic acid (1 ~tM), fenvalerate
(5 ~tM), BpVphen (5 WV/), and sodium orthovanadate
(2 mM), at the final concentrations shown, do not interfere with CyDye labelling.
3. The quantity of CyDye used for labelling is
limiting in the reaction and only N3% of protein molecules are labelled on an average of one lysine residue
(minimal labelling). This minimal labelling approach
maintains sample solubility and prevents heterogeneous labelling that would lead to vertical spot
trains. However, because 436 Da (Cy2), 467 Da (Cy3),
or 465 Da (Cy5) is added to the 3% of labelled molecules, a slight shift in migration is observed between
TWO-DIMENSIONAL DIFFERENCEGEL ELECTROPHORESIS
193
CyDye and poststained images (Gharbi et al., 2002).
This is more noticeable in the lower molecular
weight range and necessitates poststaining with a
general protein stain to attain accurate picking of
the majority (97%) of unlabelled protein (see Section
III,D).
C. Preparation of 2D Gels, Imaging, and
Image Analysis
Isoelectric focusing and second-dimension polyacrylamide gel electrophoresis of CyDye-labelled
samples can be performed on any system following the
manufacturer's instructions. However, inclusion of the
following steps is recommended for high sensitivity,
reproducibility, accuracy in the determination of
differential expression, and precise excision of protein
features for MS identification. The steps are detailed
for use with the Multiphor II IEF and Ettan DALT 12
PAGE separation systems for 24 x 20-cm 2D gels,
but are generally applicable to other systems. All gel
preparation and running steps should ideally be performed in a dedicated clean room to avoid contamination with particulates and nonsample proteins, such
as skin and hair keratins. Image analysis and statistical analysis can be performed using various 2D gel
analysis softwares (e.g., Melanie, Phoretix, ImageMaster), although DeCyder software is tailored specifically
for use with the 2D-DIGE system and is relatively
simple to use. Instructions for analysis using DeCyder
software are found in the DeCyder software user
manual.
Solutions
1. Bind saline solution: For twelve 24 x 20-cm plates,
mix 16 ~tl of Plus One bind saline, 400 ~tl glacial acetic
acid, 16 ml ethanol, and 3.6 ml distilled H20.
2. Equilibration buffer: 6 M urea, 30% (v/v) glycerol,
5 0 m M Tris-HC1, pH 6.8, 2% (w/v) SDS. To make
200 ml, dissolve 72 g urea in 100 ml distilled H 2 0 . Add
60 ml of 100% glycerol, 10 ml of 1 M Tris, pH 6.8, solution, and 4 g SDS. Dissolve all powders and adjust
volume to 200 ml with distilled H20. Aliquot and store
at -20~
3. Agarose overlay: 0.5% (w/v) low-melting point
agarose in lx SDS electrophoresis buffer. To make
200 ml, melt I g of agarose in 200 ml of lx SDS electrophoresis buffer in a microwave on low heat. Add
bromphenol blue solution to give a pale blue colour.
Steps
1. Prior to gel casting, treat low-fluorescence glass
plates for gel bonding by applying 1.5 ml of fresh bind
saline solution per plate and wiping over one surface
F I G U R E 1 (A) Treatment of plates for bonding and reference
marker positioning. (B) Casting and loading of second-dimension
gels. Based on the Ettan DALT 24-cm strip format.
with a lint-free tissue. Leave plates to dry for a
minimum of I h. Note that only one plate in each set
should be treated; treat the smaller, nonspacer "front
plate" if using Ettan DALT 24-cm gel plates (Fig. 1A).
Bonding allows easier handling of gels during scanning, protein staining, storage, and, importantly, automated spot excision.
2. Treat the inner surface of clean and dry "spacer
plates" with Repel Silane to ensure easy separation
after running (Fig. 1A). Apply PlusOne Repel Silane
solution to a lint-free tissue and wipe over the surface.
Leave to dry for 10 min. Use in a well-ventilated area.
Remove excess Repel Saline by wiping with a clean
tissue, rinse with ethanol, then with distilled H 2 0 , and
dry with a tissue.
3. Stick two reference markers to the bonded
surface of the plates. These should be placed half-way
194
PROTEINS
down the plates and 15-20 m m in from each edge
(Fig. 1A). These markers are used as references for
determining cutting coordinates for automated spot
picking using the Ettan Spot Picker.
4. Assemble plates in casting chamber and cast gels
according to the manufacturer's guidelines.
5. Perform IEF in the dark according to the manufacturer's guidelines.
6. Equilibrate strips for 15 min in equilibration
buffer containing 65 mM DTT (reduction) and then
15 min in the same buffer containing 240 mM iodoacetamide. (alkylation).
7. Rinse strips in lx SDS electrophoresis buffer and
place onto the top of second-dimension gels inmelted
0.5% agarose overlay, with the basic end of the strip
towards the left hand side when the bonded plate is
facing forward (Fig. 1B).
8. Run second-dimension gels until the dye front
has completely run off to avoid fluorescence signals
from bromphenol blue and free dye. For the Ettan
DALT twelve system, this can be achieved by running
12% gels for 16 h at 2.2 W per gel.
9. Images are best acquired directly after the 2D run
by scanning gels between their glass plates using a
Typhoon 9400 imager or similar device. Ensure that
both outer plate surfaces are clean and dry before scanning and that the bonded plate is the lower plate on
the scanner bed. If the strip is placed correctly (Fig. 1B),
the resulting image will not need to be rotated and give
a consensus image with the acidic end to the left. Alternatively, gels can be scanned after fixing with the gel
facing up from the bonded plate in the scanner, giving
the same orientation of the image.
10. Perform an initial low-resolution scan
(1000 ~tm) for one gel on the Cy2, Cy3, and Cy5 channels with the photomultiplier tube (PMT) voltages
set low (e.g., 500 V). The optimal excitation/emission
wavelengths for fluorescence detection using the
Typhoon 9400 are 488/520 nm for Cy2, 532/580 nm for
Cy3, and 633/680 nm for Cy5, although other instrumentation may vary slightly. An image is then built up
by the scanner for each channel and is converted to
grey-scale pixel values.
11. Using ImageQuant software for the Typhoon
9400, establish maximum pixel values in various userdefined, spot-rich regions of each image and adjust the
PMT voltages for a second low-resolution scan to give
similar maximum pixel values (within 10%) on each
channel and without saturating the signal from the
most intense peaks (i.e., <90,000 pixels). As a guide,
increasing the PMT voltage by 30 V roughly doubles
the pixel value. Repeat scans may be required until
values are within 10% for the three channels. PMT
voltages can be increased further to enhance the detec-
tion of low-intensity features, whilst producing tolerable saturation of only a few of the most abundant
protein features.
12. Once set for the first gel, use the same PMT
voltages for the whole set of gels scanning at 100-~tm
resolution. A 24 x 20-cm gel image takes -10 min to
acquire per channel and two gels are scanned simultaneously. Images are generated as .gel files, the same
format as .tif files.
13. Crop overlayed images in ImageQuant and
import into DeCyder Batch Analysis software for subsequent BVA analysis according to the DeCyder software user manual. Differential expression can also be
detected visually using Adobe Photoshop by overlaying coloured images (made in the Channel Mixer)
and merging using the "Multiply" option in "Layers"
(Fig. 2D).
Comments
1. Low-fluorescence glass plates should be used to
reduce background.
2. Bind Saline is extremely resistant to removal, and
cleaned plates previously treated are still likely to bind
acrylamide with subsequent use. For this reason,
dedicated treated plates are marked with a diamond
pen and reused in the same orientation for subsequent
experiments. Bind and Repel saline should be reapplied for subsequent runs.
3. Plates with bonded gels are best cleaned by
scraping with a sturdy straight-edged decorator's
scraper in warm water with detergent. It is important
to remove all gel material, as this produces a fluorescent signal in the Cy3 channel when dried.
4. CyDye-labelled, gel-separated proteins can also
be visualized on membranes following electroblotting.
The blotted PVDF membrane is scanned using the
Typhoon Imager immediately after transfer, wet and
face down under a low-fluorescence glass plate. These
membranes are subsequently used for immunoblotting with specific antibodies, and the immunoblot
signal is aligned directly with the CyDye signal. This
alignment can be used for spot identification, validation of MS, or to identify post translationally modified
proteins such as phosphoproteins. Note that gels must
not be bonded and the plates used must never have
been treated with bind saline.
D. Poststaining and Spot Excision
Bonded gels must be poststained to allow accurate
picking (see earlier discussion). We have found that
both Sypro Ruby and colloidal Coomassie brilliant
blue (CBB) protein stains can be used in conjunction
with CyDye labelling (Fig. 2). These general protein
TWO-DIMENSIONALDIFFERENCEGEL ELECTROPHORESIS
195
F I G U R E 2 (A) Cy5 fluorescence image of 100 mg of mouse liver homogenate separated on a 24-cm pH
3-10 NL IPG strip and 12% PAGE gel. (B) SyproRuby poststained gel of 300 mg of mixed CyDye-labelled
liver homogenate. (C) Colloidal CBB poststained gel of 300 mg of mixed CyDye-labelled liver homogenate.
This is the same gel as shown in A. (D) Adobe Photoshop-generated Cy3/Cy5 coloured overlay of WT (red)
and mutant (blue) mouse liver lysates showing differential expression.
staining methods are sensitive down to the low
nanogram level and are reported to be compatible with
downstream mass spectrometric identification of proteins (Scheler et al., 1998; Berggren et al., 2000; Lopez
et al., 2000; Gharbi et al., 2002). MS-compatible silver
staining (Shevchenko et al., 1996) is not recommended
for bonded gels due to its insensitivity and variability
from gel to gel.
Solutions
1. Fixing solution: 35% (v/v) methanol, 7.5% (v/v)
acetic acid in distilled H 2 0
2. Colloidal CBB fixing solution: For colloidal
Coomassie brilliant blue staining, fix gels in 35% (v/v)
ethanol, 2% (v/v) phosphoric acid in distilled H 2 0
3. Colloidal CBB staining solution: 34% (v/v)
methanol, 17% (w/v) ammonium sulphate, 3% (v/v)
phosphoric acid in distilled H 2 0
Steps
1. All gel staining steps should be performed in a
dedicated clean room to avoid contamination.
2. After CyDye fluorescence scanning, remove
spacer plate and immerse gels in fixing solution and
incubate overnight with gentle shaking. Fixed and
bonded gels can now be stored for many months at 4~
by sealing in plastic bags with 50 ml of 1% (v/v) acetic
acid. The CyDye fluorescence signal is also detectable
after several months of storage.
3. For poststaining with Sypro Ruby protein stain
(Berggren et al., 2000), wash fixed gels for 10 min in distilled H20 and incubate in Sypro Ruby stain for at least
3 h on a shaking platform in the dark. Pour off the stain
and wash the gel in distilled H 2 0 o r destain [10% (v/v)
methanol, 6% (v/v) acetic acid] for three times 10 min.
Drain and dry the outer surface of the glass plate and
scan gel-side up in a Typhoon 9400 imager at the
appropriate excitation/emission wavelength for the
Sypro Ruby protein stain.
4. The colloidal CCB G-250 staining method has
been modified from that of Neuhoff et al. (1988). Fix
gels in colloidal CBB fixing solution for at least 3 h on
a shaking platform. Wash three times for 30 min with
distilled H 2 0 and incubate in CCB staining solution for
I h. Add one crushed CCB tablet (25 mg) per 50 ml of
staining solution (0.5 g/liter) and leave to stain for 2-3
days. No destaining step is required to visualise proteins. Stained gels can be imaged on a densitometer or
196
PROTEINS
on the Typhoon scanner using the red laser and no
emission filters.
5. Align poststained and CyDye gel images to identify spots of interest for cutting. Alignment and spot
identification can be carried out by comparing images
by eye or using Adobe Photoshop to overlay images.
A shift in molecular weight between poststained and
CyDye images should be apparent due to the increased
mass of the dye-labelled fraction of proteins (Gharbi
et al., 2002).
6. For automated spot picking, input and process
poststained images in DeCyder software and create a
pick list for the spots of interest by comparing with the
results of the BVA analysis. To facilitate sample tracking and later data matching with MS results, the poststained image can be imported and matched within
the current experimental BVA work space. This means
that any spot picked according to the poststained
image will have the same master spot number as in the
BVA quantitative analysis. Define the positions of the
two reference markers in DeCyder (left then right) and
export the pick list coordinate file (.txt) to the spot
picker controller.
7. Excise chosen spots from the poststained gel. In
the case of visible colloidal CBB-stained gels, this can
be done manually with a glass Pasteur pipette or gelplug cutting pipette or on a robotic picker incorporating a "click-n-pick" format, such as the Ettan Spot
Picker. The gel is best submerged under 1-2 mm of distilled water, and picking performed in a dedicated
clean room.
8. For automated picking using an Ettan Spot
Picker, open the imported pick list and align the instrument with the reference markers according to the
manufacturer's instructions. Pick and collect spots in
96-well plates in 200 btl of water, drain, and store at
-20~
prior to MS analysis. Sample preparation
and protein identification by mass spectrometry are
detailed elsewhere.
Comment
Harsh fixatives (e.g., >35% methanol) should not be
used on bonded gels as they cause overshrinkage and
cracking of gels.
References
Berggren, K., Chernokalskaya, E., Steinberg, T. H., Kemper, C.,
Lopez, M. F., Diwu, Z., Haugland, R. P., and Patton, W. F. (2000).
Background-free, high sensitivity staining of proteins in one- and
two-dimensional sodium dodecyl sulfate-polyacrylamide gels
using a luminescent ruthenium complex. Electrophoresis 21(12),
2509-2521.
Gharbi, S., Gaffney, P., Yang, A., Zvelebil, M. J., Cramer, R.,
Waterfield, M. D., and Timms, J. F. (2002). Evaluation of twodimensional differential gel electrophoresis for proteomic
expression analysis of a model breast cancer cell system. Mol. Cell
Proteomics 1(2), 91-98.
Lopez, M. F., Berggren, K., Chernokalskaya, E., Lazarev, A.,
Robinson, M., and Patton, W. F. (2000). A comparison of silver
stain and SYPRO ruby protein gel stain with respect to protein
detection in two-dimensional gels and identification by peptide
mass profiling. Electrophoresis 21(17), 3673-3683.
Neuhoff, V., Arold, N., Taube, D., and Ehrhardt, W. (1988). Improved
staining of proteins in polyacrylamide gels including isoelectric
focusing gels with clear background at nanogram sensitivity
using Coomassie brilliant blue G-250 and R-250. Electrophoresis
9(6), 255-262.
Patton, W. F. (2000). A thousand points of light: The application
of fluorescence detection technologies to two-dimensional gel
electrophoresis and proteomics. Electrophoresis 21(6), 11231144.
Scheler, C., Lamer, S., Pan, Z., Li, X. P., Salnikow, J., and Jungblut, P.
(1998). Peptide mass fingerprint sequence coverage from differently stained proteins on two-dimensional electrophoresis
patterns by matrix assisted laser desorption/ionization-mass
spectrometry (MALDI-MS). Electrophoresis 19(6), 918-927.
Shevchenko, A., Wilm, M., Vorm, O., and Mann, M. (1996). Mass
spectrometric sequencing of proteins silver-stained polyacrylamide gels. Anal. Chem. 68(5), 850-858.
Tonge, R., Shaw, J., Middleton, B., Rowlinson, R., Rayner, S., Young,
J., Pognan, F., Hawkins, E., Currie, I., and Davison, M. (2001).
Validation and development of fluorescence two-dimensional
differential gel electrophoresis proteomics technology. Proteomics
1(3),377-396.
Unlu, M., Morgan, M. E., and Minden, J. S. (1997). Difference gel
electrophoresis: A single gel method for detecting changes in
protein extracts. Electrophoresis 18(11), 2071-2077.
Zhou, G., Li, H., DeCamp, D., Chen, S., Shu, H., Gong, Y., Flaig, M.,
Gillespie, J. W., Hu, N., Taylor, P. R., et al. (2002). 2D differential
in-gel electrophoresis for the identification of esophageal scans
cell cancer-specific protein markers. Mol. Cell Proteomics 1(2),
117-124.