1
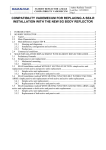
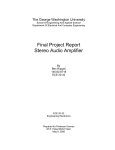
The George Washington University
School of Engineering and Applied Science
Department of Electrical and Computer Engineering
Final Project
Stereo Audio Amplifier
Final Report
Daniel S. Boucher
ECE 20-32, Engineering Electronics
May 8, 2000
Professor Korman
Faisal M. Yasin
Abstract
The objective was to design and build an audio amplifier with 3-bit digital volume
control and a four-stage output LED display. Power for the circuit was obtained from
120 Vrms at 60 Hz. A center-tapped transformer was used to step down the voltage and a
full wave rectifier rectified the circuit. Then capacitors were used to smooth out the
signal and +12Vdc regulators were used to maintain +12Vdc. The design of a common
emitter circuit (CEC) connected to an AB power amp in a common collector (CCC)
configuration was chosen. The design process began with the AB power amp. From that
the maximum current was determined. Then the power amp was built to have a gain of
one and that determined maximum output current. The first amplifier stage, the CEC,
was built to have a gain of twenty since half of the gain would be lost in the transition to
the second stage. This was because the input impedance of the second stage and the
output impedance of the first were equal. This assured maximum power transfer. The
CEC was then DC biased and a potentiometer was used in place of Re to providing slight
modifications to the DC biasing while the amplifier was on. The two stages were
capacitively coupled to keep each circuits DC biased without affecting the small signal.
The volume control was the first small signal stage. It used a summing operational
amplifier to control the initial gain of the small signal. This placement was chosen
because DC biasing was too sensitive and fidelity would be lost if DC biasing was
changed. Also, if the summing op-amp was used at the output, there would be a large
power loss, and the components of the summing op-amp, such as the resistors, would
heat up. The LED display implemented four op-amp comparator circuits per channel.
One voltage ladder was used to give the appropriate reference voltages.
2
One major problem was encountered. It was a hum from the input AC signal. On
the 120Vrms line this was a 60 Hz but because I rectified it, the hum in my circuit was at
120 Hz. To reduce this I placed a large capacitor from +12Vdc to –12Vdc to try to
cancel this ripple. It was reduced by half, but could still be heard. This interfered with
the output at –3db and the music could not be heard at this level.
3
Table of Contents
Section
1.
Page
Abstract
2
2. Specifications
7
3. Theory of Operation
8
4. Circuit Diagrams, Layouts & Wire List
12
5. SPICE Simulation
15
6. Testing Procedures
23
7. Users Manual
24
8. Electrical Parts List
26
9. Conclusions
28
Appendices
Appendix A, Amplifier Calculations
29
Appendix B, Volume Control Calculations and Output
30
Appendix C, Measured Output of Rectifier
31
Appendix D, Measured Output Waveform
34
Appendix E, Measured Frequency Response of the Circuit
37
4
List of Illustrations
Figure and Title
Page
Figure 1 – Small Signal Block Diagram
8
Figure 2 – Fictitious Equivalent Circuit
9
Figure 3 – Rectifier Schematic
12
Figure 4 – Digital Volume Control Schematic
12
Figure 5 – Amplifier Schematic
13
Figure 6 – LED Display Schematic
13
Figure 7 – Complete Circuit Schematic
16
Figure 8 – SPICE Output of Rectifier
18
Figure 9 – SPICE Output Waveform
20
Figure 10 – SPICE Frequency Response
22
Figure 11 – Volume Control Output
30
Figure 12 – Measured +12 Vdc Output of Rectifier
32
Figure 13 – Measured -12 Vdc Output of Rectifier
33
Figure 14 – Measured Input vs. Output Waveform (Left)
35
Figure 15 – Measured Input vs. Output Waveform (Right)
36
Figure 16 – Measured Frequency Response (Left)
38
Figure 17 – Measured Frequency Response (Right)
39
5
List of Tables
Table and Title
Page
Table 1 – Wire List
14
Table 1 – Electrical Parts List
26
6
Specifications
•
The power supply is 120 Vrms at 60 Hz.
•
CD stereo input (two channels: Left and Right) at 250 mV peak output.
•
Stereo output. The standard load is an 8 ohm speaker
•
Volume control per channel:
o Digital: 3-bit dip switch control.
o Minimum gain (000): -3 dB
o Maximum gain (111): 20 dB
o Frequency range: of 300 Hz - 10 kHz (without distortion).
o Maximum variation in gain over the frequency range: +/- 1 dB
•
Four level LED Display per channel at 2V, 1V, 0.5V, and 0.25V
7
Theory of Operation
This project is a two-channel amplifier. While only one channel is discussed
below it should always be assumed that the other channel is identical.
The 120Vrms was converted to DC using a full wave rectifier, capacitors, and
voltage regulators. The full wave rectifier used 4 DIN4002 diodes, 2 on each tap of the
transformer with the center tap as ground. The full wave rectifier was chosen because its
ease of use and it did not require many parts. Once the wave had been rectified, large
capacitors were placed before and after the voltage regulators to smooth out any
distortion. Finally, the +12 and –12 were connected using a 2000uF capacitor to reduce
noise in the system.
The small signal block diagram is shown below.
Figure 1 - Small Signal Block Diagram
The volume control used a 3-bit dipswitch and an op-amp in a summing amplifier
configuration. For the value of 000, -3dB must be heard. This translates into a gain of
0.7 V/V over the entire circuit. Since the circuit was designed to have a gain of 10 V/V,
it can be interpreted that the summing amplifier must have a voltage gain of 0.07 of the
input signal. This was achieved using a resistor, Ro, that is in parallel with the dipswitch
and a resistor, Rf, which acts as a feedback resistor. The feedback resistor was chosen as
8
1.2 kohms. From this the value for Ro could be determined, 15 kohms. Since the range
of this amplifier was from 0.07 to 1.0 in eight equal increments, the values for each level
were determined. Then using the values for 001, 010, and 100, the three resistors could
be obtained. The complete calculations for this can be found in Appendix B.
A CEC amplifier was chosen to amplify the voltage. It has high input impedance.
The output impedance can be set equal to Rc if Re is not capacitively coupled. This was
very useful because the AB power amp was built first. Then the input impedance of the
AB power amp was measured. The output impedance of the CEC (Rc) was set to that
value to ensure maximum power transfer. This results in a loss of one half of the gain.
This is shown below.
Figure 2 - Fictitious Equivalent Circuit
From the fictitious equivalent circuit it can be shown that
Vin(2) = Rin(2)
(Rout(1) + Rin(2))
* Avo(1) * Vin(1)
9
When Rout(1) = Rin(2), Avo(1) it can be shown that Avo(1) will be half. To
compensate for this, the gain that the CEC was designed for was twice the final desired
gain. The specifications required 20dB at the maximum volume level. This translated to
a gain of 10 V/V throughout the entire circuit. This meant that a swing of at least 5 volts
would occur at the collector of the BJT. Since Rc had been previously fixed, the
collector current had to be adjusted to ensure that approximately 6 volts was present at
the collector. This would provide ample room for swing but now Vb had to be
determined to maintain the proper biasing of the collector-base junction such that the
transistor would remain in the forward active region. This value was determined by
performing a voltage divider from Vcc to ground through Rb1 and Rb2. This value had
to be small, but it had to be greater than 0.7 volts to turn on the base-emitter junction.
The specific calculations are shown in Appendix A.
The AB power amp was chosen because it will provide a gain of one and act as a
buffer between the CEC and the small load. The power amp also produces a high current
gain and thus producing audible sound. The specific values were originally obtained
from the midterm project. The values from that were determined from the maximum
power rating of the speaker. In this project, a new speaker was bought and the small
power limitation was not an issue. Therefore the values of Rb could be reduced, thus
producing a greater current, Ic. The resistor values were set a 1k. This caused a serious
amount of heat so the resistor values were raised to 3k. This sounded as loud as it did
with the 1k resistors and things did not heat up as much.
The AB power amp design provided little power consumption when there is not a
signal and that is why it was chosen. This complementary symmetric circuit uses diodes
10
to compensate for the loss of signal under 0.7 volts. With the diodes just turned on, this
distortion is eliminated. This does cause a slight power loss but it is a reasonable
compromise for good quality.
To prevent thermal runaway, a one ohm resistance was used as Re. Three threeohm resistors served as a current divider so the resistors would not exceed their power
rating.
11
Circuit Diagrams, Layouts, and Wire Lists
For clarity, single component schematics are shown below.
Figure 3 - Rectifier Schematic
Figure 4 - Digital Volume Control (Both Channels)
12
Figure 5 - Amplifier Schematic
Figure 6 - LED Display
13
Wire List:
Quantity
10
10
4
Length (cm)
1
1
7
Color
Red
Green
Black
1
1
1
1
1
4
4
8
4
4
4
4
1
3
3
4
Yellow
Orange
Yellow
Orange
Red
Orange
Yellow
Brown
Connect From
12 Vdc
-12 Vdc
Ground of
supply
Volume control
Volume control
CEC
CEC
12 Vdc
Small signal
Small signal
Reference
voltage
Connect To
Pin 7 of op-amp
Pin 4 of op-amp
Ground of all
breadboards
CEC (left)
CEC (right)
Power amp
Power amp
Voltage divider
Pin 2 of op-amp
Pin 2 of op-amp
Pin 3 of op-amp
Table 1 – Wire List
14
SPICE Simulation
The entire schematic is attached as the next page.
15
INSERT BIG SCHEMATIC
16
The output plot for the rectifier is attached as the next page. +12 Vdc was achieved
within approximately 60ms.
17
INSAERT RECTIFIER OUTPUT
18
The output waveform from the simulation is attached as the next page.
19
INSERT OUTPUT WAVEFORM
20
The frequency response of the circuit is attached as the next page.
21
INSERT FREQ RESP
22
Testing Procedures
Requirement: Gain of 20dB (10V/V) over the frequency range of 300 Hz – 10kHz
Test: Using the function generator, apply an input peak sinusoidal voltage of 250 mV at
300 Hz to the input of the circuit. Attach an eight-ohm resistor to the output of the
circuit. Place the leads from the digital oscilloscope over the eight-ohm resistor.
Measure the output voltage vs. the input voltage. Determine the gain. Raise the input
frequency from 300 Hz to 10 kHz in increments of 100 Hz. Determine the gain at each
increment.
Requirement: Four level LED Display per channel at 2V, 1V, 0.5V, and 0.25V
Test: Turn the circuit on. Using the function generator, apply a sinusoidal voltage to the
input of the LED stage. Vary the amplitude of the sinusoidal voltage from 0.0V to 2.5
Volts. The LED’s should turn on according to the reference voltage.
Requirement: 3-bit volume control from –3dB to 20dB
Test: Using the function generator, apply an input peak sinusoidal voltage of 250 mV to
the input of the circuit. Attach an eight-ohm resistor to the output of the circuit. Place
the leads from the digital oscilloscope over the eight-ohm resistor. Set the volume
control to 000. Measure the output voltage vs. the input voltage. Determine the decibels.
Increase the volume control until 111. Measure the decibels at each increment. Results
from this test are plotted in Appendix B.
23
User’s Manual
i)
Operating Instructions
a) Plug the plug into the wall outlet
b) Connect the small signal source to the orange and yellow leads before the
volume control
c) Select an appropriate volume level
ii)
Maintenance
Preventative Maintenance
Place circuit in a dry, well cooled, shock absorbent enclosure. Routinely
check for loose elements.
Troubleshooting
If the circuit experiences a loss in fidelity, first check the rectifier. Make
sure that +12 Vdc are available to the circuit. If not, check the fuses on the
transformer, and the voltage regulators. If the rectifier is functioning
correctly, apply the small signal after the volume control. If the volume
control was the problem test each resistor and replace the op-amps. If the
volume control is not the problem, increase the small signal amplitude to 2.5
volts and apply the small signal at the input of the power amp. One of these
stages should be the problem. Once the stage is identified, check the DC
biasing and replace any parts that do not appear to be functioning correctly.
The BJT’s can be tested using the curve tracer.
24
iii) Safety Precautions
The transistors in the circuit will get hot. The enclosure must be vented and
cooled. The transistors should never come into direct contact with skin. There is a risk
of electrical shock if a bare wire is touched. The capacitors are polarized. If capacitors
are removed for maintenance or troubleshooting ensure that they are replaced properly.
Failure to do so will result in the capacitor exploding which may result in equipment or
bodily harm.
25
Electrical Parts List
Quantity Circuit Reference Designator
Part Name
Part Number
8
1N4002 Rectifier
Newark
Diode
1N4002
470 uF Capacitor
Mouser
2
D1, D2, D3, D4, D5, D6, D7, D8
C1, C2
140-XRL50V470
2
C3, C4
1000 uF Capacitor
1
C5
2000 uF Capacitor
4
C6, C7, C8, C9
0.82 uF Capacitor
1
U1
LM7812C
LM7812C
1
U2
LM7912C
LM7912C
1
SW2
8 Dip Switch
10
U3, U4, U5, U6, U7, U8, U9,
LM741 Op-amp
LM741
2N3904 NPN
Newark
Transistor
2N3904
TIP31A NPN
TIP31A
U10, U11, U12
2
2
Q1, Q4
Q2, Q3
Power Transistor
2
Q5, Q6
TIP32A PNP
TIP32A
Power Transistor
8
D11, D12, D13, D14, D15, D16,
LED MV5753
Mouser 592-
D17, D18
Red
SLR56VR3
26
2
10
R15, R20
R28, R29, R30, R31, R32, R33,
500 ohm
Digi Key
Potentiometer
3352W-1-501
1 k ohm resistor
R34, R35, R36, R37
5
R27, R28, R1, R4
2 k ohm resistor
2
R25
20 k ohm resistor
2
RoL, RoR
15 k ohm resistor
2
RFL, RFR
1.2 k ohm resistor
2
R2, R5
4.7 k ohm resistor
2
R3, R6
14 k ohm resistor
12
R18, R19, R23, R24
1 ohm resistor
4
R16, R17, R21, R22
3 k ohm resistor
2
RCL, RCR
560 ohm resistor
2
RB1L, RB1R
100 k ohm resistor
2
RB2L, RB2R
22 k ohm resistor
Table 2 – Electrical Parts List
27
Conclusions
20 dB is produced at the maximum volume level. Eight unique volume levels are
available and the voltage gain of each is linear and is shown in Appendix B. A linear
decibel plot for the volume control would have been preferred but was not accomplished.
The measured frequency response, Appendix E, exceeds the specifications. This is not
necessarily a good thing because it will contain more noise.
One problem that was encountered was noise from the AC source. Placing large
capacitors from +12 to –12Vdc quieted this some.
High fidelity was accomplished at all volume levels, except for 000 because of the
line noise.
28
Appendix A, Amplifier Calculations
29
Appendix B, Volume Control Calculations and Results
Gain (-V/V)
Volume Control Level
1.2
1
0.8
0.6
0.4
0.2
0
Expected Value
Left Channel
Right Channel
000 001 010 011 100 101 110 111
Binary Level
Figure 11 - Volume Control Output
30
Appendix C, Rectifier Output
The measure output of 12 Vdc and –12 Vdc is attached as the next two pages.
31
INSERT 12 V OUT
32
INSERT –12 OUT
33
Appendix D, Measured Output Waveform
The measured output waveform for both channels is attached as the next two pages.
34
INSERT LEFT CHANNEL OUT
35
INSERT RIGHT CHANNEL OUT
36
Appendix E, Frequency Response
The measured frequency response is plotted for both channels as the next two pages.
37
INSERT FREQ RESP LEFT
38
INSERT FREQ RESP RIGHT
39