1
ATMOSYS User Manual
4.5 Changing the Pollutant
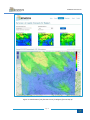
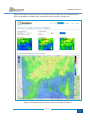
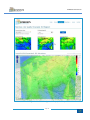
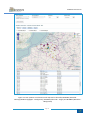
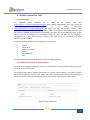
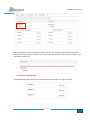
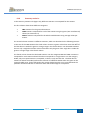
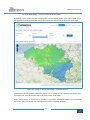
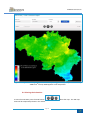
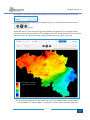
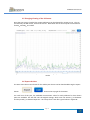
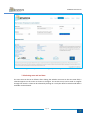
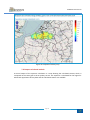
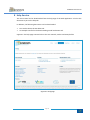
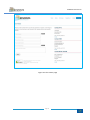
By default, the NO2 daily maximum map for the most recent forecast day available (normally
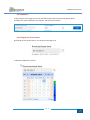
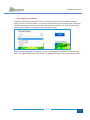
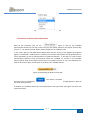
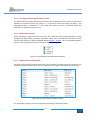
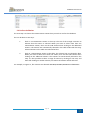
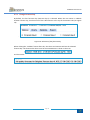
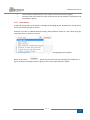
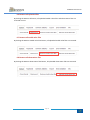
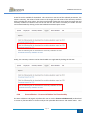
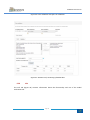
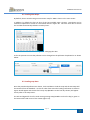
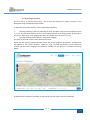
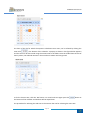
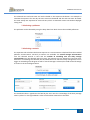
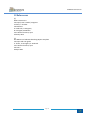
today) is shown in the main viewer. To visualize another pollutant concentration map, click on the
pollutant drop down menu box to view the other pollutants available. For ozone it is possible to
view the 1h maximum or the 8h maximum concentration maps.
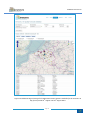
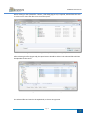
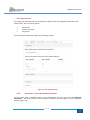
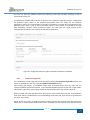
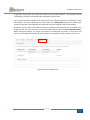
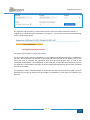
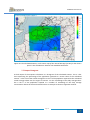
When you have chosen the new pollutant, click on the load button to upload the corresponding
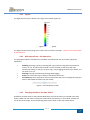
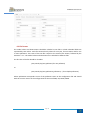
maps. The legend shown in the main viewer will change depending on the pollutant being shown.
Page 17