1
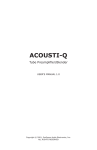
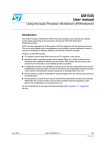
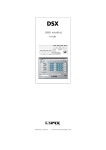
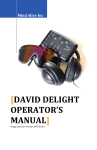
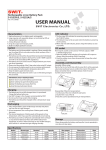
User Manual
Precision measurement of loudspeaker
voltage, current, impedance, and power.
LO RANGE AMPLIFIER INPUT
SPEAKER OUTPUT
HI RANGE AMPLIFIER INPUT
MAXIMUM CURRENT 2.5A RMS
MAXIMUM VOLTAGE 250V RMS
MAXIMUM CURRENT 25A RMS
The VI-Box is a specialized device designed to facilitate the easy and accurate measurement of electrical parameters for loudspeakers and passive
crossover components, under actual constant voltage source (CVS) drive
conditions.
While the commonly used constant current source (CCS) method provides
easy and quick impedance measurement, it sacrifices the quality and accuracy of the data. Loudspeakers are normally operated in a constant voltage
source (CVS) mode, by direct connection to a power amplifier.
Voltage & Current Measurement
LO RANGE SPEAKER V-I
HI RANGE SPEAKER V-I
[ I ] Current
[V] Voltage
[V] Voltage
XLR-M
XLR-M
XLR-M
1
2
3
1
2
[ I ] Current
XLR-M
1
2
3
1
2
3
3
ZOUT=2x100Ω
ZOUT=2x100Ω
ZOUT=2x100Ω
ZOUT=2x100Ω
1V/1A (0dB)
1V/1V (0dB)
1V/100V (-40dB)
1V/100A (-40dB)
Device Description
VI EQUIVALENT SCHEMATIC
The VI-Box provides all of the components, circuitry, and interface connectors necessary
CURRENT VOLTAGE
to produce CVS measurements. The only other required elements are a power amplifier
OUTPUT
OUTPUT
RED
RED
1 2
2 1
VOLTAGE
and an analyzer, or suitable volt meter. The VI-Box is placed in series between the ampli3
3
AMP
SPKR
DIVIDER
fier and the load to be measured. Three dual binding posts are provided for connection to
BLK
BLK
the amplifier and speaker load, as well as two pair of XLR signal line outputs for the load
SHUNT
current (I) and load voltage (V). To allow measurement over a very wide range of power
levels, two ranges are provided for the voltage and current sensitivities. Essentially, the
ranges provide 0dB or -40dB output levels from the XLRs. Accurate measurements can
be made at almost any power level from 10mW to 2500W by proper range selection. The VI-Box is built entirely with 1% precision low TC
components and features 4-wire Kelvin shunts, a precision voltage divider, and balanced output line impedance. The user selects the
range by connecting the amplifier to either the LO-RANGE or HI-RANGE amplifier binding posts. The V-I signals are then taken from the
matching pair of XLR connectors.
Typical Connection and Setup
The figure below shows the typical VI-Box application circuit. If a single channel analyzer or volt meter is used, then two sweeps or
measurements will be required, while alternating the measurement connection from the current to voltage XLR outputs. For most purposes
the relative polarity of the speaker connections to the Red/Blk terminals of the VI-Box is not important for the electrical data, but will be
important if absolute SPL phase is also to be measured.
The power amplifier should NOT be a bridged type output, but rather a normal single-ended ground referenced output. Almost any analyzer or meter can be used, however the analyzer input(s) should be balanced or floating for maximum accuracy. The connections to the
power amplifier must be connected Blk-Blk and Red-Red. This is very important if highly accurate measurements of current are to be
produced, by minimizing the common mode voltage at the internal current shunt. The cable impedance to the amplifier is not important, but
the cable impedance to the speaker will appear as part of the load. For this reason it may be desirable to locate the VI-Box near the
speaker to reduce that cable length.
Power Range Selection
The maximum current allowed in the low range is 2.5 Amps. In the high range the maximum current is 25 Amps. As a general rule of
thumb, use the low range for any measurements at 10 Watts or below. For measurements at higher power levels above 10 Watts, the high
(25A) range must be used. Connect the amplifier and V-I XLRs as appropriate for the range in use.
POWER
AMP
RED
RED
BLK
BLK
Warning! Exceeding the current limit of 2.5A in the low
range will cause the current shunt to burn out! Please
make sure to use the high power (25A) range for higher
power measurements.
SPKR
LO RANGE AMPLIFIER INPUT
SPEAKER OUTPUT
HI RANGE AMPLIFIER INPUT
MAXIMUM CURRENT 2.5A RMS
MAXIMUM VOLTAGE 250V RMS
MAXIMUM CURRENT 25A RMS
Voltage & Current Measurement
LO RANGE SPEAKER V-I
[ I ] Current
HI RANGE SPEAKER V-I
[V] Voltage
XLR-M
1
[V] Voltage
XLR-M
2
2
3
[ I ] Current
XLR-M
1
3
1
XLR-M
2
3
1
2
3
ZOUT=2x100Ω
ZOUT=2x100Ω
ZOUT=2x100Ω
ZOUT=2x100Ω
1V/1A (0dB)
1V/1V (0dB)
1V/100V (-40dB)
1V/100A (-40dB)
I
V
ANALYZER
LO RANGE CONNECTIONS
VI-Box User Manual
In the low range, the output signal voltage from the (V)
and (I) current sense XLRs will be 1:1 proportional to the
speaker's voltage and current (0dB gain). This means
that if 1 Amp flows through the load, 1 Volt is produced at
the (I) XLR output. In the high range, a 1:100 ratio is
produced (-40dB gain), meaning that 100 Amps flowing
through the load will yield 1 Volt at the XLR output, and
100Volts across the speaker will produce 1 Volt from the
(V) XLR output. It should be noted that a 10k resistance
will appear in parallel with the load. This is insignificant
for typical low impedance speaker load applications.
RED
RED
BLK
BLK
SPKR
LO RANGE AMPLIFIER INPUT
SPEAKER OUTPUT
HI RANGE AMPLIFIER INPUT
MAXIMUM CURRENT 2.5A RMS
MAXIMUM VOLTAGE 250V RMS
MAXIMUM CURRENT 25A RMS
POWER
AMP
Voltage & Current Measurement
LO RANGE SPEAKER V-I
[ I ] Current
HI RANGE SPEAKER V-I
[V] Voltage
XLR-M
1
[V] Voltage
XLR-M
2
3
1
[ I ] Current
XLR-M
2
1
XLR-M
2
3
3
1
2
3
ZOUT=2x100Ω
ZOUT=2x100Ω
ZOUT=2x100Ω
ZOUT=2x100Ω
1V/1A (0dB)
1V/1V (0dB)
1V/100V (-40dB)
1V/100A (-40dB)
V
I
ANALYZER
HI RANGE CONNECTIONS
Page 1
Loudspeaker Impedance Measurement
In this example a 15" speaker was used, mounted in a very small box, with a very small port. This example was chosen to illustrate some of
the more dramatic differences between CVS and CCS impedance measurements. In the following examples an LMS analyzer is used. This
analyzer is single channel, so two sweeps are required to obtain both the voltage and current data, each time changing the XLR line input
from the (V) output to the (I) output of the VI-Box.
We first begin by connecting the VI-Box between the power amp and speaker. These tests were conducted at a nominal 1W level, meaning
2.83V into an 8 Ohm load. The OSC level was adjusted to produce that voltage from the (V) output. Both of the low ranges in the VI-Box
were used for voltage and current.
The LMS analyzer was set to measure Volts from the line input, and the
first voltage (V) sweep was taken. This is shown here on the right. The
curve is a somewhat bumpy or wavy flat line. This is very typical, and
reflects the voltage division ratio produced from the speaker load, and the
1 Ohm current shunt in the VI-Box. This curve represents the actual voltage across the speaker terminals with respect to frequency.
Voltage (V) Curve
Next, we change the LMS line input to the (I) XLR output, and take another
sweep. Of course, this time placing the data curve into a different entry.
The data type is kept on Volts. The (I) curve is shown on the right below.
The (I) curve represents the actual current flowing through the speaker terminals with respect to frequency. It is very much like the shape of an impedance curve, but inverted.
Now we have the two curves necessary to produce the impedance curve.
Using the processing features in LMS, the (V) curve entry is divided by the
(I) curve entry. However, the units of the resulting curve are now Ratio or
dimensionless. We can change these to Ohms using the Left Vert data
drop down list box in the Curve Library dialog. The resulting impedance
curve is shown here on the right below.
Current (I) Curve
The impedance curve has a typical electrodynamic shape, with inductive
rise being shown at high frequencies, and two resonance peaks in the
300Hz region. However, note that below 50Hz the Z curve tends to flatten
out to approximately 10 Ohms, without reaching another peak.
As a comparison, the direct LMS impedance measurement mode was used
to measure the speaker likewise. This method is essentially constant current source (CCS), using a 10mA drive level. It should be noted that a drive
level of 10mA through an 8 Ohm load corresponds to a power level of
0.0008 Watts ( P= I2 x R ). This is less than 1mW, and is 1000 times lower
than the previous drive level used with the VI-Box at a mere 1W level.
The graph below on the right shows the two impedance curves, as measured under CVS conditions using the VI-Box (solid line), and using the
CCS method (dashed line).
Impedance Curve
Z= V/I
At mid and high frequencies the two impedance curves are nearly identical,
showing very little difference between them. However, below 60Hz there is
a dramatic difference between the two curves.
The CCS measurement shows another resonance hump at 14Hz, while the
CVS measurement shows basically a flat line. Why the difference?
The loudspeaker used in this example had an extremely small port, relative
to the piston size of the speaker. This causes a dramatic velocity increase
for the air moving in the port, relative to the velocity of the cone. The
acoustic resistance of the port is very large and is also very nonlinear.
Changing the drive level from 1mW to 1W causes the port to completely
saturate, becoming almost entirely resistive and damps out the resonance.
CCS
CVS
Impedance measured by
CVS and CCS methods
This is an extreme example, but clearly illustrates the need to measure a
loudspeaker under the same drive conditions and levels as will occur during normal operation. It is not at all uncommon to see a significant difference between CCS and CVS measurements. In this example the
impedance data taken using the simple CCS method would be grossly inaccurate at low frequencies, relative to the normal operation of the
speaker.
The measurement of small speakers often has similar results. Due to their small size, the speakers are operating well into their nonlinear
region even at low drive levels. Using the VI-Box, CVS data is easily obtained and is the most accurate representation of the speaker's
electrical characteristics under realistic operating conditions.
Page 2
VI-Box User Manual
Multi-Level Impedance Measurement
In this more typical example a high power 15" speaker was mounted in a 3.8
Ft3 enclosure, with a 4" diameter port. V/I data was taken at four power levels: 0.1W, 1W, 10W and 100W. For the 100W level, both of the VI-Box high
range selections for V & I were used.
0.1W
Note: Since both of the Lo/Hi ranges for voltage and current use the same
attenuation (0dB or -40dB), then dividing the curves cancels the attenuation and no scaling is ever necessary of the resulting Z data.
100W
Multi-Level
Impedance Curves
The graph on the right shows the resulting impedance curves at four different power levels. Several points of interest can be noted:
(1) At the lower resonance hump near 12Hz, there are significant changes
that occur at each power level. Even between the 0.1W and 1W levels, changes still occur in the impedance. At 100W the resonance
hump is dramatically reduced due to saturation of the air in the port.
(2) In the lower impedance areas, 30Hz and 200Hz, where the impedance is dominated by the resistance of the voice coil, a significant rise in
the valleys is observed for the 100W curve. This is due to heating of the voice coil. The 100W sweep causes the copper in the voice coil to
heat, resulting in an increase in the resistance of the coil. This results in a substantial increase in the Revc value. If you wish to obtain high
power data without such a dramatic increase in the Revc value, a low duty cycle sweep can be made using a gated sweep mode.
(3) It is also interesting to note that at high frequency the speaker's impedance varies with drive level as well. This is not due to temperature
rise, but due to increased iron loss in the magnetic circuit. Here the impedance above 1kHz increases about 25% from 0.1W to 100W.
Power Amplifier Requirements
As previously mentioned, the amplifier should not be a bridged type output, but rather a normal single ended output (Blk terminal is GND).
For impedance measurement purposes, the actual frequency response of the amplifier is relatively unimportant. Since the same amplifier
transfer function exists in both the voltage and current measurements, the end result of dividing these curves to obtain impedance also cancels out the transfer function of the amplifier. This is another benefit of the CVS measurement method.
Analyzer or Voltmeter Requirements
For manual measurements, a simple oscillator and voltmeter can be used to obtain useful data. However, do not assume that the frequency
response of your voltmeter or DVM/DMM is infinite. Many of the low-cost DMM's have very poor frequency response, and are actually only
designed to measure AC voltage at power line frequencies (50/60Hz). If you are using a DMM, it is highly advisable to check and know the
frequency response of the meter prior to use. Most DMM's with RMS detectors have adequate flat response over the audio frequency range.
As for more sophisticated analyzers, one or two balanced (differential) inputs are required. Unbalanced inputs cannot be used to take reliable
measurements from the VI-Box, and are not recommended. Either sinewave, FFT, or noise type analyzers can be used depending on your
final data requirements. Any analyzer input with CMR of 40dB or higher is adequate, and the input impedance should be at least 20k Ohms.
Additional Applications
The VI-Box is an extremely useful device which facilitates a wide variety of different kinds of measurements, for many different applications.
The ability to measure the current through the load, and the voltage across the load, produces many different measurements including: complex impedance, complex power, current/voltage distortion, temperature rise, temperature coefficients, and loaded network transfer functions.
The following is a brief description of some of the additional applications:
■ Simultaneous Measurement of SPL and Z
Since the speaker is driven under normal voltage source conditions, it is possible to measure the acoustic SPL output at the same time as
acquiring the V/I data for impedance without the need of setup changes. This is an attractive choice for QC testing where time is a key factor.
■ Measurement of Crossover Components
The behavior and impedance characteristics of passive components can also be determined. Both components and entire networks can be
measured while under actual load and drive conditions for impedance, distortion, and transfer function.
■ Determination of Speaker Parameters at any Power Level
The impedance curves produced at any drive level can be used to determine the speaker parameters at that drive level. CVS data is far less
sensitive to noise, allows for faster sweep times, and more accurately represents the nonlinear operation of the speaker for characterization.
■ Measuring Electrical THD and/or Rub & Buzz Noise
The current sense output can be used to measure the reflected acoustical artifacts such as distortion or rub & buzz noise. The measurement
of low frequency distortion and cone noise can often be made electrically using the current waveform, without the need of a microphone.
■ Determination of Temperature Coefficient, Temperature rise, and Power Handling Limits.
Knowing the actual current and voltage, allows for accurate calculation of the power dissipation in the load. Moreover, the change in resistance of the load can also be used to determine the temperature rise. This data can then be used to fully characterize the temperature
related parameters of the loudspeaker.
VI-Box User Manual
Page 3
V I -B o x
T e c h n i c a l
I n f o r m a t i o n
Constant Voltage vs. Constant Current Measurements
The measurement of loudspeaker impedance has traditionally been accomplished through the use of constant current source (CCS) techniques. This method supplies a constant drive current (typically 10mA) to the speaker, and produces a variable voltage across the speaker
which is proportional to the speaker’s impedance. While this method is convenient to use, it has the following well known problems:
(a) Extremely nonlinear drive level across frequency.
(b) No resonance damping provided by the current source.
(c) Setup and connections must be changed to measure SPL.
(d) Measurements taken at extremely low fixed power level (typically 1mW).
The operating conditions imposed by the CCS method are in reality the exact opposite of normal operation. In normal operation a loudspeaker is driven directly from a power amplifier at virtually zero source impedance. The drive method is by constant voltage source (CVS).
In CVS operation the speaker is driven with a linear voltage vs. frequency characteristic, with virtually zero source impedance, and at a much
higher power level.
In order to determine impedance using the CVS method, a current shunt is employed to measure the current flow through the device. Knowing the current flow through the device, and the voltage across the device, the true impedance can then be calculated using basic Ohm’s law
as Z=V/I, and the true power determined as P=V*I.
All loudspeakers, to varying degrees, are nonlinear resonant devices. Measuring the impedance for these devices presents the following
difficulties:
(a) When a resonant electroacoustic device is driven from a current source of high impedance, all damping of the resonance behavior is
determined solely by the mechanical (Qms) losses in the device. Under these conditions dynamically measured impedance can be greatly
effected by the type of stimulus and/or the rate at which a sine wave is swept. Under CVS conditions, the damping is determined largely by
the electrical system (Qes), and offers dramatically higher damping than the CCS method. This results in substantially greater precision and
consistency for dynamic measurements.
(b) The nonlinear characteristics of electroacoustic devices imply that all measurements be taken under identical conditions as to which the
device will operate. For CCS methods, measuring the device at a drive level of 1mW is 1000 times lower than the power level employed
when commonly measuring SPL response at 1W. Moreover, the voltage produced from the CCS method follows the impedance curve itself,
and changes radically near the resonance frequency. This can exaggerate and intensify nonlinear effects in the magnetic and compliance
systems of the device. Using the CVS method produces measurements based on device operation identical to normal operation. The measurement level can be 1W, or at any other desired power. The nonlinear effects of the device are measured accurately under identical drive
conditions to, and are representative of, normal operation.
Determination of electrical and mechanical loudspeaker parameters is commonly performed from measured impedance data. The quality and
accuracy of the parameters produced is therefore a direct function of the quality and accuracy of the original impedance data. In order for the
parameters to accurately represent the device under normal operating conditions, the impedance data must also accurately represent the
same characteristics. The CVS method should always be used where accurate, repeatable, and high precision parameters are required.
Electrical Specifications
■ Maximum Load Voltage: 100 Volts.
■ Maximum Load Current: 25 Amps.
■ Shunt Resistors: 1.0Ω and 10mΩ, 1%, 7W.
■ Load Bridging: 10kΩ in -40dB range.
■ Signal Output Impedance: 100Ω x 2.
■ Selectable V/I Ranges: 0dB, -40dB.
Mechanical Specifications
■ Weight: 2 lbs.
■ Width: 3.5 Inches.
■ Height: 2.55 Inches.
■ Length: 5.625 Inches.
■ Output Signal Connectors: XLR-Male 3-Pin.
■ Amp/Spkr Connectors: 5-Way Binding Posts.
LinearX Systems Inc.
9500 SW Tualatin-Sherwood Rd.
Tualatin, OR 97062-8586 USA
TEL:(503) 612-9565
Page 4
FAX:(503) 612-9344
Web: www.linearx.com
©2003 LinearX Systems Inc. All rights reserved.
VI-Box User Manual