1
Copyright ©2009-2015 Moonlit Software Ltd, All rights reserved
User Manual
v4.2.1
1
Copyright ©2009-2015 Moonlit Software Ltd, All rights reserved
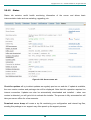
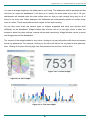
1 Introduction
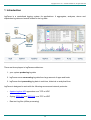
logFaces is a centralized logging system for applications. It aggregates, analyzes, stores and
dispatches log data and events related to the log data.
There are three players in logFaces architecture:
1. your system producing log data
2. logFaces server consuming log data from large amount of apps and hosts
3. logFaces client presenting log data in real-time, historical or analytical form.
logFaces is designed to work with the following sources and network protocols:
•
Apache log4xxx API appenders over TCP or UDP
•
Syslog RFC5424 and RFC3164 over TCP or UDP
•
Raw text log files (offline processing)
2
Copyright ©2009-2015 Moonlit Software Ltd, All rights reserved
2 Getting started with logFaces Server
This section will guide you through the quick process of installation and configuration. Java
Runtime Environment (JRE) 1.6 or later must be installed before proceeding with installation on any
operating system. logFaces Server will start after the installation with default settings and trial license
for 10 days evaluation.
2.1 Installing and Uninstalling
On Windows, download and run the installer which will walk you through the process. During
installation you will be asked to register and/or run logFaces as Windows service. Linux and Solaris
distributions come as tar.gz archives, just unzip the archive and you're ready to go. Uninstalling
logFaces server is as simple as running the uninstall file located in installation directory. Zipped
distributions don't require anything, just remove the entire directory.
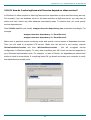
2.2 Using silent installer options
Running installer exe with -h flag will display list of options you can use. Amongst them is -q option
for running in unattended mode. It is also possible to use a response file from previous installation
and re-use it, response files located in .install4j directory and named 'response.varfile'. For example,
to run installation silently you can do “lfs.windows.win32.x86.exe -q -varfile response.varfile”. This
will silently install the server using all options specified in response file.
2.3 Running logFaces Server on Windows
If you selected to run logFaces as Windows service, the service named LFS will be registered on
your computer automatically and will run every time you start your computer. Use conventional
service commands to start/stop the service by doing so in command prompt - "net start lfs" or "net
stop lfs"
You can also run the server as a console application by using /bin/lfs.bat.
2.4 Running logFaces Server on Linux/Solaris
•
In order to start the server in the terminal execute command ./bin/lfs console
•
In order to start the server as daemon execute command ./bin/lfs start
•
In order to stop the server process execute command ./bin/lfs stop
•
In order to check the server process status execute command ./bin/lfs status
3
Copyright ©2009-2015 Moonlit Software Ltd, All rights reserved
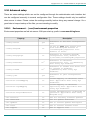
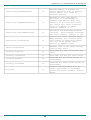
2.5 Server directory tree
Once installed and ran for the first time, the server will explode its default configuration and you will
find several new folders under installation directory. The table below is a brief summary of folders
and their purpose. Normally you won't need all the technical details, but it's a good idea to familiarize
yourself with some internals, some of the files and directories are referred to throughout this manual.
Path
Updated with version increments
/.install4j
yes
/bin
Description
Visible only on Windows, created by installers.
binaries only
Binaries for bootstrapping the server, content is OS
dependent
/admin
yes
Admin web application and resources
/conf
no
Server configuration files
/db
no
Relevant only for embedded database, contains actual
embedded database storage files
/doc
yes
Holds release notes and other documents
/legal
no
Holds end user license agreements
/lib
yes
Binary distribution libraries and dependencies
/log
no
Holds server internal logs
/overflow
no
Contains overflow files when server overloads
/dropzone
no
Location for manual log data imports
/temp
no
Temporally files, cleared on each server restart
Note that folders which are created and updated by the server (those which are not part of version
updates), can be located elsewhere and not necessarily under installation directory. We call these
folders artifacts and sometimes it's a good idea to keep them separately, for example for the backup
purposes or switching from one setup to another. By default all artifacts reside under installation
directory, this is the argument for running the server, and you can change it in /bin/lfs.conf like this:
wrapper.app.parameter.1=HOME
HOME can be an empty folder; when you run the server for the first time, it will create all default
artifacts automatically. Alternatively, you can move other artifacts into HOME or point the above
parameter to another location with different artifacts in there - this is what we often do during tests.
Once again, all this is not required, in most cases the default directory structure is good for nearly all
circumstances.
4
Copyright ©2009-2015 Moonlit Software Ltd, All rights reserved
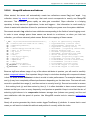
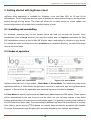
2.6 Integrating log4j-like applications
To work with logFaces, your application needs to be configured by adding several elements to its
logging configuration file. Provided that your system is based on log4xxx API, you should be having
log4xxx configuration file/s, which usually come as property or XML files.
To allow communication with logFaces Server we add an appender to your logging setup. Sections
below will show how to setup such appenders in various situations and using different logging
frameworks.
As of this writing we provide our own appenders for log4j and logback frameworks while .Net, PHP
and C++ can be freely obtained from Apache downloads and don't require any change to work with
logFaces.
Log4j (versions 1 and 2) as well as logback Java appenders can be obtained from our downloads,
place lfappenders-xxx.jar under your application classpath. Source code is included in the jar, it's
free for everyone to use.
5
Copyright ©2009-2015 Moonlit Software Ltd, All rights reserved
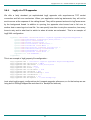
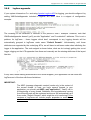
2.6.1
log4j v1.x TCP appender
We offer a fairly standard yet sophisticated log4j appender with asynchronous TCP socket
connection and fail over mechanism. When your application emits log statements, they will not be
sent to server at the expense of the calling thread. They will be queued and sent to logFaces server
by the background thread. In addition to queuing, the appender also knows how to fail over to
another host or save logs to a local file. You can specify how often to retry the connection, how many
times to retry and to what host to switch to when all retries are exhausted. This is an example of
log4j XML configuration:
<appender name="LFS" class="com.moonlit.logfaces.appenders.AsyncSocketAppender">
<param name="remoteHost" value="host1,host2,host3" />
<param name="port" value="55200" />
<param name="format" value="json" />
<param name="locationInfo" value="true" />
<param name="threshold" value="ALL" />
<param name="application" value="My application" />
<param name="reconnectionDelay" value="5000" />
<param name="offerTimeout" value="0" />
<param name="queueSize" value="100" />
<appender-ref ref="CONSOLE" />
</appender>
This is an example of log4j property file configuration :
log4j.appender.LFS = com.moonlit.logfaces.appenders.AsyncSocketAppender
log4j.appender.LFS.application = APP-1
log4j.appender.LFS.remoteHost = host1,host2,host3
log4j.appender.LFS.port = 55200
log4j.appender.LFS.format = json
log4j.appender.LFS.locationInfo = true
log4j.appender.LFS.threshold = ALL
log4j.appender.LFS.reconnectionDelay = 5000
log4j.appender.LFS.offerTimeout = 0
log4j.appender.LFS.queueSize = 100
log4j.appender.LFS.backupFile = “c:/lfs-backup.log”
(note what log4j property configurations don't support appender references, so for the backup we are
using built-in RollingFileAppender and direct it to 'backupFile' attribute)
6
Copyright ©2009-2015 Moonlit Software Ltd, All rights reserved
Table 2.1: log4j and log4j2 appenders properties
Property
Description
Default Mandatory
application
Identifies application under this name. All logs coming through this
appender will be stamped with this name, which can later be used on
client.
-
no
remoteHost
Comma separated list of logFaces servers. If more than one host
specified, the appender will automatically fail over to the next host
when current host becomes unavailable. Switching hosts is done in
the loop. If only one host specified, the retries will be done
indefinitely with this host.
-
yes
port
Port where logFaces server will accept the connection from this
appender.
55200
no
format
Defines data serialization format to use with this server, available
options are 'xml' and 'json'. When xml option is specifies, the
appender will produce events in log4j 1.x dtd compliant xml format.
When json options is specified, the appender will produce events in
logFaces proprietary JSON format
xml
no
protocol (v2.x only)
Defines which protocol to use with server, this property only
applicable to lo4j 2.x versions. Allowed values are 'tcp' or 'udp'.
tcp
no
locationInfo
Specifies whether to include location data, such as class name,
method name and line numbers.
false
no
Rate of reconnection retries in milliseconds.
5000
no
reconnectionDelay
nofRetries
How many times to retry before dropping current host and switching
to the next one. If only one host specified in remoteHost attribute, the
retries will go indefinitely to the same host.
3
no
queueSize
Size of the event queue. The larger the size, the less likely the data
will get lost when connection is lost, because events will be retransmitted to the server when connection recovers. However, queue
size affects JVM heap memory, so be considerate.
500
no
offerTimeout
How long to wait (in ms) while offering event to the appender queue.
When server is slower than application and queue gets full, the caller
has an option to wait before giving up. Queue can typically get full
when server is down or when server can't consume log data in the
rate of this appender. WARNING: Use with care as it will slow
down the calling thread when queue fills up.
0
no
appender-ref (v1.x)
backup (v2.x)
Reference to an appender to use when logFaces server is not
reachable on any host. This is a backup delegate appender. When
specified and server is unreachable with full queue, every log event
will be delegated to the referenced appender. When not specified,
the events will be discarded. Used only with XML based
configuration.
-
no
backupFile
Used only with log4j 1.x properties based configurations for setting
up a backup file. When server becomes unreachable, the logs will be
sent to this file. Its XML layout will let you easily import the data in
server later.
7
no
Copyright ©2009-2015 Moonlit Software Ltd, All rights reserved
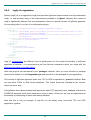
2.6.2
log4j v1.x UDP appender
Should your choice of transport be a UDP, there is a fairly simple appender you can use. Keep in
mind that UDP is unreliable protocol and it's not recommended with high latency networks and busy
logging apps. Having mentioned that, there is one undeniable benefit for using UDP – it's extremely
cheap with resources. Below are examples of configurations:
XML style:
<appender name="LFSU" class="com.moonlit.logfaces.appenders.LFUDPAppender">
<param name="application" value="MyApp" />
<param name="remoteHost" value="localhost" />
<param name="port" value="55201" />
<param name="format" value="json" />
<param name="locationInfo" value="true" />
</appender>
Or properties style:
log4j.appender.LFSU = com.moonlit.logfaces.appenders.LFUDPAppender
log4j.appender.LFSU.application = MyApp
log4j.appender.LFSU.remoteHost = localhost
log4j.appender.LFSU.port = 55201
log4j.appender.LFSU.format = json
log4j.appender.LFSU.locationInfo = true
8
Copyright ©2009-2015 Moonlit Software Ltd, All rights reserved
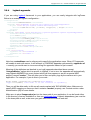
2.6.3
log4j v2.x appenders
Apache Log4j v2 is an upgrade to Log4j that provides significant improvements over its predecessor
Log4j 1.x, and provides many of the improvements available in Logback. Because this version of
log4j is significantly different from its predecessors, there is a special version of logFaces appender
to come along with it in a form of a configuration plug-in.
<Configuration packages="com.moonlit.logfaces.appenders.log4j2">
<Appenders>
<logFaces name="LFST" application="app1" protocol="tcp" remoteHost="10.0.0.110"
format="json" backup="STDOUT"/>
<logFaces name="LFSU" application="app1" protocol="udp” remoteHost="10.0.0.111"
format="xml"/>
<Console name="STDOUT" target="SYSTEM_OUT">
PatternLayout pattern="%m%n"/>
</Console>
</Appenders>
<Loggers>
<Root level="trace">
<AppenderRef ref="LFST"/>
<!-<AppenderRef ref="LFSU"/>
–-/>
</Root>
</Loggers>
</Configuration>
log4j v2 configurations are different from its predecessor but the actual functionality of logFaces
appender is identical - it is asynchronous and has fail-over mechanism which you setup with the
attributes described in the table above.
Note how plug-ins are referenced by the 'packages' attribute. Here you must include our package
name which resides is in the lfsappenders.jar and should be in the classpath of your application.
This version of logFaces appender works over TCP or UDP as specified by “protocol” attribute. Both
can use either JSON or XML format serializers. This format should be matched by the receiver
format on server side.
Configuration above demonstrates both appenders while TCP appender has a “backup” reference to
CONSOLE appender which gets called when server is down. In fact you can use any appenders for
the backup by referencing its name with backup attribute.
Note that this is only an example, in real life you will hardly every need both TCP and UDP
appenders together.
9
Copyright ©2009-2015 Moonlit Software Ltd, All rights reserved
The appender will automatically delegate markers as MDC property named "marker". For example, if
you do this in your code :
Marker ADMIN = MarkerManager.getMarker("SYS-ADMIN");
logger.trace(ADMIN, "this event is for the attention of sysadmin");
then you will be able to fetch events marked with 'SYS-ADMIN' property. Make sure to specify MDC
mapping on server side so that it contains "marker" property, this is done in server administration
Context page.
10
Copyright ©2009-2015 Moonlit Software Ltd, All rights reserved
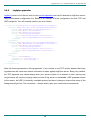
2.6.4
logback appender
If you are using logback framework in your applications, you can easily integrate with logFaces.
Below is an example logback configuration :
<configuration>
<contextName>MYAPPLICATION</contextName>
<appender name="CONSOLE" class="ch.qos.logback.core.ConsoleAppender">
<layout class="ch.qos.logback.classic.PatternLayout">
<Pattern>%d{HH:mm:ss.SSS} [%-5level] %logger{36} | %msg%n</Pattern>
</layout>
</appender>
<appender name="LFS" class="com.moonlit.logfaces.appenders.logback.LogfacesAppender">
<remoteHost>host1,host2</remoteHost>
<port>55200</port>
<locationInfo>true</locationInfo>
<application>${CONTEXT_NAME}</application>
<reconnectionDelay>1000</reconnectionDelay>
<offerTimeout>0</offerTimeout>
<queueSize>200</queueSize>
<appender-ref ref="CONSOLE" />
<delegateMarker>true</delegateMarker>
</appender>
<root level="trace">
<appender-ref ref="CONSOLE" />
<appender-ref ref="LFS" />
</root>
</configuration>
Note how contextName can be referenced to specify the application name. When LFS appender
will unable to work with server, it will fall back to CONSOLE appender referenced by appender-ref
– normally you would want to use some rolling file appender instead of just console.
Meaning of the attributes are identical to our log4j appender described above except
"delegateMarker" option which is specific to logback. If set to true, the appender will automatically
copy logback MARKER into event context which will then appear on server as special MDC
property named "marker". This will allow you to filter and query logs by the markers set in your
application. For example, if you do this in your code :
Marker ADMIN = MarkerFactory.getMarker("SYS-ADMIN");
logger.trace(ADMIN, "this event is for the attention of sysadmin");
Then you will be able easily to fish our all events marked with 'SYS-ADMIN' token. Make sure to
specify MDC mapping on server so that it contains "marker" property, see Context section under
Administration [40] for more details.
Make sure to place lfsappenders.jar into the class path of your application, it can be found either
in /lib directory of server installation or from our download page. Logback dependency jars must be
in the class path as well, make sure you grab them from the authors web site.
11
Copyright ©2009-2015 Moonlit Software Ltd, All rights reserved
2.6.5
log4php appender
log4php comes out of the box with its own socket appender and can be directed to logFaces server,
using conventional configuration file. Below is an example of such configuration for both TCP and
UDP transports. You will normally need to use one of them:
<configuration xmlns="http://logging.apache.org/log4php/">
<appender name="lfs-tcp" class="LoggerAppenderSocket">
<param name="remoteHost" value="localhost" />
<param name="port" value="55200" />
<param name="timeout" value="2" />
<layout class="LoggerLayoutXml">
<param name="locationInfo" value="true" />
<param name="log4jNamespace" value="true" />
</layout>
</appender>
<appender name="lfs-udp" class="LoggerAppenderSocket">
<param name="remoteHost" value="udp://localhost" />
<param name="port" value="55201" />
<layout class="LoggerLayoutXml">
<param name="locationInfo" value="true" />
<param name="log4jNamespace" value="true" />
</layout>
</appender>
<root>
<level value="TRACE" />
<appender_ref ref="lfs-tcp" />
<appender_ref ref="lfs-udp" />
</root>
</configuration>
Note the timeout parameter in lfs-tcp appender, if you choose to use TCP version beware that every
log statement will cause new socket connection to open against logFaces server. Being very reliable,
the TCP appender may cause delays when your server is down or its network is slow. Having very
long timeouts will cause your page visitors to wait if log server is unavailable. UDP appender comes
to the rescue, but UDP is inherently unreliable protocol so there is always a chance that some of the
datagrams will get lost. The conclusion – choose wisely upon your needs and circumstances.
12
Copyright ©2009-2015 Moonlit Software Ltd, All rights reserved
Below is an example of what normally happens in PHP code. Note how we use MDC 'application'
property to let logFaces server know which application the logs are coming from:
<?php
// 1. use the path where you unpacked log4php
include('/development/testphp/php/Logger.php');
// 2. point to configuration file which must include logFaces appenders
Logger::configure('/development/testphp/log4php.xml');
// 3. fetch a logger, any name is OK, best to use names which will
// be easy to use in logFaces hierarchy like this
// logFaces will split it into package-like notation for easier traceability
$log = Logger::getLogger('com.mycompany.myproject.mypage');
// 4. specify application (domain) name, this is optional.
// it will allow logFaces server to associate logs with 'application' token
// if not specified, the logFaces will use the host name of the originating logs
LoggerMDC::put("application", "my-product");
// 5. typical logging stuff...
$log->trace("this is a trace message");
$log->debug("this is an info message");
$log->info("this is an info message");
$log->warn("this is a warning message");
$log->error("this is an error message");
$log->fatal("this is a fatal message");
?>
13
Copyright ©2009-2015 Moonlit Software Ltd, All rights reserved
2.6.6
log4net appender
If your system is .Net based and using Apache log4net API for logging, you can use its out of the box
UdpAppender :
<log4net>
<appender name="logFaces" type="log4net.Appender.UdpAppender">
<param name="RemoteAddress" value="10.0.0.110" />
<param name="RemotePort" value="55201" />
<param name="Encoding" value="UTF-8" />
<layout type="log4net.Layout.XmlLayoutSchemaLog4j, log4net">
<locationInfo value="true" />
</layout>
</appender>
<root>
<level value="ALL" />
<appender-ref ref="logFaces" />
</root>
</log4net>
As mentioned earlier, logFaces can listen for TCP and/or UDP. In this example, we use UDP
appender - make sure that RemotePort attribute in this example corresponds to the one configured in
logFaces.
2.6.7
NLog appender
If your system is .Net based and using NLog logging platform, you can use either TCP or UDP or
even both of them depending on your needs. Here is the configuration sample :
<?xml version="1.0" encoding="utf-8" ?>
<nlog xmlns="http://www.nlog-project.org/schemas/NLog.xsd"
xmlns:xsi="http://www.w3.org/2001/XMLSchema-instance">
<targets>
<target name="console" xsi:type="Console" />
<target name="logfile" xsi:type="File" fileName="file.txt" />
<target name="lfs-tcp" xsi:type="Network" address="tcp://localhost:55200" />
layout="${log4jxmlevent:includeMdc=true:appInfo=MYAPP}"
<target name="lfs-udp" xsi:type="Network" address="udp://localhost:55201" />
layout="${log4jxmlevent:includeMdc=true:appInfo=MYAPP}"
</targets>
<rules>
<logger name="com.package1.*" minlevel="Error" writeTo="lfs-tcp" />
<logger name="com.package2.*" minlevel="Trace" writeTo="lfs-udp" />
</rules>
</nlog>
Note how we use 'appInfo' attribute to identify your application name, and 'includeMDC' to make
sure mapped diagnostic context is transmitted to the server (optional).
14
Copyright ©2009-2015 Moonlit Software Ltd, All rights reserved
2.6.8
log4cxx appender
If your system is based on C++ and using Apache Log4cxx API for logging, you should configure it by
adding XMLSocketAppender included in log4cxx API itself. Here is a snippet of configuration
example:
The meaning of the attributes is identical to the previous Java example. However, note that
XMLSocketAppender doesn't (yet?) provide "Application" and "LocationInfo" attributes. This is not a
problem for logFaces – those loggers which don't correspond to any logging domain will be
automatically grouped in logFaces under name "Default Domain". Unfortunately, until those
attributes are supported by the underlying API's, we will have to add some code when initializing the
logger in the application. The code snippet is shown below, what we do is simply getting into a root
logger, digging out the LFS appender from there and manually set the missing attributes of the layout
like this:
In any case, those missing attributes are not a show stoppers, your application can still work with
logFaces out of the box with those limitations.
IMPORTANT:
The MDC (message diagnostic context) works only in the context of
the current thread. In case you have several threads in your
application you should add MDC::put("application", "xxx") call in
the beginning of every thread. Otherwise, the log statements coming
from those threads will be orphaned and server will automatically put
them under "Default Domain" which might be a bit confusing.Future
versions of logFaces will include proper appender to avoid those
workarounds.
15
Copyright ©2009-2015 Moonlit Software Ltd, All rights reserved
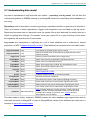
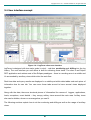
2.7 Understanding data model
Log data is represented in logFaces with two entities – repository and log event. You will also find
corresponding tables in RDBMS schema or as MongoDB collections, depending which database you
are using.
Repository holds a description of entire log storage, meta-data would be a good term to describe it.
These are names of hosts, applications, loggers and exceptions ever recorded by the log server.
Repository becomes more or less static once the system fills up with data and it's mostly used as a
helper for getting lists of things. For example, when you need to fill in a query involving a host name,
the repository will provide a list of host names.
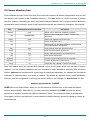
Log events are represented in logFaces as a set of fixed attributes and a collection of named
properties, or MDC (mapped diagnostic context). Fixed attributes are summarized in the table below:
loggerTimeStamp
Long
Time stamp as specified by the source or server
sequenceNumber
Long
Sequence number, each event produced by logFaces has running
sequence number
Integer
Severity of event expressed in term of log4j levels
domainName
String
Name of the domain (or application) originating the event
hostName
String
Name of the host originating the event
loggerName
String
Name of the logger (class, module, etc) originating the event
threadName
String
Name of the thread originating the event
message
String
Message content
ndc
String
Network diagnostic context
Boolean
Indication whether the event is a thrown exception
throwableInfo
String
Stack trace of thrown exceptions
locFileName
String
File name (of the source code location originating the event)
locClassName
String
Class name (of the source code location originating the event)
locMethodName
String
Method name (of the source code location originating the event)
locLineNumber
String
Line number (of the source code location originating the event)
Map<String,String>
MDC (mapped diagnostic context) properties. There could be an
arbitrary number of named properties but they must be specified
manually when setting up the server. See 'Context' section in
administration for more details.
loggerLevel
thrown
properties
This data model is further realized in RDBMS schema for each database type supported as well as
main data collection in MongoDB. In case of MongoDB the names of the attributes are reduced to a
minimum to save the storage space.
16
Copyright ©2009-2015 Moonlit Software Ltd, All rights reserved
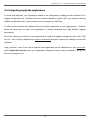
2.8 Working with regular expressions
Regular expressions are used quite extensively in logFaces. You will meet them to process things
like unstructured syslog content or parse log files in arbitrary text format.
Using regular expressions effectively requires some practice and could be frustrating in the
beginning. Working with complex expressions to crunch large amounts of unstructured text may
easily become a daunting task if not applied systematically. So here we come with a solution to make
your life easier even if you are a beginner with regular expressions.
The idea was originally borrowed from logstash project (all the credits go to this community!) and
adopted for our needs with some insignificant polish.
logFaces server is shipped with regular expression patterns library – a text file you will find under
/conf directory on your server. This library initially contains some commonly used expressions and
you can extend and modify them as you go.
Patterns library can be shared amongst clients – they have a built-in capability for parsing log files,
see 'Viewing raw log files' section for more details.
Consider some simple pattern examples:
WORD
HOUR
MINUTE
SECOND
TIME
\b\w+\b
(?:2[0123]|[01]?[0-9])
(?:[0-5][0-9])
(?:(?:[0-5][0-9]|60)(?:[:.,][0-9]+)?)
(?!<[0-9])%{HOUR}:%{MINUTE}(?::%{SECOND})(?![0-9])
Each line in the library contains exactly one pattern which has a name (left part) and the expression
(right part). Name and expression must be separated by space character.
Note how any expression can reference other patterns by name using %{xxx} notation. Before the
expression is used, server will unfold all the references to produce plain standard regular expression.
In practice this could be very large piece of text, quite often non-readable by humans.
Using this technique makes it very easy to prepare fairly complex expressions to parse unstructured
log data in almost any format.
17
Copyright ©2009-2015 Moonlit Software Ltd, All rights reserved
And now is the key part – using named groups to extract text phrases. All modern regular
expression engines support capturing groups, which are numbered from left to right. This feature is
hidden in the format we use. Consider an expression like this.
%(WORD:hostName) %(WORD:loggerName)
Note how WORD pattern is used along with hostName and loggerName which are fixed attributes
in logFaces, or so called named groups in regex language. The example above will take a two word
sentence and extract first word into hostName variable, and the second word into loggerName
variable.
Here is a real world example, the expression below will parse Apache access log and extract the
data into logFaces attributes (it should be one line!):
APACHELOG %{IPORHOST:peer} %{USER} %{USER} \[%{HTTPDATE:loggerTimeStamp}\] "(?:%
{WORD:verb} %{NOTSPACE:request}(?: HTTP/%{NUMBER:httpversion})?|%{DATA:rawrequest})" %
{NUMBER:response} (?:%{NUMBER:bytes}|-) %{QS:referrer} %{QS:agent}
Note that attributes named 'peer', 'verb', 'request', 'httpversion', 'rawrequest', 'response', 'bytes',
'referrer', 'agent' are not part of the logFaces schema but they still can be extracted and used. This is
when MDC (mapped diagnostic context) comes into play.
MDC allows you to extend the fixed attributes with more attributes and be able to index them. So, if
you map the above attributes as MDC in your server context, you will be able to use those attributes
in tracing, lockups and other logFaces features. MDC management is described in server
administration Context section.
18
Copyright ©2009-2015 Moonlit Software Ltd, All rights reserved
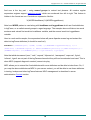
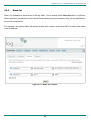
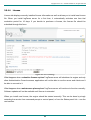
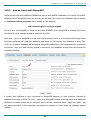
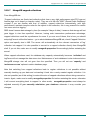
2.9 Server administration
logFaces server is administered through a web interface which you will find for the first time at:
http://your-host:8050
It would also be a good idea to bookmark this URL in your browser – you will visit these pages quite
often during initial setup and acquaintance with the product.
Normally logFaces servers are shared amongst many users within organization, this is why the
access to its administration is restricted to someone with special credentials. The user name and
password will be required to get in:
By default, the user name and password are stored on server disk in obfuscated form. Default user
name and password are both 'admin' after installation. Do make sure to change them eventually.
Instead of local authentication it is also possible to delegate user name and passwords to your own
LDAP directory and let it verify the credentials on behalf of logFaces.
By default the server gets accessed over plain HTTP. But it is possible to switch server entirely to be
used over SSL.
19
Copyright ©2009-2015 Moonlit Software Ltd, All rights reserved
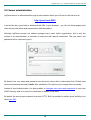
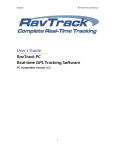
2.9.1
Front end connectivity
Figure 2.9.1: Front end connectivity
Address
Port
Secure
Admin user
Admin password
If server is installed on a computer with several network cards, you can bind server sockets to a
particular address or a host name. This is a good idea if you need physical separation of the
transport. When 'any-address' is specified, the server will pick the default binding, this will allow
access to server by any address it supports. Otherwise, the access will be strictly by the address
you select.
Listening port number (default is 8050)
Access to this server can be secured over SSL. Please read this section before enabling.
User name for accessing administration
Password for administrator access. Stored in obfuscated form on local disk unless used with
LDAP.
In local mode, the authentication of admin users will be performed against locally stored
credentials. This is the default authentication mode.
Admin
authentication
mode
In ldap mode, the authentication of admin user will be delegated to your LDAP server. Make
sure to specify the admin user name, this is what will be sent to your LDAP. The password is not
required.
20
Copyright ©2009-2015 Moonlit Software Ltd, All rights reserved
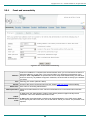
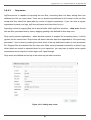
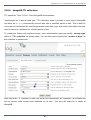
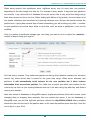
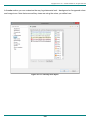
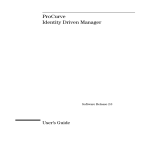
2.9.2
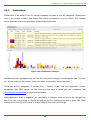
Receivers
Figure 2.9.2: Receivers
Receivers are receiving log data from outside world into logFaces server. There are three types of
receivers available:
1. Log4j receivers - XML over TCP or UDP. These types of receivers will work with anything
based on Apache Logging Framework – log4j, log4net, log4php, logback, etc.
2. Syslog RFC5424 and RFC3164 over TCP or UDP
3. Drop zones – offline processing of raw text
It is possible to have as many instances of the same receiver type provided that there is no clash of
resources. Using the links on the right it is possible to pause, resume, modify, remove and test each
individual receiver. Testing is very convenient because it verifies how the receiver will work in real life
under conditions you specify. Icons on the left indicate the state of the receiver – active or not active.
21
Copyright ©2009-2015 Moonlit Software Ltd, All rights reserved
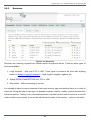
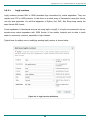
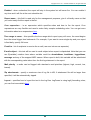
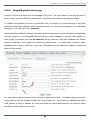
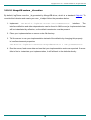
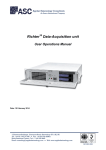
2.9.2.1
Log4j receivers
Log4j receivers process XML or JSON formatted logs transmitted by socket appenders. They can
operate over TCP or UDP protocols. In fact there is a whole array of frameworks using this format,
not only Java appenders. You will find appenders in Python, Perl, PHP, .Net, NLog using exactly the
same format XML format.
If your application is Java based and you are using log4j or log4j2, it is highly recommend to use our
asynchronous socket appenders with JSON format, it has smaller footprint and its data is much
easier to process by receivers, especially in high volumes.
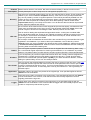
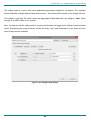
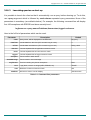
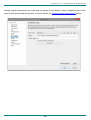
Typical form for adding new or modifying existing log4j receiver is shown below:
Figure 2.9.3: log4j receiver definitions
22
Copyright ©2009-2015 Moonlit Software Ltd, All rights reserved
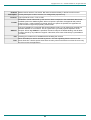
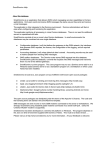
Enabled
Description
Protocol
Makes receiver active or non-active. Not active receivers will stay in the list but will not work.
Friendly description or title of receiver, for management purposes only
Type of protocol to use – TCP or UDP
Format
Serialization format understood by this receiver. Must correspond to the transmitted data format.
Available options are 'xml' and 'json'. When xml option is specifies, the appender will produce
events in log4j 1.x dtd compliant xml format. When json options is specified, the appender will
produce events in logFaces proprietary JSON format.
Address
If server is installed on a computer with several network cards, you can bind server sockets to a
particular address or a host name. This is a good idea if you need physical separation of the
transport. When 'any-address' is specified, the server will pick the default binding, this will allow
access to server by any address it supports. Otherwise, the access will be strictly by the address
you select.
Port
Time
Listening port, make sure it's available before enabling the receiver
Which time stamp to use for received log events – the one originating from the source, or the
server local time. Use this option when there are many sources and there is no time server to unify
the times across the applications.
23
Copyright ©2009-2015 Moonlit Software Ltd, All rights reserved
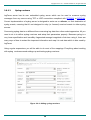
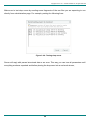
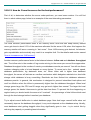
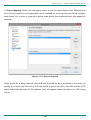
2.9.2.2
Syslog receivers
logFaces server has its own embedded syslog server which can be used to consume syslog
messages from any source using TCP or UDP connections compliant with RFC5424 or RFC3164.
Current implementation of syslog server is designed to works as a collector, or final destination of
syslog events, meaning that it's not designed to relay (or forward) received events to other syslog
servers.
Consuming syslog data is no different from consuming log data from other socket appenders. All you
need to do is to define syslog receivers and setup their parameters properly. Because syslog is a
very loose specification and incredibly fragmented amongst magnitude of devices using it, there are
many ways of how to extract the important information and map it to real data which is later used by
logFaces.
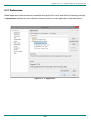
Using regular expressions you will be able to do most of the mappings. Everything about working
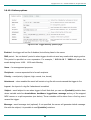
with syslog revolves around settings up and testing syslog receivers:
Figure 2.9.4: Adding syslog receivers
24
Copyright ©2009-2015 Moonlit Software Ltd, All rights reserved
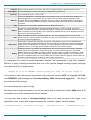
Enabled
Description
Makes receiver active or non-active. Not active receivers will stay in the list but will not work.
Friendly description or title of receiver, for management purposes only
Protocol
Type of protocol to use – TCP or UDP
Address
If server is installed on a computer with several network cards, you can bind server sockets to a
particular address or a host name. This is a good idea if you need physical separation of the
transport. When 'any-address' is specified, the server will pick the default binding, this will allow
access to server by any address it supports. Otherwise, the access will be strictly by the address
you select.
Port
Pattern
Listening port, make sure it's available before enabling the receiver
Provide your own interpretation of syslog message structure by setting a regular expression
pattern. Use patterns library to build and test patterns. If pattern is not specified, logFaces will try its
best to structure the incoming data. This is not always possible and very much depends on the log
data source. See examples below.
Time
Which time stamp to use for received log events – the one originating from the source, or the
server local time. Use this option when there are many sources and there is no time server to unify
the times across the applications.
Application
Leave blank if name of the application is properly transmitted by syslog source. Otherwise this
name will be used as default substitute. If none specified and can't be resolved from the message,
logFaces will use 'appliances' as a default. It is a good practice to always have some meaningful
application name – it will help clients to display structure of logs and do queries.
Debug
Enable this option if you want to see what exactly your sources transmit over the wire. logFaces
server will log incoming traffic in its internal log file. This option should help you to pick a best
pattern and structure the data for indexing. When something gets recorded into internal log, simply
pick up the raw text and use pattern debugger for creating matching patterns. Or use 'test' link to
inject the message directly into receiver. Make sure to enable verbose logging to see the traces. Do
not leave verbose logging for production use for better performance.
To understand the usage of regular expression patterns, lets demonstrate a real world example.
Below is a syslog message transmitted from one of the popular bridges sending a syslog message
from Windows Event Log subsystem:
<29>Aug 24 10:57:06 SERVER-1 Security-Auditing: 4624: An account logged on
If no pattern is used, the receiver will produce a log event with severity INFO, time Aug 24 10:57:06,
host SERVER-1 and message text “Security-Auditing: 4624: An account logged on”. The rest of
the attributes will be ignored.
In some situation this is good enough.
But things can be improved greatly if you tell the parser how to extract the number 4624 which is ID
of windows event in this example and can be indexed.
You may also want to have a “Security-Auditing” token to be used as name of the logger or an
application name, or any other mapped property. So, consider a pattern like this instead:
%{HOSTNAME:hostName} %{NOTSPACE:loggerName}\: %{NOTSPACE:eventID}\: %{GREEDYDATA:message}
25
Copyright ©2009-2015 Moonlit Software Ltd, All rights reserved
Note how this regular expression is based on predefined patterns wrapped into %{xxx} tokens and
doesn't seem to resemble what we used to call regular expression. In fact it is a valid regular
expression, it's just that it's written in a very concise and structured form. Make sure to familiarize
yourself with regular expression patterns before trying to understand this format. It's very simple and
powerful way for dealing with really massive and complex regular expressions which may span
pages of text.
Applying this pattern will produce an event object with two additional pieces of information we
couldn't get before. It's the loggerName matching to “Security-Auditing” substring in this example.
Logger name is a logFaces attribute, so it can be indexed, used in queries, displayed in separate
columns, filtered by, etc.
Also there is an eventID which is not part of logFaces attributes but is MDC (mapped diagnostic
context) which you can freely use for extending the fixed set of attributes used by logFaces. In this
example, the parser will extract “4624” and set a property named eventID before sending the event
through the process chain. When you map this property name as an MDC context, you will be able to
index those properties, query their values, and so on.
The message body in this example is also altered to “An account logged on” since we extracted the
other pieces from it.
Finally, make sure to test your receivers by clicking on
icon on the receivers list. Paste some
actual syslog formatted message and send it to server, the response will be a JSON-like structure
representing the logFaces event. Keep tuning receiver options until test result is just right.
26
Copyright ©2009-2015 Moonlit Software Ltd, All rights reserved
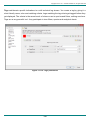
2.9.2.3
Drop zones
logFaces server is capable of importing raw text files, converting them into data, storing them into
database and let you query them. There are no special requirements for the format of the raw files
except that they should be parse-able by means of regular expressions. If you can write a regular
expression to parse your logs, logFaces will parse and index them for you.
Importing is done by copying files into a special folder which logFaces monitors – drop zone. Arrived
files are then processed one by one by applying parsing rules defined for this drop zone.
Drop zones prevent duplications - when identical content is dropped for processing twice, it will be
ignored for the second time. Drop zones will detect that new data was appended to a file previously
processed – this is done by tracking the check sums of the top and bottom parts of each processed
file. Dropped files are deleted from the drop zone folder once processed successfully or failed. Logs
which failed are stored in separate folder for your inspection, you may want to adjust some regular
expressions and re-drop the content again until it gets through.
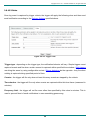
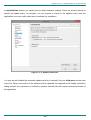
Drop zones are defined and set up in the same way as other receivers:
Figure 2.9.5: Adding drop zones
27
Copyright ©2009-2015 Moonlit Software Ltd, All rights reserved
Enabled
Description
Directory
Makes receiver active or non-active. Not active receivers will stay in the list but will not work.
Friendly description or title of drop zone, for management purposes only
Drop zone is a monitored location where you can drop raw text files for import. Those locations are
relative to your server installation /dropzone directory. Files can be in any format provided that
they can be parsed by means of regular expressions. Files will be permanently deleted from this
location as soon as server attempts to process them. When a file gets processed partially, the
server will create a special file containing lines which failed parsing. It will be located under
/unprocessed directory in this drop zone location. You will then be able to examine unprocessed
entries, adjust the patterns and re-drop.
Server will look at the head and tail of each dropped file (first and last bytes), calculate their CRC
check sums and keeps the track of every record. This parameter defines the length of the head
and tail in bytes to be used for calculating the CRC. Must be positive non-zero value.
CRC size
CRC is used for dealing with duplicated and appended content. Looking into a head/tail CRC
server will decide whether the content is new, partially processed or already processed in the past.
For example, if several lines were added to the file since its last import, server will detect and
import only those lines which were added
Server keeps small local database where all CRC's are recorded. Every processed file CRC's gets
registered in this database. If you want to clean up this database, remove directory named
/dzcache under your server installation. By default the size of this database is 10000 and specified
in /conf/environment.properties file. When this size is reached the database will start rotating by
removing older records while inserting new.
Pattern
X Pattern
This is a regular expression pattern to match the text in dropped files and extract log data. It may
be a conventional regular expression for matching event attributes, or a combination of pre built
patterns. Use patterns library to build and test complex regular expressions. See examples below.
If you are expecting to process exception stack traces which are normally multi-line fragments of
formatted text, consider specifying this pattern to extract the structure. Typical Java-like stack
traces can be matched with pre-built pattern %{JEX}. If your stack traces look different, consider
adding it to pattern library and re-use. See example below.
Time format
Here you specify the expected date time format of the logs to process in this drop zone. Look here
for supported formats. logFaces will use this format to covert parsed text into numeric epoch time
(number of milliseconds past since 1970). If no time format specified, the server will import all the
logs with current server time, incrementing each event by one millisecond – this is generally not
advisable option.
Application
Application name to be used if not present in the original logs. If not specified logFaces will use
'default' word as a substitute.
Host
Logger
Host name to be used if not present in the original logs. If not specified logFaces will use 'default'
word as a substitute. In this context, under the host name we normally expect the host that
originally produced the log event.
Logger name to be used if not present in the original logs. If not specified logFaces will use
'default' word as a substitute. In this context under the logger name we normally expect a class,
module or component produced the log event.
28
Copyright ©2009-2015 Moonlit Software Ltd, All rights reserved
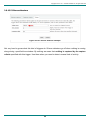
Make sure to test drop zones by sending some fragments of the raw files you are expecting to use
directly from administration page. For example, pasting the following lines:
Figure 2.9.6: Testing drop zones
Server will reply with parsed structured data or an error. This way you can tune all parameters until
everything works as expected and before placing the drop zone into a real work stream,
29
Copyright ©2009-2015 Moonlit Software Ltd, All rights reserved
2.9.3
Black list
Often it is desirable to block some of the log traffic. This is exactly what black list does in logFaces.
When specified, the black list criteria will discard matching log events before they get any attention by
the server components.
For example, the criteria below will discard events with severity level below INFO or when host name
is an IP address.
Figure 2.9.7: Black list example
30
Copyright ©2009-2015 Moonlit Software Ltd, All rights reserved
2.9.4
Pairing
Pairing is a mechanism for providing single access point to the data when several logFaces nodes
are deployed as a single system. Multiple nodes are used for two purposes: a) for splitting the inflow
when working with large amount of applications and b) for providing fail over. In either case, you
deploy several nodes which do actual data processing against the apps (back end) and another
node for user access only (front end). This way, the users don't have to know which node to connect
to in order to receive the logs, they always connect to a single front end node which is paired with
back end nodes by specifying their connection end points – host, port and SSL option. Note that this
configuration assumes that all nodes, back and front, are sharing the same database.
The example below demonstrates how this node (host-1) being the front end is paired with 3 back
end nodes at host-2, host-3 and host-4. The front end will be accessed by end users and whatever
they request will be served by the relevant node from the back end or any combination of them. So,
the end users never aware of the back end nodes existence, the front end delegates everything to its
pairs.
Figure 2.9.8: Pairing example
31
Copyright ©2009-2015 Moonlit Software Ltd, All rights reserved
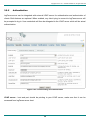
2.9.5
Authentication
logFaces server can be integrated with external LDAP server for authentication and authorization of
clients. Both features are optional. When enabled, any client trying to connect to logFaces server will
be prompted to log-in. User credentials will then be delegated to the LDAP server which will do actual
authentication.
Figure 2.9.9: LDAP binding for authentication
LDAP server - host and port should be pointing to your LDAP server, make sure that it can be
accessed from logFaces server host.
32
Copyright ©2009-2015 Moonlit Software Ltd, All rights reserved
Encryption – use it if your LDAP server works over SSL. If your LDAP server is using well known
root CA, the communication should work straight away. Otherwise you will want to introduce the trust
store with that certificate into logFaces JVM so that it can trust your LDAP server. One of the ways of
doing this is by setting the following properties in /conf/environment.properties file:
# ssl client related
com.moonlit.logfaces.security.trustStore = path-to-your-key-store
com.moonlit.logfaces.security.trustPass = password-to-your-key-store
This will instruct logFaces JVM to use this particular store with that password for getting the
certificate.
Bind DN - distinguished name for binding to the LDAP server, logFaces will use this DN in order to
gain an access to user base. Usually those credentials are obtained from LDAP server administrator
and must have permissions for walking user base tree.
Bind DN Password - corresponding password for the binding user.
User base DN - distinguished name corresponding to the location of users to be authenticated.
User filter - LDAP filter for matching users in user base DN. This parameter gives a very
sophisticated way to match users in the user base. The default value attr={0} will match any user
whose user ID is mapped to the attribute named 'attr'. This attribute name varies in different LDAP
implementations, for example in Apache DS this is normally 'uid' while in MS Active Directory it show
as sAMAccountName. Note the {0} parameter – it must be present all the time to match the actual
user ID supplied by the user. When you want to do more complex matching of users, you can specify
fairly complex LDAP filters in this field – please refer to LDAP documentation for the syntax details.
Here is an example, the filter below will only match users from SALES organization unit
(&(ou=SALES)(uid={0}))
So, even when user is part of user base (uid={0}), it will only be attempted for authentication when
she belongs to SALES unit. This way, having fairly large user base DN you filter out only relevant
users for accessing logFaces.
Group base DN - location of user groups sub-tree. Groups will be used for authorization, if you don't
need authorization - leave this field with default value.
33
Copyright ©2009-2015 Moonlit Software Ltd, All rights reserved
Group filter - LDAP filter for matching user membership in groups, which is equivalent to granting
authorities to users. When user logs in, its membership in user groups will be looked upon in “Group
Base DN” and when found, this user will be granted authorities (as per group). And using this group
filter you define how this matching should work, it is very similar to user filter except that it acts on
user groups. The default value is again attr{0} which will match group members mapped to the
attribute named attr. Usually this attribute is named 'member' in most LDAP implementations.
Below is an example of filter which will gran authorities matching the group description (USA) and
user ID matching the one provided by actual user during login.
(&(description=USA)(member={0}))
If you don't need this flexibility, just leave group filter to its default member={0}.
34
Copyright ©2009-2015 Moonlit Software Ltd, All rights reserved
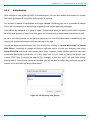
2.9.6
Authorization
After settings up and enabling LDAP for authentication, you can also enable authorization to control
how users get exposed to log data. Authorization is optional.
The process is based on application and logger names. Combining the two it is possible to assign
some users a permission to access logs originating from certain apps and packages.
Permissions are assigned to a group of users. It means that once you specify which data is allowed
for which user groups, all users from that group are automatically granted these permissions as well.
It's up to you which groups you are going to authorize, but once the authorization is enabled only the
groups with granted permissions will have access to the logs.
Groups are imported automatically from your directory by clicking on “Import All Groups” or “Import
With Filters”. Importing all groups will instruct logFaces server to walk your directory tree under
Group Base DN and list all user groups found there. However, some directory services may have
constraints preventing enumeration of a very large lists. In such case try listing the groups with
custom LDAP filter to narrow the search. For example, a filter like cn=D* will only fetch names
starting with D. Once group names are fetched, you will be able to select only particular groups of
interest to be used with logFaces authorization:
Figure 2.9.10: Importing user groups
35
Copyright ©2009-2015 Moonlit Software Ltd, All rights reserved
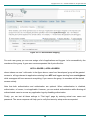
Figure 2.9.11: Authorization mapping
For each user group you can now assign a list of applications and loggers to be accessible by the
members of the group. It goes as a comma separated list of pairs like this:
APP1:LOGGER1, APP2:LOGGER2
where tokens can use * wild cards. In the figure above, users from 'developers' group will be granted
access to all logs relevant to applications starting from APP and loggers starting from com.logfaces
while managers will have access to everything. If you remove the group, its members will be denied
access entirely.
Note that both authentication and authorization are optional. When authentication is disabled,
authorization, of course, is not applicable. However, you can enable authentication while allowing all
authenticated users to access any application logs by disabling authorization.
Finally, you can test all these settings in “Test login” page by entering actual user name and
password. The server response will help you to verify that security setup works as expected.
36
Copyright ©2009-2015 Moonlit Software Ltd, All rights reserved
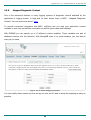
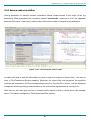
2.9.7
Database
In Database section we specify how logFaces server should work with your database. Settings
below are applicable to all types of databases. In case of MongoDB there are additional settings
which described in details here.
Figure 2.9.12: Database settings
Retention is specified in days of log. If you specify "1 week" for example, then latest week of data
will always be available. As time goes, older records are automatically removed while new ones are
appended. You should carefully specify this value according to your needs; it affects overall
performance as well as disk space usage.
Manage schema option specifies whether server should enforce database schema or it should be
managed externally. Default option is 'Auto' – server will create schema based on the templates
provided in its configuration.
Batch commit size is the size of the buffer used to insert log statements into database as a batch.
The smaller the buffer the more frequently commits will be performed. Depending on the data inflow
intensity, the buffer should be adjusted in such way that it does less frequent commits. On the other
37
Copyright ©2009-2015 Moonlit Software Ltd, All rights reserved
hand, large commit buffer size could be stressful for the database. Optimal sizes are usually in range
of 50 - 500. You should use higher number if your system has frequent spikes of log data, this will
greatly improve the performance of server overall. Half full commit buffers will be committed with a
timer job running every minute.
Number of commit failures specifies how many commits can fail in a row to trigger recovery
mechanism. This mechanism is designed specifically for situations when database goes down for
maintenance or temporally unavailable for some other reasons.
Recovery attempts rate specifies how frequently to try reconnection with database during recovery.
Number of reconnection attempts specifies how many times to try before giving up on database
and switching to a router mode. In the screen shot above, the recovery will run for 30 minutes trying
to reconnect every minute. If during this time database comes back, everything will continue as
normal. Note that during recovery process, incoming log statements are persisted on local disk and
flushed into database when it comes back. When database is unavailable for a long time while
application log keeps coming, there could be quite large amount of those backed up records.
Maintenance schedule is an optional cron expression which will trigger database maintenance job.
Depending on the database the task is different. In case of embedded database, its storage will be
compacted and indexes rebuilt, other RDBMS will have their indexes rebuild. In case of MongoDB no
action is taken.
38
Copyright ©2009-2015 Moonlit Software Ltd, All rights reserved
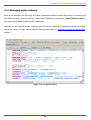
Commit criteria lets you specify which events server should persist into the database. Criteria is a
simple collection of Boolean rules which you can manipulate to achieve a fine tuned filtering.
Figure 2.9.13: Commit criteria
The example above will insure that everything except LFS application is persisted, however if LFS
application emits some warnings or more severe events, they will be persisted still.
39
Copyright ©2009-2015 Moonlit Software Ltd, All rights reserved
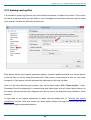
2.9.8
Mapped Diagnostic Context
One of the advanced features in many logging systems is diagnostic context attached by the
application to logging events. In log4j and its other flavors there is MDC – Mapped Diagnostic
Context. You can read more about it here.
To provide convenient integration with MDC, logFaces lets you map your application context
variables in such way so that they could later be used in queries and other displays.
With RDBMS you can specify up to 10 different context variables. Those variables are part of
database schema thus the limitation. With MongoDB there is no such limitation, you can add as
many as you need.
Figure 2.9.14: MDC mapping example
You can modify those names any time during run time, but it's best to setup the mapping as early as
possible.
40
Copyright ©2009-2015 Moonlit Software Ltd, All rights reserved
2.9.9
Custom severity levels
Often there is a need to use custom severity levels in addition (or even instead of) default levels
provided by log4j. If this is your case, there is a way to specify custom levels in logFaces server :
Figure 2.9.15: Custom severity levels
Note how STATS and ATTN levels are defined – these are custom levels in addition to defaults.
Once you add custom levels, they become available throughout the system – in filters, reports,
triggers, etc. Those levels will also appear on client side so that users can utilize them in queries and
displays.
41
Copyright ©2009-2015 Moonlit Software Ltd, All rights reserved
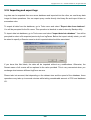
2.9.10
Hosts mapping
All log events are stamped with the origin host name (or IP address). Usually it's done by appenders
but it really depends on the setup and usage pattern. For example, if you are using TCP java
appenders, you application will try to obtain the host name from the computer it runs on, which may
result in something you may or may not like to see. Sometimes it is just convenient to replace certain
host names or addresses with something more meaningful in your environment.
Using hosts mapping you will be able to achieve just that – specify the original names and their
substitutes. When log events received, the server will try to replace their origin accordingly. The
content of hosts mapping follows the format of standard properties file.
Figure 2.9.16: Hosts mapping
42
Copyright ©2009-2015 Moonlit Software Ltd, All rights reserved
2.9.11
SMTP settings
Email settings will allow logFaces server to send e-mails when required by reports and triggers.
Here you define outgoing SMTP properties and also can verify that these settings are correct by
sending test email to some recipient.
Figure 2.9.17: SMTP settings
Click on "Test outgoing email" link to verify that logFaces can send e-mails successfully. Should
anything go wrong, you will be shown an error describing the cause. If everything was correct, you
will receive an acknowledging email.
43
Copyright ©2009-2015 Moonlit Software Ltd, All rights reserved
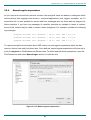
2.9.12
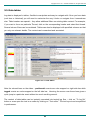
Reports
Reports are custom log files that server periodically generates according to the schedule and criteria
query. Reports are then emailed to the recipients of your choice. Reports are organized in a list
where you can see the overall information. Reports can be enabled or disabled – the rightmost icon
indicates that second report is disabled in the example below. Disabled report stays in the system but
doesn't actually do anything until you enable it.
Figure 2.9.18: List of reports
The list also shows the cron expression which drives the report schedule, its closest fire time and
links to manage each report individually.
Note that reports can also be individually tested (click on
icon), - this is quite useful because it lets
you receive real data instantly without waiting for the complex cron expression to trigger the report.
Each report comes with a bunch of parameters explained below as well as its criteria query. The
query will be executed when report trigger fires. The results of the query will be then packaged into a
log file, zipped if necessary and sent over to your recipients.
44
Copyright ©2009-2015 Moonlit Software Ltd, All rights reserved
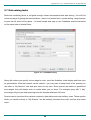
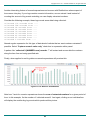
The example below illustrates a typical report – it will fire every midnight and if there is anything in
the query, it will send an email to our support. It covers past 24 hours and flags high email priority.
Look at the query it does – we want WARN+ events coming from com.moonlit.logfaces package.
Figure 2.9.19: Report delivery options
Figure 2.9.20: Report query
45
Copyright ©2009-2015 Moonlit Software Ltd, All rights reserved
Enabled - when unchecked, the report will stay in the system but will never fire. You can enable it
any time and it will fire at the next schedule slot.
Report name – this field is used only for the management purposes, give it a friendly name so that
you could easily find the report in the list.
Cron expression – is an expression which specifies when and how to fire the report. Cron
expressions are very flexible and used to make fairly complex scheduling rules. You can get more
information about cron expressions here.
Time range to cover – this specifies the time range which report query will cover, the count begins
from the actual trigger time backwards. For example, if you want to cover single day and your report
is fired daily, specify 24 hours.
E-mail to - list of recipients to receive the e-mail (use semi column as separator)
E-mail subject – this text will be used in email subject when report is dispatched. Note that you can
use ${variable} notation here where variable could be domainName, hostName, loggerName,
message and any of the mapped MDC names. When report is built, this variable will be substituted
with the corresponding value taken from the first log statement in the report.
Mail priority - e-mails can be flagged with standard e-mail priorities (highest, high, normal, low,
lowest).
Zip attachments - specify a maximum size of log file in KB; if attachment file will be larger than
specified, it will be automatically zipped.
Layout – specifies how to layout the text in the log files. LogFaces is using log4j formatting rules;
you can find more details here
46
Copyright ©2009-2015 Moonlit Software Ltd, All rights reserved
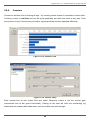
2.9.13
Triggers
Triggers are similar to reports except that they are not scheduled but fired immediately when certain
conditions met. Conditions are based on the log data going through the server. By specifying criteria
you will be able to detect very particular log statements from very particular sources. In addition to
this, you can also specify how many of such events to capture and within what time span they should
be in order to fire the trigger.
Like reports, triggers are listed to give you an overall view of what triggers are there, what is enabled
and when and how they get fired.
Figure 2.9.21: List of triggers
47
Copyright ©2009-2015 Moonlit Software Ltd, All rights reserved
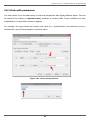
2.9.13.1 Delivery options
Figure 2.9.22: Trigger delivery options page
Enabled – the trigger will not fire if disabled, but will stay listed in the server
DND period - “do not disturb” period is when trigger should not send any emails while staying active.
This period is specified as cron expression. For example, * 0-59 14-18 ? * MON will silence the
emails during hours 14:00 - 19.00 each Monday.
Name – for management purposes
Recipients - comma separated list of e-mail recipients
Priority - e-mail priority (highest, high, normal, low, lowest)
Attachment – when enabled the email will contain a log file with events caused the trigger to fire
Layout - the layout of a log file if attachment is enabled
Subject – email subject to use when trigger is fired. Note that you can use ${variable} notation here
where variable could be domainName, hostName, loggerName, message and any of the mapped
MDC names or a split expression (see below). Those variables will be taken from a first log event
caused the trigger.
Message – email message text (optional). If not specified, the server will generate default message.
Like with the subject, it is possible to use ${variable} notations.
48
Copyright ©2009-2015 Moonlit Software Ltd, All rights reserved
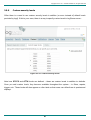
2.9.13.2 Capture criteria
Capturing criteria specifies which events should be going through the trigger. Only those events
which match specified criteria will participate, others will automatically discarded. It is generally a
good idea to have capturing criteria as narrow as possible.
Example below will capture NullPointerException from a particular host and application, and only
those events may eventually fire the trigger.
Figure 2.9.23: Trigger capturing criteria
49
Copyright ©2009-2015 Moonlit Software Ltd, All rights reserved
2.9.13.3 Rules
Once log event is captured by trigger criteria, the trigger will apply the following rules and then send
email notification according to the Delivery Options specified above.
Figure 2.9.24: Trigger rules
Trigger type - depending on the trigger type, the notification behavior will vary. Simple triggers count
captured events and fire when certain amount is captured within specified time window. Split triggers
are doing the same by using configurable context. Silence detectors do the opposite - they fire when
nothing is captured during specified period of time.
Counter - the trigger will fire only when at least this many events are trapped by the criteria.
Time window - the trigger will fire only when events are captured within this time frame (measured in
minutes).
Frequency limit - the trigger will not fire more often than specified by this value in minutes. This is
used to prevent flood of email notifications in case something goes wrong.
50
Copyright ©2009-2015 Moonlit Software Ltd, All rights reserved
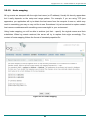
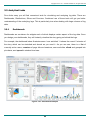
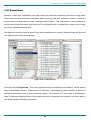
2.9.13.4 Split triggers
Split triggers deserve special explanation and real life example. Split triggers not simply counting the
occurrence of event but do so in a context you specify. Consider an example when we need to fire a
trigger when certain user tries to log-in very often and we want to detect who is the user. Assume the
following log event: “User XXX logged in”, where XXX will change depending on a user name.
So, if we want to get notified when particular user comes along and not just any user, we want to
tell the trigger to look in “message” attribute (split by) and extract a word from the message using the
regular expression with group capturing: “User %{WORD:userName} logged in“.
Named group 'userName' in this case is called triggering value because trigger will fire only when
certain amount of userName of the same value are detected. The same trigger may fire several
notifications - each for different userName. Hence the name - split triggers.
To use this variable in email body or subject, simply use '${userName}' - it will be replaced with
actual value when trigger fires. This way you can use very specific email notifications and see right
away what happened. For example, email subject “James Bond is being abusive” is more helpful
than “There are too many log-in attempts in the past 15 minutes”.
If you need to capture stuff like that – split triggers are good, make sure to familiarize yourself with
regular expressions and usage of named groups.
Figure 2.9.25: Split trigger example
51
Copyright ©2009-2015 Moonlit Software Ltd, All rights reserved
2.9.13.5 Silence detectors
Figure 2.9.26: Silence detector example
Not very hard to guess what this kind of triggers do. Silence detectors go off when nothing is coming
along during specified time window. By nothing we mean that nothing is captured by the capture
criteria specified with this trigger. Use them when you need to detect unusual lack of activity.
52
Copyright ©2009-2015 Moonlit Software Ltd, All rights reserved
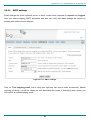
2.9.14
License
License tab displays currently installed license information as well as allows you to install new license
file. When you install logFaces server for a first time, it automatically activates one time trial
evaluation period for 10 days. If you decide to purchase a license, the license file should be
submitted through this form:
Figure 2.9.27: Licensing
What happens when evaluation license expires? logFaces server will shutdown its engine and only
allow Administration Console access; applications will not be able to use the server and clients won't
be able to connect to it.
What happens when maintenance plan expires? logFaces server will continue to function normally.
Software updates will not be available until license is extended.
When you install new license, the engine should be started manually. This can be done by simply
restarting the service from command prompt or control panel, or from the Status panel link – see the
next section.
53
Copyright ©2009-2015 Moonlit Software Ltd, All rights reserved
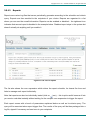
2.9.15
Status
Status tab contains useful health monitoring information of the server and allows basic
instrumentation tasks such as restarting, upgrading, etc.
Figure 2.9.28: Server status tab
Check for updates will try to detect updates we regularly post on our web site. If update is available,
the new version number and package size will be displayed. Note that this operation requires live
internet connection. Updates can also be automatically downloaded and installed – when new
version is detected, you will get a link to activate the installer. The process is fully automated but will
take your server offline for a few moments.
Download server dump will create a zip file containing your configuration and internal log files,
sending this package to our support may often speed up the support process.
54
Copyright ©2009-2015 Moonlit Software Ltd, All rights reserved
Engine start/stop/restart; sometimes it's required to put the server down without actually shutting
the process down. One of the typical uses of this option is when trial license expires. In such case,
the logFaces Server will start so that you would be able install proper license, but its engine will be
down and no logging will be taken from applications.
Run garbage collection; explicitly force garbage collection in server JVM
Fetch stack traces will download full dump of all threads currently running on server.
Last errors is a list of latest errors encountered by server, you can browse through them to see if
anything went wrong lately, or simply reset them.
Internal log can be tuned to verbose or silent mode. You can also download an internal log file for
inspection. This file can be sent to our support team.
Inflow rate represents the throughput of the server on the network side, it indicates the amount of
logs flowing into logFaces from all appenders per second.
Database throughput indicates how much data your database can commit per second. You should
keep an eye on this metric to be below Inflow rate most of the time. When database throughput is
significantly lower than inflow rate for a long time, the data will be stored in local disk storage called
overflow buffer. Normally this is an expensive operation and may result in higher than usual CPU
ans IO use. Overload is the percentage ratio of total number of events went through an overflow
buffer on local disk to a total committed. This ratio is very important for detecting the database bottle
neck. When overload gets too high, it will be emphasized in red color. The default threshold is set to
10% but you can adjust it in environment properties (see paragraph on advanced configuration). You
will also see a flag icon indicating that currently server handles its internal overflow cache trying to
push it into the database.
Overflow buffer shows how many events are currently pending to be committed due to overload and
how large is currently allocated space for overflow mechanism. Overflow is a mechanism designed to
guard against inflow spikes and prevent data loss when logs can't be committed to your database.
This mechanism gets engaged when database is unavailable, or database is slower than the inflow.
Your database may be super capable but when massive spike of inflow takes place, we will buffer the
impact to prevent major disruption. When this happens, the overflow mechanism will delegate
incoming data to a temporal local storage and then try flushing it whenever database permits. Note
that overflow buffer is limited by number of log events it can hold. You specify this in environment
configuration file, default is 500K. When this number crossed, logFaces will start loosing data as
55
Copyright ©2009-2015 Moonlit Software Ltd, All rights reserved
unsustainable. Whenever new space disk space is required, the overflow directory gets allocated by
32MB or bigger chunks. Note that total allocated disk space is not returned back to operating system
unless explicitly requested to do so. You can manually do it here by clicking on a Purge link, make
sure that actual cache is empty when you release the disk space.
Number of connection shows how many clients are using the server now and how many TCP
appenders are currently working.
Re-create database allows to remove all database records; be careful with this operation, it is not
recoverable and can't be undone
Update records counter will re-count total number of log records stored in your database. Because
counting with some databases is very expensive operation, this action is set for explicit user request.
Database maintenance – will start the database maintenance job whether its currently scheduled or
not. Depending on the database type, the task is different. For example, in case of embedded
database, its storage will be compacted and indexes rebuilt, other external SQL databases will have
their indexes rebuild. In case of MongoDB there is optional 'repair' task and optional index rebuilding.
56
Copyright ©2009-2015 Moonlit Software Ltd, All rights reserved
2.9.16
Getting server info remotely
It is possible to obtain basic server information by doing HTTP call to the following URL:
http://your-server-host:8050/rest?method=version
Server will respond with its version information in a form of JSON like this:
{
"serverVersion":"4.2.0.3075",
"osVersion":"Windows Server 2012 R2 (6.3), amd64",
"javaVersion":"1.7.0_72",
"dbProduct":"MongoDB(/192.168.0.2:27017)",
"dbDriverVersion":"2.11.2",
"dbDriverName":"Java driver",
"dbVersion":"2.6.7"
}
57
Copyright ©2009-2015 Moonlit Software Ltd, All rights reserved
2.10 Advanced setup
There are some settings which can not be configured through the administration web interface but
can be configured manually in several configuration files. These settings should only be modified
when server is down. Please review the settings carefully before doing any manual change. It's a
good idea to keep a backup of the files you are intending to modify.
2.10.1
Environment - /conf/environment.properties
Environment properties are fed into server JVM upon start up, prefix is com.moonlit.logfaces
Property
.config.server
Mandatory
Description
yes
Reference to the main configuration
file
.config.mongodb
no
If set to true then server will
work with MongoDB defined in
/conf/mongodb.properties file.
Default is false.
.config.mongoprops
no
Reference to internal mongodb
configuration file, default is
${lfs.home}/conf/mongodb.properties
.config.hibernate
no(*)
Reference to hibernate
configuration file. (*) Mandatory
when using SQL database.
.config.schema
no(*)
Reference to schema file which will
be created in database.
(*)Mandatory when using SQL
database.
.config.jobs
yes
Reference to jobs configuration
file.
.resources.eventMapping
no
Custom mapping of hibernate event
data. Applicable when using SQL
databases.
.resources.repoMapping
no
Custom mapping of hibernate
repository data. Applicable when
using SQL databases.
.resources.mongoIdGenerator
no
Custom implementation of MongoDB ID
generator. Applicable when using
MongoDB only.
.url.revision
no
URL for checking software updates
.url.downloads
no
URL for update downloads
.url.updates
no
URL to version update descriptor
.url.notes
no
URL to version release notes
.url.support
no
URL to support site
58
Copyright ©2009-2015 Moonlit Software Ltd, All rights reserved
no
Maximum number of threads the
server should be able to sustain,
higher number will issue an
internal warning.
.monitoring.lowMemoryThreshold
no
Minimum of free heap memory
specified as a percentage of
maximum heap memory. When free
memory will go below this value,
the server will issue a warning
which will appear in Admin.
console. Default is 2.
.monitoring.overloadThreshold
no
Threshold for detecting database
overload – ratio between overflown
and total commits. Default is 10%.
.monitoring.overflowSize
no
Size of the local overflow queue.
When reached, the overflow queue
will refuse to queue more events
and will raise system error.
Default is 500000 events.
.dzone.crcCacheSize
no
Maximum size of CRC cache storage
used by drop zones
.security.keyStore
no
File name for SSL certificate key
store
.security.trustStore
no
File name for SSL key trust store
.security.keyPass
no
Password for key store (plain or
obfuscated)
.security.trustPass
no
Password for trust store (plain or
obfuscated)
no
Sockets receive buffer size in
bytes, equivalent to SO_RCVBUF
option for server sockets. Default
65535.
.monitoring.highThreadCount
so.rcvbuf
59
Copyright ©2009-2015 Moonlit Software Ltd, All rights reserved
2.10.2
How do I work with external SQL databases?
You have to obtain relevant database driver from your database vendor and place the jars in
/lib/dbdrivers directory on server. Our installation only include drivers which permitted by
publisher's license. We do our tests for Oracle, MySQL, SQL Server, DB2 and PostgreSQL, but
theoretically there shouldn't be a problem to work with other relational databases as well. It's only a
matter of configuration and database driver you wish to use.
Look at /conf/environment.properties file – you should see these two properties pointing out to
hibernate configuration file and database schema :
com.moonlit.logfaces.config.hibernate=${lfs.home}/conf/hibernate.properties
com.moonlit.logfaces.config.schema=${lfs.home}/conf/lfs.sql
You can modify these references by pointing to different files, but make sure the files are correct. Our
distribution contains both hibernate examples and database schema for all databases we support at
this moment. The example above will use embedded database driver settings and Derby schema. If,
for example, you would like to use PostgreSQL, modify environment.properties as follows :
com.moonlit.logfaces.config.hibernate=${lfs.home}/conf/hibernate-postgree.properties
com.moonlit.logfaces.config.schema=${lfs.home}/conf/lfs-postgree.sql
Then modify hibernate properties file to point to your database. logFaces server uses Hibernate ORM
framework; it is recommended to have good knowledge of this framework before you decide to make
re-configuration.
Once you prepared the configuration, simply restart the logFaces server. During the start up new
schema will be published automatically. After the start up, open Administration Console and
navigate to the Status tab. If everything went well, you should see that engine is started, database
connection is OK and there are versions of database and driver in the table. If something goes wrong
and there are problems with database connection, you will see red marks and last error numbers. To
see what happened, click on "show last errors" or "download log file" link; the problem is usually
related to a configuration error, typo or perhaps your database is not responding as logFaces
expects. If you're unable to figure out the problem yourself, submit this log file or an error code to our
support site and we will try to help.
Another, perhaps easier, option is to run the server in console mode and see that there are no
60
Copyright ©2009-2015 Moonlit Software Ltd, All rights reserved
exception thrown during it's start up. On Windows you can run server in console mode from
/bin/run.bat on. On Linux, run the following command: ./lfs console while in /bin directory.
2.10.3
Yes,
you
Can I modify SQL database schema?
can
do
that
to
a
certain
extent.
Database
schema
file
is
referenced
in
/conf/environment.properties through property named com.moonlit.logfaces.config.schema.
You can not modify the structure of the tables or column names because they're mapped through
hibernate mapping in the code. But you can adjust column size constraints, modify indexes or add
some additional statements as long as they don't break the mapping.
After you changed the schema file you need to re-create the database. This can be done either from
administration console status tab, or by using some other external tool. Note that when using
embedded database, there is no other choice but using the admin. console.
IMPORTANT: If you care for the existing data in the database, make sure to back it up before doing
any changes to the schema. One of the options is to use our backup utility described next.
2.10.4
Can I use my own PK generators with SQL databases?
Yes. By default PKs are generated with simple native generator defined in hibernate mapping files
which are not exposed for general usage. If you want to generate your own PKs, the mappings need
to be altered and server needs to know which mapping to use. The procedure to follow:
1. extract Event.hbm.xml and Repository.hbm.xml from /lib/lfs.jar
2. modify the 'id' column generator section as you need, this is standard hibernate format
3. create separate jar file and place modified mappings along with your own classes
4. place this jar under /lib directory on server
5. enforce those classpath resources by changing /conf/environment.properties:
com.moonlit.logfaces.resources.eventMapping = classpath:/your/Event.hbm.xml
com.moonlit.logfaces.resources.repoMapping
= classpath:/your/Repository.hbm.xml
6. run server in console mode (/bin/lfs.bat) and watch the log output. If there is something wrong
in the mapping or something is missing, the database layer will not start and there will be
many errors.
61
Copyright ©2009-2015 Moonlit Software Ltd, All rights reserved
2.10.5
How do I work with MongoDB?
logFaces can work with traditional RDBMS as well as with NoSQL databases. Our choice for NoSQL
database fell on MongoDB and in this section you will learn how to set it up. Database type is defined
in /conf/environment.properties file by setting up this property:
com.moonlit.logfaces.config.mongodb
Set it to 'true' for MongoDB or 'false' for any other RDBMS. Once MongoDB is enabled, the server
will ignore all other settings related to hibernate and SQL.
Next step – get your MongoDB running, start logFaces server and go to its admin/status page. Most
likely that logFaces won't find your database right away, so you will see that database is down. This
is OK. Go to admin database tab and adjust MongoDB parameters, most importantly the connection
end points – host, port and security options if relevant for you database. At this point you should see
something like this:
It means that logFaces is now connected to MongoDB daemon on local machine, created its
database and ready to work. To verify – open your MongoDB console and make sure that requested
database is indeed created as you named it and it has two collections there - “ log” and “repo”. You
can always get back to this page later and adjust the settings. In most cases the changes applied
instantly.
62
Copyright ©2009-2015 Moonlit Software Ltd, All rights reserved
Note that parameters on this page come from and saved to /conf/mongodb.properties file on your
server. You will hardly ever need to edit them manually, but it's a good idea to understand them.
Table below is a compete list of properties we use to integrate with MongoDB, it will help you to
understand how to use connections, replica sets, indexes and other important features.
Property name
Description
Default
.connection
Comma separated list of host:port pairs
for specifying replica sets.
.user
User name for authentication. Leave
blank if your database doesn't require
security.
.password
Password
for
authentication.
Leave
blank if your database doesn't require
security.
.userdb
When
database
is
secured,
this
parameter specifies the name of the
database where users for authentication
are defined.
.writeConcern
By default driver sends data to the
MongoDB and if it is received it is OK.
Sometimes you want more than that. It
might be very important that content is
stored in one node or maybe even in
multiple
nodes.
By
providing
a
writeConcern you can specify how much
safety you want. NORMAL is the default
write and forget. SAFE only waits for
the master by using the getLastError.
REPLICAS_SAFE does the same but also
waits for the slaves - be careful in a
test environment without slaves, it
will wait and wait. FSYNC_SAFE force
fsync to disk on all operations.
NORMAL
.readPref
Read preference describes how MongoDB
clients
route
read
operations
to
members of a replica set.
primary
.dbname
Name of
create
logfaces
.capped
When set to 'true' logFaces will force
the capped 'log' collection and will
try to convert it to capped when it's
not, and will fail if it can't be
converted.
false
.cappedSize
Size
of
capped
collection
in
MB.
Affective when 'capped' is set to true
100 MB
the
database
63
logFaces
will
localhost:27017,
localhost:27018,
localhost:27019
Copyright ©2009-2015 Moonlit Software Ltd, All rights reserved
.ttl
When set to true logFaces will try to
convert the collection to TTL unless
it's already TTL.
false
.ttlDays
Number of days for TTL collection.
Affective only when TTL collection is
enabled
7
.partitioned
When 'true' logFaces will convert its
storage
into
set
of
partitioned
databases.
false
.pdays
When
partitioned
this
parameter
specifies the size of each partition in
days
1
Note that it is possible to parametrize property values like this:
com.moonlit.logfaces.config.mongodb.connection = ${my.host}
Server will then looks for JVM system property named “my.host” to resolve the value. Such
properties must be injected into server JVM during the bootstrap and should be available
during server initialization. Parametrized properties will not be persisted when modified from
admin web interface.
64
Copyright ©2009-2015 Moonlit Software Ltd, All rights reserved
2.10.6
MongoDB schema and indexes
When started, the server will automatically create two collections named 'log' and 'repo'.
Log
collection stores log events in such way that each event corresponds to exactly one MongoDB
document. This collection grows rapidly as data gets committed. Repo collection is a helping
repository to keep names of applications, hosts and loggers – this information is used mostly by
clients to assist with selection of items for queries and hardly ever grows once the system stabilizes.
Documents stored in log collection have attributes corresponding to the fields of actual logging event.
In order to save storage space those names are shrank to a minimum, so when you look into
collection, you will see extremely short names. Below is the mapping of these names:
{
"_id" : ObjectId("51abeff2e0fd7bab0f2cf20c"),
"t" : ISODate("2013-06-03T01:22:12.794Z"),
"q" : NumberLong(3256236),
"p" : 5000,
"r" : "355941742@qtp-2017211435-7749",
"m" : "This is the message",
"h" : "my host",
"a" : "my app",
"w" : false,
"g" : "com.myapp.logger",
"f" : "Myclass.java",
"e" : "MyMethod",
"l" : "489",
"c" : "com.myapp.logger",
"p_targetID" : "1360911352",
"p_sessionID" : "sid4454.col080"
//
//
//
//
//
//
//
//
//
//
//
//
//
//
//
//
object ID (generated by mongodb)
loggerTimeStamp (creation time)
sequenceNumber (generated by lfs)
loggerLevel (severity level)
threadName ( originating thread name)
message (message body)
hostName (originating host name)
domainName (originating app name)
thrown (exception true/false)
loggerName (originating logger name)
locFileName (location file name)
locMethodName (location method name)
locLineNumber (location line)
locClassName (location class)
custom MDC mapped to targetID
custom MDC mapped to sessionID
}
Because logFaces allows usage of any of the above attributes in queries, you will need to carefully
select compound indexes. One important thing to keep in mind when dealing with compound indexes
is that the order of the attributes in index is crucial to index performance. For example indexes (t,p)
and (p,t) may have completely different performance depending on the data store. First one will seek
records in specified time range (t), and then reduce to severity level (p). Second one works in reverse
– first seeking level (p) and then reduce by time (t). It is often desirable to have several compound
indexes so that you cover as many frequently used queries as possible. Keep in mind that the aim of
selecting right indexes is to compromise between storage size (indexes are greedy) and the end
user satisfaction with the speed of queries. Use MongoDB console tools to examine performance
details.
Nearly all queries generated by clients contain loggerTimeStamp (t) attribute. It means that in most
cases you will want to include this attribute and position it correctly within the index.
65
Copyright ©2009-2015 Moonlit Software Ltd, All rights reserved
2.10.7
MongoDB capped collections
From MongoDB site:
“Capped collections are fixed sized collections that have a very high performance auto-FIFO age-out
feature (age out is based on insertion order). They are a bit like the "RRD" (Round Robin Database)
concept if you are familiar with that. In addition, capped collections automatically, with high
performance, maintain insertion order for the objects in the collection; this is very powerful for certain
use cases such as logging.”
RRD doesn't ensure data storage by time (for example 3 days of data), it ensures that storage will not
grow bigger in size than specified. However, having such tremendous performance advantage,
capped collections could be a preference for some. If you are one of those, this is how you should
setup logFaces to utilize this feature – go to admin/database/MongoDB tab, check Capped Collection
option and specify size in MB. The server will automatically do the relevant conversion of 'log'
collection into capped. It is also possible to convert to a capped collection directly from MongoDB
shell. If you do this, make sure to modify mongodb.properties file accordingly before restarting the
server!
When capped collections used, the database day capacity automatically becomes 'unlimited' and
logFaces will not manage the data store size. Maintenance of such database is also irrelevant since
MongoDB storage size will not grow from the specified. Thus you will not see 'capacity' and
'maintenance cron' options in admin database page.
Note that switching from capped collections back to regular collections is not possible without
manually backing up your data and re-inserting it back into a newly created regular collection. It is
also not possible (as of this writing) to extend the size of capped collections without doing manual reinserts. Again, make sure to modify mongodb.properties file before restarting the server, otherwise
it will convert everything back to capped. In other words, mongodb.properties must always be
adjusted manually if you manually administer your database otherwise it may override your
changes.
66
Copyright ©2009-2015 Moonlit Software Ltd, All rights reserved
2.10.8
MongoDB TTL collections
TTL stands for “Time To Live”. From MongoDB documentation:
“Implemented as a special index type, TTL collections make it possible to store data in MongoDB
and have the mongod automatically remove data after a specified period of time. This is ideal for
some types of information like machine generated event data, logs, and session information that only
need to persist in a database for a limited period of time ”
To enable this feature with logFaces server, open administration page and modify “storage type”
option to “TTL collection” as shown below. You will also need to specify the “number of days” for
this collection to operate with.
Note that when TTL collection is used, the server will automatically set “Retention” to unlimited and
will not remove older records from database on its own – this duty will solely be in hands of
MongoDB.
67
Copyright ©2009-2015 Moonlit Software Ltd, All rights reserved
2.10.9
MongoDB partitioned storage
There is a common problem with data storage of any kind – it's much easier to store things than to
retrieve them, yet more difficult to delete them. The problem intensifies as storage gets bigger.
To address this problem we have an alternative way for storing very large amounts of log data.
Instead of using single collection which is a default setup, you can choose to partition your entire data
set by days, or as we call them - partitions.
Using partitions is radically different from other types of collections because instead of one database
with two collections, your MongoDB instance will have many databases - one per each partition. In
other words, we partition the data by database, not by collection. And each database will contain
exactly one partition. This decision is motivated by performance – it is much easier to drop an entire
database than to drop a collection. It gets very noticeable when we deal with terabytes of data and
billions of log records.
It is important to decide what would be the size of partitions in days. This greatly depends on your
usage patterns. But the tradeoff is based on a very simple rule – the smaller the database the better
it will perform in terms of queries. So, how much data you expect daily and how you intend to query
this data should be taken into account.
68
Copyright ©2009-2015 Moonlit Software Ltd, All rights reserved
When doing queries from partitioned store, logFaces server may hit more than one partition,
depending on the time range user asks for. For example if query spans 3 days and your partitions
are sized by 1 day, there will be 3 database hits on the server side. It may sound that things will go
three times slower but this is not true. When dealing with billions of log events, it's much faster to hit
few smaller collections few times than to hit one big collection once. But you still should consider the
partition size, if going after several days of data is something you will be doing very often – consider
to span partitions for several days. Keep in mind that once the store is partitioned, it can not be
modified.
Once you switch to partitioned storage type, next thing you want to do is to adjust the retention –
number of days to keep your logs for:
One last thing is indexes. They need need special mentioning. Each partition contains one collection
named 'log' where actual data is stored for the given time range. When server allocates new
partitions, it will automatically build indexes for the new partition but it takes indexes
information from its previous partition. So, make sure to select and define your indexes for the
current day as soon as you create partitioned store as it will start rolling day after day and doesn't
require your attention.
Note that names of databases in MongoDB instance (logFaces partitions) follow strict format, avoid
changing them or dropping them manually, this may confuse the server. If you list databases in
MongoDB node you will find logFaces partitions named like lfsp-020414-030414 where numbers
denote the start and the end of the partition date, in this case the partition spans from Apr 2 until the
end of Apr 3 of year 2014.
69
Copyright ©2009-2015 Moonlit Software Ltd, All rights reserved
2.10.10 MongoDB custom _id creation
By default, logFaces uses the _id generated by MongoDB driver, which is a standard ObjectId. To
override this behavior and create your own _id object follow the procedure below:
1. Implement
com.moonlit.logfaces.server.core.OIDGenerator
interface.
The
interface definition and other dependencies can be found in /lib/lfs-core.jar. Implemented class
will be instantiated by reflection, so the default constructor must be present.
2. Place your implementation on server under /lib directory.
3. Tell the server to use your implementation instead of the defaults by changing this property
in /conf/environment.properties:
com.moonlit.logfaces.resources.mongoIdGenerator = com.yourGenerator
4. Run the server, feed some data and see that your implementation works as expected. If server
fails to find or instantiate your implementation, it will fall back to the defaults silently.
70
Copyright ©2009-2015 Moonlit Software Ltd, All rights reserved
2.10.11 MongoDB access control
If your database requires authentication for the clients then logFaces server, being the client in this
case, must be configured to meet this requirement. This is done by specifying user name, password
and the name of the database where this user is defined in MongoDB instance.
As of MongoDB v3.0 this principal must have the following permission for logFaces server to be able
to work with this instance of MongoDB:
•
readWriteAnyDatabase
•
userAdminAnyDatabase
•
dbAdminAnyDatabase
•
clusterAdmin
Note that AnyDatabase permissions are only required when logFaces is configured to use partitioned
storage. This is because each partition corresponds to a separate database and its name is always
changing depending on the time range it covers. As of this writing MongoDB roles can be assigned
either fixed database names or use AnyDatabase sets of permissions. When partitioned store is not
used, it is possible to use corresponding permissions for a particular databases name (in the
example above this would be lfs2).
71
Copyright ©2009-2015 Moonlit Software Ltd, All rights reserved
2.10.12 How do I tune the server for the best performance?
First of all, to determine whether the server under-performs, you need some metrics. You will find
them in admin status page, below is an example of the most interesting parameters:
The most common performance factor is the memory factor. Note that free heap memory should
never get close to about 2-5% of the maximum allocated for the server JVM; when this happens the
memory monitor will issue a warning in “last errors”. Once JVM memory gets drained, its behavior
gets unpredictable and eventually may result in a complete fault. For the details read section named
“How to increase server JVM memory”.
Another common performance factor is the balance between inflow rate and database throughput
rate. The inflow rate is the number of log events arriving to the server per second from appenders.
Database throughput is the number of events your database commits per second. You will see these
numbers changing quite a lot and depend on many factors. To name just a few - network speed,
database performance, log statement sizes, etc. When inflow rate is higher than database
throughput, the server will activate an overflow mechanism which delegates residuals to a local disk
storage while database is busy committing. Residuals are then flushed into database whenever
database permits. In general, this mechanism is designed to prevent intermittent load spikes and
can't be effective when the inflow is permanently higher than the database throughput. When local
storage grows large, the CPU and IO usage may get much higher than normal. The larger the local
storage grows, the harder it becomes to get the data from there. To prevent this from happening on
regular basis you should watch the amount of “overload” - the percentage of total inflow which went
through the local storage before it reached your database.
Try to adjust commit buffer size in admin database page. Note that larger commit buffer sizes not
necessarily improve the database throughput, it very much depends on the database setup. Usually,
most databases start getting sluggish when they significantly grow in size – try to control this by
reducing day capacity or persisting less information.
72
Copyright ©2009-2015 Moonlit Software Ltd, All rights reserved
Database indexes play very significant role in insert rates, try to tune your indexes to fit best your
queries. Removing unnecessary indexes can significantly improve the overall performance – you can
modify indexes in schema templates for the database you use, or alternatively – manage them with
external database tools.
Of course the amount of server connections and threads play their role too. Each remote client or
appender will result in an additional thread. Depending on the hardware and OS, these numbers
should be taken into account.
When you see that server obviously under-performs, consider to either reduce the amount of load, or
add another logFaces node to split the load.
73
Copyright ©2009-2015 Moonlit Software Ltd, All rights reserved
2.10.13 How do I backup my database storage?
You can perform backup of entire database storage into a binary file. This backup file can later be reimported into another system. We provide a script to fully automate this process - /bin/backup.bat
on Windows or /bin/backup.sh on Linuxes. Generally this is a good idea to stop the server during
backup process, but this is only required for when you use embedded databases, external databases
can be backed up even while server is running. To import backed up data into another system, go to
client Tools menu and select "Import data into database". You will be prompted to select the backup
file. Depending on the amount of data, the process may take some time to complete.
Note that this is not the most efficient way to do the backup and shouldn't be used with large volumes
of data.
2.10.14 How can I automate monitoring of logFaces server logs?
logFaces server itself has its own internal log which you can monitor by means of triggers or reports.
The application name used by logFaces server is “LFS” and root package of server classes is named
“com.moonlit.logfaces”. When specifying criteria you can use either of those parameters to detect
problems in real-time by means of triggers, or obtain scheduled summaries by means of reports.
Generally it's a good idea to have this set up before you contact our support, we normally will ask for
the internal logs before getting into the details.
2.10.15 How do I increase server JVM memory?
Open \bin\ lfs.conf file (this is a bootstrap configuration file)
JVM memory is setup with those attributes:
wrapper.java.initmemory=256
wrapper.java.maxmemory=512
Those values are default, if you experience extensive memory usage, try to increase maxmemory
property value. Note that values are in mega bytes.
74
Copyright ©2009-2015 Moonlit Software Ltd, All rights reserved
2.10.16 How to pass additional arguments to server JVM
Additional arguments (-D like properties) can be passed to server JVM in the following way. Open
\bin\ lfs.conf file (this is a bootstrap configuration file) and look for a properties named like this:
wrapper.java.additional.xxx = yyy
Note how additional properties are numbered. When adding your own, make sure to increment the
number. For example:
wrapper.java.additional.1=-Dfile.encoding=utf-8
wrapper.java.additional.2=-Dmy.prop.value=true
75
Copyright ©2009-2015 Moonlit Software Ltd, All rights reserved
2.10.17 How do I use NTLM authentication with MS SQL Server on Windows?
1. Download latest jTDS driver from here http://jtds.sourceforge.net/
2. Place jtds-xxx.jar and relevant ntlmauth.dll under /lib/dbdrivers in your server installation
3. Modify /bin/lfs.conf so that JVM loads ntlmauth.dll by adding the library path property:
wrapper.java.library.path.2=..\lib\dbdrivers
4. Comment out user name and password in hibernate properties file – this will ensure that
NTLM authentication is used. Make sure that connection URL specifies correct domain.
5. If logFaces server runs as windows service, you will have to make sure that LFS service starts
with proper user account and not default system account - modify these in service properties.
Otherwise the driver will use currently logged in user credentials to connect to database.
76
Copyright ©2009-2015 Moonlit Software Ltd, All rights reserved
2.10.18 How do I make logFaces win32 service depend on other services?
In Windows it's often required to have logFaces service dependent on other services during start up.
For example, if you run database server on the same machine as logFaces server, you may want to
make sure that it starts only after database successfully starts. To achieve that, you must specify
service dependencies.
Open /bin/lfs.conf file and modify wrapper.ntservice.dependency.xxx properties accordingly. For
example:
wrapper.ntservice.dependency.1 = SomeService1
wrapper.ntservice.dependency.2 = SomeService2
Make sure to preserve proper numbering order and specify correct names of dependent services.
Then you will need to re-register LFS service. Make sure the service is not running; execute
/bin/uninstallservices.bat and then /bin/installservices.bat – this will re-register service
configuration in Windows registry. To verify that everything went OK, check out service properties in
your Windows administration tools. For example, in case of Oracle, the dependencies should look
similar to what is shown below. If everything looks OK, go ahead and restart your computer to verify
that dependencies actually work.
77
Copyright ©2009-2015 Moonlit Software Ltd, All rights reserved
2.10.19 How do I enable SSL for clients and browsers.
By default the access to the server from clients and browsers is based on plain HTTP connection. To
use secure (SSL) based connection follow these steps:
1. Obtain public a private keys from trusted CA authority. Usually they come in a PEM format –
text files with bunch of encrypted numbers. Note that it's no possible to use self signed
certificates, so before you proceed you must have both these files handy.
2. The keys must be now imported into the trusted store which will then be used by logFaces
server to present its identity and encrypt the traffic for the outside clients. To do this we need
to do the following steps:
a) First we need to convert the keys into combined PKCS12 format, one of the tools which
can be used for this is OpenSSL , here is the command you should execute:
openssl pkcs12 -inkey private.key -in mycert.crt -export -out mykeys.pkcs12
This will combine the private (private.key) and public (mycert.crt) keys into a single file
named mykeys.pkcs12
b) Now import the mykeys.pkcs12 into the key store using conventional JDK keytool utility.
keytool -importkeystore -srckeystore mykeys.pkcs12 -srcstoretype PKCS12 -destkeystore
mykeystore
You will be prompted for passwords – remember them for the next steps.
c) Created mykeystore file should now be introduced to the logFaces server to be used.
Open the /conf/environment.properties file and fill in the following properties:
com.moonlit.logfaces.security.keyStore
com.moonlit.logfaces.security.trustStore
com.moonlit.logfaces.security.keyPass
com.moonlit.logfaces.security.trustPass
=
=
=
=
path_to_mykeystore
path_to_mykeystore
OBF:1x881v2h1t371shw1shm1t2z1v1x1x8m
OBF:1x881v2h1t371shw1shm1t2z1v1x1x8m
Note that passwords can be entered in clear text or obfuscated like in the example above.
To obfuscate your passwords you can use the existing Jetty utilities located in /lib/jetty
folder. The command line below will obfuscate a text string:
java -cp jetty.jar;jetty-util.jar org.mortbay.jetty.security.Password my-password
3. At this point you can start the server. If everything is specified correctly, the clients and
browsers will have to use SSL connection to communicate with the server. Please note that
once configured to use SSL, the server will enforce only SSL connection, there is no other port
for non-secure access – it's either SSL or not. If you can't get connected, try running the
server in console mode or look in its internal log.
Note that /conf/environment.properties file has default presets for file names and passwords, so you
might as well choose to use those names in the first place. The obfuscated passwords are 'logfaces'.
78
Copyright ©2009-2015 Moonlit Software Ltd, All rights reserved
3 Getting started with logFaces client
logFaces client application is available for Windows, Linux and Mac OSX for 32 and 64 bit
architectures. Think of logFaces client as a pair of glasses you wear when looking into the log stream
pouring through the log server. The client will assist you to make sense out of this stream and
convert large amount of log data into a meaningful piece of work.
3.1 Installing and uninstalling
On Windows, download and run the installer which will walk you through the process. Linux
distributions come as tar.gz archives, just unzip the archive and run logfaces executable file. Mac
OS X distributions come in a form of Mac OS X folder, open it and deploy to a location of your choice.
To uninstall the client on Windows run the uninstall.exe in installation directory, on other OS's simply
remove the client folder.
3.2 Modes of operation
Figure 3.2.2: Server Mode
Figure 3.2.1: Client Mode
logFaces client can work in two modes - Client Mode or Server Mode. You select the mode during
application start-up. In Client Mode the application connects to and works with one logFaces server
instance. In Server Mode the application acts as actual log server but without database.
In Client Mode we specify logFaces server host name, port number and SSL option. These options
will be remembered for the next time you run the client, but you can also indicate to use those
settings automatically in the next time and not asking again. It is possible to modify these settings in
the File/Preferences menu later. The communication between logFaces Client and Server is one way
(from client to server) and is HTTP(s) based, so normally there shouldn't be a problem with firewalls.
Of course, the access through the given port should be allowed by your network administrator.
79
Copyright ©2009-2015 Moonlit Software Ltd, All rights reserved
In Server Mode the application runs with embedded compact version of logFaces Server. This is a
limited version of server and client combined into single application which provides only real time
viewing of log data. You can use it when you don't need database and other features available in
standalone logFaces Server. In order to run in Server Mode we need to specify at least one of the
ports which will be used by the application to receive log data from appenders. You can specify either
TCP, or UDP or both, just make sure those ports are available and your application appenders are
configured accordingly.
Both modes look very much alike from user experience point of view, except that in Server Mode
there are no database and querying features.
Note that in order to run in Server Mode you need to install the license on the computer where you
run it. Note also that this is not the same license type as installed on the logFaces Server. This
license needs to be purchased and installed separately unless you hold OEM or Site license.
3.3 Workspace
When using several server nodes, you often need to switch quickly from one system to the other.
This is done by means of Workspace which stores connection parameters, real-time perspectives,
queries, counters, and all other settings. Workspaces can be exported to and imported from a text
files. Additionally, workspaces can be stored on server and shared amongst team members, this way
you do the setup only once and let others to import workspace with all the settings. File menu
contains all workspace related actions :
Figure 3.3.1: Workspace
actions
80
Copyright ©2009-2015 Moonlit Software Ltd, All rights reserved
3.4 User interface concept
Figure 3.4.1: logFaces client user interface
logFaces is designed with two major goals in mind – real-time monitoring and drilling into the log
history. The user interface you see above is built for achieving those tasks. The client is an Eclipse
RCP application and retains most of the Eclipse paradigms – there is a working area in a middle and
it's surrounded by auxiliary views which drive the work flow.
Real time data and query results are displayed in a middle part within data tables and each piece of
information has its own tab. You can move those tabs around to have several views displayed
together.
Along with the data, there are structural pieces of information like names of loggers, applications,
hosts, exceptions, event details – they occupy axillary views around the main area. Axillary views
also can be hidden, shown or re-arranged as you see fit.
The following sections explain how to do the monitoring and drilling as well as the usage of auxiliary
views.
81
Copyright ©2009-2015 Moonlit Software Ltd, All rights reserved
3.5 Data tables
Log data is displayed in tables - flexible to manipulate and easy to navigate with. Once you have data
(real time or historical) you will want to customize the way it looks or navigate from it somewhere
else. Table headers are special – they allow additional filters on existing table content. For example,
if you want to focus on particular Thread, click on the corresponding header and select that thread.
Several column filters can be combined. Tables can also be displayed with specified columns so that
you only see relevant details. The content can be searched and annotated.
Figure 3.5.1: Data tables
Note the colored bars on the sides – problematic events are color-mapped on right side bar while
tagged events are color-mapped on the left side bar. Hovering the mouse over those bars gives a
quick jump to a particular event without too much scrolling around.
The content of data tables can be instantly converted into textual log files – click on “To log file”
button or even open the text in an editor by clicking on “Text editor”. The text layout can be specified
in preferences.
82
Copyright ©2009-2015 Moonlit Software Ltd, All rights reserved
3.6 Monitoring tasks
Real time monitoring is a unique feature in logFaces as it was designed for incredible volumes of
data going through the server. To serve many users, logFaces server pushes logs to each client
separately and according to its very own criteria filter. Those filters you will find throughout the
system - including queries, administration tasks like reports, trigger and database. This is how real
time perspective is defined:
Figure 3.6.1: Perspective settings
Along with criteria filters there are other options – alarm and wake up sounds, balloon pop-ups and
time zone presentation. Note that perspectives are named and can be stored for later use in “My
perspectives” axillary view. Perspectives can be created from several contexts:
•
From “My perspectives” view where you will specify the criteria yourself
•
From most other axillary views where perspectives can be launched instantly using the
selected context. For example, right clicking on a host name within “Hosts” view you can
create a perspective which will listen for selected host logs.
•
From data tables (query results, or other perspectives) where you can “Follow” some
interesting item by right clicking in the table rows.
Perspectives tool bar gives you full control of each perspective separately where you can pause,
resume, setup columns, lock, clear or do text searching.
83
Copyright ©2009-2015 Moonlit Software Ltd, All rights reserved
3.7 Data mining tasks
Real-time monitoring alone is not good enough unless accompanied with data mining. You will find
numerous ways of getting the historical data – there is an instant fetch, context drilling, range lookups
to peer into all sorts of time spans – all made simple and easy to use. Database queries are based
on the same idea of criteria filters:
Figure 3.7.1: Database query
Along with criteria you specify a time range to cover, result set limitation, order display and time zone
for presentation. Note that queries can be named – you may want to keep some of the queries you
use often in “My Queries” view and spin them out any time. Since queries are based on predefined
time ranges, they will always work no matter when you run them. For example query with “1 day”
time range will give you data spanning from this moment and back 24 hours.
Queries can be launched from various contexts in data tables and most axillary views. Those queries
which you decide to keep in “My Queries” can be instantly launched from main tool bar drop down
menu.
84
Copyright ©2009-2015 Moonlit Software Ltd, All rights reserved
3.8 Criteria with parameters
It is often useful to run the same query or real-time perspective with slightly different inputs. This can
be achieved by setting up ${param-name} variables in criteria fields. Those variables are then
substituted at run time before criteria is applied.
For example, the query below will require user input for a “serial-number” and whenever query is
executed the user will be prompted to input that value.
Figure 3.8.1: Query with parameters
85
Copyright ©2009-2015 Moonlit Software Ltd, All rights reserved
3.9 Analytical tasks
Few clicks away you will find convenient tools for visualizing and analyzing log data. There are
Dashboards, Distributions, Slices and Counters. Combined use of those tools will get you better
understanding of the underlying logs. This is particularly true when dealing with large volumes of log
data.
3.9.1
Dashboards
Dashboards are containers for widgets each of which displays certain aspect of the log data. Once
you design your dashboards, they will instantly visualize the story going on behind the logs.
For example, the dashboard below illustrates some “user activities”. It shows the recent 5 minutes of
the story which can be stretched and shrank as you need it. As you can see, there is a list of
currently active users, counters of page hits and sessions, some activities sliced and grouped into
pie charts, and spread in stacked time bars.
Figure 3.9.1: Dashboard example
86
Copyright ©2009-2015 Moonlit Software Ltd, All rights reserved
You can re-arrange widgets on the dashboard to your liking. The dashboard state is persisted so that
next time you open the dashboard, it will show up in exactly the same state as you left it. All your
dashboards are stacked under the main toolbar menu so that you can instantly bring any (or all of
them) to the front view. When displayed, the dashboard will automatically refresh its content every
once in a while. There are predefined time ranges for fast time traveling.
As you have seen there are several types of widgets supported and each type renders itself
differently on the dashboard. Widget window has a button bar on its top right corner to allow the
access to actual log data, settings, manual refresh and maximizing. Widget window can be re-sized
and dragged around the dashboard.
The content of the widget window is very active, clicking on its part will perform drill down and extract
actual log statements. For example, clicking on the slice will deliver the log data for that particular
slice. Clicking on the bar will bring logs from that particular bar and time. And so forth..
Figure 3.9.3: Counter widget
Figure 3.9.2: Slice widget
Figure 3.9.4: Time line widget
87
Copyright ©2009-2015 Moonlit Software Ltd, All rights reserved
The widget itself is a query with some additional parameters needed for its display. The example
below illustrates a widget named “Most active users” - this name will be shown on the widget title bar.
This widget is of a type “Pie chart” where we aggregate all data and slice it by category “ user” which
actually is an MDC name in our system.
Now, the data we will be dealing with is a query result based on logger level, domain name and host
name. Everything this query produces will be sliced by “user” and rendered as a pie chart we have
seen in the previous example.
Figure 3.9.5: Widget setup dialog
88
Copyright ©2009-2015 Moonlit Software Ltd, All rights reserved
3.9.2
Distributions
Distributions is an axillary view for visually spreading log data in time by categories. Distributions
work in the context of some data display like real-time perspective or query results. The example
below illustrates how query results are visualized by distributions.
Figure 3.9.6: Distributions example
Distributions chart aggregates logs on time axis using some category for stacking the data. This way
you see the activity in the context of the time which is covered by actual result set.
There are built-in categories to choose from - severity levels, host and application names,
exceptions, tags, MDC names, etc. But there are also ways to define your own categories. See
“Named regular expression” section for more details.
While distribution chart is displayed, you can modify its category and time rate on the top right tool
bar of the view. Left clicking on the bar will and get you the underlying log data of given time. Right
clicking on the bar will fetch events of clicked category from entire time range.
89
Copyright ©2009-2015 Moonlit Software Ltd, All rights reserved
3.9.3
Slices
Unlike distributions which show time line of logs, Slices view displays categorized quantities and
their correlations. Slices view is also linked to currently displayed data table and will automatically
update when data table gets changed or switched. Below are several examples:
Figure 3.9.7: Sliced by tags
Figure 3.9.8: Sliced by severity levels
Figure 3.9.9: Sliced by components
90
Copyright ©2009-2015 Moonlit Software Ltd, All rights reserved
3.9.4
Named regular expressions
As you may have noticed from previous sections, the analytical views are based on categories which
derived directly from logging event structure - names of applications, host, loggers, exception, etc. To
extend this list it is also possible to extract data from messages and use those data as category for
further analysis. If you have log messages of repetitive structure but variable in terms of content,
some of this content may be used to create custom categories. For example, consider the following
log messages:
program started, env: Windows 7 (6.1), x86, JRE 1.6.0_54
program started, env: Windows 7 (6.1), x86, JRE 1.7.0_64
program started, env: Windows 7 (6.1), x86, JRE 1.7.0_71
To capture and plot the information about JRE version we use regular expressions which we also
name so that we can easily find them later. Once defined, named regular expressions will show up in
a list of categories in Distributions and Slices views. To define and test those expressions, open file
File/Preferences and select Named regex section, it looks like this:
Figure 3.9.10: Named regular expressions
91
Copyright ©2009-2015 Moonlit Software Ltd, All rights reserved
To be used along with other categories, regular expressions are named, hence the term.
The regular expression pattern must include at least one named group which will be used for
capturing data from text. If you specify more than one group, you should also select which of the
groups to use for data extraction. It is possible to use expressions from your patterns library, the
notation of %{pattern-name} still applies.
When named regular expression is applied to a collection of logs, it will scan each event message
body to match the regular expression at hand. When match, the group data will be extracted from the
text and used as a series for display in analysis charts. For example, a slice with applied above
example may look like this:
Figure 3.9.11: Named regular expression applied
As you can see, the most used JRE version in this example is 1.6.0_32. But you can also see that
there are 14 different versions used altogether. That may be a valuable information.
If you click on either of the slices, logFaces will drill down and extract from its database the log
events contributed to the picture we see.
92
Copyright ©2009-2015 Moonlit Software Ltd, All rights reserved
Another interesting feature of named expressions can be seen with Distributions where aspect of
time comes into play. If your logs contain numeric information, we can extract it and instead of
counting the amount of log events matching, we can display extracted numbers.
Consider the following example, these logs reveal some data being collected:
collected
collected
collected
collected
collected
collected
collected
collected
collected
132 records from ....
596 records from ....
28 records from ....
24 records from ....
30 records from ....
16 records from ....
42 records from ....
45 records from ....
2 records from ....
Named regular expression for this type of data should indicate that we want numbers extracted if
possible. Select “Capture numeric value only” check box in expression editor panel.
A pattern like “collected %{NUMBER:num} records .*” will extract and accumulate the numbers
along the time line and using specified rate.
Finally, when applied to real log data our named expressions will produce this:
Figure 3.9.12: Numeric distributions
Note how Y axis for numeric expressions shows the sum of extracted numbers for a given period of
time. In this example, it's the number of “collected records”. And again, clicking on an individual bar
will display the contributing log events which produced this picture.
93
Copyright ©2009-2015 Moonlit Software Ltd, All rights reserved
3.9.5
Counters
Counters is another form of looking at logs – by counting certain events in correlation to each other.
Counting is done in real time and can be setup separately per client and reset at any time. From
server point of view Counters are yet another log perspectives but they displayed differently:
Figure 3.9.13: Counters view
Figure 3.9.14: Counter setup
Each counter has its own criteria filter and name. Whenever criteria is met the counter gets
incremented and its bar grows horizontally. Clicking on the bars will fetch the contributing log
statements into ordinary data table where you can further work with the logs.
94
Copyright ©2009-2015 Moonlit Software Ltd, All rights reserved
3.10 Repositories
Domains, hosts and components are jump starts into real-time monitoring and data mining tasks.
Those views provide structural information about your log data and underlying system. These are
actual names of applications, hosts, packages and classes. This information is accumulated by
server continuously and never gets removed. Use refresh button to update the content of the views,
they aren't updated automatically.
Use right click context menu to spin off real time perspectives or queries. Selected items will be used
to construct criteria filter automatically.
Figure 3.10.1: Repositories
One note about Components. This view is special because components are artifacts, server doesn't
have a knowledge of them. Component is a collection of packages grouped together to allow you
additional abstraction level of the underlying system. For example, you can make a “Presentation
layer” component holding dozens of packages and since components are named, you will be able to
use those names in filtering and queries.
95
Copyright ©2009-2015 Moonlit Software Ltd, All rights reserved
3.11 Messages, exceptions and details
Whenever something is selected in data tables, the additional details are also shown in separate
views for convenience. Every log event has a message text; when it's too large or spans several lines
the “Message” view will show it nicely so that you could select and copy text into a clipboard.
When event carries an exception, the “Exception” view will be displayed with full stack trace where
you further jump into sources.
“Event Details” view has a summary of all information known about the log statement. Everything is
colored by event severity so that you will easily know what it's all about. For example, below we have
an error selected in data table, so the “Message”, “Exception” and “Details” views are painted with
the red background.
Figure 3.11.1: Using auxiliary views
You can also spin queries from selections and even real-time perspectives to follow particular
patterns – use the mouse right click wherever possible.
96
Copyright ©2009-2015 Moonlit Software Ltd, All rights reserved
3.12 Source code correlation
Having appenders to transmit location information allows instant access to the origin of the log
statements. Most appenders have a property named “locationInfo”; when set to “true”, the appender
transmits files name, class name, method name and a line number of originating log statement.
Figure 3.12.1: Accessing the source code
In order to be able to use this information we need to map the locations of source files – this can be
done in File/Preferences/Source mapping. Whenever the source files are requested, the specified
locations are scanned to find the corresponding source file. If source file is found, it will be displayed
in separate window pointing to exact location in the code where log statement is coming from.
Note that you can also open sources in external editor instead of built in viewer like in the example
above. This can be configured in File/Preferences/Files section.
97
Copyright ©2009-2015 Moonlit Software Ltd, All rights reserved
3.13 Viewing raw log files
It is possible to parse log files and use client analytical features to inspect the content. This is done
by means of parsers which you can define in your workspace and use them whenever log file needs
to be opened. Parsers are defined in preferences:
Each parser defines main regular expression pattern, exception pattern and date time format specific
to the log files you will be using this parser with. Each parser is also named so that you can easily
recognize it. Each parser can also be tested by challenging it with real log data.
Once you are done defining your parsers, they will be listed under “File / Open log file..” menu.
Processed file will be displayed in a conventional data table where you will further apply filtering, do
the search, spread and slice by categories and use the rest of the analytical tools available in client
interface.
To learn how to use regular expressions to parse raw text please refer to “Working with regular
expressions” section. Note that clients can share pattern libraries through the server and use the
same set of regular expression patterns.
98
Copyright ©2009-2015 Moonlit Software Ltd, All rights reserved
3.14 Managing patterns library
Each client maintains its own copy of regular expressions patterns library and using it for parsing log
files when needed. To see the library content go to Tools menu and select “Open Patterns Library”,
the local copy of patterns library will be displayed.
Patterns can be modified locally, imported from the server, tested and exported to server for sharing
with other users. To learn about patterns library please refer to “Working with regular expressions”
section.
Figure 3.14.1: Patterns library
99
Copyright ©2009-2015 Moonlit Software Ltd, All rights reserved
3.15 Importing and export logs
Log data can be exported from one server database and imported into the other, we use binary data
image for those operations. You can export query results directly into binary file and import it later on
somewhere else.
To export all data from the database, go to Tools menu and select "Export data from database".
You will be prompted for the file name. This operation is identical to what is done by Backup utility.
To import data into database, go to Tools menu and select "Import data into database". You will be
prompted to select a file exported previously from logFaces. Before the import actually starts, you will
be asked to specify a Domain name to which imported data should be associated:
If you leave this field blank, the data will be imported without any modifications. Otherwise, the
Domain name of all events will be replaced to the value provided. This is very convenient when you
exchange data between different logFaces servers.
Please take into account, that depending on the dataset size and the speed of the database, those
operations may take up to several minutes while taking considerable amount of CPU and database
I/O.
100
Copyright ©2009-2015 Moonlit Software Ltd, All rights reserved
3.16 Command Line Arguments
3.16.1
Using non-default JVM
Client application will look for a default JVM installed on your computer when started. To override this
behavior, pass -vm argument to the launcher. For example, a shortcut like this should work on
Windows:
logFaces.exe -vm “c:\path\to\my\javaw.exe”
3.16.2
logfaces.ini file
Client installation directory should contain a file named logfaces.ini. If it doesn't exists – make it
manually (it should be in the same folder as logfaces.exe). The following parameters specify JVM
heap memory sizes. Increase the Xmx parameter for more memory intense scenarios.
-vmargs
-Xms64m
-Xmx256m
-XX:MaxPermSize=128m
In case your desktop computer is using proxy to connect to the outside world, add the following two
lines with your own settings for proxy host and port.
-Dhttp.proxyHost=host
-Dhttp.proxyPort=90
101
Copyright ©2009-2015 Moonlit Software Ltd, All rights reserved
3.16.3
Launching queries on start-up
It is possible to launch the client so that it automatically runs a query before showing up. To do this,
use -query argument which is followed by semi-column separated query parameters. None of the
parameters is mandatory (see defaults below). For example, the following command line will display
first 100 exceptions with ERROR and above severity level :
logfaces.exe -query name=Problems;thrown=true;loggerLevel=error
Here is the full list of parameters which can be used:
Parameter
name
Description
Default
Query name, will be displayed on the editor tab
My query
fromTime
Include data from this time (UTC numeric long in msec)
0
toTime
Include data until this time (UTC numeric long in msec)
MAX_LONG
Comma separated list of application names to match
-
Comma separated list of host names to match
-
Comma separated list of logger names to match
-
Text to match in stack traces
-
Text to match in event message
-
True for including only thrown exceptions
false
level
Log4j level, numeric or strings (INFO, ERROR, etc)
TRACE
limit
Maximum numbers of events to fetch
100
Which time zone to use for display
JVM time zone
domains
hosts
loggers
exception
matchMessage
onlyThrown
timeZone
Table 3.1: Command line parameters
102
Copyright ©2009-2015 Moonlit Software Ltd, All rights reserved
3.17 Preferences
Global application preferences are accessible through the File menu and allow the following settings.
In Appearance section you can customize fonts and colors of main application views and editors.
Figure 3.17.1: Appearance
103
Copyright ©2009-2015 Moonlit Software Ltd, All rights reserved
In Application section you can specify whether the client main window should be minimized to tray
or stay minimized in the task bar so that you see the title. When application is minimized to tray,
double clicking on its icon will restore its main window.
Figure 3.17.2: Application preferences
104
Copyright ©2009-2015 Moonlit Software Ltd, All rights reserved
In Connectivity section you can specify the server connection endpoints which apply to a currently
used workspace.
Figure 3.17.3: Connectivity preferences
Support site URL is used for submitting bugs, feature requests or questions – you will be taken to this
URL automatically when selecting Help/Report bug or request feature menu.
105
Copyright ©2009-2015 Moonlit Software Ltd, All rights reserved
In Files section you specify the layout format of log files and external editor to be used throughout
the application. The layout format will be applied to all file related operations when saving data to a
file or copying logs into clipboard. The format is specified in Apache Log4j documentation, you might
want to read about it here.
Figure 3.17.4: File preferences
Note that external text editor can also be used for displaying the source files. By default sources are
displayed in internal source viewer, but you can change this and have your own editor opened
whenever sources are displayed. You can also use ${file} and ${line} variables to construct a
command line for your editor.
106
Copyright ©2009-2015 Moonlit Software Ltd, All rights reserved
In Install/Update section you specify how to obtain software updates. There are several options to
specify the update policy, for example, you can request to check for the updates every time the
application is run and notify when they're available for installation:
Figure 3.17.5: Update preferences
You may as well disable the automatic updates and do it manually from the Help menu on the main
menu bar. When new version of the software will be released, the application will display notification
dialog and ask your permission to install the updates. Normally this will require consequent restart of
the application.
107
Copyright ©2009-2015 Moonlit Software Ltd, All rights reserved
In Levels section you can customize the way log statements look – background or foreground colors
and image icons. Note that some axillary views are using the colors you define here.
Figure 3.17.6: Severity level styles
108
Copyright ©2009-2015 Moonlit Software Ltd, All rights reserved
In MDC names section you will find current MDC names mapped from applications to the logFaces
server. MDC mapping is modified on server side, so in case you need to change the mapping, you
will have to use server administration.
Figure 3.17.7: MDC mapping
When MDC mapping has some names, you will be able to use those names in queries and filters.
For example, when SESSION_ID name is defined, it will appear in data tables column and you will
be able to search events based on this name as well as trace real time data and filter data tables
containing particular value of this attribute.
109
Copyright ©2009-2015 Moonlit Software Ltd, All rights reserved
Named regular expressions are used with log analysis, they define custom categories which then
used to slice and spread the log data. For more details see “Named regular expressions” section.
110
Copyright ©2009-2015 Moonlit Software Ltd, All rights reserved
In Parsers section you will be able to define parsers for processing log files offline (without server).
This feature is designed to exploit client analytical capabilities to display and search directly by
opening any text file provided that its format can be parsed with regular expressions. More details
can be found in “Viewing raw log files” section .
Figure 3.17.8: Parsers
111
Copyright ©2009-2015 Moonlit Software Ltd, All rights reserved
In Perspectives section there are ways to customize real-time perspective views. When real-time
view is opened, there is an option to grab historical data from database before the view gets live –
this will give you the context for current log events coming into the view.
Figure 3.17.9: Perspective preferences
You can limit the size of the view to a certain amount of events, when view gets full it starts rotating
by removing older events. You may want to clear up the view entirely when it fills up. Some
messages may have End Of Line separators – this can be optionally removed to fit the message
nicely into the table.
112
Copyright ©2009-2015 Moonlit Software Ltd, All rights reserved
In Queries section you can specify the way queries are executed against the server. These are
global settings and applied to all queries throughout the client.
Figure 3.17.10: Query preferences
If you ever used logFaces over the public internet or VPN, you might have noticed that large result
sets are slow to get to the client even with a well tuned database. It may get particularly painful with
huge queries containing exception dumps, which is often what people do. This issue is addressed by
two options you can try here - “Stream Query Results” and “Use Compression”.
The slower the client-server connection, the more vivid will be this improvement. Now, instead of
paging the result sets and hitting the server on every page, we do streaming which takes a single
server hit and delivers everything to the client in one shot. The stream may get compressed. Plus it
will bypass many conversions while streaming simple JSON text.
113
Copyright ©2009-2015 Moonlit Software Ltd, All rights reserved
In Source Mapping section you can specify where to look for actual source files. References to
source files (if enabled in your appenders) will be available for every log event as well as exception
stack traces. So, in order to jump into a source code directly from logFaces client, this mapping is
essential.
Figure 3.17.11: Sources mapping
When source file is being resolved, client first tries to locate the file in directories in the order you
specify. If not found, the client will try to locate the file in one of the URL's. The URL must be HTTP
based and contain the base for file locations, client will append relative file path to the URL during
look up.
114
Copyright ©2009-2015 Moonlit Software Ltd, All rights reserved
Tags add domain specific indications to a dull technical log stream. You create a tag by giving it a
short friendly name, color and matching criteria. Logs matching the tag criteria get tagged before they
get displayed. The criteria is the same bunch of rules we use in queries and filters, nothing new here.
Tags are a very powerful tool - they participate in view filters, queries and analytical charts.
Figure 3.17.12: Tags preferences
115
Copyright ©2009-2015 Moonlit Software Ltd, All rights reserved
3.18 Status bar
Status bar displays the following information:
•
current connection state
•
current connection end point
•
current version of logFaces server
•
current license
•
number of database records (click on the icon to refresh the counter)
•
current RAM used on client versus maximum RAM allocated plus manual garbage collector.
Figure 3-3.18.1 Status Bar
116