1
XLConnect
A platform-independent interface to Excel
The XLConnect Package
http://mirai-solutions.com
http://cran.r-project.org/web/packages/XLConnect/index.html
Author of this Vignette:
Anna Maria Ksiezopolska,
Mirai Solutions GmbH
XLConnect Version 0.2-5
March, 2013
Contents
1 Introduction
1.1 Scope and purpose of this document . . . . . . . . . . . . . . . . . . . . . . . . . . . . . . . .
1.2 Introduction to XLConnect . . . . . . . . . . . . . . . . . . . . . . . . . . . . . . . . . . . . .
1
1
1
2 Installation
2.1 Software Requirements . . . . . . . . . . . . . . . . . . . . . . . . . . . . . . . . . . . . . . . .
2.2 Package Installation . . . . . . . . . . . . . . . . . . . . . . . . . . . . . . . . . . . . . . . . .
2
2
2
3 Basic Usage and Examples
3.1 Getting Started . . . . . . . . . . . . . . . . . . . . . . . . . . . . . . . . . . .
3.2 loadWorkbook() - loading/creating an Excel workbook . . . . . . . . . . . . .
3.3 Writing Excel files: basic functions . . . . . . . . . . . . . . . . . . . . . . . .
3.3.1 createSheet() - creating sheets within an Excel workbook . . . . . . .
3.3.2 writeWorksheet() - writing into sheets within an Excel workbook . . .
3.3.3 createName() - creating names within an Excel workbook . . . . . . .
3.3.4 writeNamedRegion() - writing named regions into an Excel workbook
3.3.5 saveWorkbook() - saving a workbook to an Excel file . . . . . . . . . .
3.3.6 writeWorksheetToFile() - writing into sheets of an Excel file . . . . . .
3.3.7 writeNamedRegionToFile() - writing named regions into an Excel file
3.4 Example: writing a sheet . . . . . . . . . . . . . . . . . . . . . . . . . . . . .
3.5 Example: writing a sheet with one call . . . . . . . . . . . . . . . . . . . . . .
3.6 Example: writing a named region . . . . . . . . . . . . . . . . . . . . . . . . .
3.7 Example: writing a named region with one call . . . . . . . . . . . . . . . . .
3.8 Reading Excel files: basic functions . . . . . . . . . . . . . . . . . . . . . . . .
3.8.1 readWorksheet() - reading worksheets of an Excel workbook . . . . . .
3.8.2 readWorksheetFromFile() - reading worksheets of an Excel file . . . .
3.8.3 readNamedRegion() - reading named regions of an Excel workbook . .
3.8.4 readNamedRegionFromFile() - reading named regions of an Excel file
3.9 Example: reading from an Excel sheet . . . . . . . . . . . . . . . . . . . . . .
3.10 Example: reading from an Excel sheet with one call . . . . . . . . . . . . . .
3.11 Example: reading from an Excel named region . . . . . . . . . . . . . . . . .
3.12 Example: reading from an Excel named region with one call . . . . . . . . . .
.
.
.
.
.
.
.
.
.
.
.
.
.
.
.
.
.
.
.
.
.
.
.
2
2
3
3
3
3
3
4
4
4
4
5
5
6
7
7
7
8
8
8
9
9
9
10
4 Advanced Usage and Examples
4.1 Generating an Excel report of currency exchange rates development . . . . . . . . . . . . . .
10
10
i
.
.
.
.
.
.
.
.
.
.
.
.
.
.
.
.
.
.
.
.
.
.
.
.
.
.
.
.
.
.
.
.
.
.
.
.
.
.
.
.
.
.
.
.
.
.
.
.
.
.
.
.
.
.
.
.
.
.
.
.
.
.
.
.
.
.
.
.
.
.
.
.
.
.
.
.
.
.
.
.
.
.
.
.
.
.
.
.
.
.
.
.
.
.
.
.
.
.
.
.
.
.
.
.
.
.
.
.
.
.
.
.
.
.
.
.
.
.
.
.
.
.
.
.
.
.
.
.
.
.
.
.
.
.
.
.
.
.
.
.
.
.
.
.
.
.
.
.
.
.
.
.
.
.
.
.
.
.
.
.
.
.
.
.
.
.
.
.
.
.
.
.
.
.
.
.
.
.
.
.
.
.
.
.
5 What’s new in XLConnect version 0.2-5
16
6 Frequently Asked Questions
6.1 Running out of memory when processing large data sets . . . . . . . . . . . . . . . . . . . . .
6.2 How can I style my output - set fonts, colors etc? . . . . . . . . . . . . . . . . . . . . . . . . .
6.3 I’m getting errors trying to import Excel data . . . . . . . . . . . . . . . . . . . . . . . . . . .
16
16
18
18
7 Contact and Support
19
8 Further Resources and References
19
ii
1
Introduction
1.1
Scope and purpose of this document
This document is a user manual for the XLConnect R package. It is meant to be a top-level introduction
and some of the more advanced features of XLConnect are not presented here. For such details, please
refer to the Reference Manual.
Examples
Any examples presented in this vignette can be found in the XLConnect.R script file, which you can find
in the top level library directory. You can also open the document by using the following command:
edit(file = system.file("XLConnect.R", package = "XLConnect"))
1.2
Introduction to XLConnect
XLConnect is a package that allows for reading, writing and manipulating Microsoft Excel files from within
R. It uses the Apache POI API1 as the underlying interface.
XLConnect allows you to produce formatted Excel reports, including graphics, straight from within R.
This enables automation of manual formatting and reporting processes. Reading and writing named ranges
enables you to process complex inputs and outputs in an efficient way.
XLConnect’s Main Features
•
•
•
•
•
•
•
•
•
•
•
•
•
1
Reading & writing of Excel worksheets (via data.frames)
Reading & writing of named ranges (via data.frames)
Creating, removing, renaming and cloning worksheets
Adding graphics
Specifying cellstyles: data formats, borders, back- and foreground fill color, fill pattern, text
wrapping
Controlling sheet visibility
Defining column width and row height
Merging/unmerging cells
Setting/getting cell formulas
Defining formula recalculation behavior (when workbooks are opened)
Setting auto-filters
Style actions: controlling application of cell styles when writing (e.g. when using templates)
Defining behavior when error cells are encountered
For more information on the Apache POI API, see the http://poi.apache.org/ webpage.
1
2
Installation
2.1
Software Requirements
XLConnect is completely cross-platform and as such runs under Windows, Unix/Linux and Mac (32- and
64-bit). It does not require an installation of Microsoft Excel, or any special drivers.
All you need to use XLConnect are the following:
• R, version 2.10.0 or higher
• Java Runtime Environment (JRE), version 6.0 or higher
2.2
Package Installation
The XLConnect package is part of the Comprehensive R Archive Network (CRAN). It can be easily installed
by using the install.packages() command in your R session:
install . packages ( " XLConnect " )
3
3.1
Basic Usage and Examples
Getting Started
To load the package, use the library() or require() command in your R session:
library ( XLConnect )
Now, you are ready to use XLConnect!
The User Manual (this document) can be opened by entering the following command:
vignette ( " XLConnect " )
The Reference Manual, containing help pages for each function within the package, can be opened by using
the help() command.
help ( XLConnect )
2
3.2
loadWorkbook() - loading/creating an Excel workbook
The loadWorkbook() function loads a Microsoft Excel workbook, so that it can then be further manipulated.
Setting the create argument to TRUE will ensure the file will be created, if it does not exist yet.
Both .xls and .xlsx file formats can be used.
Load an Excel workbook (create if not existing)
loadWorkbook ( filename , create = TRUE )
3.3
3.3.1
Writing Excel files: basic functions
createSheet() - creating sheets within an Excel workbook
createSheet() creates a sheet of a chosen name in the workbook specified as the object argument.
Create a worksheet of a chosen name within a workbook
createSheet ( object , name )
3.3.2
writeWorksheet() - writing into sheets within an Excel workbook
writeWorksheet() writes data into a worksheet (name or index specified as the sheet argument) of an
Excel workbook (object). The startRow and startCol are both 1 by default, meaning that if they are not
explicitly specified, the data will start being filled into the A1 cell of the worksheet.
Write into a worksheet
writeWorksheet ( object , data , sheet , startRow = 1 , startCol = 1 ,
header = TRUE )
3.3.3
createName() - creating names within an Excel workbook
createName() creates a name for a specified formula in a workbook. The overwrite argument lets you
define behaviour if the name already exists. If set to TRUE, the existing name will be removed before creating
a new one. If set to FALSE (default setting), an exception will be thrown.
Create a name for a specified formula within a workbook
createName ( object , name , formula , overwrite )
3
3.3.4
writeNamedRegion() - writing named regions into an Excel workbook
writeNamedRegion() writes a named range into a workbook. The data is assumed to be a data.frame (or
list of data.frames, if multiple named regions are written with one call). The header argument allows you
to specify whether column names should be written.
Write a named range into a workbook
writeNamedRegion ( object , data , name , header )
3.3.5
saveWorkbook() - saving a workbook to an Excel file
saveWorkbook() saves a workbook to the corresponding Excel file and writes the file to disk.
Save a workbook to a chosen Excel file
saveWorkbook ( object )
3.3.6
writeWorksheetToFile() - writing into sheets of an Excel file
writeWorksheetToFile() is a wrapper function, calling loadWorkbook(), createSheet() and saveWorkbook()
functions subsequently. It therefore allows for writing data into worksheets of an Excel file in one call.
The file is the path name of the file to write to. The styleAction argument controls the application of cell
styles when writing to Excel (type ?setStyleAction into the console to see the supported styles). Within
the ’...’ argument, arguments for the writeWorksheet function can be passed.
Write data to an Excel worksheet
writeWorksheetToFile ( file , styleAction = XLC $ STYLE _ ACTION . XLCONNECT , ...)
3.3.7
writeNamedRegionToFile() - writing named regions into an Excel file
writeNamedRegionToFile() is a convenient wrapper function, calling loadWorkbook(), createSheet(),
createName(), writeNamedRegion() and saveWorkbook() functions subsequently, therefore allowing for
writing named regions to an Excel file in one call.
The file is the path name of the file to write to. The name of the named region is passed as the name
argument and the data to write, as data. The header argument specifies if column names should be written.
If you are writing data to a template in which the named region already exists, you don’t need to specify
the formula. Otherwise, if you are creating the file from scratch, supply the named region location as
formula. The styleAction argument controls the application of cell styles when writing to Excel (type
?setStyleAction into the console to see the supported styles).
4
Write data into an Excel named region
writeNamedRegionToFile ( file , data , name , formula = NA , header = TRUE ,
styleAction = XLC $ STYLE _ ACTION . XLCONNECT )
3.4
Example: writing a sheet
Let’s see how the basic functions introduced in this section can be used to create and save an Excel file. We
will use the ChickWeight dataset (built-in R dataset) for this simple example.
The code below first loads the ”XLConnectExample1.xlsx” workbook, using loadWorkbook(). If the workbook does not exist yet, the function creates it (since the create argument is set to TRUE).
Then, via createSheet(), a sheet named ”chickSheet” is created within the workbook.
writeWorksheet() to write the ChickWeight data frame into chickSheet.
We then use
At the end, we use saveWorkbook() to save the XLConnectExample1.xlsx file.
>
>
>
>
>
require(XLConnect)
wb <- loadWorkbook("XLConnectExample1.xlsx", create = TRUE)
createSheet(wb, name = "chickSheet")
writeWorksheet(wb, ChickWeight, sheet = "chickSheet", startRow = 3, startCol = 4)
saveWorkbook(wb)
Please note that only at the point when we call saveWorkbook(), the Excel file is written to disk. All the
previous operations are performed in-memory, which has great performance advantages.
Figure 1: ChickWeight data frame written into the XLConnectExample1.xlsx file
3.5
Example: writing a sheet with one call
The four lines of code presented in the previous example can be replaced with a single call of the
writeWorksheetToFile() function:
5
> require(XLConnect)
> writeWorksheetToFile("XLConnectExample2.xlsx", data = ChickWeight,
+ sheet = "chickSheet", startRow = 3, startCol = 4)
writeWorksheetToFile() loads the workbook, creates the sheet and finally saves the workbook. When you
only need to write one sheet into an Excel file, this is probably the better choice. If you need to write
more sheets, however, using the functions presented in the previous example will be more efficient. This is
because calling writeWorksheetToFile() multiple times will open, write and close the Excel file with each
call. Using the functions in the first example will, in contrast, allow you to open the workbook, do multiple
operations on it and only then close it.
3.6
Example: writing a named region
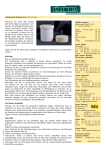
In this example we will show how to write data into a named region. We will use the women dataset.
Similarly as in the example of writing an Excel sheet, we first load the workbook, using loadWorkbook(),
and then create a sheet named ”womenData”, using createSheet().
We then use createName() to produce a named region ”womenName”, starting in the C5 cell of the ”womenData” sheet. Calling writeNamedRegion() writes the name into the workbook. At the end, we use
saveWorkbook() to write the Excel file to disk.
>
>
>
>
>
>
require(XLConnect)
wb = loadWorkbook("XLConnectExample3.xlsx", create = TRUE)
createSheet(wb, name = "womenData")
createName(wb, name = "womenName", formula = "womenData!$C$5", overwrite = TRUE)
writeNamedRegion(wb, women, name = "womenName")
saveWorkbook(wb)
6
Figure 2: women dataset written into womenName named region in the XLConnectExample3.xlsx file
3.7
Example: writing a named region with one call
The writeNamedRegionToFile() function can be used to produce the same result as in the previous example,
with only one function call:
> require(XLConnect)
> writeNamedRegionToFile("XLConnectExample4.xlsx", women,
+
name = "womenName", formula = "womenData!$C$5")
3.8
3.8.1
Reading Excel files: basic functions
readWorksheet() - reading worksheets of an Excel workbook
readWorksheet() allows for reading data from a workbook that has been previously loaded and is passed
as the object argument. The name or index of the worksheet to read from should be passed as the sheet
argument. The startRow and startCol arguments specify the location of the top left corner of data to
be read, while endRow and endCol specify the bottom right corner. If header = TRUE, the first row is
interpreted as column names of the data.frame object read in.
7
If the startRow, startCol, endRow and endCol arguments are not specified, or are passed as <= 0, the
”bounding box” of the data is treated as the corresponding boundaries.
All arguments (except object) are vectorized, which allows for reading of multiple worksheets with one
call.
Read data from a worksheet of an Excel workbook
readWorksheet ( object , sheet , startRow , startCol , endRow , endCol ,
header = TRUE )
3.8.2
readWorksheetFromFile() - reading worksheets of an Excel file
readWorksheetFromFile() allows for reading data from a workbook with one call, without loading the workbook first. The file argument is the path of the file to read from. All arguments of the readWorksheet()
function can be passed within the ’...’ argument.
Read data from a worksheet of an Excel workbook with one call
readWorksheetFromFile ( file , ...)
3.8.3
readNamedRegion() - reading named regions of an Excel workbook
readNamedRegion() can be used for reading data from named region in an Excel workbook. The workbook
must first be loaded and passed as the object argument. Remaining arguments are the name of the named
region and header, specifying whether the first row of data should be interpreted as column names.
Read data from a named region of an Excel workbook
readNamedRegion ( object , name , header = TRUE )
3.8.4
readNamedRegionFromFile() - reading named regions of an Excel file
readNamedRegionFromFile() is a convenient wrapper function which allows for reading named regions from
an Excel file with one call. The function subsequently calls loadWorkbook() and readNamedRegion().
The file argument specifies the path to the Excel file to be read and name - the named region to be read.
The header argument specifies whether the first row of data should be interpreted as column names.
Read data from a named region of an Excel file
readNamedRegionFromFile ( file , name , header = TRUE )
8
3.9
Example: reading from an Excel sheet
In this example, we will show how you can use XLConnect to read from an Excel sheet. For this purpose, we
will use the file created in the example in section 3.4. We set the endRow argument to 10, to limit the result.
We set the rest of arguments specifying boundaries as 0, so that they are automatically determined.
Please note, that alternatively to setting the sheet argument to the name of the sheet we want to read from,
"chickSheet", we could also specify it with the sheet index, as sheet = 1.
>
>
>
+
>
require(XLConnect)
wb = loadWorkbook("XLConnectExample1.xlsx", create = TRUE)
data = readWorksheet(wb, sheet = "chickSheet", startRow = 0, endRow = 10,
startCol = 0, endCol = 0)
data
1
2
3
4
5
6
7
weight Time Chick Diet
42
0
1
1
51
2
1
1
59
4
1
1
64
6
1
1
76
8
1
1
93
10
1
1
106
12
1
1
3.10
Example: reading from an Excel sheet with one call
The readWorksheetFromFile() function can be used to, with only one call, obtain the same result as was
shown in the previous example:
> require(XLConnect)
> data = readWorksheetFromFile("XLConnectExample1.xlsx",
+
sheet = "chickSheet", startRow = 0, endRow = 10,
+
startCol = 0, endCol = 0)
3.11
Example: reading from an Excel named region
In this example, we will show how to use XLConnect’s functions to read from a named region in an Excel
file. We will use the file created in the example in section 3.6.
>
>
>
>
require(XLConnect)
wb = loadWorkbook("XLConnectExample3.xlsx", create = TRUE)
data = readNamedRegion(wb, name = "womenName")
data
1
2
3
4
5
6
7
8
9
10
height weight
58
115
59
117
60
120
61
123
62
126
63
129
64
132
65
135
66
139
67
142
9
11
12
13
14
15
68
69
70
71
72
146
150
154
159
164
3.12
Example: reading from an Excel named region with one call
The result obtained in the previous example can be reproduced by calling the wrapper function:
readNamedRegionFromFile(), witout the necessity of loading the workbook first:
> require(XLConnect)
> data = readNamedRegionFromFile("XLConnectExample3.xlsx", "womenName")
4
Advanced Usage and Examples
4.1
Generating an Excel report of currency exchange rates development
In this example, we will show an example use case of XLConnect: generation of a simple Excel report, showing the recent development of currency exchange rates (EUR, USD, GBP, JPY vs Swiss Franc (CHF)).
For this example we are going to also use some other packages:
• fImport: Rmetrics - Economical and Financial Data Import
• forecast: Forecasting functions for time series
• zoo: S3 Infrastructure for Regular and Irregular Time Series
• ggplot2: An implementation of the Grammar of Graphics
• scales: Provides methods for automatically determining breaks and labels for axes and legends
install . packages ( c (" XLConnect " , " fImport " , " forecast " , " zoo " , " ggplot2 " ,
" scales "))
Loading the required packages:
>
>
>
>
>
>
require(XLConnect)
require(fImport)
require(forecast)
require(zoo)
require(ggplot2) # >= 0.9.3
require(scales)
Preparing the data to be reported:
>
>
>
>
>
+
>
# Currencies we're interested in compared to CHF
currencies = c("EUR", "USD", "GBP", "JPY")
# Fetch currency exchange rates (currency to CHF)
# from OANDA (last 366 days)
curr = do.call("cbind", args = lapply(currencies,
function(cur) oandaSeries(paste(cur, "CHF", sep = "/"))))
# Make a copy for later use
10
>
>
>
+
>
>
>
>
>
>
>
>
>
+
+
>
>
+
+
+
>
>
curr.orig = curr
# Scale currencies to exchange rate on first day in the series (baseline)
curr = curr * matrix(1/curr[1,], nrow = nrow(curr),
ncol = ncol(curr), byrow = TRUE) - 1
# Some data transformations to bring the data into a simple data.frame
curr = transform(curr, Time = time(curr)@Data)
names(curr) = c(currencies, "Time")
# Cyclic shift to bring the Time column to the front
curr = curr[(seq(along = curr) - 2) %% ncol(curr) + 1]
# Number of days to predict
predictDays = 20
# For each currency ...
currFit = sapply(curr[, -1], function(cur) {
as.numeric(forecast(cur, h = predictDays)$mean)
})
# Add Time column to predictions
currFit = cbind(
Time = seq(from = curr[nrow(curr), "Time"],
length.out = predictDays + 1, by = "days")[-1],
as.data.frame(currFit))
# Bind actual data with predictions
curr = rbind(curr, currFit)
Now, let’s write the data to Excel:
>
>
>
>
>
>
>
>
>
>
>
>
>
>
>
>
>
>
>
>
# Workbook filename
wbFilename = "swiss_franc.xlsx"
# Create a new workbook
wb = loadWorkbook(wbFilename, create = TRUE)
# Create a new sheet named 'Swiss_Franc'
sheet = "Swiss_Franc"
createSheet(wb, name = sheet)
# Create a new Excel name referring to the top left corner
# of the sheet 'Swiss_Franc' - this name is going to hold
# our currency data
dataName = "currency"
nameLocation = paste(sheet, "$A$1", sep = "!")
createName(wb, name = dataName, formula = nameLocation)
# Write the currency data to the named region created above
# Note: the named region will be automatically redefined to encompass all
# written data
writeNamedRegion(wb, data = curr, name = dataName, header = TRUE)
# Save the workbook (this actually writes the file to disk)
saveWorkbook(wb)
The figure below illustrates the first few rows of the named region we have written to the Excel file. Please
note, the data in your file will look different, since you will be running the example at a different time.
11
Figure 3: currency named region we have written
Now, we are going to work on the report further, to make it look nicer. Let’s say that for each currency,
we want to highlight the points in time when there was a change of more than 2% compared to the previous
day.
>
>
>
>
>
>
>
>
>
>
>
>
>
>
>
>
>
>
>
>
>
# Load the workbook created above
wb = loadWorkbook(wbFilename)
# Create a date cell style with a custom format for the Time column
# (only show year, month and day without any time fields)
csDate = createCellStyle(wb, name = "date")
setDataFormat(csDate, format = "yyyy-mm-dd")
# Create a time/date cell style for the prediction records
csPrediction = createCellStyle(wb, name = "prediction")
setDataFormat(csPrediction, format = "yyyy-mm-dd")
setFillPattern(csPrediction, fill = XLC$FILL.SOLID_FOREGROUND)
setFillForegroundColor(csPrediction, color = XLC$COLOR.GREY_25_PERCENT)
# Create a percentage cell style
# Number format: 2 digits after decimal point
csPercentage = createCellStyle(wb, name = "currency")
setDataFormat(csPercentage, format = "0.00%")
# Create a highlighting cell style
csHlight = createCellStyle(wb, name = "highlight")
setFillPattern(csHlight, fill = XLC$FILL.SOLID_FOREGROUND)
setFillForegroundColor(csHlight, color = XLC$COLOR.CORNFLOWER_BLUE)
setDataFormat(csHlight, format = "0.00%")
# Index for all rows except header row
12
>
>
>
+
>
>
>
>
+
>
>
>
+
+
+
>
>
>
+
+
>
>
>
>
+
+
+
+
+
+
+
+
>
allRows = seq(length = nrow(curr)) + 1
# Apply date cell style to the Time column
setCellStyle(wb, sheet = sheet, row = allRows, col = 1,
cellstyle = csDate)
# Set column width such that the full date column is visible
setColumnWidth(wb, sheet = sheet, column = 1, width = 2800)
# Apply prediction cell style
setCellStyle(wb, sheet = sheet, row = tail(allRows, n = predictDays),
col = 1, cellstyle = csPrediction)
# Apply number format to the currency columns
currencyColumns = seq(along = currencies) + 1
for(col in currencyColumns) {
setCellStyle(wb, sheet = sheet, row = allRows, col = col,
cellstyle = csPercentage)
}
# Check if there was a change of more than 2% compared
# to the previous day (per currency)
idx = rollapply(curr.orig, width = 2,
FUN = function(x) abs(x[2] / x[1] - 1),
by.column = TRUE) > 0.02
idx = rbind(rep(FALSE, ncol(idx)), idx)
widx = lapply(as.data.frame(idx), which)
# Apply highlighting cell style
for(i in seq(along = currencies)) {
if(length(widx[[i]]) > 0) {
setCellStyle(wb, sheet = sheet, row = widx[[i]] + 1, col = i + 1,
cellstyle = csHlight)
}
# Note:
# +1 for row since there is a header row
# +1 for column since the first column is the time column
}
saveWorkbook(wb)
The illustration below shows the updated swiss franc.xlsx file, with highlighted cells, where day-to-day
change was bigger than 2%. Please note, the data in your file will look different, since you will be running
the example at a different time.
13
Figure 4: Highlighted cells, where day-to-day change bigger than 2%
Further, we will add a graph to our report.
>
>
>
+
>
>
>
+
>
>
>
>
+
+
+
+
>
>
>
>
>
>
+
wb = loadWorkbook(wbFilename)
# Stack currencies into a currency variable (for use with ggplot2 below)
gcurr = reshape(curr, varying = currencies, direction = "long",
v.names = "Value", times = currencies, timevar = "Currency")
# Also add a discriminator column to differentiate between actual and
# prediction values
gcurr[["Type"]] = ifelse(gcurr$Time %in% currFit$Time,
"prediction", "actual")
# Create a png graph showing the currencies in the context
# of the Swiss Franc
png(filename = "swiss_franc.png", width = 800, height = 600)
p = ggplot(gcurr, aes(Time, Value, colour = Currency, linetype = Type)) +
geom_line() + stat_smooth(method = "loess") +
scale_y_continuous("Change to baseline", labels = percent) +
labs(title = "Currencies vs Swiss Franc", x = "") +
theme(axis.title.y = element_text(size = 10, angle = 90, vjust = 0.3))
print(p)
dev.off()
# Define where the image should be placed via a named region;
# let's put the image two columns left to the data starting
# in the 5th row
createName(wb, name = "graph",
formula = paste(sheet, idx2cref(c(5, ncol(curr) + 2)), sep = "!"))
14
>
>
>
>
+
>
# Note: idx2cref converts indices (row, col) to Excel cell references
# Put the image created above at the corresponding location
addImage(wb, filename = "swiss_franc.png", name = "graph",
originalSize = TRUE)
saveWorkbook(wb)
As a result, we obtain the following graph, written into Excel file as ”graph” named region. Please note, your
graph will look different, since you will be running the code at a different time.
Figure 5: Graph showing the currency trends
15
5
What’s new in XLConnect version 0.2-5
We have introduced the following updates in version 0.2-5 of XLConnect:
• Ability to read cached cell values. There is a new argument useCachedValues to methods readWorksheet
and readNamedRegion. This is especially useful for cells with complex formulas that XLConnect
(Apache POI) cannot evaluate and so far would have resulted in NAs being returned. With this new
option XLConnect can now read the cached values of cells.
• There are new arguments keep and drop to readWorksheet and readNamedRegion which allow filtering
of columns before the data is imported to R. This can result in much better performance compared to
importing the full data to R and then doing the subsetting in R.
• String conversions when reading in data from Excel (readWorksheet, readNamedRegion) now respect
the data format of the cells
• Support for numeric missing value identifiers (see method setMissingValue)
• New Vignette ”XLConnect for the Impatient” to get people started quickly
• Added a new function getLastColumn to query the last non-empty column in a worksheet
• The bounding box detection algorithm for readWorksheet has been adapted to better deal with leading
and trailing rows and columns of blank cells. In addition, new arguments autofitRow and autofitCol
have been introduced that allow removal of leading and trailing rows and columns even in case boundaries have been specified by the user. This is useful in situations where the data is expected within
certain given boundaries but the exact location is not known.
• Fixed an issue with writing empty data.frames
• Moved to Apache POI 3.9 (see package XLConnectJars)
• Ensured vignette compatibility with ggplot2 0.9.3
A summary of news in XLConnect 0.2-5 can be found in the NEWS file on CRAN.
6
6.1
Frequently Asked Questions
Running out of memory when processing large data sets
Question:
I’m running out of memory when processing large data sets:
writeNamedRegionToFile ( file = " huge . xls " , data = giant . data . frame ,
namedRegion = " LargeRegion " , formula = " LotsOfData ! A1 " )
Error : OutOfMemoryError ( Java ): Java heap space
Answer:
This is caused by the fact that XLConnect needs to copy your entire data object over to the JVM in order
to write it to a file and the JVM has to be initialized with a fixed upper limit on its memory size. To change
16
this amount, you can pass parameters to the R’s JVM just like you can to a command line Java process via
rJava’s options support:
options ( java . parameters = " - Xmx1024m " )
library ( XLConnect )
Note, however, that these parameters are evaluated exactly once per R session when the JVM is initialized
- this is usually once you load the first package that uses Java support, so you should do this as early as
possible.
If you’re using R from within Eclipse/StatET, the JVM is initialized as soon as the R process is started due
to the required communication between Eclipse and R (the rj/rj-server components). Therefore, you need
to set the Java heap size in Eclipse’s ”Run Configurations” (Run > Run Configurations on top menu) for
the R engine:
Figure 6: Setting the Java heap size in Eclipse:
17
Some general Java advice: The upper limit of the Xmx parameter is system dependent - most prominently,
32bit Windows will fail to work with anything much larger than 1500m, and it is usually a bad idea to set
Xmx larger than your physical memory size because garbage collection and virtual memory do not play well
together.
6.2
How can I style my output - set fonts, colors etc?
Question:
How can I style my output - set fonts, colors etc?
Answer:
XLConnect does not currently allow direct access to low-level formatting options. However, it is possible to assign named cell styles to cells, so the preferred workflow would be to:
1. define some named cell styles in an Excel document (”Format” -> ”Styles” in pre-2007 Excel, ”Cell
styles” on the default pane of Excel 2007 and on)
2. save the document to a file
3. then load this template in XLConnect and use the setCellStyle method to assign the predefined styles:
library ( XLConnect )
w <- loadWorkbook ( " template . xls " )
df <- data . frame ( " foo " )
c <- getCellStyle (w , " FatFont " )
writeWorksheet (w , data = df , sheet =1 , startRow =1 , startCol =1 , header = TRUE )
setCellStyle (w , sheet =1 , row =1 , col =1 , cellstyle = c )
saveWorkbook ( w )
(Unfortunately, this does not work with the XLConnect 0.1-3 due to a bug (#50912) in the version of
Apache POI that it uses. XLConnect 0.1-4 comes with a fixed POI and should no longer suffer from this
issue.)
6.3
I’m getting errors trying to import Excel data
Question:
I’m getting errors trying to import Excel data like:
Unexpected eval type
( org . apache . poi . hssf . record . formula . eval . MissingArgEval )
or
18
Error : NotImplementedException ( Java ): Error evaluating cell Sheet1 ! A1
Answer:
This type of error is triggered when XLConnect can not determine the value of a cell in the region you’re
trying to import. Usually, this happens because Apache POI does not support all possible Excel formulae.
A particular problem are array formulas and array functions such as TRANSPOSE.
There is no direct solution for accessing the values of fields that Apache POI doesn’t know how to compute.
However, if you can live without the cell values and just want to ignore uncomputable cells, have a look at the
onErrorCell function (new in XLConnect 0.1-4) to tell XLConnect that you want to ignore errors.
If you have Excel and are willing to invest some manual effort, you can manually create a static copy, that
can be imported as follows:
• Select the region containing your data
• Edit -> Copy
• Select an empty cell and Edit -> Paste Special
• In the Paste radio group, select Values
You should then be able to import the pasted region without problems.
7
Contact and Support
We are very glad that you are using XLConnect and we would be happy to hear from you!
Please send any bug reports, feature requests or technical inquiries to:
[email protected]
For any other feedback you may have, please contact us at:
[email protected]
You can also follow and contact us on LinkedIn:
http://www.linkedin.com/company/mirai-solutions-gmbh
We encourage you to also follow us on Twitter:
@miraisolutions
We will do our best to reply to your enquires as quickly as possible!
8
Further Resources and References
1. Mirai Solutions website:
http://www.mirai-solutions.com
2. Mirai Solutions blog on Wordpress:
http://miraisolutions.wordpress.com/
19
3. Mirai Solutions LinkedIn Page:
http://www.linkedin.com/company/mirai-solutions-gmbh
4. XLConnect on cran:
http://cran.r-project.org/web/packages/XLConnect/index.html
5. XLConnect on crantastic!:
http://crantastic.org/packages/XLConnect
6. XLConnect on inside-R!:
http://www.inside-r.org/packages/xlconnect
7. The R-Podcast Episode 6: Importing Data from External Sources:
http://www.r-podcast.org/the-r-podcast-episode-6-importing-data-from-external-sources/
8. R Base course by Dr. Roberto Dantas de Pinho, referring to XLConnect (Portuguese):
http://www.slideshare.net/RobertodePinho/curso-bsico-de-r
9. YouTube tutorial by bebilda, on importing and exporting data using XLConnect (Spanish):
http://www.youtube.com/watch?v=84ShWUiq5Mg
10. YouTube tutorial by MrIanfellows, on importing data into R using JGR and XLConnect:
http://www.youtube.com/watch?v=1QA 7ks1pnc
11. XLConnect usage described in the R Programming/Data Management section in Wikibooks
(Reading and saving data > Importing and exporting data > Excel (xls,xlsx)):
http://en.wikibooks.org/wiki/R Programming/Data Management
12. ”How to Read Data from Excel into R”, article by Joris Meys and Andrie de Vries:
http://www.dummies.com/how-to/content/how-to-read-data-from-excel-into-r.html
13. ”R for Dummies”, book by Joris Meys and Andrie de Vries, page 211:
http://tinyurl.com/c54e35m
14. ”Grundlagen der Datenanalyse mit R: Eine anwendungsorientierte Einfuhrung”, book by Daniel Wollschläger:
http://books.google.ch/books?id=tlmcPQ9YZP4C&printsec=frontcover&source=gbs ge summary r&cad=
0#v=onepage&q&f=false
20
Thanks for giving XLConnect a try!
We hope that you enjoy using XLConnect. We would be very happy to hear your feedback about the
package and about this Vignette.
Also, we would be very grateful if you were willing to spare a few minutes and rate the package, or write a
review, on crantastic!
- Mirai Solutions -
21