1
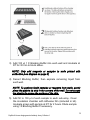
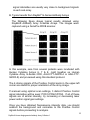
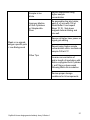
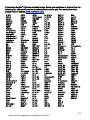
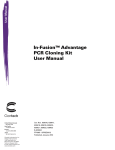
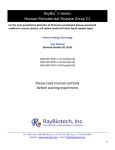
RayBio® Human Angiogenesis Antibody Array 1 (G-Series) Patent Pending Technology User Manual (Revised June 2, 2014) RayBio® Human Angiogenesis Antibody Array G-Series 1 Cat# AAH-ANG-G1-4 RayBio® Human Angiogenesis Antibody Array G-Series 1 Cat# AAH-ANG-G1-8 RayBio® Human Cytokine Antibody Array G-Series Testing Service Cat# AAH-SERV-G Please read manual carefully before starting experiment We provide you with excellent Protein Array systems and services Tel: (Toll Free) 1-888-494-8555 or +1-770-729-2992; Fax: +1-770-206-2393; Website: www.raybiotech.com Email: [email protected] RayBiotech, Inc., the Protein Array Pioneer Company, strives to research and develop new products to meet demands of the biomedical community. RayBiotech’s patent-pending technology allows detection of up to 1,000 cytokines, chemokines and other proteins in a single experiment. Our format is simple, sensitive, reliable, reproducible and cost-effective. Our product offerings include: 1. 2. o o 3. 4. 5. 6. 7. 8. 9. 10. 11. 12. 13. 14. Protein (antigen) Arrays ® RayBio Cytokine Antibody Arrays C Series (Membrane, chemiluminescence detection) G-Series (Glass chip, fluorescence detection) Pathway- and disease-focused antibody arrays o Angiogenesis Antibody Arrays o Apoptosis Antibody Arrays o Atherosclerosis Antibody Arrays o Chemokine Antibody Arrays o Growth Factor Antibody Arrays o Inflammation Antibody Arrays o MMP Antibody Arrays o Obesity Antibody Arrays Quantibody® Multiplex ELISA Arrays ® RayBio L-Series Biotin Label-based Antibody Arrays ® RayBio E-Series Competition-based Antibody Arrays ® RayBio Phosphorylation Antibody Arrays o Receptor Tyrosine Kinases o EGFR and ErbB family (site-specific phosphorylation) Over 1,300 different ELISA kits EIA (Competitive ELISA) kits Cell-based Phosphorylation Assay Over 20,000 different antibodies Recombinant proteins Peptide Recombinant antibodies Protocol for RayBio® Human Angiogenesis Antibody Array G-Series 1 TABLE OF CONTENTS I. Introduction····················································································1 II. Product Information·································································5 A. Storage Recommendations·······································5 B. RayBio® G-Series Glass Chip Layout ·············6 C. Materials Provided ··························································6 D. Additional Materials Required·································6 E. How It Works ········································································7 III. Helpful Tips and General Considerations··············7 A. Preparation and Storage of Samples················7 B. Handling Glass Chips····················································9 C. Incubations and Washes············································9 D. Data Extraction Tips·······················································9 IV. Protocol··························································································10 A. Preparation and Storage of Reagents············10 B. Blocking and Incubations·········································11 C. Fluorescence Detection············································14 V. Interpretation of Results···················································15 A. Explanation of Control Spots·······························15 B. Typical Results using G-Series Arrays·········16 C. Background Subtraction··········································17 D. Normalization of Array Data··································17 E. Threshold of Significance·········································18 VI. Antibody Array Map······························································19 VII. Troubleshooting Guide·······················································20 VIII. Selected References····························································22 RayBio® Cytokine Antibody Arrays are patent-pending technology. RayBio® is the trademark of RayBiotech, Inc. RayBio® Human Angiogenesis Antibody Array G-Series 1 1 I. Introduction New techniques such as cDNA microarrays have enabled us to analyze global gene expression1-3. However, almost all cell functions are executed by proteins, which cannot be studied simply through DNA and RNA techniques. Experimental analysis clearly shows disparity can exist between the relative expression levels of mRNA and their corresponding proteins4. Therefore, analysis of the proteomic profile is critical. The conventional approach to analyzing multiple protein expression levels has been to use 2-D SDS-PAGE coupled with mass spectrometry5,6. However, these methods are slow, expensive, laborintensive and require specialized equipment7. Thus, effective study of multiple protein expression levels can be complicated, costly and time-consuming. Moreover, these traditional methods of proteomics are not sensitive enough to detect most cytokines (typically at pg/ml concentrations). Cytokines, broadly defined as secreted cell–cell signaling proteins distinct from classic hormones or neurotransmitters, play important roles in inflammation, innate immunity, apoptosis, angiogenesis, cell growth and differentiation7. They are involved in most diseases, including cancer, obesity and inflammatory and cardiac diseases. Simultaneous detection of multiple cytokines undoubtedly provides a powerful tool to study cytokines. Regulation of cellular processes by cytokines is a complex, dynamic process, often involving multiple proteins. Positive and negative feedback loops, pleiotropic effects and redundant functions, spatial and temporal expression of or synergistic interactions between multiple cytokines, even regulation via release of soluble forms of membrane-bound receptors, all are common mechanisms modulating the effects of cytokine signaling8-14. As such, unraveling the role of individual cytokines in physiologic or pathologic processes generally requires consideration and detection of multiple cytokines rather than of a single cytokine. RayBio® Human Angiogenesis Antibody Array G-Series 1 2 RayBio® G-Series Cytokine Antibody Arrays have several advantages over detection of cytokines using single-target ELISA: 1. More Data, Less Sample: Antibody arrays provide high-content screening using about the same sample volume as for ELISA. 2. Global View of Cytokine Expression: Antibody array screening improves the chances for discovering key factors, disease mechanisms or biomarkers related to cytokine signaling. 3. Greater Sensitivity: As little as 4 pg/ml of MCP-1 can be detected using the G-Series array format. In contrast, our similar MCP-1 ELISA assay has a sensitivity of 40 pg/ml of MCP-1. 4. Increased Range of Detection: ELISA assays typically detect a concentration range of 100- to 1000-fold, however, RayBiotech arrays can detect IL-2 at concentrations of 25 to 250,000 pg/ml, a range of 10,000-fold. 5. Better Precision: As determined by densitometry, the inter-array Coefficient of Variation (CV) of spot signal intensities is 5-10%, comparing favorably with ELISA testing (CV = 10-15%). The RayBio® G-Series Cytokine Antibody Array is a glass chip that is a highly sensitive approach to simultaneously detect multiple cytokine expression levels from diverse sample types. The experimental procedure is simple and can be performed in any laboratory. The signals from G-Series arrays are detected using a laser scanner. Larger, multi-array G-Series Human Cytokine Antibody Array Kits, such as the G1000, can detect hundreds of cytokines in a single experiment. For example, the Human G1000 arrays can detect up to 120 cytokines, the Human G2000 arrays can detect up to 174 cytokines, and the Human G4000 can detect up to 274 cytokines. RayBiotech, The Protein Array Pioneer Company, introduced the first protein arrays to the market in 2001 and continues to lead in the development of innovative protein array technologies. For a list of publications demonstrating the usefulness of this easy-to-use array format, see Section VIII. RayBio® Human Angiogenesis Antibody Array G-Series 1 3 1. Tang X, Marciano DL, Leeman SE, Amar S. LPS induces the interaction of a transcription factor, LPS-induced TNF-a factor, and STAT6(B) with effects on multiple cytokines. PNAS. 2005;102(14): 5132-5137. 2. Xu Y, Kulkosky J, Acheampong E, et al.. HIV-1-mediated apoptosis of neuronal cells: Proximal molecular mechanisms of HIV-1-induced encephalopathy. PNAS. 2004;101(18): 7070-7075. 3. El-Hage N, Gurwell JA, Singh IN, et. al. Synergistic increases in intracellular Ca(2+), and the release of MCP-1, RANTES, and IL-6 by astrocytes treated with opiates and HIV-1 Tat. Glia. 2005;50(2): 91-106. 4. Oh HS, Moharita A, Potian JG, et al. Bone Marrow Stroma Influences Transforming Growth Factor-β Production in Breast Cancer Cells to Regulate c-myc Activation of the Preprotachykinin-I Gene in Breast Cancer Cells. Cancer Res. 2004;64: 6327-6336. 5. Osorio Y, Ghiasi H. Recombinant Herpes Simplex Virus Type 1 (HSV-1) Codelivering Interleukin-12p35 as a Molecular Adjuvant Enhances the Protective Immune Response against Ocular HSV-1 Challenge. J Virol. 2005;79(6): 3297–3308. 6. Mullick A, Elias M, Picard S, Bourget L, et al. Dysregulated Inflammatory Response to Candida albicans in a C5-Deficient Mouse Strain. Infect Immunity. 2004;72(10): 5868-5876. 7. Maruvada P, Wang W, Wagner PD, Srivastava S. Biomarkers in molecular medicine: cancer detection and diagnosis. Biotechniques. 2005;38: S9-S15. 8. Bartek J, Hodny Z, Lukas J. Cytokine loops driving senescence. Nature Cell Biol. 2008;10: 887-889. 9. Minami K, Yanagawa Y, Iwabuchi K, et al. Negative feedback regulation of T helper type 1 (Th1)/Th2 cytokine balance via dendritic cell and natural killer T cell interactions. Blood. 2005;106: 1685-1693. 10. Ozaki K, Leonard WJ. Cytokine and Cytokine Receptor Pleiotrophy and Redundancy. J Biol Chem. 2002;227: 29355-29358. 11. Ragab AA, Nalepka JL, Bi Y, Greenfield EM. Cytokines synergistically induce osteoclast differentiation: support by immortalized or normal calvarial cells. Am J Physiol Cell Physiol. 2002;283(3): C679-C687. 12. Devalaraja MN, Richmond A. Multiple chemotactic factors: fine control or redundancy. Trends Pharmacol Sci. 1999;20(4): 151-156. 13. Heaney ML, Golde DE. Soluble Cytokine Receptors. Blood. 1996;87(3): 847-857. RayBio® Human Angiogenesis Antibody Array G-Series 1 4 II. Product Information A. Storage Recommendations: For best results, we recommend storing the entire kit at –20°C or –80°C upon arrival and using the kit within 6 months of receipt. RayBiotech warranties this product for 6 months if stored in this manner. Once thawed, store glass chips and 1X Blocking Buffer at –20°C or –80°C and all other component at 4°C. After thawing, the entire kit should be used within 3 months. RayBio® Antibody Array kits are robust and will retain full activity even if accidentally stored at room temperature (RT) for up to 24 hours. B. RayBio® G-Series Glass Chip Layout Antibody Array Antibody Array Blank Blank Barcode Barcode 4 arrays in one glass chip RayBio® Human Angiogenesis Antibody Array G-Series 1 8 arrays in one glass chip 5 C. Materials Provided AAHAAHANG-G1- ANG-G14 8 Item Description AAH-ANG-G1 RayBio® Human Angiogenesis G1 Microarray Glass Chip* 0103002 – HANG-G1 Biotin-Conjugated Anti-Cytokines 1 ea 2 ea 0103004-H 1,500X HiLyte Plus™ 555 Streptavidin-Fluor† 1 ea 1 ea 0103004-B 1X Blocking Buffer 10 ml 20 ml 0103004-W‡ 20X Wash Buffer I ‡ 30 ml 30 ml 0103004-W‡ 20X Wash Buffer II ‡ 30 ml 30 ml 0103004-L 2X Cell Lysis Buffer (optional) 10 ml 10 ml 1 chip with 1 chip with 4 Sub8 Subarrays* arrays* Other Kit Components: Manual, Adhesive Plastic Strips, 30 ml Centrifuge Tube * Kit contains 1 pre-assembled glass chip with either 4 or 8 printed sub-arrays per chip (in sealed plastic envelope) [NOTE: In some cases, 2 chips x 4 sub-arrays/chip may be substituted in kits containing 8 sub-arrays] † This fluor is patent-pending technology from Anaspec, Inc. ‡ Wash Buffers and Detection Buffers are sold as sets D. Additional Materials Required Small plastic boxes or containers Pipettors, pipette tips and other common lab consumables Orbital shaker or oscillating rocker Aluminum foil Gene microarray scanner or similar laser fluorescence scanner (see pages 9 & 15) RayBio® Human Angiogenesis Antibody Array G-Series 1 6 E. How It Works III. Helpful Tips and General Considerations A. Preparation and Storage of Samples 1. General Considerations: Freeze samples as soon as possible after collection. Avoid multiple freeze-thaw cycles. If possible, sub-aliquot your samples prior to initial storage. Spin samples hard (5-10 minutes at 10K to 15K RPM) immediately prior to incubation of samples with array. Optimal sample concentrations may need to be determined empirically based on the signal intensities of spots and background signals obtained. RayBio® Human Angiogenesis Antibody Array G-Series 1 7 Most samples will not need to be concentrated. If concentration is required, we recommend using a spincolumn concentrator with a chilled centrifuge. 2. Recommended Sample Volumes and Dilution Factors NOTE: All sample dilutions should be made using 1X Blocking Buffer. Final sample volume = 50-100 μl per sub-array o o o o Cell Cultured Media: Neat (no dilution needed) Serum & Plasma: 5-fold to 10-fold dilution Most other Body Fluids: Neat or 2-fold to 5-fold dilution Cell and Tissue Lysates: Minimum 5-fold to 10 fold to equal concentrations of total protein in each lysate sample. You must determine the total protein concentration of each lysate/homogenate. We recommend using the BCA method (available from Pierce); it is insensitive to detergents commonly found in lysis buffers. Minimum Recommended Dilution of Lysates (prior to sample incubation): 5-fold to 10 fold with 1X Blocking Buffer. Dilute all lysate samples to the same final concentration of total lysate protein in 1X Blocking Buffer to 100 μl final volume. To start, we recommend using 10-100 μg of total protein in 100 μl of 1X Blocking Buffer (final volume) per sub-array. Optimal amounts of total lysate protein may range from 5-500 μg per sub-array. Based upon background and spots intensities, you may increase or decrease the amount of protein used in subsequent experiments. Other Liquid Sample Types: Most often Neat or 2-fold to 5-fold. However, optimal dilutions should be determined empirically. 3. Sample Preparation For tips on sample preparation, please visit our Website: http://www.raybiotech.com/Tech-Support/SampleTips.pdf B. Handling Glass Chips Do not remove glass chip from assembly until Step 16. RayBio® Human Angiogenesis Antibody Array G-Series 1 8 Hold the slides by edges only; do not touch the surface. Handle all buffers and slides with powder-free gloves. Dry glass chip completely before proceeding to Step 3. Handle and dry glass chip in clean environment. Avoid breaking glass chip when removing the chamber assembly. C. Incubations and Washes Cover incubation chamber with adhesive film (included in kit) to prevent evaporation, particularly during incubation or wash steps >2 h or with liquid volumes <100 μl per well. Perform all incubation and wash steps under gentle rotation or rocking motion (~0.5 to 1 cycle/s). Wash steps in Wash Buffer II and all incubation steps may be performed overnight at 4°C. o Overnight sample incubations are the most effective at increasing sample spot intensities. Avoid cross-contamination of samples to neighboring wells To remove Wash Buffers and other reagents from chamber wells, you may invert the Glass Chip Assembly to decant, and aspirate the remaining liquid. In Wash Steps 6, 12 and 15, you may gently flush wells several times using a wash bottle filled with Wash Buffer I. D. Scanning and Data Extraction Tips: For tips on scanning and data extraction, please visit our Website: http://www.raybiotech.com/Tech-Support/ScanningTips.pdf For a list of recommended scanners, please visit our Website: http://www.raybiotech.com/TechSupport/Laser_Scanners_for_Glass_Slide_Arrays.pdf. See also page 18 of this manual. RayBio® Human Angiogenesis Antibody Array G-Series 1 9 IV. Protocol A. Preparation and Storage of Reagents NOTE: During this protocol, prepare reagents immediately prior to use and keep working dilutions of all reagents on ice at all times. 1. Blocking Buffer is supplied at 1X concentration. No dilution is required. 2. Wash Buffers I and II are supplied at 20X concentration. a). For each glass chip (4 or 8 sub-arrays/chip), dilute 6 ml of 20X concentrate with deionized H20 to a final volume of 120 ml each of Wash Buffer I & Wash Buffer II. b). Wash buffer reagents at working dilution (1X) can be stored at 4°C for up to 1 month. Stock solutions at 20X can be stored 4°C for up to 3 months. 3. Biotin-conjugated Anti-Cytokines are supplied at high concentration in a small liquid bead (typically ~2-5 μl). a). Spin down the tube prior to reconstitution, as the concentrated liquid bead may have moved to the top of the tube during handling. b). Prepare stock reagent by adding 300 μl 1X Blocking Buffer to Biotin-Conjugated Anti-Cytokines. Mix well. c). 1X Biotin-Conjugated Anti-Cytokines may be stored for 2-3 days at 4°C. 4. Streptavidin-Fluor is supplied at 1500x concentration. a). Mix the tube containing 1500X Streptavidin-Fluor well before use, as precipitants may form during storage. b). Add 100 μl of 1X Blocking Buffer to tube containing 1500X Streptavidin-Fluor. Mix well. c). Quantitatively transfer all of Streptavidin-Fluor reagent from the original tube to a larger one, and dilute with 1X Blocking Buffer to a final volume of 1500 μl (ie, 1.5 ml). d). Wrap tube containing Streptavidin-Fluor with aluminum foil. e). This working dilution can be stored for 3-5 days at 4°C. RayBio® Human Angiogenesis Antibody Array G-Series 1 10 B. Blocking and Incubations NOTE: Please carefully read Section III of this manual before proceeding NOTE: Prepare all reagents immediately prior to use as described above (Section IV.A) and before proceeding. 1) Remove the package containing the glass chip assembly from the freezer. Place unopened package on the benchtop and allow the glass chip assembly to equilibrate to room temperature (RT), approx. 15 min. Open package, remove the glass chip assembly and place in laminar flow hood to dry for 12 hours. NOTE: Be sure glass chip is completely dry before proceeding. 2) If necessary, assemble the glass chip into incubation chamber and frame as shown below and on page 11 and 12. (Note: if you slide is already assembled, you can proceed directly to Step 3). RayBio® Human Angiogenesis Antibody Array G-Series 1 11 3) Add 100 μl 1 X Blocking Buffer into each well and incubate at RT for 30 min to block slides. NOTE: Only add reagents or samples to wells printed with antibodies (see diagram on page 5) 4) Decant Blocking Buffer; then aspirate remaining liquid from each well. NOTE: To aspirate liquid samples or reagents from wells, gently place the pipette tip only in the corners of the well. Do not scrape the pipette tip across the surface of the chip. 5) Add 50 to 100 μl of each sample to each sub-array. Cover the incubation chamber with Adhesive film (included in kit). Incubate arrays with sample at RT for 2 hours. Dilute sample using 1X Blocking Buffer if necessary. RayBio® Human Angiogenesis Antibody Array G-Series 1 12 6) Remove adhesive film, and carefully aspirate samples from subarrays, touching only the corners with your pipette tip. 7) Wash 3 x 2 min with 150 μl 1X Wash Buffer I at RT. Be sure to completely remove sample and Wash Buffer each time and use fresh buffer for each wash. Decant final wash solution before proceeding to next step. NOTE: Try to prevent solution from flowing into neighboring wells. 8) Obtain a clean container (eg, pipette tip box or slide staining jar) and place glass chip assembly into the container. Add enough 1X Wash Buffer I to submerge the entire glass chip with frame intact (approx. 30-50 ml) and remove all bubbles in wells. Wash 10 min at RT with gentle rocking or shaking. 9) Remove assembled glass chip from container and invert it to decant liquid. Decant buffer from container and replenish with 1X Wash Buffer I. Submerge the entire glass chip assembly and wash 10 min at RT with gentle rocking or shaking. 10) Remove assembled glass chip from container and invert to decant liquid. Decant buffer from container and repeat Steps 8 & 9 with Wash Buffer II. 11) Remove assembled glass chip from container and invert it to decant liquid, then carefully aspirate wash buffer from wells, touching only the corners with your pipette tip. 12) Add 70 μl of 1X Biotin-conjugated Anti-Cytokines to each subarray. Cover incubation chamber with Adhesive film (included in kit). Incubate at RT for 2 hours with gentle rocking or shaking. 13) Carefully aspirate all of the Biotin-conjugated Anti-Cytokine reagent. Wash as described in Step 7 above, first with Wash Buffer I then with Wash Buffer II, making sure to completely remove buffer between washes and after final wash. RayBio® Human Angiogenesis Antibody Array G-Series 1 13 14) Add 70 μl of 1X Streptavidin-Fluor to each sub-array. Cover the incubation chamber with Adhesive film (included in kit), then cover entire assembly with aluminum foil to avoid exposure to light or incubate in dark room. Incubate at RT for 2 hours with gentle rocking or shaking. 15) Remove aluminum foil and adhesive film. Carefully aspirate the Streptavidin-Fluor reagent. Wash as described in Step 7 above, first with Wash Buffer I then with Wash Buffer II, making sure to completely remove buffer between washes and after final wash. 16) Remove the glass chip from the frame assembly. Place the whole chip in 30 ml centrifuge tube provided, or slide staining jar. Add enough Wash Buffer I to cover the whole slide (about 20 ml) and gently rock or shake at RT for 10 min. 17) Decant buffer and repeat wash as described in Step 16 (1 x 10 min with Wash Buffer I). 18) Decant buffer and repeat wash as described in Step 16, but this time using Wash Buffer II for only 2-3 minutes. 19) Decant buffer, remove the glass chip from the tube, then gently rinse the slide with de-ionized H2O using a plastic wash bottle. 20) Remove water droplets by applying suction gently with a pipette tip. NOTE: Be careful not to touch the array portions of the slide with your pipette tip, only touch the sides of the slide. C. Obtaining Fluorescent Signal Intensities: 21) Allow glass chip to dry in a laminar flow hood for 20 minutes or until slide is completely dry. Place chip under an aluminum foil tent to protect it from light. Make sure the slides are absolutely dry before scanning or storage. RayBio® Human Angiogenesis Antibody Array G-Series 1 14 22) You may proceed immediately to scanning (Step 22), or you may store the slide at -20 °C in the centrifuge tube provided or at RT and to scan at a later time. Note: Unlike most Cy3 fluors, the HiLyte Plus™ Fluor 555 used in this kit is very stable at RT and resistant to photobleaching on completed glass chips. However, please protect glass chips from strong light and temperatures above RT. 23) Scan the glass chip with a laser scanner (such as Innopsys’ InnoScan®) using cy3 or “green” channel (excitation frequency = 532 nm). For tips on scanning, visit our Website: http://www.raybiotech.com/Tech-Support/ScanningTips.pdf NOTE: If you do not have a laser scanner, for a nominal fee you can send your slide to us for scanning and data extraction, and we will return the results to you. Also, using alternate protocols, RayBio® G-Series arrays are compatible with Li-Cor’s Odyssey and Gentel BioScience’s APiX scanners. For more information, contact these vendors or RayBiotech. V. Interpretation of Results: A. Explanation of Controls Spots Positive Controls (POS1, POS2, POS3) are equal amounts of biotinylated IgGs printed directly onto the array. All other variables being equal, the Positive Control intensities will be the same for each sub-array This allows for normalization based upon the relative fluorescence signal responses to a known control, much as “housekeeping” genes or proteins are used to normalize results in PCR or Western blots, respectively. Negative Control (NEG) spots are a protein-containing buffer (used to dilute antibodies printed on the array). Their signal intensities represent non-specific binding of Biotin-conjugated anti-Cytokines and/or Streptavidin-Fluor. Negative control RayBio® Human Angiogenesis Antibody Array G-Series 1 15 signal intensities are usually very close to background signals in each sub-array. B. Typical results from RayBio® G-Series Antibody Arrays The following figure shows typical results obtained using RayBio® Antibody Array G-Series Arrays. The images were captured using a GenePix 4000B scanner. In this example, sera from several patients were incubated with Human Cytokine Arrays 6, 7 & 8, (sold together as Human Cytokine Array G-Series 2000, AAH-CYT-G2000-4 or AAH-CTYG2000-8) and processed using this standard protocol. The 6 strong signals of the Positive Control spots in the upper-left corner are useful for proper orientation of the array image. If scanned using optimal scan settings, 3 distinct Positive Control signal intensities will be seen: POS1>POS2>POS3. If all of these signals are of similar intensity, try increasing or decreasing laser power and/or signal gain settings. Once you have obtained fluorescence intensity data, you should subtract the background and normalize to the Positive Control signals before proceeding to analysis. RayBio® Human Angiogenesis Antibody Array G-Series 1 16 C. Background Subtraction: Most laser fluorescence scanner software have an option to automatically measure the local background around each spot. As with spot signal intensities, we recommend using MEDIAN background signals. If your resulting fluorescence signal intensity reports do not include these values (eg, a column labeled as “MED532-B532”), you may need to subtract the background manually or change the default settings on your scanner’s data report menu. D. Normalization of Array Data: To normalize signal intensity data, one sub-array is defined as "reference" to which the other arrays are normalized. This choice can be arbitrary. For example, in our Analysis Tool Software, the array represented by data entered in the left-most column each worksheet is the default “reference array.” You can calculate the normalized values as follows: X(Ny) = X(y) * P1/P(y) Where: P1 = mean signal intensity of POS spots on reference array P(y) = mean signal intensity of POS spots on Array "y" X(y) = mean signal intensity for spot "X" on Array "y" X(Ny)= normalized signal intensity for spot "X" on Array "y" The RayBio® Analysis Tool software is available for use with data obtained using RayBio® G-Series Arrays. You can copy and paste your signal intensity data (with and without background) into the Analysis Tool, and it will automatically normalize signal intensities to the Positive Controls. To order the Analysis Tool, please contact us at +1-770-729-2992 or [email protected] for more information. RayBio® Human Angiogenesis Antibody Array G-Series 1 17 E. Threshold of significant difference in expression: After subtracting background signals and normalization to Positive controls, comparison of signal intensities for antigen-specific antibody spots between and among array images can be used to determine relative differences in expression levels of each analyte (ie, protein detected) between samples or groups. Any ≥1.5-fold increase or ≤0.65-fold decrease in signal intensity for a single analyte between samples or groups may be considered a measurable and significant difference in expression, provided that both sets of signals are well above background (Mean background + 2 standard deviations, accuracy ≈ 95%). NOTE: In the absence of an external standard curve for each analyte, there is no means of assessing absolute or relative concentrations of different analytes in the same sample using immunoassays. If you wish to obtain quantitative data (ie, concentrations of the various analytes in your samples), try using our Quantibody® Multiplex ELISA arrays instead. Data Extraction Tips: Ignore any comet tails Define the area for signal capture for all spots as 110-120 micron diameter, using the same area for every spot. Use median signal value, not the total or the mean Use local background correction (also median value). Exclude obvious outlier data in its calculations. Scan all slides at same PMT RayBio® Human Angiogenesis Antibody Array G-Series 1 18 VI. RayBio® Human Angiogenesis Antibody Array G-Series 1 Map: Detects 20 human angiogenic factors in one experiment A B C D E F G H 1 POS1 POS2 POS3 NEG NEG ANG EGF ENA-78 2 POS1 POS2 POS3 NEG NEG ANG EGF ENA-78 3 bFGF GRO IFN-γ IGF1 IL-6 IL-8 Leptin MCP1 4 bFGF GRO IFN-γ IGF1 IL-6 IL-8 Leptin MCP1 5 PDGF-BB PLGF RANTES TGF-β1 TIMP1 TIMP2 THPO VEGF-A 6 PDGF-BB PLGF RANTES TGF-β1 TIMP1 TIMP2 THPO VEGF-A 7 VEGF-D NEG NEG NEG NEG NEG NEG NEG 8 VEGF-D NEG NEG NEG NEG NEG NEG NEG Notes on Array Map: ANG = Angiogenin, bFGF = basic FGF (FGF2), PLGF = Placental Growth Factor, THPO = Thrombopoietin GRO detects GRO-α, GRO-β and GRO-γ (CXCL1, CXCL2 & CXCL3) TGF-β1 reacts only with active form of TGF-β1 VEGF-A detects VEGF (165 aa) and VEGF (121 aa) RayBio® Human Angiogenesis Antibody Array G-Series 1 19 VII. Troubleshooting guide Problem Cause Recommendation No signal for any spots, including Positive Controls Global detection failure Adjust scanner settings or reassemble chip into holder, wash slide 2 x 5 min with 150 μl Wash Buffer II and repeat Steps 12-19. Similar signal intensities for POS1/2/3 Improper laser power and/or PMT setting Repeat scan using higher and/or lower laser power or PMT settings Incomplete washes Carefully follow wash protocols, and/or increase wash times High background signals Sample concentration is Repeat using lower sample too high concentration Fluor and/or AntiCytokines are too concentrated Review protocol for dilution of reagents Bubbles present on chip Be sure to completely remove during incubations all bubbles from chip surface Uneven background and/or missing spots Randomly scattered highintensity spots Evaporation during incubation steps Cover chamber assembly during washes and incubations Pooling/precipitation of sample or reagent; Incomplete washes. Cover chamber assembly and use a rocker or shaker during washes and incubations; carefully follow wash protocols. Sample is too concentrated Repeat experiment using more dilute sample Dust or other particulates Dry slides in laminar flow hood and/or use clean containers and powder-free gloves. RayBio® Human Angiogenesis Antibody Array G-Series 1 20 Sample is too dilute Repeat experiment using higher sample concentration Improper dilution of Anti-Cytokines or StreptavidinFluor Re-assemble chip into holder, wash 2 x 5 min with 150 μl Wash Buffer II and repeat Steps 12-19. Spin down reagents before diluting and mix well. Rescan at higher laser power or signal gain setting Weak or no signals antigen-specific pots + Low Background Repeat using higher sample concentration and/or incubate with sample O/N at 4°C Other Tips Increase concentration of and/or length of incubation with Biotin-conjugated Anti-Cytokine (+ add’l large volume wash following Biotin-Ab incubation Review proper storage conditions for kit components RayBio® Human Angiogenesis Antibody Array G-Series 1 21 III. Selected References Citing RayBio® Human G-Series Arrays 1. Mamlouk O, Balagurumoorthy P, Wang K, Adelstein SJ, Kassis AI. Bystander effect in tumor cells produced by iodine-125 labeled human lymphocytes. Intl J Radiation Biol. 2012. DOI:10.3109/09553002.2012.702297. 2. Kocaoemer A, Kern S, Kluter H, Bieback K. Human AB serum and thrombin-activated platelet-rich plasma are suitable alternatives to fetal calf serum for the expansion of mesenchymal stem cells from adipose tissue. Stem Cells. 2007; 25: 1270-1278 3. Ye Z, Lich JD, Moore CB, Duncan JA, Williams KL, Ting JPY. ATP Binding by Monarch-1/NLRP12 is critical for its inhibitory function. Mol Cell Biol. 2008;28:1841-1850.. 4. Sommer G, Kralisch S, Stangl V, Vietzke A, et al. Secretory products from human adipocytes stimulate proinflammatory cytokine secretion from human endothelial cells. J Cell Biochem. 2009;106(4): 729–737. 5. Bouazza B, Kratassiouk G, Gjata B, Perie S, et al. Analysis of growth factor expression in affected and unaffected muscles of oculo-pharyngeal muscular dystrophy (OPMD) patients: A pilot study. Neuromusc Disorders. 2009;19(3): 199-206. 6. Dumortier J, Streblow DN, Moses AV, Jacobs JM, et al. Human Cytomegalovirus Secretome Contains Factors That Induce Angiogenesis and Wound Healing. J Virol. 2008; 82(13): 6524-655. 7. Keren Z, Braun-Moscovici Y, Markovits D, Rozin A, Nahir M, et al. Depletion of B lymphocytes in rheumatoid arthritis patients modifies IL-8-anti-IL-8 autoantibody network. Clin Immunol. 2009. doi:10.1016/j.clim.2009.07.001 RayBio® Human Angiogenesis Antibody Array G-Series 1 22 8. Rovin BH, Song H, Hebert LA, Nadasdy T, et al. Plasma, urine, and renal expression of adiponectin in human systemic lupus erythematosus. Kidney Int. 2005;68: 18251833. 9. Duncan JA, Gao X, Huang MT-H, O'Connor BP, Thomas CE, et al. Neisseria gonorrhoeae Activates the Proteinase Cathepsin B to Mediate the Signaling Activities of the NLRP3 and ASCContaining Inflammasome. J Immunol. 2009;182: 6460-6469. 10. Pukstadad BS, Ryana L, Floa TH, Stenvika J, et al. Nonhealing is associated with persistent stimulation of the innate immune response in chronic venous leg ulcers. J Dermatol Sci. 2009;59(2): 115-122. 11. Park JE, Tan HS, Datta A, Lai RC, et al. Hypoxic Tumor Cell Modulates Its Microenvironment to Enhance Angiogenic and Metastatic Potential by Secretion of Proteins and Exosomes. Mol Cell Proteom. 2010;9: 1085-1099. 12. Streblow DN, Dumortier J, Moses AV, Orloff SL, Nelson JA. Mechanisms of Cytomegalovirus-Accelerated Vascular Disease: Induction of Paracrine Factors That Promote Angiogenesis and Wound Healing. Shenk TE, Stinski MF, eds. Current Topics in Microbiology and Immunology: Human Cytomegalovirus. Berlin, Heidelberg, Germany: Springer. 2008;325: 397-415. 13. Nolting T, Lindecke A, Koutsilie E, Maschke M, et al. Measurement of soluble inflammatory mediators in cerebrospinal fluid of human immunodeficiency virus–positive patients at distinct stages of infection by solid-phase protein array. J Neruovirol. 2009;15(5-6): 390-400. 14. Pannebaker C, Chandler HL, Nichols JJ. Tear proteomics in keratoconus. Mol Vision. 2010;16: 1949-1957. RayBio® Human Angiogenesis Antibody Array G-Series 1 23 Customized RayBio® Cytokine Antibody Arrays. Select your cytokines of interest from the following list, and we will produce the customized array for you. For more information, please visit our website, www.raybiotech.com. 4-1BB ACE-2 Acrp30 Activin A Adiposin Adipsin AgRP ALCAM α-Fetoprotein Amphiregulin Angiogenin Angiopoietin-1 Angiopoietin-2 Angiostatin ANGPTL4 Axl B7-1 BCAM BCMA BDNF β2M β IG-H3 bFGF BLC BMP-4 BMP-5 BMP-6 BMP-7 β-NGF BTC CA125 CA15-3 CA19-9 CA IX Cardiotrophin-1 Cathepsin S CCL14a CCL21 CCL-28 CD14 CD23 CD30 CD40 CD40 Ligand CD80 CEA CEACAM-1 CK b 8-1 CNTF Cripto CRP CTACK CXCL16 DAN Decorin Dkk-1 Dkk-3 Dkk-4 DPPIV DR6 Dtk E-Cadherin EDA-A2 EGF EGFR EG-VEGF ENA-78 Endoglin Eotaxin Eotaxin-2 Eotaxin-3 Ep CAM ErbB2 ErbB3 EPO R E-Selectin Fas Fas Ligand Fcr RIIB/C Ferritin FGF-4 FGF-6 FGF-6 FGF-7 FGF-9 Fit-3 Ligand FLRG Follistatin Fractalkine FSH Furin Galectin-7 GCP-2 G-CSF GDF-15 GDNF GITR GITR Ligand GM-CSF GRO GROα GH HB-EGF HCC-4 hCG (intact) HGF HVEM I-309 ICAM-1 ICAM-2 ICAM-3 IFNγ IGF-1 SR IGFBG-1 IGFBP-2 IGFBP-3 IGFBP-4 IGFBP-6 IGF-I IGF-I SR IGF-II IL-1α IL-1β IL-1 R II IL-1 R4/ST2 IL-1 RI IL-1 sRI IL-10 IL-10 Rα IL-10 Rβ IL-11 IL-12 IL-12 p40 IL-12 p70 IL-13 IL-13 Rα-2 IL-13 RI IL-15 IL-16 IL-17 IL-17B IL-17C IL-17F IL-17R IL-18 BPα IL-18 Rβ IL-1ra IL-2 IL-2 Rβ IL-2 Rγ IL-2 Ra IL-21R IL-22 IL-28A IL29 IL-3 IL-31 IL-4 IL-5 IL-5 Rα IL-6 IL-6 sR IL-7 IL-8 IL-9 Insulin IP-10 I-TAC LAP Leptin Leptin R LIF LIGHT LIMPII L-Selectin LH Lymphotactin LYVE-1 Marapsin MCP-1 MCP-2 MCP-3 MCP-4 M-CSF M-CSF R MDC MICA MICB MIF MIG MIP-1α MIP-1β RayBio® Human Angiogenesis Antibody Array G-Series 1 MIP-1δ MIP-3α MIP-3β MMP-1 MMP-10 MMP-13 MMP-2 MMP-3 MMP-7 MMP-8 MMP-9 MPIF-1 MSPα NAP-2 NCAM-1 NGF R Nidogen-1 NrCAM NRG1-β1 NT-3 NT-4 Oncostatin M Osteopontin OPG PAI-I PARC PDGF Rα PDGF Rβ PDGF-AA PDGF-AB PDGF-BB PECAM-1 PIGF PF4 Procalcitonin Prolactin PSA-free PSA-total RAGE RANK RANTES Resistin S-100b SAA SCF SCF R SDF-1 SDF-1β SAA sgp130 Shh N Siglec-5 Siglec-9 ST2 sTNF RI sTNF RII TACE TARC TECK TGFα TGFβ1 TGFβ2 TGFβ3 TPO Thyroglobulin Tie-1 Tie-2 TIM-1 TIMP-1 TIMP-2 TIMP-4 TNFα TNFβ TNFRSF21 TNFRSF6 TRAIL R2 TRAIL R3 TRAIL R4 Trappin-2 TREM-1 TSH TSLP Ubiquitin uPAR VCAM-1 VE-Cadherin VEGF VEGF R2 VEGF R3 VEGF-C VEGF-D XEDAR 24 Testing Services: RayBiotech offers full testing services using any of our Array, ELISA or EIA products, including customized products. Just send your samples, and we will send you the results. Custom Services: 1. 2. 3. 4. 5. 6. 7. 8. 9. 10. Customized Antibody and Protein Arrays Customized Phosphorylation Arrays Peptide synthesis Peptide arrays Recombinant protein and antibody production ELISA EIA Assay development Biostatistical & Bioinformatic Analysis Peptoid Synthesis & Library Screening Technology Transfer Program: Have you developed technologies or reagents of interest to the scientific and research community? RayBiotech can help you commercialize your technologies, reagents and your dreams. RayBio® Human Angiogenesis Antibody Array G-Series 1 25 RayBio® Cytokine Antibody Arrays technology developed by RayBiotech. are patent-pending This product is intended for research only and is not to be used for clinical diagnosis. Our produces may not be resold, modified for resale, or used to manufacture commercial products without written approval by RayBiotech, Inc. Under no circumstances shall RayBiotech be liable for any damages arising out of the use of the materials. Products are guaranteed for 6 months from the date of purchase when handled and stored properly. In the event of any defect in quality or merchantability, RayBiotech’s liability to buyer for any claim relating to products shall be limited to replacement or refund of the purchase price. RayBio® is a registered trademark of RayBiotech, Inc. HiLyte Plus™is a trademark of Anaspec, Inc. InnoScan® is a registered trademark of Innopsys, Inc. This product is for research use only. ©2012 RayBiotech, Inc. RayBio® Human Angiogenesis Antibody Array G-Series 1 26