1
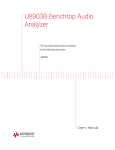
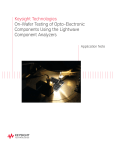
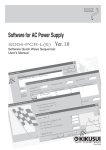
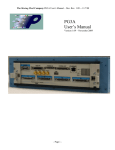
Keysight Technologies
8 Hints for Solving Common Debugging
Problems with your Logic Analyzer
Application Note
Table of Contents
Reducing the Complexity in your Job .....................................................................................3
Acquiring Data from a Multiplexed Address/Data Bus...........................................................4
What to Do when your Target System is Functioning Normally, but the
Data You Capture Does Not Appear to be Valid.................................................................6
Using a “Golden Trace” to Troubleshoot Unexpected System Changes................................8
Using PC-Hosted Mode to Remotely Control your Logic Analyzer........................................9
How to Capture Data Before a System Crash.........................................................................10
Analyzing Serial Data with a Logic Analyzer...........................................................................11
Generating Files for a Keysight Pattern Generator Using Third-Party EDA Tools.................13
Selecting the Right Probe for your Logic Analyzer..................................................................16
Logic Analyzer Families to Help You Get your Job Done........................................................17
Related Literature.....................................................................................................................18
03 | Keysight | 8 Hints for Solving Common Debugging Problems with your Logic Analyzer - Application Note
Reducing the Complexity in your Job
Logic analyzers are complex instruments. They have to be in order to handle the
capabilities of today’s advanced electronic devices. Unfortunately, the complexity of
logic analyzers can cause you headaches when you need critical information about your
digital designs.
Yet using a logic analyzer is frequently the best way, and sometimes the only way, to
understand how your device is working, or why it’s not. So, if you need to look at your
logic in state mode, for example, or examine timing relationships on a large number of
channels, you might reluctantly pull out your logic analyzer. Sound familiar?
We’d like to help you overcome your reluctance by helping you build the measurement
expertise you need to do your job. That’s why we’ve gathered and published these hints.
They are not intended to be comprehensive tutorials. They are suggestions intended to
help you understand how you can use logic analyzers most effectively and how they can
help you save time in getting your job done.
04 | Keysight | 8 Hints for Solving Common Debugging Problems with your Logic Analyzer - Application Note
Acquiring Data from a Multiplexed Address/Data Bus
Many engineers who design with modern microprocessors and micro-controllers use
multiplexed buses in order to conserve pins and reduce cost. Engineers used this
technique in early processors such as the Intel 8088, and they’re using it in current
processors such as custom-cored ASICs. In order to effectively capture the information
you need in this complex design arena, you need a logic analyzer with specialized
features.
Today’s logic analyzers offer specific clocking capabilities to handle the acquisition
of address and data from multiplexed buses. As shown in Figure 1, you can capture
information on two different clock events, one when the address is valid and another
when the data is valid. Because the bus is multiplexed, you only need one set of logic
analyzer probes. You can connect the logic analyzer probes to the multiplexed address/
data bus either with individual probes or through a probing adapter.
Since the sample clocks are coming from the device under test, set the analyzer to
“State” or “Synchronous” mode.
The key to making this measurement is to determine the clock or clock combination for
the address phase and for the data phase. If these are not different, the bus is not really
multiplexed.
As an example, in the 16800 and 16900 Series logic analyzers from Keysight
Technologies, Inc., you can go to the logic analysis Overview window and on the logic
analysis module, click the Sampling Setup icon. On this screen, you can set your logic
analyzer to Master/Slave/Demux clocking mode, as shown in Figure 2. This screen also
allows you to specify the logic for the master and slave clocks. Then go to the Bus/Signal
Setup tab, shown in Figure 3, and assign the pins for your logic analyzer probe.
Note that your logic analyzer’s setup and hold requirements in demultiplex clocking
mode may be different from those in normal clocking mode. Check your logic analyzer’s
specifications for details.
Address clock specification: CLK rising AND ADS# = low (true)
Data clock specification: CLK rising AND DS# = low (true)
ADS
DS
ADDR
ADDR
Figure 1. An example of a multiplexed bus
DATA
BUS
05 | Keysight | 8 Hints for Solving Common Debugging Problems with your Logic Analyzer - Application Note
Acquiring Data from a Multiplexed Address/Data Bus (Continued)
Select Master/Slave/Demux mode
Read address here
Read data here
Figure 2. Sampling clocking mode
Assign pins here
Figure 3. Formatting clock mode
06 | Keysight | 8 Hints for Solving Common Debugging Problems with your Logic Analyzer - Application Note
What to Do when your Target System is Functioning Normally, but the Data You
Capture Does Not Appear to be Valid
This situation occurs in several circumstances:
1. When your logic analyzer sampling thresholds do not match your target system’s
switching characteristics.
2. When you’re in state sampling mode and your target system does not meet the
setup and hold times required by your logic analyzer.
3. When the target system generates excessive noise (ground bounce, simultaneous
switching noise or crosstalk), causing the analyzer to sample incorrectly.
Adjusting various logic analyzer settings often resolves the first two conditions. The third
condition, noise, is most often only resolved by design changes to your board.
Let’s look at the first two situations.
Different logic families have different switching thresholds. Some examples:
–– TTL ≥ 1.5 V
–– 5 V CMOS ≥ 2.5 V
–– 3.3 V CMOS ≥ 1.6 V
If you suspect that sampling thresholds may be the cause of your problem, then the
solution is straightforward. First, identify the logic families (and therefore, the switching
voltage) of the signals you are probing. Next, change the threshold settings on the logic
analyzer. Some analyzers allow you to set different thresholds for different groups of
signals. The Keysight 16800 and 16900 Series logic analyzers allow independent settings
on 16 channel (one pod) boundaries. In addition to the standard switching thresholds,
these logic analyzers allow you to specify any arbitrary threshold.
From the logic analysis Overview window on the logic analysis module, click the
Bus/Signal Setup icon. This screen allows you to change both the sampling threshold
and the setup and hold times. Figure 4 shows the threshold setup dialog box.
Click here
Change threshold here
Figure 4. Changing your analyzer’s thresholds
07 | Keysight | 8 Hints for Solving Common Debugging Problems with your Logic Analyzer - Application Note
What to Do when your Target System is Functioning Normally, but the Data You
Capture Does Not Appear to be Valid (Continued)
The second situation involves setup and hold times and only occurs when you sample
based on the clock supplied by the target system.
The solution here is also relatively straightforward. First, determine the setup and hold
requirements of the logic you are probing. Hopefully, you considered this in your design
because the interconnected ICs must satisfy each others’ setup and hold requirements.
Next, determine the setup and hold time requirements for your logic analyzer. Does your
target meet the logic analyzer’s required time? If the “window” (setup+hold) supplied
is smaller than that required by the logic analyzer, you may need to upgrade your logic
analyzer. If the window is larger, but either the setup or hold time is violated, you may be
in luck. Some logic analyzers allow you to adjust the window as needed.
The example shown in Figure 5 shows that you can adjust the state sampling position
and the threshold voltage setting. It also allows you to set different channel groups
differently.
Adjusting your thresholds and setup/hold windows can be valuable ways to squeeze
more mileage out of your analyzer, especially if your target system is heavily taxing the
capabilities of your current analyzer.
If your logic analyzer meets the specifications required by your target system and neither
of these techniques solves your problems, you most likely have a noise problem. That
means it’s time to get your oscilloscope back out and put on your analog designer hat.
Adjust state sampling
position and threshold
voltage settings
Figure 5. Adjusting sampling positions
08 | Keysight | 8 Hints for Solving Common Debugging Problems with your Logic Analyzer - Application Note
Using a “Golden Trace” to Troubleshoot Unexpected System Changes
When you are developing your target system and it is working properly, life is good. This
is the time you should connect your target to a logic analyzer and capture a “golden
trace” of the signals. Performing this small task might save the day if your target system
starts behaving unexpectedly. If you have saved a golden trace, you can use your logic
analyzer’s compare window to zero in on the problem. The compare window takes data
from a stored golden trace file and compares it to a real-time trace so you can find the
differences. You can set up the compare window to perform the comparison on specific
signals or buses, or on all signals or buses that are present in both data sources. You
can also set it up in a repetitive run mode in which each new run is compared to a data
file. You can set up the analyzer to stop capturing and comparing data when it finds a
specified number of differences. In the example shown in Figure 6, the compare window
has an analyzer as one data source and a data file as the other. The data file represents
your stored golden trace. You can display the results of the comparison using a compare
window. The data that is different in each source is highlighted. This technique shows you
what changed between your golden trace and the current trace and helps you quickly
identify what caused the problem.
Often, simulators are used to test software when hardware is not yet available. When
the first versions of the hardware become available, the software that was tested and
working on the simulation system may not work on the actual system hardware. You
can use the compare tool to compare simulation data (that has been run through a
conversion program so that it can be read by the analyzer) with real acquired data. This
helps you with hardware/software integration by letting you quickly find signals that are
not behaving as they did in the simulations.
When differences occur, data is shown in a different color
Figure 7. Using the compare window to identify changes
Your stored golden trace file
Figure 6. Using compare on signals and buses
09 | Keysight | 8 Hints for Solving Common Debugging Problems with your Logic Analyzer - Application Note
Using PC-Hosted Mode to Remotely Control your Logic Analyzer
PC-hosted mode allows you to remotely control your logic analyzer through the network.
It uses the power and speed of your remote PC. If you are connecting through a PC
with higher speed and better memory specifications than your logic analyzer, your logic
analyzer operation will be more efficient. Simply install the logic analyzer application
on your PC and provide the IP address or the hostname of the logic analyzer you want
to connect to. This feature also allows users from multiple sites or regions to access the
same logic analyzer to acquire and analyze data. Access to the logic analyzer is locked
if someone else is using it. If you wish to use the logic analyzer, you can use the chat
function to send a request to the current user to free up the instrument. To allow others
to access the instrument, the current user can save his or her acquired data as .ala files
and use the offline analysis tool to view them on the PC.
Figure 8. Connecting remotely to a logic analyzer session
10 | Keysight | 8 Hints for Solving Common Debugging Problems with your Logic Analyzer - Application Note
How to Capture Data Before a System Crash
Capturing the cause of a system crash can be tricky with a logic analyzer. This is true
because you have to get the instrument to trigger when nothing happens. How do you
describe “nothing” to a logic analyzer’s trigger menu? One tried-and-true technique
is to set up the logic analyzer to store only the data of interest and never trigger. Then
you can stop the instrument manually when the system under test crashes. When this
technique works, the logic analyzer has a history stored in its pretrigger trace buffer.
But this technique only works if you can set up your logic analyzer to capture meaningful
information, then stop when the system under test crashes.
Here’s one way around the problem: use a timer in the logic analyzer to get a trigger
soon after the system crashes. To use a timer in the trigger, first figure out what event
should happen regularly in order for you to consider your system under test alive and
working fine. Let’s call this event the system’s “heartbeat.” This could be an address
strobe, a periodic interrupt, or anything that occurs consistently at some minimum
frequency. Then set a timer equal to the longest period between successive heartbeats
that you would expect to see before you would consider the system nonfunctional. In the
trigger sequence, if you start the timer when a heartbeat occurs, and restart the timer
whenever another heartbeat occurs, you can then test if the timer reaches the maximum
value that you set. If the timer reaches the maximum value, then the logic analyzer
should trigger, since the heartbeat isn’t occurring as often as it should. You can also
experiment with the timer value to determine just how long a period between heartbeats
is normal. Here’s an example of this trigger timer idea using an Keysight 16800 Series
portable logic analyzer and an external oscilloscope. Set up the logic analyzer trigger as
shown in Figure 9.
The heartbeat in this example is a signal that consistently occurs at 8 μs intervals. This
trigger setup will force a trigger 10 μs after the last heartbeat. With the Keysight 16800
and 16900 Series logic analyzers, you can send the trigger to the oscilloscope, which
is also probing the device under test, to get a better understanding of the cause of the
crash. Figure 10 shows what the oscilloscope caught prior to the trigger that it received
from the logic analyzer.
In this case, the oscilloscope can help get to the cause of the system crash. Without an
actual trigger event, there would be no trigger signal to send to the oscilloscope. Using
timers in a logic analyzer’s trigger system can allow you to trigger on “nothing” since you
can describe the condition as too much time between successive heartbeats.
Figure 9. Configuring a heartbeat trigger
Figure 10. Oscilloscope display of results
11 | Keysight | 8 Hints for Solving Common Debugging Problems with your Logic Analyzer - Application Note
Analyzing Serial Data with a Logic Analyzer
While logic analyzers are commonly used to analyze parallel data (for example,
microprocessor address and data), some modern logic analyzers also allow you to
analyze serial data. This feature comes in handy when you are trying to debug simple
serial protocols such as RS-232C, CAN, LAN, USB or your proprietary bus.
Here’s an example of how to use an Keysight 16900 Series logic analyzer to analyze and
troubleshoot data from an RS-232C output port. Once you have connected the serial
port on your target system to the logic analyzer through one of its data pods, you will
need to put the logic analyzer into timing or asynchronous mode because the sampling
clock is being supplied by the logic analyzer. Even though you are in timing analysis
mode, you will be able to view the data as parallel information in a listing form via the
B4601C serial-to-parallel analysis tool. Next you will need to assign a label (serial) to the
input data bit. The RS-232C protocol has a data format with 1 start bit, 8 data bits, and
1.5 stop bits, as shown in Figure 11.
To capture the data, you can set the trigger on any data value. Here we have set the
trigger on the start bit. Once you have done this, you will need to configure the serial
analysis tool as shown in Figure 12. Select the Serial input label and create an output
parallel label with a word width of 8 bits, with the LSB as the first bit. This dialog box will
also allow you to choose the right bit order to invert the input data so that it is easier to
analyze. Now comes the really neat part! You will have to specify to the logic analyzer
how you would like the input frame to be processed. Under Advanced Processing, select
the Enable frame processing check box and click Define.
Start bit
1.5 stop bits
MSB
LSB
8 data bits
104.17 μs
Figure 11. Timing for RS-232C before it is inverted
Make sure this box is selected
Then click Define to bring up the
Frame Parameters dialog boxes
Figure 12. Serial analysis window
12 | Keysight | 8 Hints for Solving Common Debugging Problems with your Logic Analyzer - Application Note
Analyzing Serial Data with a Logic Analyzer (Continued)
In the dialog box for specifying the frame parameters, you can specify the start of the
frame to have the label “Start,” as shown in Figure 13. It is binary and has a width of 1
bit. Under the Data Block tab, clear the box for stuffed 0s because the RS-232C protocol
does not do any bit stuffing. Since you do not need to perform any pattern manipulation,
pass the entire data block through. In a similar fashion, under the End of Frame tab you
will need to specify that the frame ends after 8 bits, as shown in Figure 15. Having done
all this work, you are now ready to look at the serial data. Figure 16 shows a listing of the
data, looking at just the parallel labels. It shows the serial data coming down the output
port. As you can see, the serial analysis tool in the logic analyzer gives you the versatility
to analyze and debug serial protocols.
Figure 13. Start of Frame dialog box
Figure 14. Data Block dialog box
Figure 15. End of Frame dialog box
Figure 16. Data listing
13 | Keysight | 8 Hints for Solving Common Debugging Problems with your Logic Analyzer - Application Note
Generating Files for a Keysight Pattern Generator Using Third-Party EDA Tools
Electronic Design Automation (EDA) tools have become an integral part of most
engineers’ tool sets. You can use EDA tools for drawing, analyzing, simulating and
documenting the circuits that you are working on. Wouldn’t it be nice if you could
leverage the work that you did in your EDA environment while debugging your prototype?
The pattern generators that are integrated into Keysight logic analyzers allow you to
do this without much trouble. With shrinking times-to-market, you typically cannot
wait for your prototype to be complete before you start testing. Suppose your circuit
board is ready but your third-party partner has not yet delivered your ASIC. The pattern
generators available in Keysight logic analyzers allow you to debug your circuit by
replacing the missing components. All you need to do is program the pattern generator
and hook it to the circuit where the ASIC belongs. The integrated pattern generator will
stimulate your circuit while you analyze it using the logic analyzer.
Figure 17. Exporting a file from Waveform Pro
SynaptiCAD, the creators of
WaveFormer Pro, an EDA tool used
for drawing, analyzing, simulating,
and documenting timing diagrams,
has worked closely with Keysight
to make it easy for you to export
your timing diagrams to Keysight’s
pattern generators. Once you have
created your timing diagram using
WaveFormer Pro, make sure that it
includes a sampling clock and usercreated signals because the signals
are sampled using the first clock in
the timing diagram. In addition, the
diagram should include at least one
documentation marker. The first
documentation marker found in the
timing diagram denotes the beginning
of the main sequence (separating the
initialization from the main section). If
no documentation marker is present,
only main sequences will appear (i.e.,
no initial sequences). To export a timing
diagram to a pattern generator, simply
go the Export menu in WaveFormer Pro
and select Export Signals As, as shown
in Figure 17. This will bring up a dialog
box that will allow you to save your
file as pattern generator binary format
(*.pgb). The *.pgb format is a binary
format that is useful for large data
files and is supported by the 16720A
pattern generator. It’s also possible
to generate input files for the pattern
generator without using an EDA tool.
You can either program the pattern
generator using the system interface
or you can type the pattern generator
commands in an ASCII file and import
them into the pattern generator.
14 | Keysight | 8 Hints for Solving Common Debugging Problems with your Logic Analyzer - Application Note
Generating Files for a Keysight Pattern Generator Using Third-Party EDA Tools
(Continued)
An example of a file you can load into the pattern generator:
–– ACSII 000000
–– ASCDOWN
–– FORM: MODE FULL
–– LABEL ‘LAB1’,8
–– LABEL ‘DATA’,8
–– LABEL ‘TEST’,9
–– LABEL ‘CLK’,3
–– VECT #800000092
–– 12 34 56 7
–– 0 22 7 0
–– A0 33 00 1
–– *M
–– 92 6F 00 1
–– CA CA 00 1
–– 00 10 11 0
In the 16800 Series logic analyzer, select Overview > File > Import. Select Pattern
Generator Binary file as the file type and click the .pgb file, as shown in Figure 18. Then
select the Pattern Generator Sequence tab and click Run. That is all you have to do. The
data in the input file has been imported into your pattern generator! Figure 19 shows
the pin assignments in the pattern generator and Figure 20 shows the pattern generator
sequence that will result from your actions. The combination of WaveFormer Pro and a
Keysight logic analyzer makes a powerful design and debugging tool.
We’ve demonstrated how to get data from WaveFormer Pro into Keysight’s pattern
generators. In addition, data captured by your logic analyzer can be imported into
WaveFormer Pro. The circuit operations captured by the logic analyzers can be
translated by WaveFormer Pro into stimulus files for driving the simulations to test your
circuit design. For more information, see your logic analyzer user manual or go to
www.syncad.com.
Figure 18. Selecting the file to load into the pattern generator
15 | Keysight | 8 Hints for Solving Common Debugging Problems with your Logic Analyzer - Application Note
Generating Files for a Keysight Pattern Generator Using Third-Party EDA Tools
(Continued)
Figure 19. Pattern generator pin assignments
Figure 20. Pattern generator sequence
16 | Keysight | 8 Hints for Solving Common Debugging Problems with your Logic Analyzer - Application Note
Selecting the Right Probe for your Logic Analyzer
When you use a logic analyzer, one of the most important considerations is the type of
probe. Probing connections are divided into two categories: “designed-in” and “afterthought.” A designed-in probe has proper connectors incorporated into the design
during board layout; after-thought probes are connections made with an individual
probe tip, as shown in Figure 21. After-thought probing is the best solution when you are
working with low-speed signals and have very few debug pins. High-speed board design
and complicated circuitry calls for higher-bandwidth and low-loading probes. Designedin probes such as Samtec and connectorless probes meet these criteria. When you work
with FPGAs or components designs, it is important to first identify the signals of interest
for testing or debugging purposes. For example, in memory debug, you would want to
have easy access to command, data and address buses. It is also important to place the
connector or footprint as close to the signal source as possible to avoid signal integrity
issues. You may then use after-thought probing for unforeseen problem signals. Adopting
the right probing method will greatly increase efficiency in your debugging work.
Figure 21. After-thought probe: Flying leads
Figure 22. Designed-in soft touch connectorless probe
17 | Keysight | 8 Hints for Solving Common Debugging Problems with your Logic Analyzer - Application Note
Logic Analyzer Families to Help You Get your Job Done
The Keysight 16900 Series modular logic analysis mainframes deliver the performance
you need to conquer your toughest digital debug problems. You get accurate and
reliable measurements for today’s complex circuits, with expandability and performance
headroom to cover future technology trends. In addition, the intuitive user interface gives
you the ultimate in productivity without sacrificing performance or capability. You get
performance and intuitive usability at a price you can afford.
Expandability is the key to the long-term value of the Keysight 16900 Series logic
analysis systems. Purchase the capability you need now, then expand as your needs
evolve. Maximize mainframe usage by operating them separately, then connecting them
together for complex, high-channel-count, multiple-bus applications. Whether you are
doing simple hardware debug, real-time analysis of instruction execution, hardware/
software integration, signal-quality analysis or complex system validation, you have a
system that meets each of your long term digital measurement needs.
For more information on Keysight logic analysis systems, visit
www.keysight.com/find/logic.
Figure 23. Keysight 16900 Series logic analysis system
18 | Keysight | 8 Hints for Solving Common Debugging Problems with your Logic Analyzer - Application Note
Logic Analyzer Families to Help You Get your Job Done (Continued)
Cost-effective solutions that match your specific application needs
The Keysight 16800 Series portable logic analyzers offer the performance, applications,
and usability your digital development team needs to quickly debug, validate, and
optimize your digital system. The 16800 Series have a large 15-inch (38.1 cm) color
display, with available touch screen. Each logic analyzer delivers 4 GHz (250 ps) timing
zoom, up to 1 GHz timing analysis, up to 450 MHz state analysis, and memory depths up
to 32 M. Models with an integrated pattern generator let you control and monitor realtime system operation. Select from eight models that range from 34 to 204 channels to
meet your demanding troubleshooting challenges.
For more information on Keysight portable logic analyzers, visit
www.keysight.com/find/16800.
Figure 24. Keysight 16800 Series portable logic analyzers
Related Literature
Publication title
16900 Series Logic Analysis System Mainframes - Data Sheet
16800 Series Portable Logic Analyzers - Data Sheet
Publication number
5989-0421EN
5989-5063EN
19 | Keysight | 8 Hints for Solving Common Debugging Problems with your Logic Analyzer - Application Note
myKeysight
www.keysight.com/find/mykeysight
A personalized view into the information most relevant to you.
www.lxistandard.org
LAN eXtensions for Instruments puts the power of Ethernet and the
Web inside your test systems. Keysight is a founding member of the LXI
consortium.
Three-Year Warranty
www.keysight.com/find/ThreeYearWarranty
Keysight’s commitment to superior product quality and lower total cost
of ownership. The only test and measurement company with three-year
warranty standard on all instruments, worldwide.
Keysight Assurance Plans
www.keysight.com/find/AssurancePlans
Up to five years of protection and no budgetary surprises to ensure your
instruments are operating to specification so you can rely on accurate
measurements.
www.keysight.com/go/quality
Keysight Technologies, Inc.
DEKRA Certified ISO 9001:2008
Quality Management System
Keysight Channel Partners
www.keysight.com/find/channelpartners
Get the best of both worlds: Keysight’s measurement expertise and product
breadth, combined with channel partner convenience.
This document was formerly known as application note number 1326.
www.keysight.com/find/logic
www.keysight.com/find/16800
For more information on Keysight
Technologies’ products, applications or
services, please contact your local Keysight
office. The complete list is available at:
www.keysight.com/find/contactus
Americas
Canada
Brazil
Mexico
United States
(877) 894 4414
55 11 3351 7010
001 800 254 2440
(800) 829 4444
Asia Pacific
Australia
China
Hong Kong
India
Japan
Korea
Malaysia
Singapore
Taiwan
Other AP Countries
1 800 629 485
800 810 0189
800 938 693
1 800 112 929
0120 (421) 345
080 769 0800
1 800 888 848
1 800 375 8100
0800 047 866
(65) 6375 8100
Europe & Middle East
Austria
Belgium
Finland
France
Germany
Ireland
Israel
Italy
Luxembourg
Netherlands
Russia
Spain
Sweden
Switzerland
United Kingdom
0800 001122
0800 58580
0800 523252
0805 980333
0800 6270999
1800 832700
1 809 343051
800 599100
+32 800 58580
0800 0233200
8800 5009286
800 000154
0200 882255
0800 805353
Opt. 1 (DE)
Opt. 2 (FR)
Opt. 3 (IT)
0800 0260637
For other unlisted countries:
www.keysight.com/find/contactus
(BP-09-23-14)
This information is subject to change without notice.
© Keysight Technologies, 2007 - 2014
Published in USA, July 31, 2014
5968-5700E
www.keysight.com