1
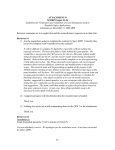
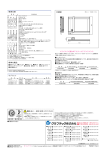
,1
uRAISON GEOGRAPHIC INFORMATION SYSTEM FOR
RURAL DRINKING WATER SOURCES MANAGEMENT
242
90 UR
;
by
i
Soo Loong Tong
Institute of Advanced Studies
University of Malaya
59100 Kuala Lumpur
MALAYSIA
'
Introduction
WATER S U P
^Sv^l? ™
^
* • .v.i
A
user-friendly
software
drinking water sources management
package
- juRAISON
jointly developed
-
for rural
by the University
of Malaya, Malaysia and the National Kater Research Institute of Canada
under the sponsorship of the International
(IDRC)
of
Canada
will
be
objective of the package is
storage, analysis
and
related
to
and
general
an
efficient
The main
means
for the
of large volume of monitoring data
information
sources management.
and rapid access to the relevant
mode graphical
in this presentation.
provide
and presentation
health
drinking water
outlined
Development Research Centre
encountered
in
rural
The salient features are the ease
information databases
and the multi-
presentation capability in relation to the geographical
locations.
Basically the package is
system which
incorporates a
a
tailored
geographic information
database system, a spreadsheet unit and a
map/graphic interface. The system is designed to run on
compatible microcomputer
with 640
IBM PC/AT or
K RAM memory, a hard disk with 20MB
or more capacity, and a dual-monitor display with an EGA colour monitor
and a monochrome monitor.
System Configuration
The overall configuration of uRAISON water quality data management system is
shown in Figure 1.
As illustrated, the setting up tasks involving map digitization and database files creation or updating can be entered externally.
The digitization of maps employs packages such as CROSS-TALK or AUTOCAD
for the generation of digital graphic files. These are then converted using the "Calibration/Conversion Programmes" developed in this study to mapfiles for incorporation into
uRAISON.
The main database files including the water quality database and the sanitary survey database were created in dBASE III+ environment. These are readily exported to
uRAISON database for direct source classification and map presentation. These database
files can be imported into SPSS PC+ for statistical analysis to determine the appropriate
objective classification followed by map presentation in uRAISON.
Also shown are the two main options in operations of uRAISON after system startup, namely accessing the general operational commands of RAISON through the main
menu, or to perform specific water quality data management tasks using the Geographic
Information System (GIS).
Via the main menu, it allows the users to generate the various map icon files, map
snapshots and geographic information displays in an unguided manner.
The GIS option is a multi-level menu-driven system for performing the various
specific tasks in water quality data management for rural water supply. The multi-level
structure is built up from local village level where individual water sources are monitored.
These are then compiled and analysed at the district, state and national levels.
Targeted Users
The uRAISON system was targeted for two levels of users. Using the menu-driven
GIS options, users with minimum computer knowledge can easily access various water
quality data and statistical information accumulated in the system, execute specific data
analysis and GIS presentation and update data inputs. For technical management users
who are responsible for water quality management at the state or national level, the setting up and expansion of a complete GIS similar to the Malaysian system could be achieved
by following the procedures given in the users manual. Flexibility is built in to allow users
to add or change functions in data analysis and map presentation to meet their needs in
management and planning.
The Map Interface
Maps
are
entered
into
the
iiRAISON
system
by
means of
digitizing the cartographic maps for the states, d i s t r i c t s and villages
as
map
files
using
Figure 2 shows the
state.
Map regions
suitable
map of
West Malaysia,
of greater
states, districts and villages
forth by
moving the
digitizing software such as "Autocad".
with icon
assigned to each
details, such as those for individual
can be
accessed sequentially
back and
cursor on the map display to the appropriate icon
locations and make the selection
The uRAISQN Geographical Information System
Once the map system (including the national, state, district and station location
maps) has been set-up, any needs of further manipulation can be carried out via the MAIN
MENU. The U R A I S O N system has a set of built-in RPL programmes that enable a selection of data analysis and graphical presentation tasks by means of easy-to-follow menus.
The menu-driven GIS operations have been arranged in simple logical level structure, i.e.
LEVEL 0 - NATIONAL, LEVEL 1A - STATE, LEVEL IB - DISTRICT, AND LEVEL
2 - STATIONS IN VILLAGE.
A flow diagram of the uRAISON Water Quality Data Management System is as
shown in Figure 1 where the built-in facilities and capabilities are indicated.
The starting of the system will provide options to access the geographical information system (GIS) directly, or through the main menu to select database, spreadsheet, or
statistical analysis operations.
Level 0- National
The entry level of the GIS (Figure 2) allows the display of the relevant information
at the national level. The addition of the programmes written within the R-M environment
has made it possible to have more user-friendly and easy to use features to be incorporated.
The available options are shown in the submenu (Figure 1). Figure 3 show displays of
three different types of statistical information which were retrieved automatically from the
database to the spreadsheet and then display on the map screen. Similar displays of statistics on water-borne disease occurrence, health services provision etc. can be incorporated.
The 'COLOUR STATES' functions can be used to classify, for examples, the relative magnitude of any of the above-mentioned statistical information in maps following a chosen
colour scheme, (e.g. Figure 4).
The programmes developed also allowed labelling with text in any part of the
graphic screen. The size, type, position and number of graphs overlaid on the display can
be determined by the user. All maps generated with overlaid information can be saved as
graphics file for rapid and easy retrieval later for browsing and analysis when required.
Level 1A - State
The functions are similar as in level 0, but information is accessed on state basis.
Typical displays are shown in Figure 5 & 6.
Level IB- District
] v:
The submenu for this level in.FJgqire 1 shows that all the facilities for level 0 and
level 1A were available here. In additiga, two more functions were introduced to allow
users to add new sampling region if necessary, and to incorporate digitized village station
icon file to the corresponding district fil£eFigure 7 shows a typical district map with 4 sampling regions.
..-. s.
Level 2 - Village Water Quality Display
This is the level where individua|$w£ter supply sources are shown on the map display. Figure 8 shows at this level ajtypieafcdigitized map of sampling stations (wells). Three
basic functions are available and described as follows:
"COLOUR STATION" - Via Subfnfcnu "Level 2.1", this allows classification of the
water quality of water sources (stations) usfog appropriate colour scheme, e.g. class I - blue;
class II - green; class III - yellow; class IM- bright red; and class V - dark red.
Different shades were used fo;r;rnQnochrome display and black/white print-outs.
The classification of the water sources:based on the water quality measured In terms of
MFC and coliphage counts have been incorporated into the uRAISON system. The results
of this simple classification scheme for thclwater sources of a few sampling regions based
on coliphage counts and MFC data are shown in Figures 9 - lO.The relevant data were extracted through the built-in program from; the R-M databases into the spreadsheet; and
the map display of the water quality is>by}jneans of the "BACK - COLOUR" function in
the spreadsheet. These processesiar.eesseatially transparent to the users. Options are builtin to display the data used and classeseassigned to the water sources into the spreadsheet
for inspection (an example is shown in Figure 11). The map files showing water quality
classification can be saved for quick browsing later when required.
"BROWSING WQ MAPS" - Via submenu "Level 2.2", this allows rapid scanning of
time-series water quality map displays, in terms of coliphage counts, MFC
counts, sanitary conditions, or overall water quality ranking.
"ADD STATIONS TO MAPS" - Via submenu "Level 2.3", this allows easy updating of new stations in map files.
The uRAISON Database and Spreadsheet Subsystems
The uRAISON Database subsystem provides a few essential functions such as
"CREATE", "UPDATE", "LINK" and "IMPORT1. Currently five basic types of uRAISON
database files have been created.
Fig. 12 Shows typical screen
displays.
The icon files are created to link the map files with the screen displays at the various
levels, namely, national, state and district levels. The station icon files link the station locations display with the water quality of the stations. The other database files are water quality
data files, sanitary survey data files, and general statistical information data files.
The system permits importation of data files from dBASE III +. Primary water
quality data and sanitary survey records were input into dBASE III + files. More descriptions of uRAISON database are given in the User Manual and NWRI User Manual.
The uRAISON spreadsheet system has two principal functions, namely, to perform
various types of data analysis on data retrieved from uRAISON database and to enable the
map system to present data from the database in map or graphical form. The display of
database information on map files is carried out using the "BACKCOLOUR" function. The
"GRAPH" enables the generation of overlay graphs (bar, line or point charts) to the map
displays
as
described
earlier.
Other
functions
common
in other
spreadsheets such as "RECACL", RANGE", RETRIEVE" are also available.
The "POLYGON"' function of
retrieval of
data on
screen (see Fisrure 13).
the spreadsheet system allows the
spreadsheet using
polygon selection
on the map
uRAISON
HATER QUALITY OATA MANAGEMENT SYSTEM
j
J
I
I
I
I
t
I
i
I
1
j GEOGRAPH. INFO. SYSTEM |
| DIGITIZATION |
I
I
i
V
I
I
I MAIN MENU I
I
1. CROSS-TALK
2. AUTOCAD —
j VECTOR GRAPHIC FILES |
| 1. ADD ICON TO MAP
I 2. SPREADSHEET
j 3. DATABASE
I 4. QUIT
j 5. DISPLAY STATIONS
| 6. ACTION t SNAPSHOT
j 7 . SNAPSHOT
I
j B. PRINT SCREEN
Calibration &
|
Conversion Program |
DATABASE
I
DBASE I I I + |
RAISON
| 1. NATIOKAL (1:500000),
|
STATE AND DISTRICT
-|
CAP FILES,
j 2. STATION LOCATION KAP
AT VILLAGE LEVEL.
CREATE / UPDATE / LINK
IMPORT / OPTION / Q U I T
1.
Icon Files: National
State
District
2. Station Icon Files
3. H.Q. Data Files
LEVEL 0 - NATIONAL
<G>.
<C>.
<S>.
<K>.
<P>.
<X>.
4. General Statistical
Information Files
CREATE OVERLAY GRAPHS
COLOUR STATE
DISPLAY STAX INFO GRAPH/MAP
DISPLAY STAX INFO KAP
PUT TEXT/SAVE KAP
BACK TO uRAISON SYSTEM
LEVEL VA - STATE
I
I
)
| KATER QUALITY |
-j S SANITARY J
SURVEY DATA
DATABASE
r
i
| SPREADSHEET |
1
i
|
|
J
|
i
STATISTICAL'
ANATYSIS S
SOURCE
CLASSIFICATION
SPSS/POf
I
RECALC / RAWSE / BACKCOLOUR
WORKSHEET / RETRIEVE / EXPORT
<C>. COLOUR DISTRICT
cG>. CREATE OVERLAY GRAPHS
<S>. DISPLAY STAX INFO GRAPH
(M>. DISPLAY STAX INFO MAP
:P>. PUT TEXT & DRAW ON KAP
X>. BACK TO uRAISON SYSTEM
Figure 1.
DATABASE / FILES / GRAPH / QUIT
I
I
t
(1/2) uRAISON System Configuration
|
j
I
j
LEVEL IB - DISTRICT
<A>.
<S>.
<P>.
<V>.
<X>.
ADD DIGITIZEO VILUGE STATION FILE
DISPUY STAX INFO GRAPH
PUT TEXT & DRAM ON HAP
ADD VILLAGE ICON
BACK TO uRAISON SYSTEM
LEVEL 2 z VILLAGE WATER QUALITY DISPLAY
<C>. COLOUR STATION /CLASSIFICATION
<B>. BROWSING WQ HAPS SAVED
«A>. ADD STATION TO KAP
<E>. ADD LATRINE /RANKING CLASSIFICATION
<T>. PUT TEXT S DRAW ON KAP
<P>. POLYGON
<W>. IDENTIFY STATION
<X>. BACK TO uRAISON SYSTEM
I I
I I
i
LEVEL 2.1 - COLOUR STATION
<R>.
<D>.
•cG>.
<S>.
«X>.
RETRIEVE FROM RDBASE J CLASS'N
DISPLAY DATA IN SPREADSHEET
GO - COLOUR THE STATI ON/CLASS'N
SAVE (spreadsheet & map)
EXIT SUBMENU
I-
LEVEL 2.2 - BROWSING
<M>. MFC WQ CLASSIFICATION KAP
<C>. COLIPHAGE CLASS'N WQ KAP
<L>. DISPUY LATRINE/RANK CLASS'N
<S>. SAS'ITARY CONDOTION
<D>. DISPLAY SPREADSHEET
<PgUp>. PAGE UP
<PgDn>. PAGE DOWN
<X>. EXIT BROWSING
LEVEL
- ADD SATTION TO MAP
LOCATE - CROSSHAIR MOVEMENTS
<Enter> — Add station at the location
<1>
— To Identify the location
<Esc> — Exit
<h>
— Help
Figure 1.
(2/2)
uRAISON System Configuration
10
J
I KelP
[Menu
I background
Leoel 0
Malaysia
-.
THAILAND
'K' for nenu
Perli^y^-
': runprog'
for subnenu
(V
rensganu
Per A
\
a/
•
PAhkng
,DDr
J.ohor
M
'i
J
[nonu
V
I Kelp
(Fig. 2)
I
I b-ac kg round
Level 0
Malaysia
TVPE OF WATER SUPPLV-198B
35X
f
THAILAND
v
X - SABAH
'M' for nenu
V - SARAWAK
' .' run pro a '
toi- saint 1 nu
Keda
i
i i
u
:
'
i
p ..•
C
RKPft B N M J C T D k V
• G r - P U H P BfCOH-WELL
•CON-WELL
BRAIN
POPULATION
Ferzk
••"*
D
n
•
! Te-renaganu
/ " \ o\ "
. •' .-•-- _ V
\
V. OF POP. UITH PW-PIPE
T1
...
C
•
Selangov
\
1KT
B
11980
B1S83
•
• 1985
11985
11
(Fig. 3)
•A OF PIPE USED IN EACH STATE
<= 20*
> 8 OX
<= GO/.
-= 40/.
<= 8 OX
THAI LAUD
'ohor
.
. ..
(Fig.
[background
help
menu
4)
Level 1
'M'
9
f o r menu
.
runprog'
for 5(tbHenu
LJ
SELVJMGOR
D
V;
\
a,
KUALA\
SELrt
D
I
V I"
u.
|
\i
1
>_r
J<u)?LfA I.l|HIMIR
-1
\
KEI.I
—\
i
\
^(
UL(j LA MCA T
/
• D
KUML^I
12
(Fig. 5)
Inenu
]
I background
I
SELflNGOR
'M' for Menu
*
': runprog'
for subnenu
SEDffNGOR
PUR
LANGftT
I
I
I
I
I
(Fig. 6)
menu
I he 1 P"
I background
Level 1
ULU LflNGGT
SAHPLING REGIONS
A
B
C
D
:
:
:
:
CHERAS (18)
KAJANG (14)
SUNGAI CHUA (27)
SEMEN*IH (15)
<xx> : N o . o f w e l l s
(Fig.
13
7)
D
Inenu
I background
Level 2
__•--•'
D
/ \
V .--6;
-••'V •••'
v •
(Fig. 8)
WATER QUOLITV FOR SEMENVIH
ULU LflNGAT, SELANGOR
:no
Mnnni : l
14
MFC
(Fig. 9)
Qiini.iTV FOR f>c._cmin
<=
<= 250
<= 50
5
<= 1000
1
.—
•.
Ksnpuny
A. ilAhhtl
,B
B
s
-=
S .
L ,- S
_ _ —
it A
.•\
.••'
\
.
tar.'I
a
v..-'
KA.iany
•••••',
\*
}
ArU.C00D<8-10)
irC00D(6-8)
\
na
Si; 2i.ua\
-BftD(2~4)
ik~V. E(1D(6-2 >
•*
: nn
MFC;
15
Y2x «J>" 32 <15 THEN) 'GREEN'ELSE
Colo»r«-. c c n t a i n j n o COLOURS :K
IF
JZ
b^
t>to
bt
25.00000 42.OOOOO
o.oooooo 1O.0O0O0
ZZ.00000 17.00000
c'£ . 00000 37.00000
19.00000 27.00000
32.00000 91.00000
25.00000 42.00000
32.00000 91 .00000
25.00000 4Z.00000
Figure 1L
<30 THEN' ' YELLOU1" ELSE
e.OOOOOO
2 1 .coooo
13 .00000
Z'2 .00000
23 .00000
11 1.0000
29 .00000
11 1.OOOO
G . OOvOOO
fc: /
£§s323
Colour
13 .00000 A. oooooo 0.OOOOOO 13 . 25C-00J
13 .00000 17 .ooooo ie.oooc'0 2 3.12500 GKth'J
9. oooooo c.000000 3fi.oooc-;- 1& 7S000 GREEN'
8. oooooo 11 . oo->:>:- 1^.OOOOO 1° .€ 2500 YELLO:'
.000^0 2< . OOOC''- 29. OOC'OC' 23 .£7500 YELLOV
51 .00000 3 3 .ooooo 3 2 . 0 0 0 0 0 5 7 .37500 RED
23 .00000 2 7 .ooooo ^4.OOOOO
.12500 RED
51 .00000 3 3 .ooooo 32.OOOOO 5 7 .37500 RED
. OOOC-C' c.00000^ 0 . 0 0 0 0 0 0 23 .25000 GREEN'
Typical spreadsheet display of water quality
classification of water sources.
16
12
(A) RAI80N DATABASE 8Y8TEK;
(B) 8ANITARY DATA OF WELL HO. 8C01 IN THE WELL8.DAT FILE;
(C) WATER QUALITY DATA OF WELL NO. JB837 IN THE
8KKEHYIH.WQD FILE
(a)
C'tale
Create
Update
Gaiton Databaf*
Itnk
Import
Urout
C r t a t a Database
CritU
CMer/Chano*
(b)
fJ-fOU
f l-Help
Data
fJ-Cnter
CcMii :
We 1 1 : S C O )
Data
Mew Oata
Date : t e / O ) / i e
Tvpe:l?
DepthM
H.Dit.ioft:i
Ku«6fr
wtr
P r o t e c t ( o:S8 13 3 X
Or a 1 « « $ • >-»-4-a-o-CK>t-0-»
I;
2* treatn:?
vaih
lo?g«:>
batr>:J
Secord 11 o f
F10-Cu1t
u»:t
Surnd
iicnf:!
are:?
7S.
Data r U » : « • ! 1 • .<3at
£nt< r / C h a n , •
(c)
1 l •Kt lp
f j -
tcil
r j -tnttr
Del a
t-c<:/:<ecaxt
C«te : f e / 0 « . / 0 6
COl K>-*C( : r c ;
tecord ( I
Data F i l e
of
Data
IS.
i«»
17
Oata
f10-Cui t
FIGURE 13
(A) RETRIEVAL OF DATA WITH THE "POLYGON" COKKAND;
(B) SPREADSHEET 8HOWING THX DATA WITHIN THE POLYGON
(a)
Itvtl
2
SDOXVIH
t*!»ction using Polygon
Co)
fl 1 :
KESZ-E1
K&S10E
KBSEZJ
KESZES
late
SS/04/05
6E/04/0E
Ese/04/0E
m
50-0. OOOC
1.00000C
7tOC
«<~.ooooc
BS /O< /OE-
E C'O . C'C'OC
E
-1 . OC'C-OC


![[1.7 APPLICATION FUNCT.] (FUn](http://vs1.manualzilla.com/store/data/005865551_1-ec59525967aac13e1fcb9d41d71413ed-150x150.png)