1
CUDA-GDB:
The NVIDIA CUDA
Debugger
User Manual
Version 2.1 Beta
11/11/2008
ii
CUDA Debugger User Manual Version 2.1 Beta
Table of Contents
Chapter 1. Introduction ................................................................................... 1
1.1
CUDA-GDB: The NVIDIA CUDA Debugger .................................................... 1
1.2
Document’s Structure ................................................................................. 1
Chapter 2. Installation Instructions ................................................................ 3
2.1
Installing CUDA-GDB................................................................................... 3
Chapter 3. Debug Compilation ......................................................................... 5
3.1
Compiling CUDA applications with debugging support.................................... 5
Chapter 4. CUDA-GDB Features and Extensions .............................................. 7
4.1
Realtime debugging of a CUDA application on GPU hardware ......................... 7
4.2
An extension to the GDB debugging environment.......................................... 7
4.3
Pause CUDA execution at any function symbol or source file line number ........ 7
4.4
Single-step individual warps ........................................................................ 8
4.5
Display device memory in the device kernel .................................................. 8
4.6
Switch to any CUDA block/thread................................................................. 8
4.7
Display CUDA blocks/threads ....................................................................... 9
4.8
Display CUDA state information ................................................................... 9
4.9
Breaking into running applications.............................................................. 10
4.10
Initialization File .................................................................................... 10
Chapter 5. CUDA-GDB Walkthrough .............................................................. 11
5.1
Sample CUDA application .......................................................................... 11
5.2
Sample CUDA-GDB session........................................................................ 12
Appendix A. Technical Specifications............................................................. 15
A.1
CUDA-GDB Supported Platforms ................................................................ 15
A.1.1
Host Platform Requirements ............................................................... 15
A.1.2
GPU Requirements ............................................................................. 15
Appendix B. Known Issues............................................................................. 17
B.1
Known Issues........................................................................................... 17
CUDA Debugger User Manual Version 2.1 Beta
iii
iv
CUDA Debugger User Manual Version 2.1 Beta
Chapter 1.
Introduction
1.1
CUDA-GDB: The NVIDIA CUDA Debugger
CUDA-GDB is a ported version of GDB: The GNU Debugger, version 6.6. The
goal of its design is to present the user with an all-in-one debugging environment
that is capable of debugging native host code as well as CUDA code. Therefore, it
is an extension to the standard i386 port that is provided in the GDB release. As a
result, standard debugging features are inherently supported for host code, and
additional features have been provided to support debugging CUDA code. CUDAGDB is supported on 32-bit Linux in the 2.1 Beta release.
All information contained within this document is subject to change.
1.2
Document’s Structure
This document is organized into the following chapters:
Chapter 1 is a general introduction to CUDA-GDB.
Chapter 2 contains installation instructions for CUDA-GDB.
Chapter 3 describes the compilation process necessary to debug CUDA
programs.
Chapter 4 describes features and extensions that provide support for debugging
CUDA code.
Chapter 5 provides a walkthrough of CUDA-GDB.
Appendix A lists CUDA-GDB supported platforms.
Appendix B lists CUDA-GDB known issues.
CUDA Debugger User Manual Version 2.1 Beta
1
Chapter 2.
Installation Instructions
2.1
Installing CUDA-GDB
1. Visit the CUDA Zone download page:
(http://www.nvidia.com/object/cuda_get.html).
2. You must select Linux 32-bit as your Operating System and Red Hat Enterprise
Linux 5.x as your Linux version.
3. Download and install the 2.1 CUDA Driver and 2.1 CUDA Toolkit.
4. Download and install the 2.1 CUDA-GDB package.
5. Point environment variable LD_LIBRARY_PATH to /usr/local/cuda/lib.
6. Point environment variable PATH to /usr/local/cuda/bin.
CUDA Debugger User Manual Version 2.1 Beta
3
Chapter 3.
Debug Compilation
3.1
Compiling CUDA applications with debugging
support
NVCC, the NVIDIA CUDA compiler driver, provides a mechanism for generating
debugging information necessary for CUDA-GDB to work properly. The “–g –G”
option pair must be passed to the CUDA compiler when compiling an application
in order to debug with the CUDA debugger (cuda-gdb). For example:
nvcc –g –G foo.cu –o foo
What does this do?
Forces –O0 (mostly unoptimized) compilation; spills all variables to
memory.
Makes the compiler dump debugging information into the executable.
NOTE: It is currently not possible to generate debugging information when
compiling with the –cubin option.
CUDA Debugger User Manual Version 2.1 Beta
5
Chapter 4.
CUDA-GDB Features and Extensions
4.1
Realtime debugging of a CUDA application
on GPU hardware
The goal of CUDA-GDB is to provide developers a mechanism of debugging a
CUDA application on actual hardware in realtime. Therefore, a user will be able to
verify program correctness without variations often introduced by simulation
and/or emulation environments.
4.2
An extension to the GDB debugging
environment
Just as the CUDA programming model provides a seamless mechanism for
programming host and GPU code, CUDA-GDB provides a model to seamlessly
debug both host and GPU code.
Therefore, GPU memory is treated as an extension to host memory, and GPU
threads/blocks are treated as extensions to host threads. Furthermore, there is no
difference between CUDA-GDB and GDB when debugging host code.
4.3
Pause CUDA execution at any function
symbol or source file line number
CUDA-GDB supports setting breakpoints at any host and/or device function
residing in your CUDA application by using the function symbol name and/or the
source file line number. This can be accomplished in the same way for either host
or device code. For example, if your kernel’s function name is mykernel_main, the
break command is as follows:
(cuda-gdb) break mykernel_main
CUDA Debugger User Manual Version 2.1 Beta
7
The above command will set a breakpoint at a particular device location (the address
of mykernel_main), and it will force all resident GPU threads to stop at this
location. There is currently no method to stop only certain threads or warps at any
given breakpoint.
4.4
Single-step individual warps
CUDA-GDB supports stepping GPU code at the finest granularity of a warp. This
means that typing next or step from the CUDA-GDB command line (when in the
focus of device code) will advance all threads in the same warp as the current thread
of focus. In order to advance the execution of more than one warp, you must set a
breakpoint at the desired location.
A special case is stepping the thread barrier call, __syncthreads(). In this case, an
implicit breakpoint is set immediately after the barrier and all threads are continued to
this point.
An important note is that it is not currently possible to step over a subroutine. Since
all subroutines are implicitly inlined, CUDA-GDB will always step into a subroutine.
4.5
Display device memory in the device kernel
The GDB print command has been extended to decipher the location of any
program variable, and can be used to display the contents of any CUDA program
variable:
Allocations made via cudaMalloc()
Data that resides in various GPU memory regions such as shared, local, and
global memory
Special CUDA runtime variables, such as threadIdx
4.6
Switch to any CUDA block/thread
CUDA-GDB provides an extension to the GDB ‘thread’ command to support
CUDA thread/block switching, which uses the CUDA syntax as follows:
thread <<<(BX,BY),(TX,TY,TZ)>>>
This extension supports multiple variations:
8
Providing fewer coordinate locations for either the CUDA thread or block will
set only the specified coordinates, and clear all others to 0. For example:
CUDA Debugger User Manual Version 2.1 Beta
thread <<<(0),(1)>>> will switch to the CUDA block with X coordinate 0
and Y coordinate 0, and to the CUDA thread with X coordinate 1 and the Y
and Z coordinates 0 (thread <<<(0,0),(1,0,0)>>>).
Providing only the CUDA thread coordinates will maintain the current block of
focus while switching to the specified CUDA thread.
thread <<<(10)>>> will maintain the current CUDA block, and switch to
the CUDA thread with X coordinate 10 and Y and Z coordinates 0.
thread <<<10>>> is a shorthand version of the above command, and only
works for specifying threads within a current block.
4.7
Display CUDA blocks/threads
CUDA-GDB provides an additional command (info cuda threads) which displays
a summary of all CUDA threads that are currently resident on the GPU. CUDA
threads are specified using the same syntax as described in Section 4.6 and are
summarized by grouping all contiguous threads that are stopped at the same
program location. A sample display can be seen below:
<<<(0,0),(0,0,0)>>> … <<<(0,0),(31,0,0)>>>
GPUBlackScholesCallPut () at blackscholes.cu:73
<<<(0,0),(32,0,0)>>> … <<<(119,0),(0,0,0)>>>
GPUBlackScholesCallPut () at blackscholes.cu:72
The above example shows 32 threads (a warp) that have been advanced to line 73 of
blackscholes.cu, and the remainder of the resident threads stopped at line 72.
Since this summary only shows thread coordinates for the start and end range, it
may be unclear how many threads or blocks are actually within the displayed range.
This can be checked by printing the values of gridDim and/or blockDim.
CUDA-GDB also has the ability to display a full list of each individual thread that is
currently resident on the GPU by using the info cuda threads all command.
4.8
Display CUDA state information
CUDA-GDB provides an additional command (info cuda state) which displays
information such as the current hardware being used and memory that has been
allocated via cudaMalloc().
CUDA Debugger User Manual Version 2.1 Beta
9
4.9
Breaking into running applications
CUDA-GDB provides support for debugging kernels that appear to be hanging or
looping indefinitely. The Ctrl-C signal will freeze the GPU and report back the
source code location. At this point, the program can be modified and then resumed
or terminated at the user’s discretion.
4.10
Initialization File
CUDA-GDB supports an initialization file, which must reside in your home
directory (~/.cuda-gdbinit). This file can take any CUDA-GDB
command/extension as input to be processed upon executing the cuda-gdb
command. This is just like the .gdbinit file used by standard versions of GDB, only
renamed.
10
CUDA Debugger User Manual Version 2.1 Beta
Chapter 5.
CUDA-GDB Walkthrough
5.1
Sample CUDA application
The walkthrough in Section 5.2 assumes the following source code, which performs
a simple 8-bit bit reversal on a data set:
bitreverse.cu
1
2
#include <stdio.h>
#include <stdlib.h>
3
4
// Simple 8-bit bit reversal Compute test
5
6
7
8
9
10
11
12
13
14
15
16
17
18
19
20
21
22
23
24
25
26
27
28
29
30
31
#define N 256
__global__ void bitreverse(unsigned int *data)
{
unsigned int *idata = data;
unsigned int x = idata[threadIdx.x];
x = ((0xf0f0f0f0 & x) >> 4 | ((0x0f0f0f0f & x) << 4);
x = ((0xcccccccc & x) >> 2 | ((0x33333333 & x) << 2);
x = ((0xaaaaaaaa & x) >> 1 | ((0x55555555 & x) << 1);
idata[threadIdx.x] = x;
}
int main(void)
{
unsigned int *d = NULL; int i;
unsigned int idata[N], odata[N];
for (i = 0; i < N; i++)
idata[i] = (unsigned int)i;
cudaMalloc((void**)&d, sizeof(int)*N);
cudaMemcpy(d, idata, sizeof(int)*N,
cudaMemcpyHostToDevice);
CUDA Debugger User Manual Version 2.1 Beta
11
Chapter 6.
Example of Matrix Multiplication
32
33
34
35
36
37
38
39
40
41
42
43
5.2
bitreverse<<<1, N>>>(d);
cudaMemcpy(odata, d, sizeof(int)*N,
cudaMemcpyHostToDevice);
for (i = 0; i < N; i++)
printf(“%u -> %u\n”, idata[i], odata[i]);
cudaFree((void*)d);
return 0;
}
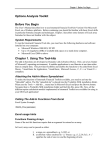
Sample CUDA-GDB session
Step 1: Compile the CUDA application for debugging by entering the following
command at a shell prompt:
$: nvcc –g –G bitreverse.cu –o bitreverse
Note: The above command assumes the source filename to be muld.cu and that
no additional compiler flags are required for compilation.
Step 2: Start the CUDA debugger by entering the following command at a shell
prompt:
$: cuda-gdb bitreverse
Step 3: Set breakpoints. We will set both host (main) and GPU (bitreverse)
breakpoints here. Also, we will set a breakpoint at a particular line in the device
function (bitreverse.cu:18).
(cuda-gdb)
Breakpoint
(cuda-gdb)
Breakpoint
(cuda-gdb)
Breakpoint
break main
1 at 0x8051e8c: file bitreverse.cu, line 23.
break bitreverse
2 at 0x805b4f6: file bitreverse.cu, line 10.
break bitreverse.cu:18
3 at 0x805b4fb: file bitreverse.cu, line 18.
Step 4: Run the CUDA application.
(cuda-gdb) run
The application will begin executing until it reaches the first breakpoint set in
Step 3 (main).
12
CUDA Debugger User Manual Version 2.1 Beta
Chapter 6.
Example of Matrix Multiplication
Breakpoint 1, main() at bitreverse.cu:23
unsigned int *d = NULL; int i;
At this point, commands can be entered to advance execution and/or print
program state. For this walkthrough, we will continue to the device kernel.
(cuda-gdb) continue
Continuing.
[Current CUDA Thread <<<(0,0),(0,0,0)>>>]
Breakpoint 2, bitreverse() at bitreverse.cu:10
unsigned int *idata = data;
CUDA-GDB has detected that we have reached a CUDA device kernel, so it
prints the current CUDA thread of focus. This can be verified by the thread
command:
(cuda-gdb) thread
[Current Thread 2 (Thread 1584864 (LWP 9146))]
[Current CUDA Thread <<<(0,0),(0,0,0)>>>]
The above output tells us that the host thread of focus has LWP ID of 9146 and
the current CUDA Thread has block coordinates (0,0) and thread coordinates
(0,0,0). This can be further identified by printing the block and thread indices:
(cuda-gdb) print
$1 = {x = 0, y =
(cuda-gdb) print
$2 = {x = 0, y =
blockIdx
0}
threadIdx
0, z = 0)
We can also print the grid and block dimensions:
(cuda-gdb) print
$3 = {x = 1, y =
(cuda-gdb) print
$4 = {x = 256, y
gridDim
1}
blockDim
= 1, z = 1)
Since thread (0,0,0) will be reversing the value of 0, we will switch to a different
thread to show more interesting data:
(cuda-gdb) thread <<<170>>>
Switching to <<<(0,0),(170,0,0)>>> bitreverse () at
bitreverse.cu:10
unsigned int *idata = data;
Now, we will advance execution to verify the data value that thread (170,0,0)
should be working on:
CUDA Debugger User Manual Version 2.1 Beta
13
Chapter 6.
Example of Matrix Multiplication
(cuda-gdb) next
[Current CUDA Thread <<<(0,0),(170,0,0)>>>]
bitreverse () at bitreverse.cu:12
unsigned int x = idata[threadIdx.x];
(cuda-gdb) next
[Current CUDA Thread <<<(0,0),(170,0,0)>>>]
bitreverse () at bitreverse.cu:14
x = ((0xf0f0f0f0 & x) >> 4) | ((0x0f0f0f0f &x) << 4);
(cuda-gdb) print x
$5 = 170
(cuda-gdb) print/x x
$6 = 0xaa
We have verified that thread (170,0,0) is working on the correct data (170). Now
we will use our last breakpoint (set at bitreverse.cu:18) to verify that our logic is
correct to reverse our original data:
(cuda-gdb) continue
Continuing.
[Current CUDA Thread <<<(0,0),(170,0,0)>>>]
Breakpoint 3, bitreverse() at bitreverse.cu:18
idata[threadIdx.x] = x;
(cuda-gdb) print x
$7 = 85
(cuda-gdb) print/x x
$8 = 0x55
Now we will delete our breakpoints and continue the program to completion:
(cuda-gdb) delete b
Delete all breakpoints? (y or n) y
(cuda-gdb) continue
Continuing.
Program exited normally.
(cuda-gdb)
This concludes the CUDA-GDB walkthrough.
14
CUDA Debugger User Manual Version 2.1 Beta
Appendix A.
Technical Specifications
A.1
CUDA-GDB Supported Platforms
The general platform requirements for running CUDA-GDB are listed in this
section.
A.1.1
Host Platform Requirements
Red Hat Enterprise Linux 5.x 32-bit. It may work on other 32-bit Linux
distributions, but is not guaranteed.
X11 cannot be running on the GPU that is used for debugging. Two possible
debugging setups exist:
Remote access to a single GPU (VNC, ssh, etc.)
Two GPUs, where X11 is running on only one of the GPUs
Note: As it is possible for CUDA to default to running on the attached GPU,
the headless GPU must be selected with an explicit call to cudaSetDevice()
when using the multiple GPU configuration.
A.1.2
GPU Requirements
Debugging is supported on all CUDA-capable GPUs with the exception of
GeForce 8800 GTS, GeForce 8800 GTX, GeForce 8800 Ultra, Quadro FX 4600,
and Quadro FX 5600.
CUDA Debugger User Manual Version 2.1 Beta
15
Appendix B.
Known Issues
B.1
Known Issues
Scope shadowing is not supported. This means that if a variable is introduced in
an inner scope that has the same name as a variable in the outer scope, only the
outer scope’s value can be seen.
64-bit applications are not supported.
The debugger enforces blocking kernel launches.
Device memory (allocated via cudaMalloc()) is not visible outside of the kernel
function.
Host memory allocated with cudaMallocHost() is not visible in CUDA-GDB.
Multi-GPU applications are not supported.
Not all illegal program behavior can be caught in the debugger, such as out-ofbounds memory accesses or divide-by-zero situations.
It is not currently possible to step over a subroutine.
Debugging using the device driver API is not supported.
CUDA Debugger User Manual Version 2.1 Beta
17
Notice
ALL NVIDIA DESIGN SPECIFICATIONS, REFERENCE BOARDS, FILES, DRAWINGS, DIAGNOSTICS, LISTS, AND
OTHER DOCUMENTS (TOGETHER AND SEPARATELY, “MATERIALS”) ARE BEING PROVIDED “AS IS.” NVIDIA
MAKES NO WARRANTIES, EXPRESSED, IMPLIED, STATUTORY, OR OTHERWISE WITH RESPECT TO THE
MATERIALS, AND EXPRESSLY DISCLAIMS ALL IMPLIED WARRANTIES OF NONINFRINGEMENT,
MERCHANTABILITY, AND FITNESS FOR A PARTICULAR PURPOSE.
Information furnished is believed to be accurate and reliable. However, NVIDIA Corporation assumes no
responsibility for the consequences of use of such information or for any infringement of patents or other
rights of third parties that may result from its use. No license is granted by implication or otherwise under any
patent or patent rights of NVIDIA Corporation. Specifications mentioned in this publication are subject to
change without notice. This publication supersedes and replaces all information previously supplied. NVIDIA
Corporation products are not authorized for use as critical components in life support devices or systems
without express written approval of NVIDIA Corporation.
Trademarks
NVIDIA, the NVIDIA logo, GeForce, Tesla, and Quadro are trademarks or registered trademarks of NVIDIA
Corporation. Other company and product names may be trademarks of the respective companies with which
they are associated.
Copyright
© 2007-2008 NVIDIA Corporation. All rights reserved.
NVIDIA Corporation
2701 San Tomas Expressway
Santa Clara, CA 95050
www.nvidia.com