1
MICROCOMPUTER
MN10300
MN10300 Series
C Source Code Debugger
User’s Manual
Pub.No.13130-022E
PanaXSeries is a trademark of Matsushita Electric Industrial Co., Ltd.
Sun, Sun OS, SPARC station2, and OpenWindows are registered trademarks of Sun Microsystems, Inc. (USA).
UNIX is a registered trademark of X/Open Company Ltd. in the USA, where it is licensed, and in other countries.
The other corporation names,logotype and product names written in this book are trademarks or registered trademarks of their
corresponding corporations.
Request for your special attention and precautions in using the technical
informaition and semiconductors described in this book
(1)
An export permit needs to be obtained from the competent authorities of the Japanese Government if any of
the products or technologies described in this book and controlled under the "Foreign Exchange and Foreign
Trade Law" is to be exported or taken out of Japan.
(2)
The contents of this book are subject to change without notice in matters of improved function.When
finalizing your design, therefore, ask for the most up-to-date version in advance in order to check for any
changes.
(3)
We are not liable for any damage arising out of the use of the contents of this book, or for any infringement
of patents or any other rights owned by a third party.
(4)
No part of this book may be reprinted or reproduced by any means without written permission from our
company.
If you have any inquiries or questions about this book or our semiconductors, please contact one of our sales
offices listed at the back of this book or Matsushita Electronics Corporation's Sales Department.
About This Manual
This manual is intended for engineers who will be debugging programs for the MN10300 Series. Chapters 1 through
3 provide an overview of the C Source Code Debugger, describe its organization, and explain how to start it up. Chapter
4, intended for beginners, is a detailed guide to debugging work. Chapter 5 introduces the options that can be specified
when starting up the C Source Code Debugger. Chapter 6 explains the window commands, while chapters 7 and 8
explain the dialog commands and macro commands, respectively. These chapters also include specific command execution examples. Chapter 9, an appendix, includes specifications and notes concerning the In-circuit Emulator, probe
specifications, an explanation of the operation of the interface board switches, error messages, and a quick reference for
the commands.
■ Organization of This Manual
Each section in this manual generally consists of a title, summary, main text, indications of the keys that are used,
notes, and reference information. Chapters 7 and 8 also include commands, command patterns, and examples of usage.
The layout of each section and the meaning of each element are explained below.
Intermediate
title
Header icon
36
The shading of the icon
varies according to the
content of that section.
From overview to
startup
Tutorial
Command explanation
Appendix
4
Summary
Debugging Tutorial
This section provides an overview of the debugging process and the operating
methods of the C source code debugger, from start to finish, by actually using the
C source code debugger to debug the sample program (SAMPLE.C). Knowledge
of these operating methods combined with a knowledge of the window commands and dialog commands will enable you to operate the C source code
debugger.
This is an introduction to the
section in question.
Subtitle
Main text
4-1 Starting up the C source code debugger
Confirm that the current directory contains the following files. If one of these
files is not contained in the current directory, copy the file from the master disk.
Keys
These indicate the
keys that are to be
pressed. Those that
are not enclosed are
keys that are used for
option commands or
local commands.
PICE103.EXE .......... C source code debugger 10300
PINS103.EXE .......... Environment setup utility
ENV103.TXT ........... Type definition file
PICE103.MAC ......... Macro command definition file
PICE103.MES .......... Message file
PT103.HLP ............... Help file for the C source code debugger 10300
MON103.EX ............ In-circuit emulator monitor program file
SAMPLE.EX ............ Executable file of the sample program
SAMPLE.C ............... Sample program source file
STARTUP.ASM ...... Sample program startup routine source file
To start up the C source code debugger, input the following as an MS-DOS
command:
PICE103 -NOTARGET ↵
When this command is input, the C source code debugger startup screen appears. Specify “-NOTARGET” when there is no target system connected.
Notes
This example assumes that there is about 500KB of available space
in main memory.
Debugging Tutorial
< About This manual-1>
Reference
symbol
This indicates
where related information can be
referenced.
On-the-fly function
Command
This label
7. Dialog Commands
NO INFLUENCES
Command
pattern
This shows the specific command pattern.
BPA
appears
if the command can be
used with the on-the-fly
function.
133
On-the-fly
function
On-the-fly
function
B
Command index
This is an index for
all of the commands.
Set AND break
BPA <list>
Command
definition
This command sets an AND break.
B P A <list>
The hardware break events specified in <list> become AND conditions.
Once all of the conditions are satisfied, a break occurs.
Specify up to eight break event numbers in <list>, delimited by commas.
If an AND break is set while a program is running, it becomes valid immediately. To cancel an AND break, execute the BD or BC/EC command on one of
the break events set as part of the AND break.
Commentary
Example
Explains the underlined portions.
Break event Nos.
2 and 3 form
an AND break.
Reference
information
>bp
No.
E 1
E 2
E 3
E 4
>bpa 2,3
>bp
No.
E 1
E 2 (& )
E 3 (& )
E 4
>
Sadr
80000039
00000100
00000800
80000058
Eadr
Sadr
80000039
00000100
00000800
80000058
Eadr
st.
SF
RW
RW
EX
Data/Symbol
_0main
@0xxxx100
_i
_0cnt60
Sz
st.
SF
RW
RW
EX
Data/Symbol
_0main
@0xxxx100
_i
_0cnt60
Sz
Cnt Command
1
1
1
1
-
-
Cnt Command
1
1
1
1
Reference: The base used in <list> is assumed to be decimal regardless of the N
command specification. If “0x” is added, the base is hexadecimal.
Footer
This indicates the
type of each command.
Event-Related Commands
■ Finding Information
This manual allows you to find information quickly by one of four methods:
(1) To find the beginning of each chapter, refer to the index at the beginning.
(2) To find the titles, refer to the Table of Contents at the beginning.
(3) Chapter titles are indicated at the top of right-hand pages, while intermediate titles are indicated
at the bottom of each page. These can be used to get a quick idea of the content of each section
of the manual as you flip through the pages of the manual.
(4) To find a command, refer to the index at the end of the manual. A command index is also
indicated on the edge of each right-hand page; this index can be used to find the desired command as you flip through the pages of the manual.
< About This manual-2>
■ Related Manuals
In addition to this manual, Panasonic also provides the following manuals for related products:
"MN103S00 Series Instruction Manual"
<Describes the instruction set>
"MN10300 Series Cross-assembler User's Manual
<Describes the assembler syntax and notation>
"MN10300 Series C Compiler User's Manual: Usage Guide"
<Describes the installation, the commands, and options of the C Compiler>
"MN10300 Series C Compiler User's Manual: Language Description"
<Describes the syntax of the C Compiler>
"MN10300 Series C Compiler User's Manual: Library Reference"
<Describes the the standard library of the C Compiler>
"MN10300 Series C Source Code Debugger for Windows(R) User's Manual"
<Describes the use of the C source code debugger for Windows>
"MN10300 Series Installation Manual"
<Describes the installation of the C compiler, cross-assembler and C source code debugger and the
procedure for bringing up the in-circuit emulator>
■ Contact Information
If you have any comments or questions concerning this manual, contact the nearest Semiconductor Design Center.
Refer to the list at the back of this manual for addresses, etc.
< About This manual-3>
CONTENTS
Chapter 1 C Source Code Debugger Overview
Chapter 2 C Source Code Debugger Configuration
Chapter 3 Connections and Startup
Chapter 4
Characteristic C Source Code Debugger
Functions and Their Usage
Chapter 5 C Source Code Debugger Startup Method
and Options
Chapter 6 Window Commands
Chapter 7 Dialog Commands
Chapter 8 Macro Commands
Chapter 9 Appendix
Index
0
1
2
3
4
5
6
7
8
9
10
CONTENTS
Chapter 1 C Source Code Debugger Overview
1
C Source Code Debugger Overview ..................................................... 2
2
Notes on Use ........................................................................................ 13
2-1
Hardware Notes ...................................................................... 13
2-2
Software Notes ........................................................................ 14
2-3
ROM, RAM .............................................................................. 14
2-4
Program Execution ......................................................... 14
2-5
Breaks ............................................................................. 15
2-6
Tracing ............................................................................ 15
2-7
On-the-fly ........................................................................ 16
2-8
Miscellaneous ................................................................. 16
Chapter 2 C Source Code Debugger Configuration
1
Hardware List ...................................................................................... 18
2
Descriptions of Each Device ................................................................ 19
2-1
In-circuit Emulator ........................................................... 19
2-2
C Source Code Debugger 10300 Floppy Disk ........................ 20
Chapter 3 Connections and Startup
1
2
Installing the Interface Board ................................................................ 22
1-1
Installation in the PC-9800 Series .......................................... 22
1-2
Installation in the PC-98 NOTE Series ................................... 23
1-3
Installation in the PC/AT (DOS/V) Series ............................... 23
Connection Procedure ......................................................................... 24
2-1
3
4
< Contents - 2 >
Connection Procedure ............................................................ 24
Host Computer Settings ...................................................................... 26
3-1
Starting up the Installer .......................................................... 27
3-2
Debugger Test Startup ........................................................... 29
Power On/Off ....................................................................................... 30
Chapter 4 Characteristic C Source Code Debugger Functions
and Their Usage
1
Overview of Window Display ............................................................... 32
2
Debugging Work Flow ......................................................................... 33
3
Creation of Executable Files ................................................................ 34
4
Debugging Tutorial .............................................................................. 36
4-1
Starting up the C source code debugger ................................ 36
4-2
Help ........................................................................................ 38
4-3
Loading executable files ......................................................... 40
4-4
Screen control/file handling .................................................... 42
4-5
Program execution and break ................................................ 44
4-6
Memory referencing ............................................................... 47
4-7
Subprocesses ......................................................................... 49
4-8
Macro commands ................................................................... 51
4-9
Exiting the C source code debugger ...................................... 52
4-10
Program completion (gaining familiarity with
C source code debugger operation) ........................................ 53
Chapter 5 C Source Code Debugger Startup Method and Options
1
C Source Code Debugger
Startup Method and Options ................................................................ 56
Chapter 6
Window Commands
1
Window Displays ................................................................................. 62
2
Window Commands ............................................................................. 66
2-1
Screen control ........................................................................ 66
2-2
Execution/Breaks ................................................................... 70
2-3
Getting/selecting strings ......................................................... 72
2-4
File display .............................................................................. 74
2-5
Process control/RAM monitor ................................................. 77
2-6
Shell functions ......................................................................... 78
2-7
Memos .................................................................................... 82
2-8
Other window commands ....................................................... 83
< Contents - 3 >
3
Data Reference Functions .................................................................... 84
3-1
Inspect function ...................................................................... 84
3-2
Struct and Union Inspection ................................................... 88
3-3
Local commands within the Inspect window .......................... 89
3-4
Watch functions ...................................................................... 92
3-5
View function .......................................................................... 93
Chapter 7 Dialog Commands
1
Rules for Using Dialog Commands ..................................................... 96
1-1
Conventions used in command explanations ......................... 96
1-2
Command input format ........................................................... 96
1-3
Symbols in the C source code debugger ............................... 97
1-4
Numbers in the C source code debugger ............................. 100
1-5
Operational expressions ....................................................... 104
1-6
Data Expressions at the C Language Level ......................... 106
Command Index
2
Program Loading/Execution .............................................................. 112
L/LP (Load executable file) ................................................... 114
RD (Read file into memory) .................................................. 115
WR (Write to file) .................................................................. 116
T (Single-step execution of user program) ........................... 117
P (Function step execution of user program) ....................... 119
G (Execute user program) .................................................... 121
RESET (Reset user microprocessor) ................................... 123
3
Event-related Commands .................................................................. 124
EV (Set/display event) .......................................................... 127
BP (Set/display break event) ................................................ 130
BPA (Set AND break) ............................................................ 133
BPS (Set sequential break) .................................................. 134
BC/EC (Cancel break event) ................................................ 136
BD (Temporarily disable break event) .................................. 137
< Contents - 4 >
BE (Enable break event) ...................................................... 139
4
Other Hardware-related Commands ................................................. 141
TM (Set/display trace mode) ............................................... 142
TG (Start trace) .................................................................... 146
TS (Stop trace) ..................................................................... 147
TD/TDU (Display trace) ........................................................ 148
TDW (Display trace window) ................................................ 151
TI (Measure/display execution time) .................................... 153
TRIG (Set/display trigger) ..................................................... 156
MAP/EX (Assign memory) .................................................... 158
5
Performance Measurement ............................................................... 160
SM (Set/release sample area) .............................................. 161
PROF (Tabulate access status) ........................................... 164
6
Data Display/Change ......................................................................... 166
D (Display dump of contents of memory) ............................. 167
E (Change specified memory contents) ............................... 169
C (Compare specified memory contents) ............................. 171
F (Fill specified range of memory with data value) ............... 172
M (Block transfer of specified range of memory) ........................ 174
S (Memory pattern search) ................................................... 175
R (Display/change register value) ........................................ 177
H (Display expression operation results) .............................. 179
PRINTF/PF (Display format) ................................................. 180
X (Display currently registered symbols) .............................. 182
. (Register/change/delete symbol) ........................................ 184
7
Code Display/Change ........................................................................ 186
V (Display source lines from specified position in Code
window) ................................................................................ 187
U (Display disassembled code) ............................................ 188
A (Input assembly language line) ......................................... 190
K (Back trace) ....................................................................... 191
8
Watch Display .................................................................................... 192
INS (Inspect) ........................................................................ 193
W (Register watch) ................................................................ 195
< Contents - 5 >
VAL/? (Evaluate C expression) ............................................ 197
Y (Delete watch) .................................................................... 199
9
System Control Commands ............................................................... 200
Q/EXIT (Quit C source code debugger) ................................ 201
HELP (Display help screen) ................................................. 202
! (Execute subprocess) ......................................................... 203
!!/! (Display/search history) ................................................... 205
10 Other Commands .............................................................................. 206
CLS (Clear Command window screen) ................................ 208
HOME (Move cursor to home position) ................................ 208
LIST (Specify display output) ............................................... 209
NLIST (Suppress display output) ......................................... 209
BEL (Sound beep) ................................................................ 210
TIME (Display current time) .................................................. 210
WAIT (Wait) .......................................................................... 211
PRMPT (Change prompt) ..................................................... 211
* (Comment) ......................................................................... 212
> (Output log) ....................................................................... 213
< (Batch) ............................................................................... 214
MEM (Display/register/delete memo) ................................... 215
N (Change input format base) .............................................. 216
OPTION (Set option) ............................................................ 217
Chapter 8 Macro Commands
1
Macro Command Overview ............................................................... 220
1-1
Macro function ...................................................................... 220
Command Index
2
Macro Commands ............................................................................. 222
{<> <>} .................................................................................. 223
[ ] .......................................................................................... 225
DO{ }WHILE (Macro control execution ................................. 227
FOR{ } (Macro control execution .......................................... 228
< Contents - 6 >
WHILE{ } (Macro control execution ...................................... 229
REPEAT{ } (REPEAT {..}
Macro control execution ........... 230
BREAK (Exit macro .............................................................. 231
LALL (Macro display output specification ............................. 232
SALL (Macro display suppression specificationj .................. 233
MLIST (Display macros ........................................................ 234
KILL (Delete macro .............................................................. 235
IF{ } (Conditional execution .................................................. 236
KEYIN (Specify input from the keyboard .............................. 237
Chapter 9 Appendix
1
2
In-circuit Emulator Specifications ...................................................... 240
1-1.
Functional Specifications ...................................................... 240
1-2.
Electrical Specifications ........................................................ 241
1-3.
Environment Specifications .................................................. 241
1-4.
External Dimensions ............................................................ 241
1-5.
Target Interface .................................................................... 242
Interface Board Switch Settings ........................................................ 243
2-1.
When the Host Computer is the PC-9800 Series ................. 243
2-2.
When the Host Computer is the PC-98 NOTE Series .......... 245
2-3.
When the Host Computer Is a PC/AT (DOS/V Series)
Machine ................................................................................ 247
3
Special Notes on the Probe ............................................................... 248
3-1.
Electrical Specifications ........................................................ 248
3-2.
Environment Specifications .................................................. 248
4
C Source Code Debugger Error Messages ....................................... 249
5
Quick Reference ................................................................................ 260
6
5-1.
Window Commands ............................................................. 260
5-2.
Dialog Commands ................................................................ 264
Supplement for the PC/AT (DOS/V) Version ................................................... 273
6-1.
Screen Operations ................................................................ 273
6-2.
Data Change/Reference Commands .................................... 274
6-3.
Process Control Commands ................................................. 274
6-4.
Shell Commands ................................................................... 275
6-5.
Other Window Commands .................................................... 275
< Contents - 7 >
Symbols ............................................................................................. 278
Alphabetic .......................................................................................... 278
< Contents - 8 >
Chapter 1
C Source Code Debugger
Overview
1. C Source Code Debugger
Overview
2. Usage Precautions
2
1
C Source Code Debugger Overview
C Source Code Debugger Operating Environment
Host computer
PC-9800 Series
PC/AT Series
(DOS/V-compatible machine)
Memory
At least 500K
At least 500K
OS
MS-DOS Ver. 3.x or later
MS-DOS Ver. 6.2
Slot
One standard personal computer
expansion slot
One standard personal computer
expansion slot
Interface systems I/O system
I/O system
C Source Code Debugger Overview
1. C Source Code Debugger Overview
3
Overview
The C Source Code Debugger and the In-circuit Emulator are integrated Development Tools for Panasonic’s MN10300 Series 32-bit microcomputers. The Incircuit Emulator consists of the main unit and the emulator controller. Because
the emulator’s control circuits are implemented on a single chip, it was possible to
greatly reduce the size, weight, and power consumption of the emulator.
The control software (the Debugger) permits efficient debugging of C and assembly programs at the source level. The Debugger also offers sophisticated functions and excellent operability with multi-window display, macro functions,
multi-job functions, various break functions, memory emulation functions, trace
functions, and EMS memory support.
Software Overview
Multi-window
Five windows (Code, Register, Watch, Command and Option) can be displayed
simultaneously. Excellent operability is provided through a wide variety of operation functions including pop-up menus, window commands and dialog commands.
C Source Code Debugger Overview
4
Source level debugging
The software permits source level debugging of C and assembly programs. (Features include specification of breaks by line numbers in the source code, referencing/changing variables specified in the source listing, and step execution at the
source level).
Macro function
The software provides a powerful macro function (language) that supports control
structures (if, for, while, do, break, etc.) similar to those found in C. The macro
function can be used to define new commands that are combinations of multiple
commands, and to perform debugging work efficiently when combined with the
break function.
Multi-job function
This function makes it possible to execute (and then return from) an MS-DOS
command with a single keystroke at any time during debugging work from within
the C Source Code Debugger.
Event function
This functions sets up triggers for hardware breaks, trace functions, and time measurement functions. The In-circuit Emulator continually monitors for the occurrence of events without halting user program execution.
There are two types of events:
(1) Execution address event
In this case, an event is generated on the basis of the address of the instruction
that was executed. Conditions can be set, such as a specified address range or
a count of the number of passes through an address.
(2) Data event
In this case, an event is generated on the basis of the data that was accessed.
Conditions can be set, such as a specified address range, specified data, access
width, match/no match, or a count.
Events that are conditions for break functions are called “break events;” events
that are conditions for starting or stopping tracing are called “trace events;” and
events that are conditions for starting or stopping time measurement are called
“time measurement events.”
C Source Code Debugger Overview
1. C Source Code Debugger Overview
5
Break functions
These functions halt user program execution.
(1) Software break
Software breaks are implemented by the Debugger by inserting PI codes
(0xff) into the user program. Therefore, these breaks can only be set in writable program areas; they cannot be set in data areas and the target ROM space.
In addition, because software breaks halt program execution before the instruction in the address where the break was set is executed, it is not possible
to set conditions such as a specified address range or a count of the number of
passes through an address.
(2) Hardware breaks
This type of break halts execution when an event occurs. Program execution
does not actually stop until several instruction cycles after the event.
(3) AND breaks
AND breaks halt program execution once all of the specified events occur,
regardless of the sequence in which they occur.
(4) Sequential breaks
Sequential breaks halt program execution once the specified events occur in
the specified sequence.
(5) Trace full break
This type of break halts program execution when the trace memory becomes
full.
(6) Forced break
This function forcibly halts execution of the user program when the ESC key
on the host computer is pressed.
C Source Code Debugger Overview
6
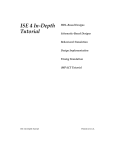
Memory Emulation Function
This function emulates a microprocessor’s internal instruction memory (ROM/
RAM) space and the target memory (extended RAM) space with the memory
(called “emulation memory”) in the In-circuit Emulator. There are two types of
emulation memory:
(1) Emulation ROM
This is readable/writable memory (RAM) that emulates the microprocessor’s
internal ROM (including internal instruction RAM). In the In-circuit Emulator, 256K of RAM is installed (fixed addresses from 0x40000000 to
0x4003FFFF) for use as emulation ROM. Note that emulation ROM is valid
only in modes that can use internal ROM (internal instruction RAM), such as
when the microprocessor’s memory mode is single chip mode or extended
mode; emulation ROM cannot be used in processor mode.
Microprocessor memory space
(extended mode)
)
)
0x00000000
Internal RAM space and
special registers use space
within the microprocessor
Internal RAM
Internal ROM
Extended RAM
)
Emulation memory in
In-ciruit emulator
0x20000000
0x40000000
Emulation ROM (readable/writable)
0x40000000
Fixed address
256Kbyte
Emulation RAM
0x80000000
)
0xC0000000
Access prohibited
C Source Code Debugger Overview
Total: no more than 1MB
1. C Source Code Debugger Overview
7
(2) Emulation RAM
This is memory (RAM) that emulates memory (extended RAM) in the target.
The In-circuit Emulator has two sets of 512K of emulation RAM (for a total of
1MB). One set is used for high-speed dedicated memory, and can operate
with no wait cycles with an external bus cycle of up to 20MHz (50nsec). The
other set can operate with no wait cycles with an external bus cycle of up to
12MHz (approximately 83nsec).
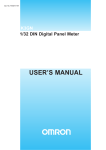
Emulation RAM permits allocation of ranges of addresses (blocks) in the
microprocessor’s extended RAM space (0x80000000 to 0xBFFFFFFF in extended mode, and 0x40000000 to 0xBFFFFFFF in processor mode). When an
address in the shaded portion of the extended RAM space in Fig. A is accessed, the emulation RAM in the emulator is accessed. This allocation of
emulation memory to a portion of the microprocessor’s memory space is
called “mapping.” A continuous segment of mapped memory is called a
“block.” With this emulator, a maximum of eight blocks can be mapped.
The size of one block can be selected as either 4K, 8K, 16K, 32K, 64K, 128K,
256K, 512K, or 1024K. The address boundaries of blocks must coincide with
boundaries for that unit of memory space. For example, if one block is 64K,
that block must fall on a 64K boundary in memory.
The aspect of the mapping process that requires the most attention is matching
the block size with the boundaries. For example, consider Fig. B, where a
continuous 64K space is to be mapped, starting from address 0x80002000
(which is an 8K boundary). Because the block boundary and the block size
must match, an 8K block must be mapped from address 0x80002000. Because address 0x80004000 is a 16K boundary, a 16K block must then be
mapped from that address. In the end, as shown in the Fig. B, four blocks are
actually used in order to allocate this 64K block. Thus, depending on the
addresses to which memory is being allocated and the amount of memory
being allocated, two or more blocks are sometimes required even though the
memory space is continuous.
C Source Code Debugger Overview
8
Memory
Extended RAM space
Emulation RAM
in the emulator
Block1
Block2
Block3
Block4
Block5
Allocates a part of the1Gbyte space
in the emulation RAM
(no more than toal of 1M)
Memory on the target is
accessed for the space
that is not allocated to
emulator RAM
0x80002000
Block 0
16K
Block 1
32K
Block2
8K
Block 3
0x80000000
0x80004000
0x80008000
0x80010000
128K
Block0
)
)
Total: 64K
(logical block)
8K
Fig A
physical block
Fig. B
0x8001FFFF
Fig. C
If there are not enough mapping blocks, then in the above example, the shortage
can be relived by mapping the space from 0x80000000 to 0x8001FFFF (128K)
with a single block, as shown in Fig. C. Finally, note that with the In-circuit
Emulator, it is not possible to map internal RAM or special registers to emulation
RAM, since these use the microprocessor’s internal resources. [☞ MAP/EX
Command]
C Source Code Debugger Overview
1. C Source Code Debugger Overview
9
Trace Function
This function makes it possible to view the execution path of the user program.
The data that is traced includes execution addresses, data addresses, data values,
and the bus status. Data addresses and data values can be switched between the
microprocessor’s internal bus (the CPU core bus) and the external bus. The following modes can be selected to establish the trace storage conditions and the
trace halt conditions.
- Trace storage conditions
(1) Normal trace (default)
In this mode, all of the microprocessor’s execution cycles are traced. Up to
16K steps can be traced.
(2) Branch trace
In this mode, only branch instructions are stored in trace memory, and the
software compensates for the portions between branch instructions. As a result, this mode makes it possible to trace longer than in normal mode. However, no tracing information is displayed from the time when tracing starts
until the first branch instruction is encountered.
(3) Conditional trace
In conditional trace mode, tracing is performed only while a specified event is
true.
16 K step
Flow of User program
Event true
- Trace halt conditions
(1) Trace continue mode (default)
In this mode, tracing continues until the user program halts, even if trace
memory becomes full. When execution of the user program halts, the last 16K
steps remain as trace data.
16 K step
Flow of
user program
execution starts
User program stop
C Source Code Debugger Overview
10
(2) Trace full halt mode
In this mode, tracing begins when user program execution begins (or resumes), and continues until trace memory is full (16K steps). The user program does not halt even if tracing is halted.
16 K step
Flow of
user program
trace stop
execution starts
(3) Delayed trigger trace
In this mode, once a specified event occurs, tracing halts after a specified
number of steps. This mode can be used to monitor the execution status of a
program before and after the occurrence of an event.
16 K step
Flow of
user program
delay count
event occurs
trace stop
Time measurement function
This function measures the execution time of a user program. The following
modes are available.
(1) Continuous measurement mode
This mode measures the time from the point when user program execution
begins (or resumes) to the point when it halts.
(2) Partial measurement modes
These modes measure the time from the occurrence of one event until the
occurrence of another event. There are two partial measurement modes.
FIRST mode:
This mode measures the time between two events only
for the first time.
MIN/MAX mode:
This mode always measures the time between two
events, and then determines the minimum and maximum
times.
C Source Code Debugger Overview
1. C Source Code Debugger Overview
11
Profile function
This function measures how much time each function (subroutine) consumed during user program execution.
RAM monitor function
This function monitors accesses to data RAM by the In-circuit Emulator and displays the contents of data RAM on the screen, all without halting user program
execution.
On-the-fly function
This function can be used to set break events, set and display tracing, and reference and change memory, all without halting user program execution. These capabilities make it possible to debug programs without halting the operation of the
target CPU.
[ ☞ 2-7 On-the-fly]
Inspect function
This function makes it possible to reference or change variables, arrays and bit
values in a format that reflects the data structure of the variables, just by specifying the source file variables, arrays and bit values displayed in the Code window.
C Source Code Debugger Overview
12
EMS memory support
The C Source Code Debugger allocates work areas in EMS memory for the main
body of the debugger, debugging information areas, etc. This ability makes it
possible to debug even programs that have large amounts of debugging information.
Overlap function
With this function, only the barest minimum of essential functions for executing
the debugging program reside in main memory; the main body of the C Source
Code Debugger and the work areas are saved to DOS files or EMS memory. This
overlap function is used in order to make it possible to debug very large programs.
In order to use this function, specify the -F or -FEMS options when starting up the
C Source Code Debugger.
Real mode
Overlap mode
Purgeable area
File
640K
Debug area
Debug area
about 100K
EMS memory
Debug information
area
-F
C source code
debugger main unit
-B
about 500K
Work area
Resident area
-FEMS
EMS memory
Other functions
History function, Template function, Logging/Batch function, Help function
C Source Code Debugger Overview
1. C Source Code Debugger Overview
2
13
Notes on Use
2-1. Hardware Notes
Notes concerning the use of the In-circuit Emulator in debugging work are
indicated below.
• The tip of the probe is manufactured with extreme precision. Handle it carefully so that it is not subjected to any impacts.
• Do not touch any of the boards inside the In-circuit Emulator, the interface
board, etc.
• Only separately excited oscillation can be supported when using oscillation
signals from the target (OSC, XI).
•
•
•
•
•
The In-circuit Emulator will not operate normally in the following cases:
When the clock is supplied from the target, and the level of the clock waveform is inadequate or there is noise in the clock signal.
When the target’s power is off.
When the current capacity of the target power supply is inadequate.
When the bus request signal from the target remains active for more than a
certain period of time (approximately 0.1 seconds).
When the target hardware is not operating normally.
Notes on Use
14
2-2. Software Notes
•
Before using the software, make a backup of the C Source Code Debugger
floppy disk. Copying this floppy disk is permitted only for maintenance and
archival purposes. To copy the disk, use the DISKCOPY command or COPY
command in MS-DOS.
2-3. ROM, RAM
•
•
Only eight blocks out of the 4GB address space can be allocated to emulation
memory. The total size of the eight blocks of memory must not exceed the
size of the memory installed in the In-circuit Emulator (1MB standard). Each
block can be set so that it starts and ends in units of 4K of memory.
Operation is not guaranteed if data accesses to special register areas are not
performed with the correct access data size and address boundaries.
2-4. Program Execution
•
Programs cannot be executed (including single-step and function-step execution) while the microprocessor is in STOP, HALT, or SLEEP mode.
[ ☞ G Command, T Command, P Command]
•
•
The stack pointer (SP register) value must always be set so that its value is a
multiple of four.
The correct value is not displayed when the In-circuit Emulator measures the
execution time (TI command) during single-step or function-step execution.
Notes on Use
1. C Source Code Debugger Overview
15
2-5. Breaks
•
•
•
If a software break is set in other than an op-code, the value of the operand is replaced
with the PI code (0xff).
Because software breaks halt execution before the instruction where the break was
set is executed, the pass count specification cannot be made.
Hardware breaks halt execution after executing as many as nine instructions after
executing the instruction for which the break event was set. The actual number of
instructions that are executed after the break but before execution stops depends on
the specific combination of instructions involved.
2-6. Tracing
•
•
•
•
•
•
The contents of trace memory are cleared if single-step or function-step execution is
performed.
When fewer than 16K steps were traced, the first instruction that was executed when
tracing started might not be included in the trace information.
When the “trace full” break is used, the last several instructions immediately before
the user program was halted might not be included in the trace information.
A disassembled display of the trace information is not possible when the microprocessor is in STOP, HALT, or SLEEP mode, or if the user target has initiated a reset.
If the contents of the microprocessor’s internal instruction RAM is overwritten while
trace information is being collected or after trace information has been collected, the
disassembled display of the trace information from the microprocessor’s internal instruction RAM space will not be correct.
If an event setting is changed while using the delayed trigger trace, the trace function
will operate incorrectly.
Notes on Use
16
2-7. On-the-fly
•
•
•
•
•
If the contents of memory are referenced or changed (including a disassembled display) while a user program is being executed, program execution is halted momentarily. (For a one-byte access to emulation memory, program execution is halted for
a maximum of 14 machine cycles; for a one-byte access to the microprocessor’s internal special registers, internal data RAM, internal instruction RAM, or external
memory in the target, program execution is halted for a maximum of 150 machine
cycles.)
While a user program is executing, the microprocessor is in STOP, HALT, or SLEEP
mode, or during a reset initiated by the user target, it is not possible to reference or
change the microprocessor’s internal special registers, internal data RAM, internal
instruction RAM, or external memory in the target, nor is it possible to display disassembled trace information.
If an event setting is changed while a user program is executing, all “event true” flags
that were set up to that point are cleared.
If a break is set while a user program is executing, there may be a time differential
between the occurrence of the cause of the break and the point when program execution breaks.
Following three icons are used for quick reference of the on-the-fly function.
NO INFLUENCES
INFLUENCES
CANNOT BE USED
:No limitation on command functions.
No influences on the program execution.
:No limitation on command functions.
Some influences on the program execution.
:On-the-fly function cannot be used.
2-8. Miscellaneous
•
•
If the measured execution time is long, a slight amount of error may begin to creep in.
If using handshake mode, the In-circuit Emulator does not generate an acknowledge
signal when the microprocessor accesses an external memory space. Therefore, it is
necessary for the user to include a circuit (or other mechanism) that generates an
acknowledge signal in all external memory spaces that will be used.
Notes on Use
Chapter 2
C Source Code Debugger
Structure
1. Equipment List
2. Equipment Description
18
1
Hardware List
The development environment is configured from the following devices. Confirm
that all of this hardware is provided before using this system. If any components are
missing or damaged, contact our sales office.
In-circuit Emulator
DIL Conversion Board
Emulator Controller
QFP Adapter
Flat-DIL Conversion Board
Surface Mount Socket
Socket Cover
34-wire Flat Cable
Option Probe
C Source Code 10300 Floppy disk
Hardware List
Micro Driver
Dummy Adapter
Interface Board
Manual
(C Source Code Debugger Installation)
2. C Source Code Debugger Configuration
2
19
Descriptions of Each Device
2-1. In-circuit Emulator
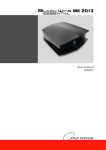
■ LED Display
There are three LEDs on the In-circuit Emulator main unit. Their functions
are described below.
Red (MEMV):
This LED lights when power is being supplied to the Incircuit Emulator main unit. Note that the power for the Incircuit Emulator is supplied from the Emulator Controller.
Yellow (TVDD): This LED lights when the power is being supplied to the
target (microprocessor).
Green (RUN):
This LED lights when the user program is executing.
In-Circuit Emulator Main Unit - Bottom View
RUN TGT ICE
PWR PWR
TRIGOUT
In-Circuit Emulator Main Unit - Side View 1
CONTROLLER
In-Circuit Emulator Main Unit - Side View 2
Descriptions of Each Device
20
■ Option Probe Connector (TRIGOUT)
This is the connector for the external trigger output.
2-2. C Source Code Debugger 10300 Floppy Disk
Before using the software, make a backup of the C Source Code Debugger
floppy disk. Copying this floppy disk is permitted only for maintenance and archival purposes.
To copy the disk, use the DISKCOPY command or COPY command in MSDOS.
Files on the floppy disk
(1) PICE103.EXE .................. C Source Code Debugger 10300 main program
(2) PINS103.EXE .................. Environment setting utility (Installer)
(3) ENV103.TXT .................. Model definition file
(4) PICE103.MAC ................. Macro instruction definition file
(5) PICE103.MES ................. Message file
(6) PT103.HLP ...................... C Source Code Debugger 10300 help file
(7) MON103.EX .................... In-circuit Emulator Monitor Program File
(8) SAMPLE.EX ................... Executable sample program file
(9) SAMPLE.C ...................... Sample program source file
(10) STARTUP.ASM .............. Sample program startup routine source file
Descriptions of Each Device
Chapter 3
Connection and Booting
1.
2.
3.
4.
Interface Board Installation
Connection Procedure
Host Computer Settings
Power ON/OFF
22
1
Installing the Interface Board
The interface board is installed in the host computer as described below.
Set the switches on the interface board before installing it in the host computer.
[ ☞ Chapter 9, section 2, Interface Switch Settings]
1-1. Installation in the PC-9800 Series
(1) Before beginning, turn the computer off.
(2) Remove the cover from an expansion slot on the rear of the computer.
(3) Connect a 34-wire flat cable to the connector (CN2) on the top side of
the interface board.
(4) With the components on the board facing up, align the board with the
card guide grooves and then push the board firmly into the slot until it
clicks into place. Then pull gently on the board to make sure that it
does not come out.
Installing the Interface Board
3. Connections and Startup
23
1-2. Installation in the PC-98 NOTE Series
(1) Before beginning, turn the computer off.
(2) Tighten the two screws on the interface board and then pull gently on
the board to make sure that it does not come out.
(3) Connect a 34-wire flat cable to the connector (CN2) on the interface
board.
1-3. Installation in the PC/AT (DOS/V) Series
(1) Before beginning, turn the computer off.
(2) Remove the top cover.
(3) With the board’s connector facing down, push the connector into the
connector inside the computer until the connector is fully seated. Then
pull on the board gently to make sure that it does not come out.
(4) Connect the 34-wire flat cable to the connector on the interface board.
Connection Procedure
24
2
Connection Procedure
The host computer is connected to the Emulator Controller via a 34-wire flat
cable. One of the connectors on the In-circuit Emulator main unit is for connection to the Emulator Controller. The In-circuit Emulator also has a connector
(TRIGOUT) for the trigger output.
2-1. Connection Procedure
After confirming that all devices are off, perform the following procedure.
1. Connect the other end of the 34-wire flat cable (1.5m) that is connected
to the interface board to the HOST I/F connector on the Emulator Controller.
2. Connect the ICE MODULE connector on the Emulator Controller to the
CONTROLLER connector on the In-circuit Emulator main unit.
[ ☞ “MN10300 Series PanaX Series Installation Manual”]
3. Attach the dummy adapter (PRB-EX-DMY103XXX) to the In-circuit
Emulator main unit. (Do this step only when installing the debugger so
that the In-circuit Emulator can run on a standalone basis without connecting a target.)
Connection Procedure
3. Connections and Startup
3
25
Host Computer Settings
After connecting the equipment, set up the environment for the control software (debugger).
Environment variable settings
The C Source Code Debugger references the following environment variables. If any of these variables need to be set, use the MS-DOS SET command.
PATH
: If COMMAND.COM, MON103.EX, PICE103.MES, or
PICE103.MAC is not found in the current directory, the C
Source Code Debugger searches for them in the directories indicated by PATH.
HELP
: If the help file (PT103.HLP) is not found in the current directory, the C Source Code Debugger searches for it in the directory indicated by HELP.
PANASRC
: This specifies the directory where the source file for the executable file that is being debugged is stored. The L and V
commands, for example, display the source files in the directory indicated by PANASRC. If PANASRC is not set, the
source files in the current directory are displayed.
TMP/TEMP : This specifies the directory where the C Source Code
Debugger work files are stored. In order to shorten the
debugger’s internal processing time, it is recommended that
this directory be set up in a RAM disk area.
If TMP/TEMP is not set, work files are created in the current
directory.
Host Computer Settings
26
3-1. Starting up the Installer
1. Turn on the host computer.
2. Connect the AC cable for the emulator controller to a 100V AC power
source, and turn on the power switch.
3. When the computer is waiting for command input, input PINS103
↵
.
Set the following items.
(1) I/F Board Select
Select the interface method between the host computer and the incircuit emulator.
(2) I/F Port Address
Specify the I/O address that was set by a rotary switch on the interface board. Use the arrow keys to specify the low-order address
and the SHIFT+arrow keys to specify the high-order address.
[Rotary switch
☞ Chapter 9, section 2]
(3) CPU Select
Use the arrow keys to select the CPU being used.
(4) Memory Mode
Use the arrow keys to select the memory mode.
(5) Bus Size
Use the arrow keys to select the microprocessor bus size.
(6) SP setting Reset Start
Input the initial value for the stack pointer. (It must be set to an
address for which physical memory is installed.)
After setting the above six items, press the ESC key to quit the
Installer.
Host Computer Settings
3. Connections and Startup
27
After the Installer has been run, the environment settings file
(PICE103.ENV) is created. This file is loaded when the C Source
Code Debugger is started up. Be careful to avoid deleting this file
accidentally or otherwise changing its contents.
Host Computer Settings
28
3-2. Debugger Test Startup
4. With the system waiting for an MS-DOS command to be input
Input “PICE103 -NOTARGET
↵ ”.
Once the screen is displayed and
Debugger startup has been confirmed, input “Q
↵
” to quit.
• Specify the “-NOTARGET” option only when the In-circuit Emulator is being used on a stand-alone basis.
Never specify this option when a target system is connected to
the In-circuit Emulator.
In the worst case, the In-circuit Emulator main unit could be damaged as a result.
• When the C Source Code Debugger is started up, the PICE103.ENV
file that was created in item 3 is loaded, as is the In-circuit Emulator
monitor file (MON103.EX), the message file (PICE103.MES), and
the macro instruction definition file (PICE103.MAC). If
MON103.EX, PICE103.MES, and PICE103.MAC are not found in
the current directory, they are searched in directories specified by the
environment variable PATH. Note that the PICE103.ENV file must
be placed in the current directory.
[C Source Code Debugger Startup Method/Startup Options
☞
Chapter 5, section 1]
Host Computer Settings
3. Connections and Startup
4
29
Power On/Off
Turn the power on in the following sequence: host computer, target system,
and Emulator Controller. This sequence will prevent overcurrent from flowing in
either direction. Note that the In-circuit Emulator is particularly vulnerable to
damage from overcurrent.
When using the In-circuit Emulator on a standalone basis (with no target system connected), simply turn on the host computer first and then the Emulator
Controller.
When turning off the power, do so in the reverse sequence (Emulator Controller, target system, and then host computer).
Power On/Off
30
Chapter 4
Characteristic C Source Code
Debugger Functions and Their
Usage
1.
2.
3.
4.
Overview of Window Display
Debugging Work Flow
Creation of Executable Files
Debugging Tutorial
32
1
Overview of Window Display
The C source code debugger provides five windows (Watch, Code, Command, Register, and Option) that display information that is required for debugging work.
[☞ Chapter 6-1, "Window Displays"]
(1)
(4)
(2)
(5)
(3)
(1) Watch window
Displays user-specified variables and the contents of memory.
(2) Code window
Displays source code or a combination of assembly and source code.
(3) Command window
Displays and allows input of dialog commands (key input, macros).
(4) Register window
Displays the contents of the registers and the status of the flags.
(5) Option window
Displays either the Memo, Back Trace, Stack, or Local window.
Overview of Window Display
4. Characteristic C Source Code Debugger Functions and Their Usage
2
33
Debugging Work Flow
This section uses a simple sample program to describe the work flow of program creation, focusing on debugging work, and also describes the basic operations involved in running the C source code debugger.
1. Creation of program
specifications
A program is designed to serve a specific
purpose. Typical examples include a program that is used to add a timer-based recording function to a VCR or a program
that controls the motor in a washing machine. Normally, these functional specifications determine the program specifications (algorithms).
↓
2. Creation of executable
files (editor, compiler,
assembler, and linker)
Once the program specifications have
been defined, an editor is used to create
(code) the source listing. Once the source
listing has been created, compiling and
linking are performed. If any errors are
generated during compiling and linking,
make the appropriate corrections in the
source listing. In this example, we will
assume that the source listing of the
sample program shown on the following
pages has been created.
[☞ Chapter 4, section 3]
↑↓
If no errors occur during the compiling
3. Debugging (debugger)
and linking process, debugging work can
begin. Steps 2 and 3 are repeated until the
program is completed.
[☞ Chapter 4, section 4]
↓
4. Program completion
Debugging Work Flow
34
3
Creation of Executable Files
The sample program (SAMPLE.C) is written in C language. This program is
a simple one that increments the contents of the sec[ ] variable. sec[0] is
incremented each time the cnt60( ) function is called. When the value of sec[0]
reaches 10, it is cleared to zero and the value of sec[1] is incremented by one.
sec[1] is also cleared to zero when its value reaches 6. This operation is repeated
continuously.
Refer to the source listing of SAMPLE.C below.
■ Sample program (SAMPLE.C)
0001
0002
/* MN10300 SERIES C SAMPLE PROGRAM */
/* MN10300 COUNTER PROGRAM */
0003
0004
0005
#define
#define
INIT_DISPDATA_L
INIT_DISPDATA_H
0006
0007
int
*i;
0008
0009
0010
0011
0012
struct abc {
int tst1;
int tst2;
};
0013
0014
struct abc test;
0015
0016
int
sec[2];
0017
0018
0019
0020
0021
0022
main(){
struct aaa {
int a1;
int a2;
}tmp;
0023
0024
initialize();
0025
0026
0027
for(;;){
display();
Creation of Executable Files
0x00
0x00
4. Characteristic C Source Code Debugger Functions and Their Usage
}
0028
0029
35
}
0030
0031
0032
0033
0034
initialize(){
init_data();
}
0035
0036
0037
0038
0039
display(){
cnt60();
}
0040
0041
0042
0043
0044
0045
0046
0047
0048
0049
0050
cnt60(){
sec[0]++;
if(sec[0] == 10){
sec[0] = 0;
sec[1]++;
if(sec[1] == 6)
sec[1] = 0;
}
}
0051
0052
0053
0054
0055
init_data(){
test.tst1=0;
test.tst2=0;
0056
sec[0] = INIT_DISPDATA_L;
sec[1] = INIT_DISPDATA_H;
0057
0058
0059
}
The sample program is then compiled and linked, and an executable file is
created.
Creation of Executable Files
36
4
Debugging Tutorial
This section provides an overview of the debugging process and the operating
methods of the C source code debugger, from start to finish, by actually using the
C source code debugger to debug the sample program (SAMPLE.C). Knowledge
of these operating methods combined with a knowledge of the window commands and dialog commands will enable you to operate the C source code
debugger.
4-1 Starting up the C source code debugger
Confirm that the current directory contains the following files. If one of these
files is not contained in the current directory, copy the file from the master disk.
PICE103.EXE .......... C source code debugger 10300
PINS103.EXE .......... Environment setup utility
ENV103.TXT ........... Type definition file
PICE103.MAC ......... Macro command definition file
PICE103.MES .......... Message file
PT103.HLP ............... Help file for the C source code debugger 10300
MON103.EX ............ In-circuit emulator monitor program file
SAMPLE.EX ............ Executable file of the sample program
SAMPLE.C ............... Sample program source file
STARTUP.ASM ...... Sample program startup routine source file
To start up the C source code debugger, input the following as an MS-DOS
command:
PICE103 -NOTARGET ↵
When this command is input, the C source code debugger startup screen appears. Specify “-NOTARGET” when there is no target system connected.
This example assumes that there is about 500KB of available space
in main memory.
Debugging Tutorial
4. Characteristic C Source Code Debugger Functions and Their Usage
37
The upper portion of the screen, the Code window, displays either the C
source code or a disassembled listing of the program.
The lower portion of the screen, the Command window, is used to execute
commands input through the keyboard and to display the results of the execution
of those commands. Characters that are input through the keyboard are displayed
on the screen at the cursor position in the lower left corner of the Command window.
The bottom line of the screen displays the functions of the ten function keys
(F1 to F10). These function keys can be used to easily execute a program, set a
breakpoint, etc.
Debugging Tutorial
38
4-2 Help
Displaying the Help screen
HELP or W
[☞ page 202]
After starting the C source code debugger, the first step is to load the executable file (SAMPLE.EX in this case). However, you do not yet know how to load
a file. In a case such as this, where you do not know how to perform a certain task,
either type:
HELP ↵
or else press the Help key:
The Help screen now appears.
Find the item corresponding to the process that you wish to perform. The item
“LOAD PROGRAM” appears near the middle of the third column. Use the cursor keys to move the cursor (the highlighted item) to the desired item. Select
LOAD PROGRAM by moving the highlighted cursor to LOAD PROGRAM and
then pressing the Return key.
Debugging Tutorial
4. Characteristic C Source Code Debugger Functions and Their Usage
39
The Help screen changes so that the LOAD PROGRAM help screen is displayed. This screen indicates that the Load command is:
L [<file name>]
Closing the Help screen
ESC
Press the ESC key to return to the original C source code debugger screen.
Debugging Tutorial
40
4-3 Loading executable files
Loading a program
L <file name>
[☞ page 114]
Now that we know that the L command is used to load executable files
(SAMPLE.EX in this example), type the following:
L SAMPLE ↵
(If the file extension is omitted from the file specification after the L command, “.EX” is assumed.)
The Code window display now changes to a display of the STARTUP.ASM
source listing.
Program counter
The source line highlighted in yellow in the Code window indicates the line
that is currently pointed to by the program counter (PC register).
Debugging Tutorial
4. Characteristic C Source Code Debugger Functions and Their Usage
41
Opening the Register window
Next, press the F2 (OptWin) key. A new window appears on the right side of
and Option window
the screen. The top portion of this new window is the Register window, which
F2
always displays the current contents of the registers.
Switching the Option window
Ctrl + F2
The bottom portion of this window is used to display one of four windows: the
Local window, the Memo window, the Back Trace window, or the Stack window.
To select one of these windows, hold down the CTRL key and then press the F2
(OptWin) key. (Note that the Local and Back Trace windows can only be displayed in C debugging mode.)
Closing the Register window
and Option window
F2
Press the F2 (OptWin) key again to close this window. The F2 (OptWin) key
is used to both open and close the window.
Debugging Tutorial
42
4-4 Screen control/file handling
How do you view the portion of the source listing below the bottom of the
Code window?
Moving the cursor between
windows
Home
[☞ page 66]
First, press the HOME key. The cursor in the Command window disappears
and moves to the Code window. Pressing the HOME key again brings the cursor
back to the Command window.
Moving the cursor down and
scrolling the screen up
↓
[☞ page 66]
Move the cursor to the Code window (if the cursor is in the Command window, press the HOME key) and then press the Cursor Down key (↓). The cursor
moves down one line.
Keep pressing the Cursor Down key. The cursor moves down, line by line.
Once the cursor reaches the bottom of the Code window, the Code window display begins to scroll up. Now press the Cursor Up key (↑). The cursor then moves
up the screen, and once it reaches the top of the Code window, the Code window
display scrolls down. In addition, the ROLL UP and ROLL DOWN keys can be
used to control the Code window display in a fashion similar to most screen editors.
Moving the cursor up and
scrolling the screen down
↑
[☞ page 66]
Displaying the File Select
window
F1
[☞ page 74]
Selecting a file
<program name> ↵
Next, press the F1 (File) key. The File Select window appears on the screen.
In this example, the SAMPLE.C and STARTUP.ASM files are displayed. When
debugging a program that has more source files, the name of each source file is
displayed in this window. After selecting a file by using the cursor keys to highlight the desired file name in yellow, press the Return key. The File Select window then closes and the selected file is displayed in the Code window.
Debugging Tutorial
4. Characteristic C Source Code Debugger Functions and Their Usage
Displaying the disassembled
code and C source code
F3
[☞ page 69]
43
Once the Return key has been pressed and the File Select window has been
closed, press the F3 (SrcSW) key. The Code window display switches to a mixed
display of disassembled code and the C source code. This display is useful for
more detailed debugging than is possible with the source listing alone.
Press the F3 (SrcSW) key again. Now the display shows the source code only
again.
You have loaded the executable file (SAMPLE.EX), and now know about the
contents of the windows displayed on the screen. You are now ready to execute
the program.
Debugging Tutorial
44
4-5 Program execution and break
This section explains how to execute a program, and how to set and cancel
breaks.
Program function step
execution
F10
[☞ page 71]
There are two methods for executing a program one line at a time (“step execution”): function step execution and single step execution. First we will try
function step execution. Press the F10 (FncStp) key. The current line (the line
highlighted in yellow) in the Code window moves down one line. This means that
one step has been executed. Press the F10 (FncStp) key several more times. The
current line keeps changing one line at a time.
Now look at the register display in the Register window. (If the Register window is not displayed on the screen, press the F2 (OptWin) key.) The most recent
register values are displayed each time the F10 (FncStp) key is pressed.
Program single-step execution
There is another method of step execution. Press the F8 (SglStp) key. The
F8
current line moves in the same fashion as in function step execution. Press the F8
[☞ page 71]
(SglStp) key several more times. The current line then steps sequentially (one
step at a time) through the functions “display( )” and “cnt60( )”.
(This method is referred to as “single-step execution.”)
Debugging Tutorial
4. Characteristic C Source Code Debugger Functions and Their Usage
45
The difference between function step execution with the F10 (FncStp) key and
single-step execution with the F8 (SglStp) key is whether called functions as a
whole are regarded as one step, or are also executed internally one step at a time.
Setting/deleting break
(software break)
F9
[☞ page 71]
Next, we will set a break (software break). Move the cursor to the Code window (if the cursor is currently in the Command window, press the HOME key),
and move the cursor to the 45th line of the SAMPLE.C file. Once the cursor has
been positioned in the 45th line, press the F9 (Break) key. The 45th line is now
underlined. A break has now been set in the 45th line of the source listing.
To delete a break, move the cursor back to the line where breakpoint is set, and
press the F9 (Break) key. The underline disappears, indicating that the break has
been deleted.
Debugging Tutorial
46
Executing the program
F5
[☞ page 70]
Deleting all break events
B C *
[☞ page 136]
Program forced stop
ESC
[☞ page 71]
Now we will execute the program by pressing the F5 (Go) key. The program
then stops at the 45th line of the source listing, where we set our break (software
break).
Input the following from the keyboard:
BC* ↵
This command deletes all break events that were set with the dialog command.
Now press the F5 (Go) key again. Because there is no break event set, execution continues uninterrupted. To interrupt program execution while a program is
running, press the ESC key. This forcibly stops program execution.
Debugging Tutorial
4. Characteristic C Source Code Debugger Functions and Their Usage
47
4-6 Memory referencing
Referencing the contents of
memory in the Command
window
D <address>
[☞ page 167]
The values of the variables sec[0] and sec[1] are the most important elements
in the sample program. To reference the value of sec, input the following from the
keyboard:
D sec ↵
The following values are displayed in the Command window:
0000000C
0A 00 00 00 00 .................
The contents of sec[0] in address 0x0000000C and of sec[1] in 0x00000010
are displayed in hexadecimal. (sec was declared as type “int”.)
The values indicated above are examples only, and will not necessarily match the actual values.
Referencing the contents of
memory in the Watch window
W ? <symbol>
[☞ page 195]
Input the following from the keyboard:
W? sec ↵
A new Watch window is opened above the Code window, displaying the declared type, address, and value of sec.
Debugging Tutorial
48
The data registered for watching is continuously updated and displayed in the
window. As an example, set a break (software break) (using the F9 (Break) key)
in the 45th line of the source listing. Next, execute the program using the F5 (Go)
key. The Watch window is updated. Continue to press the F5 (Go) key; it should
be apparent that the values are updated continuously.
Canceling all Watch windows
Y *
[☞ page 199]
To cancel all Watch windows, input the following from the keyboard:
Y* ↵
All watch windows disappear from the screen.
Debugging Tutorial
4. Characteristic C Source Code Debugger Functions and Their Usage
49
4-7 Subprocesses
The C source code debugger is equipped with a function that allows another
MS-DOS command to be started up while debugging work is in progress, and
permits immediate switching between that command and the C source code
debugger. In short, it is possible to simultaneously start up the C source code
debugger and another MS-DOS command on one computer and switch between
the two processes with a simple key operation while debugging is in progress. In
the C source code debugger, this second process is called the “subprocess.”
Starting up a subprocess
!
[☞ page 203]
We will now start up a subprocess. To do so, input the following from the
keyboard:
!↵
This causes the MS-DOS command input screen to appear. While in this
state, MS-DOS commands can be used normally. Use a text editor to open the
SAMPLE.C file that we have been using to practice debugging operations.
If the message “Insufficient Memory” is displayed when shifting to
the subprocess, refer to the C source code debugger startup option
“-B”.
[☞ Chapter 5, Startup Options]
Debugging Tutorial
50
Returning from a subprocess
Ctrl + 0
Returning to a subprocess
Ctrl + 1
[☞ page 77]
To return to the C source code debugger screen, hold down the CTRL key and
then press the “0” key on the numeric keypad. Next, hold down the CTRL key
and then press the “1” key on the numeric keypad in order to return to the editor.
Simple operations such as these can be used to switch between the C source code
debugger and an editor or other MS-DOS commands (applications). This function makes it possible to reference source files and specification document files
while debugging, or to correct the portion of a source file where a bug was found.
When switching processes, the C source code debugger does not
switch data within the MS-DOS system (such as the current directory, etc.). Therefore, if the current directory, etc., was changed in
the subprocess, restore the original status before returning to the C
source code debugger. In addition, because there is no exclusive
control of files between the two processes, extra caution is required
when both processes access the same file.
Debugging Tutorial
4. Characteristic C Source Code Debugger Functions and Their Usage
51
4-8 Macro commands
The C source code debugger has a macro function that makes it possible to
combine several commands in order to create new commands, or to judge conditions. While the macro function may seem daunting to the novice user at first,
once it is mastered it makes debugging work easier.
We will create a macro that sets a breakpoint in the 45th line of SAMPLE.C
and then, when the value of sec[0] is “9”, displays a dump starting from the address sec.
{testmacro
bp .sample.c:45
g
while{_ _run_ _
}
if{val(sec[0]==9)
d sec
}
The first line of the macro, the declaration, declares the name of the macro as
“TESTMACRO”. The second line sets a break (software break) in the 45th line
of the source listing. (The BP command can be used to set a break (software
break) in the same fashion as the F9 (Break) key.) The third line executes the user
program. The fourth and fifth lines form a “while” loop that waits until the user
program is stopped (i.e., the break is triggered). The sixth and seven lines consist
of the processing that is performed after the break is triggered.
Executing a macro command
“Registered macro name”
[☞ page 223]
In order to execute this macro, simply input the following from the keyboard:
TESTMACRO ↵
The macro previously defined is then executed.
After the user program is executed, the macro waits until the program is
stopped; once the program is stopped, if the value of sec[0] is “9”, a dump starting
from the address sec is displayed. The macro then terminated.
Debugging Tutorial
52
4-9 Exiting the C source code debugger
The final step is to quit the C source code debugger and return to MS-DOS.
Input the following from the keyboard:
Exiting the C source code
debugger
Q
[☞ page 201]
Q↵
You should now be back at the MS-DOS screen.
If the message “Not terminated subprocess” was displayed, press CTRL + 1 to
return to the subprocess and then terminate that program. For example, if the MSDOS prompt is shown in the subprocess, input the following:
EXIT ↵
The following message is then displayed:
“Please hit the SPACE key to return to PICE.”
Pressing the space bar returns you to the debugger screen. Now that the subprocess has been terminated, input the following again:
Q↵
Now the C source code debugger terminates and you are returned to the MSDOS prompt.
Debugging Tutorial
4. Characteristic C Source Code Debugger Functions and Their Usage
53
4-10 Program completion (gaining familiarity with
C source code debugger operation)
In actual program development, completing a program is not a simple matter.
The process of editing, compiling, assembling, linking, and debugging will be
repeated a number of times before the program is complete.
After operating the C source code debugger as we went through the basic process in this tutorial, you should now have a general understanding of how to use
the C source code debugger. Now you are ready to use the C source code
debugger on an actual program and discover more advanced uses of the debugger.
Debugging Tutorial
54
Chapter 5
C Source Code Debugger
Startup Method and Options
1. C Source Code Debugger Startup
Method and Options
56
1
C Source Code Debugger
Startup Method and Options
To start up the C source code debugger, input the following at the MS-DOS
command level:
PICE103 [<option>] [<debug file> [<parameter>]] ↵
If the INIT.MCR file is located in the current directory when the C source
code debugger is started up, the C source code debugger automatically loads and
executes this file. This file is equivalent to an MS-DOS AUTOEXEC.BAT file.
The C source code debugger startup options are listed below. (A space is
required between options.)
Startup option
Description of option
-B [<size D>][,<size M>]
Specifies the size of the debugging information area and
-BEMS [,<size M>]
the macro area.
Reserves the debugging information area in EMS
-E<extension>
memory.
Specifies the default extension.
-F
-FEMS
Specifies overlap mode (save to file).
Specifies overlap mode (save to EMS memory).
-N
-TAB<tab size>
Disables indicators.
Specifies tab size.
-X
-XC
Specifies assembler debugging mode.
Specifies CC103 compiler debugging mode.
-NOTARGET
Specifies startup without target system.
C Source Code Debugger Startup Method and Options
5. C Source Code Debugger Startup Method and Options
Specifying the size of
the debugging information
area and the macro area
-B
57
This option specifies the size of the debugging information area and the
macro area.
A wide variety of information is stored in the debugging information area,
including symbol names and line number information. This information area
must be about 1/2 the size of the executable file (the EX file when compiled with
all debugging options), including the debugging information. As a result, if the
debugging information area is reserved in conventional memory (the memory
area up to 640KB), it will be impossible to debug a large program. In such a case,
reserve the debugging information area in EMS memory.
-B [<size D>][,<size M>]
Specify numeric values for the size of the debugging information area <size
D> and the macro area <size M>.
<size D>
<size M>
Size (in 16KB units) of the area where the debugging information is to be stored.
Reserves an area of the specified size in a memory area of less
than 640KB. If omitted, a 64KB area is reserved.
Size (in 1KB units, up to a maximum of 32KB) of the macro
command registration area.
If omitted, a 3KB area is reserved.
Reference: For example, in order to reserve 128KB for the debugging information area and 5KB for the macro area, input the following:
PICE103 -B128,5 ↵
-BEMS [,<size M>]
This option reserves the debugging information area in EMS memory.
Specify a numeric value for the size of the macro area <size M>.
Reference: For example, in order to reserve the debugging information area in
EMS memory and also reserve 10KB for the macro area, input the
following:
PICE103 -BEMS, 10 ↵
C Source Code Debugger Startup Method and Options
58
Specifying overlap mode
-F
This option specifies overlap mode, in which only the bare minimum of
essential functions for executing the debugging program are loaded into
main memory, while the C source code debugger itself and the work area
are saved to EMS memory or to a file.
[☞ Chapter 1, section 1 for the Overlap function]
-F
This option uses a file as the save area for overlapping.
If the -F option is specified, the overlap file is created in the directory specified by the environment variable TMP or TEMP. Therefore, the overlap time can
be greatly reduced by specifying a RAM disk for an overlap disk. If this environment variable is not set, the file is created in the current directory.
[☞ Chapter 3, section 3]
-FEMS
This option uses EMS memory as the save area for overlapping.
This option allows faster task swapping than when saving to a file.
Specifying the default
extension
-E <extension>
This option specifies the default source file extension.
<extension> becomes the default source file extension. If this option is omitted, .C becomes the default extension.
Disabling indicators
This option disables the display of the indicators that indicate the screen
type.
If the indicators are disabled, “S” and “U” (the subprocess screen and user
screen indicators) are not displayed in the lower left corner of the screen.
(This option can be specified for the PC-9800 Series only.)
-N
Setting the tab size
-TAB
This option specifies the tab size when displaying a source listing in the
Code window.
-TAB (tab size)
The tabs are adjusted to the number specified by the tab size. If this option is
omitted, the tab size is set to “8”.
This function is useful for displaying files in which the tab size was changed
with an editor.
C Source Code Debugger Startup Method and Options
5. C Source Code Debugger Startup Method and Options
59
Reference: To set the tab size to four columns, input the following:
PICE103 -TAB4 ↵
Specifying assembler
debugging mode
-X
This option specifies either the assembler or various C debugging modes.
-X
This option specifies the assembler debugging mode. If the C source code
debugger is started up in this mode, commands related to C (stack back tracing,
local variables) cannot be used.
-XC (default)
This option specifies the CC103 compiler debugging mode.
Starting up with no target
system
-NOTARGET
This option specifies that the in-circuit emulator is to be used by itself (without being connected to a target system).
This option must be specified if there is no target system.
Never specify this option if a target system is connected. Doing so
will cause the voltage of the target and that of the in-circuit emulator to be different, causing the in-circuit emulator to operate incorrectly and damaging the system.
C Source Code Debugger Startup Method and Options
60
C Source Code Debugger Startup Method and Options
Chapter 6
Window Commands
1. Window Displays
2. Window Commands
3. Data Reference Functions
62
1
Window Displays
The C source code debugger supports two types of command specification,
Window commands and Dialog commands, using either the function keys or the
Control key. This chapter explains the Window commands and how to use them.
For details on Dialog commands, refer to Chapter 7, “Dialog Commands.”
(1)
(2)
(1) Code window
This window displays either source code or a combination of source code and
disassembled code. If the cursor is located in this window, the Window commands can be used to change the display by scrolling the source code up or down,
for example, or set/cancel software breaks where the cursor is located.
(2) Command window
This window is used to input Dialog commands and to display commands.
This window stores the display contents in the Command window display buffer
(reserved as an 8KB area) at the same time that the information is displayed on the
screen. If the cursor is located within this window, the cursor keys can be used to
scroll the display up and down over the range of the display buffer.
Window displays
6. Window Commands
63
(3)
(3) Register window
This window displays the contents of the registers and the statuses of the flags.
This window can be easily opened or closed as necessary.
Window displays
64
(6)
(5)
(7)
(4)
(8)
(4) Option window
One of four windows (Memo, Back Trace, Stack, and Local) can be selected
for display in this window. The Back Trace and Local windows can only be
displayed in C debugging mode.
Memo window:
Back Trace window:
Stack window:
Local window:
Displays the contents of the memos registered by the
MEM command.
Displays the back trace for the C functions.
Displays the contents of stack memory.
Displays the list of local variables for the function where
the program counter (PC register) is.
(5) Watch window
This window always displays the most recent values for symbols and memory
specified by the W command (the watch registration dialog command).
This window is not displayed if nothing is registered for watching.
(6) Status display area
The causes of breaks are listed below.
(The display messages are shown in parentheses.)
Software break (Break-point No. = xx)
Program execution stops before executing an address where a software break
was set by the BP command.
Window displays
6. Window Commands
65
Hardware break (Break-point No. = xx)
Program execution stops when an event that was set by the BP command occurs.
And break (And Break)
Program execution stops when all of the events set by the BPA command
occur.
Sequential break (Sequential Break)
Program execution stops when all of the events set by the BPS command occur in sequence.
Trace-full break (Trace-full Break)
Program execution stops when the trace memory is full of data.
Forced break (ESC Break)
User program execution is forcibly stopped when the ESC key on the host
computer is pressed.
Undefined instruction break (Illegal Instruction Break)
This type of break occurs when an attempt is made to execute an undefined
instruction.
Illegal memory access break (Illegal Memory-access Break)
This type of break occurs when an illegal memory access is made.
RAM error break (RAM Error Break)
This type of break occurs when an attempt is made to access an area for which
memory accesses are not allowed.
Data misalignment break (Data Miss-alignment Break)
This type of break occurs when an attempt is made to read or write long-word
(32-bit) data in an address that is not a multiple of four, or word (16-bit) data
in an odd address.
In addition to messages that indicate the causes of breaks, the following messages are also displayed:
Trace stop
This message is displayed when tracing has stopped (but the user program is
still running).
Trace full stop
This message is displayed when tracing has stopped because trace memory is
full of data (but the user program is still running).
(7) Title display
In source mode, this displays the name of the source file displayed in the Code
window; in assembler mode, this displays the name of the function in the address where the cursor is located and the offset from the start address of the
function.
(8) Program counter
The current position pointed to by the program counter is highlighted in yellow.
Window displays
66
2
Window Commands
2-1 Screen control
This section explains screen control (cursor movement, scrolling, etc.) in the
Command window and the Code window.
Note that the operation of each key differs according to whether the cursor is
located in the Command window or the Code window.
[HOME]
Moves the cursor between the Command window and the Code window.
When the cursor is in the Command window, pressing this key moves the cursor
to the Code window, and when the cursor is in the Code window, pressing this key
moves the cursor to the Command window.
[ ← / Ctrl + S]
Moves the cursor one character to the left.
[ → /Ctrl + D ]
Moves the cursor one character to the right.
[ ↑ / Ctrl + E ]
When the cursor is in the Code window, pressing these keys moves the
cursor up one line.
When the cursor is in the Command window, pressing these key scrolls the window down one line. The contents displayed in the command window are logged
in the display buffer (reserved as an 8KB area); any contents remaining in the
buffer can be referenced by scrolling the window up or down.
[ ↓ / Ctrl + X ]
When the cursor is in the Code window, pressing these keys moves the
cursor down one line.
When the cursor is in the Command window, pressing these key scrolls the window up one line. However, immediately after a D or TD command, pressing these
keys displays the next line that follows the displayed results of the D or TD command.
[☞ D command and TD command]
Window commands
6. Window Commands
67
[ Ctrl + A ]
When the cursor is in the Code window (with a source listing displayed),
pressing these keys moves the cursor one word to the left.
When the cursor is in the Command window, pressing these keys moves the cursor to the beginning of the line.
[ Ctrl + F ]
When the cursor is in the Code window (with a source listing displayed),
pressing these keys moves the cursor one word to the right.
However, when disassembled code is displayed, pressing these keys moves the
cursor in the sequence address to code to mnemonic.
When the cursor is in the Command window, pressing these keys moves the cursor to the end of the line.
(
[ Ctrl + Q • S ]
press [Ctrl +Q]
then [Ctrl +S ]
[ Ctrl + Q•D ]
[ RollUp / Ctrl +C ]
[ RollDown / Ctrl +R ]
)
Pressing these keys moves the cursor to the beginning of the line.
This command is valid only when a source listing is displayed in the Code window, and the cursor is located in the Code window.
Pressing these keys moves the cursor to the end of the line.
This command is valid only when a source listing is displayed in the Code window, and the cursor is located in the Code window.
When the cursor is located in the Code window, pressing these keys
scrolls the contents of the Code window (whether a source listing is displayed or disassembled code is displayed) up one screen.
When the cursor is located in the Command window, pressing these keys scrolls
the contents of the Command window up one screen.
CTRL + C can also be used to interrupt long display operations caused by the D
command, and repeated step execution by the T command or the P command.
When the cursor is located in the Code window, pressing these keys
scrolls the contents of the Code window (whether a source listing is displayed or disassembled code is displayed) down one screen.
When the cursor is located in the Command window, pressing these keys scrolls
the contents of the Command window down one screen.
Window commands
68
[ Ctrl + Q• R ]
Pressing these keys moves the cursor to the beginning of the source file
that is currently displayed.
This command is valid only when a source listing is displayed in the Code window, and the cursor is located in the Code window.
[ Ctrl + Q • C ]
Pressing these keys moves the cursor to the end of the source file that is
currently displayed.
This command is valid only when a source listing is displayed in the Code window, and the cursor is located in the Code window.
[ Ctrl + ← ]
Pressing these keys enlarges the Option window.
In other words, this command moves the vertical boundary between the Option
window and the Command and Code windows to the left.
[ Ctrl + → ]
Pressing these keys reduces the Option window.
In other words, this command moves the vertical boundary between the Option
window and the Command and Code windows to the right.
[ Ctrl + ↑ ]
Pressing these keys enlarges the Command window (and reduces the
Code window).
In other words, this command moves the boundary between the Command window and the Code window up one line.
[ Ctrl + ↓ ]
Pressing these keys reduces the Command window (and enlarges the
Code window).
In other words, this command moves the boundary between the Command window and the Code window down one line.
[ Ctrl + J ]
Pressing these keys redisplays the screen.
[ Ctrl + Q •W ]
Pressing these keys enlarges the Command window to its maximum size
(and reduces the Code window to its minimum size).
[ Ctrl + Q • Z ]
Pressing these keys reduces the Command window to its minimum size
(and enlarges the Code window to its maximum size).
[ Ctrl + Q • J]
Pressing these keys restores all windows to their initial window sizes.
Window commands
6. Window Commands
[ F2(OptWin) / Ctrl + 4 ]
(Press the "4" on the numeric
keypad.)
69
Pressing these keys turns the Register window and Option window display
on and off.
If the Register window is not displayed, pressing these keys causes the Register
window to appear. If the Register window is displayed, pressing these keys
causes the Register window to disappear.
[ Ctrl + F2(Optsw) ]
[ Ctrl + O ]
These keys switch the contents of the Option window display.
This command changes the Option window from the Memo window to the Stack
window. (When there is debugging information in the user program, this command changes the Option window in the following cycle: Memo to Back Trace to
Stack to Local.)
This command is valid only when the Register window and the Option window
are displayed.
F3(SrcSW)
When the Code window is displayed, pressing this key changes the
source listing display to the disassembled code display, or changes the
disassembled code display to the source listing display.
[☞ page 43]
The code listing is displayed so that the line that the program counter (PC register)
is currently pointing at is displayed. However, when displaying a source listing, if
there is no source line that corresponds to the current value of the program
counter, the last source line that was displayed, is displayed.
[ Ctrl + F3(SrcSW1) ]
When the Code window is displayed, pressing this key changes the
source listing display to the disassembled code display, or changes the
disassembled code display to the source listing display.
The screen switches, starting the new display from the line in the Code window
where the cursor is currently located. However, when displaying a source listing,
if there is no source line that corresponds to the line where the cursor is currently
located, the last source line that was displayed, is displayed.
Window commands
70
2-2 Execution/Breaks
The C source code debugger can be used to perform debugging work while a
program is in progress by using the execution/break commands. The execution/
break commands include not only the Window commands described below, but
also Dialog commands such as the G and BP commands.
[☞ Chapter 7, sections 2 and 3]
The line pointed to by the program counter (PC register) is highlighted in
yellow. Lines where breaks (software breaks) are set are underlined.
In normal debugging work, load the executable file that is to be
debugged before using an execution/break command. The executable file can be loaded by the L dialog command, or can be specified when the C source code debugger is started up.
[☞ Chapter 7, section 2 for the L command]
F5 (Go)
Pressing this key executes the user program from the current location indicated by the program counter (PC register).
All enabled break events are valid, and when the user program reaches a break
event or is forced to break because the ESC key was pressed, the user program
stops executing.
[☞ G command]
Command set with the BP~ and /C <command> cannot be executed.
[ F7(Come) ]
Pressing this key executes the user program from the current location indicated by the program counter (PC register) to the current cursor location.
All enabled break events are valid, and when the user program reaches a break
event or is forced to break because the ESC key was pressed, the user program
stops executing.
[☞ G command]
Window commands
6. Window Commands
71
[ F8 (Sg1Stp) ]
Pressing this key executes single-step execution (in which the program is
executed one step at a time, even within called functions (subroutines)).
[☞ T command]
[ F9 (Break) ]
Pressing this key sets/cancels breaks (software breaks).
When the F9 key is pressed, a break is set at the line where the cursor is located
within the Code window; the line is displayed with an underline to indicate the
break. If a break is already set at the line where the cursor is located, that
breakpoint is cancelled.
[☞ BP command]
[ F10 (FncSp) ]
Pressing this key executes function step execution (in which called functions (subroutines) are regarded and executed as one step).
[☞ P command]
[ Esc ]
This key stops (forced break) user program execution.
Reference: The actual operation during function step execution of a subroutine
consists of setting a breakpoint after the subroutine call instruction
and then executing the user program. Therefore, if there is a
breakpoint set within the subroutine, the user program will stop executing there. However, if there is an infinite loop within the subroutine, the user program will not stop since control will not return
from the subroutine. (To stop the user program, press the ESC key
(forced break).)
[ Ctrl + Shift + Graph ]
If the microcontroller hangs for some reason and the command that was
input does not terminate, press these keys in order to forcibly exit that
command.
One possible cause is that the target system is not operating properly.
Window commands
72
2-3 Getting/selecting strings
This command uses the cursor to specify character strings (variable
names, function names, etc.) displayed in the Code window and then input
them in the Command window.
With this command it is possible to get a long variable name simply by specifying
it with the cursor, making Dialog command input easier. The Select String (Sel)
command makes it possible to use the Inspect, Watch, View, and Memo functions
with the selected symbol.
[ Ctrl + F9(Get) / Ctrl + G]
Pressing these keys gets a character string in the Code window and inputs
it into the Command window.
Move the cursor to the Code window (source code display), and position it at
the character string to be gotten. Pressing CTRL + G or CTRL + F9 then copies
the character string to the Command window, where the command string has the
same validity as if it had been input through the keyboard.
Character strings gotten by this function must consist only of letters
[from “a” (“A”) to “z” (“Z”)], the underscore symbol (“_”), and
numerals (from “0” to “9”).
Window commands
6. Window Commands
[ Ctrl + F10(Se1) ]
73
These keys are used to select a character string.
First, move the cursor to the beginning of the character string to be selected, and
then press CTRL + F10. The character where the cursor is located is then highlighted in yellow, and the function key display changes to the Select String local
command display. Next, move the cursor to the end of the desired character
string.
The local commands that are available when selecting a character string
are described below.
[ F1 -- F5, F10 ]
Pressing one of these keys (F1 to F5, and F10) registers the selected
character string in a memo number area with the same number as the
function key that was pressed.
[☞ MEM command]
[ F6(Inspct)/ Ctrl + I / I ]
These keys are used to inspect the selected character string as a C expression.
[☞ Chapter 6, section 3-1 “Inspect function”]
[ F7(Watch)/
Ctrl +W/ W ]
These keys are used to register the selected character string as a C expression in the Watch window.
[☞ Chapter 6, section 3-4 “Watch function”]
[ F8(View) / Ctrl +V/ V ]
These keys are used to view the selected character string as a C expression.
[☞ Chapter 6, section 3-5 “View function”]
[ F9(Get)/ Ctrl + G/ G / ↵ ]
These keys are used to get the selected character string for input to the
Command window.
Window commands
74
2-4 File display
This section explains commands for listing/modifying those files that can be
referenced and for searching for character strings.
The file display function is valid only when source code is displayed in the Code window and the cursor is located in the Code
window.
[ Shift + Home ]
Pressing these keys switches the Code window display to the next source
file display.
This command is valid when source code is displayed in the Code window.
[ F1(File) ]
Pressing this key opens the file selection window and displays the files
that can currently be selected.
The file that is highlighted in the file selection window is the currently selected
source file. Use the cursor keys to move the highlighted bar to the name of the
desired source file and press the Return key; the contents of the selected source
file are then displayed in the Code window.
File selection window
In addition, the V command is used to reference the contents of files other than
those displayed in the file selection window.
[☞ V command]
Window commands
6. Window Commands
[ F4(Search) ]
75
When no search string has been specified, this key opens the window that
is used to request input of the search string. Once a search string has
been input in this window, the function searches for the search string in the
forward direction, starting from the current cursor position and proceeding
towards the end of the file.
When a search string has already been specified, the function searches for the
search string in the forward direction, starting from the current cursor position
and proceeding towards the end of the file. Use CTRL + Q or CTRL + F to input
a new search string.
If the search string is found, the corresponding string is highlighted and the search
is terminated. To continue the search, press the F4 key again. If no search string
is found, the message “No Search String Found.” is displayed and the search is
interrupted.
[ Ctrl + Q • F ]
Pressing these keys opens the window that is used to request input of the
search string.
If a search string was previously input, that string is highlighted. If any key is
pressed, the highlighted string is no longer highlighted and the debugger awaits
normal input. When inputting a new string, the shell function history and line
editing functions can be used. Once the search string has been input, the function
searches for the search string in the forward direction, starting from the current
cursor position and proceeding towards the end of the file.
[ Ctrl + L ]
Pressing these keys causes the function to search for the search string
(specified previously by using CTRL + Q, CTRL + F, or F4) in the forward
direction, starting from the current cursor position and proceeding towards
the end of the file.
Window commands
76
[ Ctrl + F4(Srch↑) /
Ctrl + B ]
Pressing these keys causes the function to search for the search string
(specified previously by using CTRL + Q, CTRL + F, or F4) in the reverse
direction, starting from the current cursor position and proceeding towards
the beginning of the file.
[ Esc ]
The message “Searching [Interrupt with ESC key]” is displayed at the top
of the screen when a string search is in progress. To interrupt the search,
press the ESC key. The message “Cancelling String Search” is displayed
and the search is cancelled.
Window commands
6. Window Commands
77
2-5 Process control/RAM monitor
Process control and RAM monitor screen switching are performed using the
CTRL key in conjunction with the keys on the numeric keypad.
[ Ctrl+ 0 ]
Pressing these keys while a subprocess is being executed pauses the
subprocess and returns control to the C source code debugger.
These keys are valid only while a subprocess is being executed.
[ Ctrl + 1 ]
Pressing these keys while the subprocess is paused pauses the C source
code debugger and passes control to the subprocess.
These keys are ignored if the subprocess was not started up by the “!” command.
[☞ Chapter 4, section 4-7 for the “!” command]
[ Ctrl + 4 ]
These keys turn the display of the Register window and Option window on
and off.
If the Register window is not displayed, pressing these keys displays the Register
window. If the Register window is displayed, pressing these keys closes the Register window. (These keys have the same function as the F2 key.)
[☞ Chapter 6, section 2-1 “Screen control”]
[ Ctrl + 5 ]
Pressing these keys changes the display to the RAM monitor.
To return to the debugger screen, press CTRL + 5 again.
Window commands
78
2-6 Shell functions
The C source code debugger registers in sequence all key input other than
Window commands in the history buffer (an area of about 1500 characters). The
contents of this history buffer can be searched and line edited. Unlike the MSDOS template functions, the cursor can be moved freely in the line being edited,
and characters can be inserted, deleted or changed in a fashion similar to a screen
editor. Making full use of the shell functions makes it possible to reduce the
volume of keyboard operations during debugging.
Each operation described here is valid for Command window input, search
string input (refer to the search function), and inputting the array elements
(Range)/changing values (Change) for the Inspect function.
History search and line editing using the shell commands is possible only when the cursor is located in the Command window.
Reference: In the C source code debugger, when the cursor is in the Code window, pressing the Shift key causes the cursor to shift temporarily to
the Command window. Releasing the Shift key causes the cursor to
return to the Code window. Therefore, the standard for many shell
functions is SHIFT + [key].
[ BS / Ctrl + H ]
Pressing these keys deletes the last character that was input.
[ ← / Shift + ← /
Ctrl + S ]
Pressing these keys moves the cursor to the left.
[→/ Shift + → / Ctrl + D ]
Pressing these keys moves the cursor to the right.
If the cursor is already located at the end of the line, the operation is identical to
that of SHIFT + F1 (C1).
[ Shift + F4(LnTop) /
Ctrl +A ]
Pressing these keys moves the cursor to the beginning of the line.
Window commands
6. Window Commands
79
[ SHIFT +F5)LNBOT) /
CTRL+ F ]
Pressing these keys moves the cursor to the end of the line.
If the cursor is already located at the end of the line, the operation is identical to
that of SHIFT + F3 (CA).
[ Del / Ctrl + G ]
Pressing these keys deletes the character located at the cursor position.
[ Shift + F7(ln Can) /
Ctrl + U ]
Pressing these keys deletes all of the characters in the line currently being
edited.
[ Ins/ Ctrl + V ]
Pressing these keys switches between Insert mode and Replace mode.
[ Shift + ↑ / Ctrl + W ]
Pressing these keys displays the preceding portion of the history buffer.
In addition, if a character string has been input on the command input line, a
search is conducted for a character string beginning with that character string
within the history buffer, going from newest to oldest. If a character string that
satisfies the conditions is found, it is displayed. If these keys are then pressed
again, the search continues in the older part of the history buffer.
[☞ "!" command and "!!" command]
Example
>bp tcirq
>U main
>bp count
>bp ■
If SHIFT + ↑ is then pressed, the previously input commands are searched for
a character string that begins with “bp”; the character string that is found, “bp
count” is then displayed. If SHIFT + ↑ is then pressed again, “bp tcirq” is displayed.
[ Shif + ↓ / Ctrl + Z ]
Pressing these keys displays the subsequent portion of the history buffer.
In addition, if a character string has been input on the command input line, a
search is conducted for a character string beginning with that character string
within the history buffer, going from oldest to newest. If a character string that
satisfies the conditions is found, it is displayed. If these keys are then pressed
again, the search continues in the newer part of the history buffer.
Window commands
80
[ Shift + F1(C1) /
Shift + →/ Ctrl + D ]
Pressing these keys copies the character at the current cursor position
from the preceding portion of the history buffer and displays it.
This function is equivalent to the F1 key of the MS-DOS template functions.
[ Shift + F2(Histry) ]
Pressing these keys opens the History window and displays the contents
of the history buffer.
If a character string has been input in the command input line, a character string
that begins with that character string is displayed in the History window. The
highlighted line in the window is the currently selected line.
■ Key operations in the History window/Symbol extension window
ESC
Closes the window.
↑/CTRL + E
↓/CTRL + X
Moves the selected line up one line.
Moves the selected line down one line.
ROLL DOWN/CTRL + R
ROLL UP/CTRL + C
Moves the displayed item up one item.
Moves the displayed item down one item.
↵ (Return)
Copies the currently selected line to the command line and
then closes the window.
0, 1...9 (Numeric keys)
Selects a line according to the numbers at the left end,
copies the line to the command line, and then closes the
History window.
Window commands
6. Window Commands
81
[ Shift + F3(CA) ]
Pressing these keys copies the character string following the current cursor position from the preceding portion of the history buffer and displays it.
This function is equivalent to the F3 key of the MS-DOS template functions.
[ Shift + F6(ExtSym) ]
Pressing these keys opens the Symbol Extension window and displays
the symbol extensions.
The function searches for a symbol that begins with the last character string in the
command input line and displays it in the window. For example, after inputting
the following command:
>d cnt
pressing SHIFT + F6 starts a search for a symbol name that begins with “cnt” (for
example, cntd, cnt123, cnt_time, etc.), which is then displayed.
The line that is highlighted in the window is the currently selected line. Key
operations within the Symbol Extension window are the same as for the History
window.
[ Shift + F8(AllCan) ]]
Pressing these keys deletes all of the characters in the line that is currently
being edited and deletes all of the contents of the history buffer as well.
Window commands
82
2-7 Memos
The contents of memos (character strings) can be used in line input in the
Command window, etc. Frequently used function names and variable names can
be easily called up by registering them in memos.
The String Select (Sel) local command and Dialog command MEM is used to
register character strings in memos.
[☞ Chapter 6, section 2-3 for the MEM command]
The currently registered memo character strings can be displayed in the function key display by pressing the SHIFT key and the CTRL key simultaneously.
Pressing the function key corresponding to the desired character string causes
that character string to be displayed/input in the input portion of the Command
window.
[ Ctrl + Shift + F1
to
[ Ctrl + Shift + F10 ]
Pressing these keys specifies a memo character string.
The character strings (1 through 10) that were set by the MEM command can be
called up by pressing CTRL + SHIFT + function key.
CTRL + SHIFT + F1 calls up memo character string 1, CTRL + SHIFT + F2 calls
up memo character string 2, and so on, up to CTRL + SHIFT + F10, which calls
up memo character string 10.
[☞ MEM command]
Window commands
6. Window Commands
83
2-8 Other window commands
[ Shift + F10(Option) ]
Pressing these keys displays and changes the various options.
If these keys are pressed, the Option display window opens and the statuses of the
various options are displayed. The ↑ and ↓ keys can be used to select an option
item (the selected item is highlighted), and the → and ← keys can be used to
change the contents of the option. Press the ESC key or the Return key to close
this window.
[☞ OPTION command]
[ Esc ]
This key is used to forcibly break the program this is running; to stop a
macro command or batch function that is currently executing; to stop a
search; to exit the Inspect, Help, or Option menus, etc.
The ESC key can be used to interrupt or terminate the majority of Window commands.
[ Stop / Ctrl + C ]
These keys halt execution of a long display operation initiated by the D
command, etc., or interrupt the repeated step execution of a program initiated by the T or P command.
[ Ctrl + S ]
These keys are used in order to pause the Command window display.
The display resumes when any other key is pressed.
[ Ctrl + P ]
These keys direct the Command window display output to the printer as
well.
These keys are used to toggle printer output on and off.
[ Help ]
This key saves the debugging screen and displays a help screen.
When this key is pressed, the help screen for the previous Dialog command is
displayed. For example, if an input error was made in a Dialog command, pressing this key displays the help screen for that command. If this key is pressed
while using the Inspect function or String Select, the help screen for the respective
local command is displayed. Press the ESC key to exit the help screen and return
to the debugger screen.
[☞ HELP command]
Window commands
84
3
Data Reference Functions
The data reference and modification functions are frequently used in conjunction with the execution/break functions. The data reference functions include the
Inspect, Watch, and View functions are the most powerful feature of the C source
code debugger. The Inspect function in particular can be used to reference and
modify data structures simply by using the cursor to specify variables, arrays,
structs and unions in the source file displayed in the Code window.
During debugging, first use the execution/break commands to execute the executable file up to the desired position. Next, use the data reference/modification
commands to reference the states of variables at that point in order to determine
the locations of bugs or confirm that the program is running properly. Then execute the program and reference the data again. The vast majority of debugging
work consists of repeating this process. If a bug is found, the file is debugged by
repeating the process of correcting the source file, recompiling and reloading the
file, executing the file, and referencing the data. It is clear, therefore, that the
degree to which the data referencing functions are simple and easy to understand
can determine how useful a debugger is. Once the user has a solid understanding
of the data referencing functions, this C source code debugger provides an excellent debugging environment.
3-1 Inspect function
Opening/closing the Inspect
window
F6(Inspct) / Ctrl + I
[☞ page 89]
The Inspect function makes it possible to reference or change a variable,
array, struct, or union in the source file displayed in the Code window, in a
format suited to the data structure of that variable, simply by specifying the
variable, array, struct, or union with the cursor.
To do so, move the cursor to the Code window and then position the cursor on
the variable to be referenced/changed in the source file. It does not matter which
portion of the variable name on which the cursor is positioned. Next, press F6 or
CTRL + I. This opens the Inspect window, in which the data structure of the
variable in question is displayed. To close the Inspect window, either press the
ESC key, or else press the F6 or CTRL + I key. There are four types of Inspect
windows: scalar, pointer, array, and struct. The display format and the local commands that can be used differ for each type of Inspect window.
[☞ Chapter 6, section 3-3 for the local commands]
The only variables (symbols) that can be inspected are those that are currently
valid. Therefore, local variables that are currently not in use and static variables
described in a source file other than the source file currently pointed to by the
program counter cannot be inspected.
Data Reference Functions
6. Window Commands
85
■ Pointer inspection
Pointer values only hold information on address values within memory.
However, the information stored in that address is meaningful.
For example, if:
char *p=“MEC”;
is coded, the variable “p” stores not string “MEC” itself but the address information where the string “MEC” is stored.
If a variable with the pointer attribute is inspected, the content of that variable
(an address value) is displayed in hexadecimal with an asterisk (“*”). The 0th
element (the information stored in memory indicated by the variable address) of
the pointer is displayed. If the pointer has the character attribute, that element is
recognized as a character string, and the characters are displayed as the element
until the null character (¥0) is reached. If the pointer has multiple elements, such
as a struct array, those elements are enclosed in brackets (“{}”) and as much information as possible that fits on one line is displayed.
Example
/*integer pointer*/
(int)ip=*1500
[0]=10
(0xA)
/*pointer element*/
Data Reference Functions
86
(Char)p=*1550 "MEC\0"
/*character pointer*/
[0]='M'
77(0x4D) /*subsequent character elements*/
[1]='E'
69(0x45)
[2]='C'
67(0x43)
[3]='\0'
0(0x0)
■ Array inspection
An array has multiple elements, as the name indicates. There are also a number of variations, such as multidimensional arrays with two or more dimensions,
and struct arrays. These arrays can be inspected in an easy and efficient manner.
In array inspection, the array attributes are displayed in cast format, the array
elements are enclosed in brackets (“{}”), and as many elements as possible are
displayed. In the second and subsequent lines, all of the array elements are displayed in order: 0th, 1st, 2nd, ... nth. If the array has multiple elements, such as a
struct array, those elements are enclosed in brackets (“{}”) and as much information as possible that fits on one line is displayed.
For example, when inspecting the two-dimensional array int x[3][2], the display appears as shown below.
Example
(int [3][2])x={{1,2},{3,4},{5,6}} /*array inspection*/
[0]={1,2}
/*x[0] element display*/
[1]={3,4}
/*x[1] element display*/
[2]={5,6}
/*x[2] element display*/
When referencing an array with a large number of elements, it can be enlarged
with the Zoom function to fill the screen.
[☞ Chapter 6, section 3-3]
Data Reference Functions
6. Window Commands
87
■ Inspection display for a variable with an array attribute
Data Reference Functions
88
3-2 Struct and Union Inspection
Structs (including the bit field) and unions allow different types of data
structures (scalar, pointer, array, struct, union, etc.) to be combined into
one unit which can then be handled as a new data structure.
Using structs and unions makes it extremely easy to handle even complex data
structures, which makes it hard for bugs to crop up and also makes the program
easier to read.
In struct/union inspection, the attributes are displayed in cast format, the elements (members) are enclosed in brackets (“{}”), and as many elements as possible are displayed. In the second and subsequent lines, all of the element names
(member names) and their contents are displayed. If the struct array has multiple
elements, those elements are enclosed in brackets (“{}”) and as much information
as possible that fits on one line is displayed. For example, consider a struct containing members x, y, and z, representing a point in three-dimensional space.
struct point {
int x;
/*X coordinate*/
int y;
/*Y coordinate*/
int z;
/*Z coordinate*/
} p;
If the variable p is inspected, the following is displayed:
(struct point)p = {x=10,y=20,z=30}
(int)x = 10 (0xA)
/*struct inspection*/
/*subsequent struct element display*/
(int)y = 20 (0x14)
(int)z = 30 (0x1E)
The only difference in the display format between structs and unions is that
the attribute display is either “struct struct-name” or “union union-name”.
Data Reference Functions
6. Window Commands
89
Inspection display for a
variable with the struct
attribute
3-3 Local commands within the Inspect window
If the Inspect window is opened, the contents of the variables are displayed in
window; at the same time, the function key display changes, showing the local
commands that can be used in the Inspect window. These local commands can be
used to find more detailed information on the contents of data structures that have
multiple elements, such as arrays and structs. Elements can be selected in the
array and struct display with the key operations described below. The currently
selected element is highlighted.
↑, CTRL + E
↓, CTRL + X
Moves the selected element line up one line.
Moves the selected element line down one line.
ROLL DOWN, CTRL + R
ROLL UP, CTRL + C
Moves the displayed item up one item.
Moves the displayed item down one item.
ESC
Closes the Inspect window.
Data Reference Functions
90
There are seven local commands for the Inspect window.
Zoom:
Hex/decimal
conversion:
Inspect:
Watch:
Range:
Change:
Zooms the window in and out.
Changes the base of the values displayed in the
window.
Inspects the contents of the window.
Registers items for watching.
Changes the array/pointer display range.
Changes the value of an inspected variable.
F4 (Zoom)
When inspecting a pointer, array, or struct, pressing this key enlarges the
window to fill the screen.
This function is useful when referencing an array with a large number of elements. Pressing this key again while the window is in the enlarged state returns
the window to its original size.
F5 (16 < > 10)
In a scalar display, values are displayed in both hexadecimal and decimal
form.
However, when displaying an array or struct with multiple elements, values are
displayed only in decimal (default) form or hexadecimal form, in order to display
as many elements as possible on one line. The F5 key is used to switch the base
for display.
(unit [3])abc={4096, 32768, 65535}
(unit [3])abc={1000, 8000, FFFF}
/*decimal display*/
/*hexadecimal display*/
F6 (Inspct) / Ctrl + I / I
Pressing these keys displays the array or struct element that was selected
by using the cursor keys in a newly opened Inspect window.
The ESC key is used to close one Inspect window at a time.
F7 (Watch) / Ctrl + W / W
Pressing these keys registers either the variable that is being inspected or
the selected element for watching in the Watch window.
[☞ Chapter 6, section 3-4 “Watch function”]
Data Reference Functions
6. Window Commands
91
F8 (View) / Ctrl + V / V
Pressing these keys displays either the variable that is being inspected or
the selected element for viewing in the Command window.
[☞ Chapter 6, section 3-5 “View function”]
F9 (Range) / R
These keys are used to change the number of the displayed array or
pointer element, and to change the maximum number.
When one of these keys is pressed, the window that is used to input the number of
the element to be referenced opens, with the element that is currently being displayed and the maximum element number highlighted. Input the display element
number and the maximum display element number (may be omitted). During this
line input, the History and Line Edit shell functions can be used.
This command is an extremely useful function for referencing large arrays and
for referencing areas around pointers.
F10 (Change) / C
Pressing these keys changes the value of either the variable that is being
inspected or the selected element.
The only variables that can be changed with this command are those that have a
scalar attribute (char, int, etc.) or the pointer attribute.
If these keys are pressed, the window that is used for inputting the numeric
value (expression) to be changed opens. Input a C expression or a numeric value
in this window; the expression or value is then evaluated, and if no error is found,
the value of the variable is changed to that value. (In certain cases, the type of the
value is converted.) During line input, the History and Line Edit shell functions
can be used.
Data Reference Functions
92
3-4 Watch functions
Watch registration
Ctrl + F7(Watch) / Ctrl + W
The Watch function is used in order to constantly display the most recent
values for important variables, arrays and expressions in the Watch window while debugging is in progress.
The C source code debugger provides two methods for registering items to be
watched. One is registration using a Window command (registration is also possible via local commands for Inspect or String Select), and the other is registration
using the W command of the Dialog commands. Registration using a Window
command is explained in this section.
Watch registration is accomplished by moving the cursor to the Code window,
positioning it on the variable that is to be registered for watching, and then pressing CTRL + F7 or CTRL + W. Once an item is registered for watching, the
variable name and its contents (value) are displayed in the Watch window. When
the item registered for watching has multiple elements, such as a struct or an
array, each element is enclosed in brackets (“{}”) and as many items as can be
displayed on one line are displayed.
Use the Y command of the Dialog commands to cancel a watch registration.
A local variable can be registered for watching only while the program counter is pointing within the function in which the local variable was declared. The scope (specification of the range over
which the variable can be used) of the local variable registered for
watching is naturally limited to the function in which it was declared. Therefore, once the program counter points outside of that
function, the display for the variable registered for watching
changes to “????”.
Static variables also have scope, and so, in the same fashion as local
variables, once the program counter points outside of that scope,
the display for the variable registered for watching changes to
“????”.
Data Reference Functions
6. Window Commands
93
3-5 View function
Viewing
Ctrl + F8(View) / Ctrl + V
The View function is used to display in the Command window the value of
the variable or expression where the cursor is located.
View function is accomplished by moving the cursor to the Code window, positioning it on the symbol that is to be viewed, and then pressing CTRL + F8 or
CTRL + V. When a variable is viewed, the variable and its contents are displayed
on the last line of the Command window. When the item being viewed has multiple elements, such as a struct or an array, each element is enclosed in brackets
(“{}”) and as many items as can be displayed on one line are displayed.
The View function is useful for making a temporary record of the current state
of a variable and for checking its subsequent changes over time. The View function is also included in the local commands for Inspect or String Select (Sel).
Only currently valid variables can be viewed. Accordingly, it is not
possible to view local variables for a function that is not currently
being used, nor is it possible to view static variables defined in a
source file other than the one that the program counter is currently
pointing to. These restrictions are the same as the restrictions on
which variables can be inspected.
Data Reference Functions
94
Data Reference Functions
Chapter 7
Dialog Commands
1. Rules for Using Dialog Commands
2. Program Loading/Execution
3. Event-related Commands
4. Other Hardware-related Commands
5. Performance Measurement
6. Data Display/Change
7. Code Display/Change
8. Watch Display
9. System Control Commands
10. Other Commands
96
1
Rules for Using Dialog Commands
1-1 Conventions used in command explanations
The C source code debugger commands consist of the command name and
parameters. (Sometimes, parameters can be omitted. Parameters that can be
omitted are enclosed in square brackets (“[...]”). If there are two or more options
that may be chosen for a parameter, they are enclosed in rounded brackets (“{}”)
and are separated by vertical lines, as follows: {...|...}
If a parameter is omitted, the C source code debugger’s initial value may be
used, or the value used by the last command may be used.
,
[...]
{A|B}
ABCD
Parameter delimiter
May be omitted
Select either A or B
Underlining indicates keyboard input
1-2 Command input format
Dialog commands can be input when the prompt is displayed in the Command
window. However, when inputting a macro, the macro input request prompt (“?”)
is displayed; when the trace display command TD (U) has been input, the
subprompt (“*”) is displayed.
The C source code debugger command input format is as follows:
<command name>[<parameters>] ↵
“<command name>” consists of a character string of one or more characters.
“<parameter>” can be a numeric value, operational expression, symbol, line number, register name or other item that represents an address or data that the command uses. Uppercase and lowercase characters may be used as desired in the
commands and parameters. The number of parameters differs for each command.
If there are multiple parameters, they should be delimited by commas (“,”). In
addition, as a general rule, a space should be used to separate the command from
the parameters.
Rules for Using Dialog Commands
7. Dialog Commands
97
1-3 Symbols in the C source code debugger
The C source code debugger can handle two types of symbols: global symbols
(which are valid through the entire program) and local symbols (which are valid
only within a function). (Local symbols can be either local variables or static
variables.)
■ Global symbols
Global symbols are used in place of address values when inputting disassembled labels and addresses. External variables and function names are registered in the global symbols.
If a symbol has the same name as a CPU register, the register name takes
precedence. Therefore, it is not possible to reference a symbol that has the same
name as a register.
In C, symbol names generally have an underscore (“_”) before or
after the variable name or function name. However, because it is
inconvenient to input an underscore each time a global symbol is
input, the C source code debugger is designed to allow the underscore before or after a global symbol to be omitted.
It is also possible to specify whether or not to distinguish between
uppercase and lowercase characters.
[☞ OPTION command and SHIFT + F10 (Option)]
For example, assuming a global symbol with the name “_main”:
Example
>u _main
/*display disassembled label from _main symbol value*/
>u main
/*same as above*/
Rules for Using Dialog Commands
98
In addition, global symbols also function as C source code debugger internal
variables (most commonly used together with the IF command and macro commands).
Example
>i=0x10
symbol is loaded.
>while{ i!=0
?T
? i=i-1
?}
/*1st line*/
/*2nd line*/
/*3rd line*/
/*4th line*/
/*5th line*/
1. This line places the value 0x10 in symbol “i”. (If “i” is an undefined symbol
name, “i” is also registered as a symbol.)
2. This line compares the value of the symbol “i” with zero (“0”).
3. In this line, if “i” is not “0”, single-step execution is initiated by the T command.
4. This line decrements the value of “i” by one (“1”).
5. This line ends the “while” command. If this line is executed, the conditional
evaluation is made again by the “while” command.
If this command is actually executed, the T command will execute 16 times
before exiting the loop of “while” command.
In the above example, the symbol “i” is handled in the same manner as a C
variable. When using symbol names, make sure to not duplicate previously registered global symbol names and local symbol names.
Rules for Using Dialog Commands
7. Dialog Commands
99
■ Local symbols
Local symbols are symbols (names) both for variables that are valid only
within a certain function (such as an automatic variable of C or a function argument) and for variables that are statically declared. Local symbols are automatically registered when normal debugging information is loaded.
In addition to address values, local symbols include information on the scope
(valid range) and attributes (char, int, long, double, etc.) of the local symbols.
[☞ Inspect function, “?” command, and VAL command]
■ Special symbols
_ _ERR_ _
The value of the special symbol “_ _ERR_ _” is “1” when the command that was
just executed generated an error, and is “0” when the last command was executed
normally.
“_ _ERR_ _” can be used in error processing within macro commands.
_ _RUN_ _
The value of the special symbol “_ _RUN_ _” is “1” while the user program is
executing, and “0” when the program is stopped. This symbol can be used for
purposes such as waiting for a user program break in processing within a macro.
Rules for Using Dialog Commands
100
1-4 Numbers in the C source code debugger
The C source code debugger can handle binary, octal, decimal, and hexadecimal numbers. The base of a number is identified by a symbol in front of the value.
Numeric values for which the symbol indicating the base was omitted are handled
according to the base specified by the N command.
[☞ N command]
Symbol
Base
@<numeric value>
¥<numeric value>
Binary
Octal
_<numeric value>
$<numeric value>
Decimal
Hexadecimal
0x<numeric value>
numeric value
Hexadecimal
Accords with the base specification
(either hexadecimal or decimal)
For example, @11001010, ¥312, _202, $CA, and 0xCA all represent the same
numeric value.
In addition, there are also commands (DS, DL, etc.) that handle 4-and 8-byte
real numbers (in IEEE format).
■ Addresses
The address format used by the C source code debugger is shown below:
XXXXXXXX
Address (32 bits)
Example: >D 80001234
Symbol names and line numbers (explained below) can be input as command
parameters wherever an address needs to be specified.
Rules for Using Dialog Commands
7. Dialog Commands
101
■ Line numbers
The C source code debugger supports debugging at the source code
level using the line numbers in the source file.
The line numbers are used to specify specific lines within the source file. Line
numbers are valid only when the source line information is included within the
executable file that was loaded.
There are three line number input formats:
Format 1:
Format 2:
Format 3:
[<file name>:]<line number>
±<line number>
<symbol>±<line number>
Line numbers specify a specific source line in the user program as a combination of a decimal number (<line number>) and the file name or symbol name.
Format 1 indicates the absolute line number. If <file name> was input, this
format specifies the nth line (where “n” is <line number>) of the specified file. If
<file name> is omitted, this format specifies the nth line (where “n” is <line number>) of the current file (the file currently displayed in the Code window).
>v .100
>v .test:120
/*specifies the 100th line of the currently selected
source file*/
/*specifies the 120th line of test.c*/
Format 2 specifies a line in terms of its relative position to the source line
currently pointed at by the program counter.
The +<line number> specification points at the line that is <line number> lines
beyond the current source line, while the –<line number> specification points at
the line that is <line number> lines in front of the current source line.
However, if there is no corresponding source line for the program counter
when a format 2 line number specification is made, an input error results.
>v .+10
/*specifies the 10th line from the source line currently
pointed at by the program counter*/
Rules for Using Dialog Commands
102
Format 3 specifies a line in terms of its relative position to the source line
corresponding to the address value of the specified <symbol>.
The +<line number> specification points at the line that is <line number> lines
beyond the corresponding source line, while the –<line number> specification
points at the line that is <line number> lines in front of the corresponding source
line.
However, if there is no corresponding source line for the specified <symbol>
when a format 3 line number specification is made, an input error results.
>bp .main+10 /*specifies the 10th line from the symbol “main”*/
■ Character strings
The C source code debugger can handle character strings (as ASCII codes) in
place of numeric values. A character string is enclosed in single quotes (‘).
Example: ‘A’
= 0 x 41
‘AB’
= 0 x 4142
‘ABCD’ = 0 x 41424344
In the E/EB command data input mode (when the data specification in the
command line was omitted and the Return key was pressed), up to 16 characters
can be set at one time in a character string.
>E 1000
address asc oct dec hex data
00001000 .
000 0 00 ‘1234567890abcd’
00001010.................
Rules for Using Dialog Commands
7. Dialog Commands
103
■ Register names
In the C source code debugger, the contents of registers can be handled as
variables. The register names that can be used are listed below.
Register names
Flag names
D0, D1, D2, D3 (data registers)
A0, A1, A2, A3 (address registers)
CF (carry flag)
ZF (zero flag)
MDR (multiply and divide register)
PC (program counter)
NF (negative flag)
VF (overflow flag)
SP (stack pointer)
LIR
IE (interrupt enable flag)
IM0, IM1, IM2 (interrupt mask level)
(branch destination instruction register)
LAR (instruction fetch address register)
PSW (processor status word)
Example
>while{ D0!= D1 /*compare the contents of the D0 register and
the D1 register*/
? T
/*execute trace command*/
?}
/*end of macro*/
>
In the above example, the T (single-step execution command) is executed until D0 and D1 are the same. If a register and a symbol have the same name, the
register takes precedence.
Rules for Using Dialog Commands
104
1-5 Operational expressions
An operational expression has one value derived from a combination of numeric values, symbols, registers and function arguments linked together by operators. The C source code debugger uses numeric and logical operators that are
similar to those in C.
Operational expressions can be used in any command where a value needs to
be specified (data or addresses).
The monadic and binary operators that can be used in operational expressions
are listed below.
(1) Monadic operators
*
+
–
~
!
32-bit data at a specified address (pointer or long word)
Monadic plus
Monadic minus
NOT (one’s complement)
Logical NOT
(2) Binary operators
Priority Operator
(1)
Description
*
Multiplication
/
%
Division
Modulo operation (remainder)
+
Addition
–
Subtraction
(3)
>>
<<
Right shift
Left shift
(4)
<=
Compare operation
(1 if right side is greater than or equal to left side, 0 otherwise)
>=
Compare operation
(1 if right side is less than or equal to left side, 0 otherwise)
<
Compare operation
(1 if right side is greater than left side, 0 otherwise)
>
Compare operation
(1 if right side is less than left side, 0 otherwise)
==
Compare operation
!=
(1 if right side is equal to left side, 0 otherwise)
Compare operation
(2)
(5)
(1 if right side is not equal to left side, 0 otherwise)
(6)
(7)
&
^
(8)
(9)
|
&&
(10)
||
AND
XOR
OR
Logical AND
Logical OR
Rules for Using Dialog Commands
7. Dialog Commands
105
The numerals in the left-hand column indicate operational priority. If adjacent operators have the same priority, the expression is evaluated from left to
right. The priority within an expression can be changed by the use of parentheses,
however.
In addition, compare operators and logical AND and logical OR operators are
provided for conditional decision processing in macros (FOR and WHILE commands, etc.) and conditional decision processing commands (IF command, etc.)
In addition, the compare operators and logical AND and logical OR instructions
only use the lower 16 bits in processing their operations.
Example
>h -(1+2*3)
oct
37777777771
dec
-7
hex
FFFFFFF9
asc
'. . . .'
float
-6.805644e+38
(3) System function
VAL (C expression)
The contents of the parentheses are evaluated as a C expression.
Rules for Using Dialog Commands
106
1-6 Data Expressions at the C Language Level
Up to this point, we have explained expressions that simply compute global
symbols and local symbols or line number information as address values. These
expressions can be used with most of the Dialog commands. However, because
expressions within the user program being debugged are naturally coded according to C conventions, that treatment is inadequate for handling C expressions.
Therefore, the C source code debugger has been provided with Window and Dialog commands that can handle C expressions as is. Specifically, inspection-related commands, the watch registration command, the VAL command, and the
“?” command can handle C expressions with C syntax.
■ C expressions
Descriptions at the C language level and expressions coded in the manner
explained up to this point, even if they appear to be the same expression, are
evaluated differently. These differences are explained below, using the C global
variable “abc”.
Example
>d abc
/*memory display from address of variable abc*/
00001000 00 01 02 03 . . . . 0D 0E 0F . . . . . . . . . . . . . . .
>d abc+10 /*memory display from address +10 of variable abc*/
00001010 10 20 30 40 . . . . D0 E0 F0 . 0@P . . . . . . . . .
>? abc
(int ) 1 (0x1)
/*display value of variable abc
(evaluates as C expression)*/
>? abc+10
/*display value of variable abc +10
(int ) 11 (0xB) (evaluated as a C expression) */
As this example illustrates, the meaning of the description of “abc” or “abc +
10” is different as a normal expression (as in the case of the D command in the
above example) versus a C expression (as in the case of the “?” command above).
In the Inspect, Watch, VAL, and “?” commands, “abc” would be evaluated as a
C variable; in other commands, the variable “abc” would be evaluated as an address.
Rules for Using Dialog Commands
7. Dialog Commands
107
■ C variables
The variables and functions that can be used in C expressions are limited to
those that were declared in a source file compiled with the option that attaches
detailed debugging information. Registers and flags can be used as pseudo-variables. All register pseudo-variables and flag pseudo-variables are of the “unsigned int” type.
Register pseudo-variables
Flag pseudo-variables
_D0 ,,, _D3
_A0 ,,, _A3
_Z
_N
_MDR
_PC
_C
_V
_SP
_LIR
_IM
_IE
_LAR
_PSW
■ C variable scope
When writing or debugging a C program, it is necessary to be aware of the
scope (available range) of variables. For example, variables declared with
“extern” are valid in all program areas. In other words, their scope is the entire
program. On the other hand, automatic variables declared within a function are
valid only within that function. Therefore, the scope of such a variable is limited
to that function.
When a variable declared with “extern” and an automatic variable declared
within a function have the same name, within the function only the automatic
variable is valid, and the “extern” variable cannot be accessed. In addition, automatic variables of functions not currently being used cannot be viewed.
In the C source code debugger, this type of processing is performed automatically on the basis of the scope information derived from the debugging information.
Rules for Using Dialog Commands
108
■ Constants
The use of constants is exactly the same as in C syntax. (The default base is
always base ten, regardless of the setting of the N command (base change command).)
Notation
Base
number
0xnumber
Decimal constant
Hexadecimal constant
0Xnumber
0number
Hexadecimal constant
Octal constant
For example, 4096 (decimal), 0x1000 (hexadecimal), and 010000 (octal) all
represent the same value.
The C escape sequence listed below is supported for character constants.
C character
Value
Meaning
'¥a'
0x7
Bell
'¥b'
'¥f'
0x8
0xC
Backspace
Form feed
'¥n'
'¥r'
0xA
0xD
Line feed
Return
'¥t'
'¥v'
0x9
0xB
Horizontal tab
Vertical tab
'¥¥'
'¥nnn'
0x5C
nnn
¥ (Yen) symbol
Octal (8 bits)
'¥xnn'
nn
Rules for Using Dialog Commands
Hexadecimal (8 bits)
7. Dialog Commands
109
■ Operators
The same operators as those used in C are supported. However, operators
other than the “=” operator (substitution operation) cannot be used with floating
point decimals.
The priority ranking of the operators is indicated below.
Priority ranking
Operator
(1)
(2)
Function (n) Array [n] n.n n–>n n++ n– –
&n *n –n ~n !n ++n – –n sizeof n
(3)
(4)
(cast)n
n%n n/n n*n
(5)
(6)
n+n n–n
n<<n n>>n
(7)
(8)
n>n n<n n>=n n<=n
n==n n!=n
(9)
(10)
n&n
n^n
(11)
(12)
n|n
n&&n
(13)
(14)
n||n
nn?nn:nn
(15)
n=n n*=n n/=n n%=n n+=n n–=n n<<=n n>>=n n&=n
n^=n n|=n
(16)
n, n
The number indicated in the left-hand column indicates the priority ranking of
the operators listed on the right. (The smaller the number, the higher the priority
ranking.) If adjacent operators have the same priority, the expression is evaluated
from left to right. An exception is the substitution operators (priority ranking
(15)), which are evaluated from right to left. The priority within an expression
can be altered through the use of parentheses.
Rules for Using Dialog Commands
110
■ Expressions with secondary effects
Substitution operators, such as ++, – –, and =, and function calls have secondary effects that change data, such as the contents of variables, in the user program
being debugged while processing for that particular operation is performed.
While there may be occasions where a substitution operator is used to intentionally change data, the majority of the time during debugging work it is more common to want to simply reference data rather than change it. Therefore, in order to
prevent data from being accidentally changed during the evaluation of an expression in an Inspect, Watch, or “?” command, the use of operators with secondary
effects is prohibited in the C source code debugger. Operators with secondary
effects can only be used in the VAL command.
• When referencing data, use the “?” command or the Inspect command instead of the VAL command. The VAL command should
only be used when using an operator that has a secondary effect,
such as changing the value of data.
Function calls using the VAL command are even more dangerous.
It is possible that a global variable or static variable could be
changed or data in another data area could be changed by a pointer
during function processing. It is also possible that an infinite loop
could be created within such a function. If the user is unaware of
this, it might be impossible to resume execution.
Use caution when you use a function call with the VAL command.
Example
>? abc=1234
Cannot use operators with secondary effects.
>val abc=1234
/*substitutes 1234 in abc*/
(int ) 1234 (0x4D2)
>val fnc=(1, 2, 3)
/*fnc function call*/
(int ) 10 (0xA)
Rules for Using Dialog Commands
7. Dialog Commands
111
A
B
C
D
E
F
G
H
Command Index
I
J
This is an alphabetized index
of the commands.
K
L
M
N
O
P
Q
R
S
T
U
V
W
X
Y
Z
Symbol
Symbol
Rules for Using Dialog Commands
112
2
Program Loading/Execution
The commands that are used to load user programs are the L and LP Dialog
commands; the commands that are used to execute user programs are the T, P, and
G Dialog commands.
L command, LP command
These commands load the program (EX format file) that is to be debugged into
memory.
RD command
This command loads either a Motorola S format file, an Intel HEX format file
or a binary format files into memory.
WR command
This command writes the contents of memory to a file in either Motorola S
format, Intel HEX format or binary format.
T command
When a source file is displayed in the Code window, this command step executes the file one line at a time. When disassembled code is displayed in the
Code window, this command step executes the code one instruction at a time.
Step execution continues within subroutines (functions). (Single-step execution)
P command
When a source file is displayed in the Code window, this command step executes the file one line at a time. When disassembled code is displayed in the
Code window, this command step executes the code one instruction at a time.
Subroutines (functions) are also executed as one step. (Function step execution)
G command
This command executes the user program.
RESET command
This command resets the microprocessor.
Program Loading/Execution
7. Dialog Commands
113
The screen is updated to reflect the changes in status caused by the execution
of each command. The position currently pointed to by the program counter is
highlighted in yellow on the Code window. The current register contents are
displayed in the Register window. The contents of the Watch window and the
Option window are also updated to reflect any changes in status.
Program Loading/Execution
114
L/LP
Load executable file
L [<file name>]
LP [<file name>]
These commands load an executable file (an EX format file) into memory
(either emulation memory, target memory, or internal instruction RAM). A period (“.”) is displayed in the Command window while the file is being loaded; the
number symbol (“#”) is displayed while the debugging information is being processed. Press the ESC key in order to interrupt a file load operation while it is in
progress. A message asking whether to abort or continue then appears. If “continue” is selected, the loading operation continues from where it was interrupted.
L
[<file>]
1. Loads an executable file.
If the file includes debugging information (symbol information, source line
information), the debugging information is automatically loaded into the debugging information area. If the file does not include debugging information, a message is displayed and only the executable file is loaded. If the debugging information is loaded by the L command, all registered debugging information is erased
and the new debugging information is registered in its place.
2. The L command deletes all existing break event settings and watch
registrations, initializes the trace function, the time measurement function, and the profile function, and resets the user CPU (microprocessor).
If source line information is included in the file loaded by the L command, the
Code window changes to source code display.
L P [<file>]
The LP command loads only the specified executable code and data, and
resets the microprocessor.
• If the <file name> specification is omitted, the file with the same
file name that was specified for the last L or LP command is
loaded.
• Use the RD command when loading a Motorola S format file, an
Intel HEX format file or a binary format file.
• When the environment variable PANASRC is set after an executable file has been loaded, the source files in the directory specified
by the environment variable are displayed. If PANASRC is not
set, the source files in the current directory are displayed.
[☞ RD command and WR command]
Program Loading/Execution
7. Dialog Commands
RD
115
Read file into memory
RD <file name{.S|.HEX}>
RD <file name>,<address>
R D <file{.S|.HEX}>
This command loads the specified data or program in either Motorola S
format or Intel HEX format.
If the file extension is “.S”, the file is treated as a Motorola S format file; if the
file extension is “.HEX”, the file is treated as an Intel HEX format file.
R D <file>,<address>
This command loads the specified data or program at the specified address in binary format.
Specify a file extension other than “S.” or “HEX.”.
L
EX format file cannot be specified.
Example
>rd sample.s
Read SAMPLE.S
80000000 - 80000FFF
Complete
R
>
[☞ WR command and L command]
Program Loading/Execution
116
WR
Write to file
WR <file name>,<address S>,<address E>
This command writes the contents of memory from <address S> to <address E> to a file.
The file name extension can be used to select either Motorola S format, Intel
HEX format, or binary format.
Extension
File format
“.S”
Motorola S format
“.HEX”
Intel HEX format
Other than “.S” or “.HEX”
Binary format
EX format file cannot be specified.
Example
>wr sample.s,80000000,80000fff
Write SAMPLE.S at 80000000-80000FFF
>
[☞ L command and RD command]
Program Loading/Execution
7. Dialog Commands
T
117
Single-step execution of user program
T [<count>]
The T command executes one step at a time the number of steps specified
by <count> from the address currently pointed to by the program counter.
The <count> specification can be made either in decimal or hexadecimal
depending on the base. The difference between the P command and the T
command is that with the T command called functions (subroutines) are
also executed internally one step at a time.
[☞ N command]
The maximum <count> specification is 65,535. (If <count> is omitted, “1” is
assumed.)
When C source code is displayed in the Code window, one line of source code
is executed as one step; when disassembled code is displayed in the Code window, one instruction is executed as one step.
If another function is called from the current function when executing lines
of source code one at a time, single-step execution continues within that
function.
Although nothing is displayed in the Command window during single-step
execution of source code, the contents of the registers are displayed in the Command window each time a single step is executed during single-step execution of
individual instructions.
• Single-step execution is not possible when the microprocessor is
in STOP, HALT, or SLEEP mode. To perform single-step execution, it is necessary to first overwrite the microprocessor’s CPUM
register.
• The contents of trace memory are erased by single-step execution.
T
W
Program Loading/Execution
118
Example
>T
—— IM=0 S=0
D0 =0X00000000 D1 =0X00000000 D2 =0X00000000 D3 =0X00000000
PSW=0X0000
A0 =0X00000000 A1 =0X00000000 A2 =0X00000000 A3 =0X00000000
PC =0X80000000 MDR=0X00000000 LIR=0X40000000 LAR=0X00000000 SP =0X00000100
_RESET: JMP
0X80000006
>T
—— IM=0 S=0
D0 =0X00000000 D1 =0X00000000 D2 =0X00000000 D3 =0X00000000
PSW=0X0000
A0 =0X00000000 A1 =0X00000000 A2 =0X00000000 A3 =0X00000000
PC =0X80000006 MDR=0X00000000 LIR=0X80000000 LAR=0X00000000 SP =0X00000100
MOV
0X100,A0
>T
—— IM=0 S=0
D0 =0X00000000 D1 =0X00000000 D2 =0X00000000 D3 =0X00000000
PSW=0X0000
A0 =0X00000100 A1 =0X00000000 A2 =0X00000000 A3 =0X00000000
PC =0X80000009 MDR=0X00000000 LIR=0X80000006 LAR=0X00000000 SP =0X00000100
MOV
A0,SP
>T 5
—— IM=0 S=0
D0 =0X00000000 D1 =0X00000000 D2 =0X00000000 D3 =0X00000000
PSW=0X0000
A0 =0X00000100 A1 =0X00000000 A2 =0X00000000 A3 =0X00000000
PC =0X8000000B MDR=0X00000000 LIR=0X80000009 LAR=0X00000000 SP =0X00000100
MOV
0X0 _I ,A0
—— IM=0 S=0
D0 =0X00000000 D1 =0X00000000 D2 =0X00000000 D3 =0X00000000
PSW=0X0000
A0 =0X00000000 A1 =0X00000000 A2 =0X00000000 A3 =0X00000000
PC =0X8000000D MDR=0X00000000 LIR=0X8000000B LAR=0X00000000 SP =0X00000100
MOV
0X2000,D1
—— IM=0 S=0
D0 =0X00000000 D1 =0X00002000 D2 =0X00000000 D3 =0X00000000
PSW=0X0000
A0 =0X00000000 A1 =0X00000000 A2 =0X00000000 A3 =0X00000000
PC =0X80000010 MDR=0X00000000 LIR=0X8000000D LAR=0X00000000 SP =0X00000100
SUB
D0,D0
——Z IM=0 S=0
D0 =0X00000000 D1 =0X00002000 D2 =0X00000000 D3 =0X00000000
PSW=0X0001
A0 =0X00000000 A1 =0X00000000 A2 =0X00000000 A3 =0X00000000
PC =0X80000012 MDR=0X00000000 LIR=0X80000010 LAR=0X00000000 SP =0X00000100
MOV
D0,(A0)
——Z IM=0 S=0
D0 =0X00000000 D1 =0X00002000 D2 =0X00000000 D3 =0X00000000
PSW=0X0001
A0 =0X00000000 A1 =0X00000000 A2 =0X00000000 A3 =0X00000000
PC =0X80000013 MDR=0X00000000 LIR=0X80000012 LAR=0X00000000 SP =0X00000100
ADD
0X4 _TEST ,A0
>
Program Loading/Execution
7. Dialog Commands
P
119
Function step execution of user program
P [<count>]
The P command executes one step at a time the number of steps specified by <count> from the address currently pointed to by the program
counter. The <count> specification can be made either in decimal or
hexadecimal depending on the base. The difference between the P command and the T command is that with the P command called functions are
executed as one step.
[☞ N command]
The maximum <count> specification is 65,535. (If <count> is omitted, “1” is
assumed.)
When C source code is displayed in the Code window, one line of source code
is executed as one step; when disassembled code is displayed in the Code window, one instruction is executed as one step.
When executing lines of source code one at a time, function steps within
the current function are executed. (When a function is called from the
current function, that entire function is executed normally until control returns from that function.) Therefore, a function called from the current
function is executed as if it were a single instruction line. When executing
instructions one at a time, subroutine calls are executed as if they were a
single instruction.
Although nothing is displayed in the Command window during function step
execution at the source level, the contents of the registers are displayed in the
Command window each time a single step is executed during function step execution of individual instructions.
• Single-step execution is not possible when the microprocessor is
in STOP, HALT, or SLEEP mode. To perform single-step execution, it is necessary to first overwrite the microprocessor’s CPUM
register.
• The contents of trace memory are erased by single-step execution.
Program Loading/Execution
P
T
120
Example
>P
—— IM=0 S=0 D0 =0X00000000 D1 =0X00000000 D2 =0X00000000 D3 =0X00000000
PSW=0X0000
A0 =0X00000000 A1 =0X00000000 A2 =0X00000000 A3 =0X00000000
PC =0X80000000 MDR=0X00000000 LIR=0X40000000 LAR=0X00000000 SP =0X00000100
_RESET: JMP
>P
—— IM=0 S=0 D0
PSW=0X0000
PC =0X80000006
0X80000006
=0X00000000 D1 =0X00000000 D2 =0X00000000 D3 =0X00000000
A0 =0X00000000 A1 =0X00000000 A2 =0X00000000 A3 =0X00000000
MDR=0X00000000 LIR=0X80000000 LAR=0X00000000 SP =0X00000100
MOV
0X100,A0
>P
—— IM=0 S=0 D0 =0X00000000 D1 =0X00000000 D2 =0X00000000 D3 =0X00000000
PSW=0X0000
A0 =0X00000100 A1 =0X00000000 A2 =0X00000000 A3 =0X00000000
PC =0X80000009 MDR=0X00000000 LIR=0X80000006 LAR=0X00000000 SP =0X00000100
MOV
A0,SP
>P 5
—— IM=0 S=0 D0 =0X00000000 D1 =0X00000000 D2 =0X00000000 D3 =0X00000000
PSW=0X0000
A0 =0X00000100 A1 =0X00000000 A2 =0X00000000 A3 =0X00000000
PC =0X8000000B MDR=0X00000000 LIR=0X80000009 LAR=0X00000000 SP =0X00000100
MOV
0X0 _I ,A0
—— IM=0 S=0 D0 =0X00000000 D1 =0X00000000 D2 =0X00000000 D3 =0X00000000
PSW=0X0000
A0 =0X00000000 A1 =0X00000000 A2 =0X00000000 A3 =0X00000000
PC =0X8000000D MDR=0X00000000 LIR=0X8000000B LAR=0X00000000 SP =0X00000100
MOV
0X2000,D1
—— IM=0 S=0 D0 =0X00000000 D1 =0X00002000 D2 =0X00000000 D3 =0X00000000
PSW=0X0000
A0 =0X00000000 A1 =0X00000000 A2 =0X00000000 A3 =0X00000000
PC =0X80000010 MDR=0X00000000 LIR=0X8000000D LAR=0X00000000 SP =0X00000100
SUB
D0,D0
——Z IM=0 S=0 D0 =0X00000000 D1 =0X00002000 D2 =0X00000000 D3 =0X00000000
PSW=0X0001
A0 =0X00000000 A1 =0X00000000 A2 =0X00000000 A3 =0X00000000
PC =0X80000012 MDR=0X00000000 LIR=0X80000010 LAR=0X00000000 SP =0X00000100
MOV
D0,(A0)
——Z IM=0 S=0 D0 =0X00000000 D1 =0X00002000 D2 =0X00000000 D3 =0X00000000
PSW=0X0001
A0 =0X00000000 A1 =0X00000000 A2 =0X00000000 A3 =0X00000000
PC =0X80000013 MDR=0X00000000 LIR=0X80000012 LAR=0X00000000 SP =0X00000100
ADD
0X4 _TEST ,A0
>
Program Loading/Execution
7. Dialog Commands
G
121
Execute user program
G [=<address S>][,<address B>][,/W]
G@[,/W]
G
The G command is used to execute user programs. With the G command, one
temporary software break (<address B>) can be specified. Any break points
specified by the BP command are also valid. The ESC key can also be used to
interrupt (forcibly break) execution of the user program at any time.
G [=<address S>]
[,<address B>][,/W]
The G command initiates execution of the user program from the address
specified by <address S> (execution start address), and stops at the address specified by <address B>. <Address B> is a temporary software
break.
G [<address B>][,/W]
This command initiates execution of the user program from the address
specified by the current program counter value and stops at the address
specified by <address B>.
G @ [,/W]
This format is valid only when the C source code debugger was started up
in C debugging mode. When the program to be debugged is executed by
the G@ command, execution stops once control returns from the function
that is currently being executed. This command has the same function as
the CTRL + F5 (Return) Window command.
/W
Executes the program, with on-the-fly functions prohibited. In other words, once the user program has begun
executing, no other commands will be accepted until execution stops. The screen is also not updated. This option is useful when starting the next command after user
program execution stopped within a macro.
Reference: • While a program is executing, the message “Target executing” is
displayed at the division between the Command window and the
Code window.
• The C source code debugger has a built-in time measurement
function that measures the amount of time that was needed for
user program execution.
[☞ TI command]
Program Loading/Execution
P
122
User program execution is not possible when the microprocessor is
in STOP, HALT, or SLEEP mode. In this case, either execute the
RESET command or else use the E command to overwrite the
microprocessor’s CPUM register and then execute the user program.
Example
>RESET
>G CNT60
>
——Z IM=0 S=0 D0 =0X00000000 D1 =0X00000000 D2 =0X00000000 D3 =0X00000000
PSW=0X0001
A0 =0X00002000 A1 =0X00000000 A2 =0X00000000 A3 =0X00000000
PC =0X80000056 MDR=0X80000053 LIR=0X40000000 LAR=0X00000000 SP =0X000000EC
_CNT60: MOV
(0X0C _SEC ),D0
>
>G@
>
>RESET
>G =MAIN,CNT60
>
——Z IM=0 S=0 D0 =0X00000000 D1 =0X00000000 D2 =0X00000000 D3 =0X00000000
PSW=0X0001
A0 =0X00000000 A1 =0X00000000 A2 =0X00000000 A3 =0X00000000
PC =0X80000056 MDR=0X80000053 LIR=0X40000000 LAR=0X00000000 SP =0X000000F0
_CNT60: MOV
(0X0C _SEC ),D0
>
[☞ BP command, BC command, BD command, BE command, F5 (Go),
F7 (Come) key (Window command), and SM command]
Program Loading/Execution
7. Dialog Commands
INFLUENCES
RESET
123
On-the-fly
function
Reset user microprocessor
RESET
This command makes the microprocessor’s reset input active.
The program counter (PC register) is set to address 0x40000000.
The value of all of the CPU registers is undefined when a reset is executed.
However, with this debugger, the value set by the Installer is set in the stack
pointer (SP register).
[☞ “MN10300 Series PanaX Series Installation Manual,”
Hardware volume, section 5, “Installer Startup and Settings.”]
This command is used to execute a program from the start, or if the program
has hung and the debugger is not able to accept commands.
G
R
Program Loading/Execution
124
3
Event-related Commands
Event functions set triggers that initiate hardware breaks, tracing, time measurement functions, etc. The in-circuit emulator monitors the occurrence of
events without stopping execution of the user program.
There are two types of events:
(1) Execution address events
An event is generated by the address of the instruction that was executed.
Conditions including a range of addresses and a number of passes through an
address can be specified. Up to four events can be set.
(2) Data events
An event is generated by a data access. Conditions including read, write, address range, data, access width, match/no match, and number of accesses can be
specified. Up to four events can be set in the microprocessor’s internal data RAM
space and in the external memory space, respectively.
No more than a combined total of eight execution address event and data event
points can be set, however.
An event that is a condition for the break function is called a “break event,” an
event that is a condition for starting or stopping tracing is called a “trace event,”
and an event that is a condition for starting or stopping time measurement is called
a “time measurement event.” The respective commands used for setting these
events are as follows:
Break events:
Trace events:
Time measurement events:
BP command
EV command
EV command
The BC or EC command is used to delete events.
Data events can even be set for the microprocessor’s internal instruction ROM/RAM space or special register space and areas reserved for the system. However, there is still a limit of four events
on the combined total number of events that can be set in these
areas and internal data RAM.
Event-Related Commands
7. Dialog Commands
125
The table below indicates which types of events can be used with memory accesses by the microprocessor, internal DMA accesses and external DMA accesses.
Accesses marked with an “X” cannot be used to generate an event.
Microprocessor
Internal DMA
External DMA
❍
✕
✕
❍
❍
✕
❍
✕
✕
❍
❍
✕
External memory space
❍
❍
✕
System reserved space
❍
❍
✕
memory access
Execution address event
Microprocessor’s internal
Data event
data RAM space
Microprocessor’s internal
special register space
Microprocessor’s internal
instruction ROM/RAM space
The break function halts user program execution.
The different types of breaks are described below.
(1) Software breaks
These are implemented by inserting PI codes (0xff) into user programs.
Therefore, these types of breaks can only be set in a program area, and cannot be
set in a data area. When this type of break is set in an external memory space, the
address that is set must either be in memory within the emulator or in RAM in the
user target; this type of break cannot be set in ROM.
Software breaks stop execution before the instruction in the address that was
set is executed. A combined total of 32 software breaks and events can be set. (BP
command)
(2) Hardware breaks
The execution address and data accesses are monitored by the hardware, and
when the conditions are met, a break is generated externally for the microprocessor. The features of software breaks and hardware breaks are shown below.
Software break
Hardware break
Settable conditions
Emulation memory or
external RAM program area
Instruction address break
• Possible for both ROM and RAM
• Count specification
Data break
• Address, data, bit mask
• Read, write, access
• Count specification
Others
• AND break
• Sequential break
• Trace full break
Stopping position
Before instruction execution
After execution of several instructions after event conditions are met
Number that can
be set
Up to 32, including hardware Up to four execution address
breaks
breaks and four data breaks
Implementation
Inserting PI codes in the
program
Monitoring of status by external
hardware
Event-Related Commands
126
(3) AND break
This is a type of hardware break.
A break occurs when all of the specified event conditions are satisfied simultaneously. Only one set of AND break conditions can be specified. (BPA command)
(4) Sequential break
This is a type of hardware break.
A break occurs when all of the specified event conditions are satisfied in the
sequence in which they were specified. Only one set of sequential break conditions can be specified. (BPS command)
(5) Trace full break
This is a type of hardware break.
A break occurs when the trace memory is filled with data. (TM command)
In addition, a forced break can be executed, forcibly stopping user program
execution, by pressing the ESC key on the host computer.
EV command
Sets/displays events.
BP command
Sets/displays hardware breaks and software breaks.
BPA command
Sets AND break.
BPS command
Sets sequential break.
BC/EC command
Cancels events, hardware breaks, and software breaks.
BD command
Temporarily disables events, hardware breaks and software breaks.
BE command
Enables events, hardware breaks and software breaks.
Event-Related Commands
7. Dialog Commands
On-the-fly
function
NO INFLUENCES
EV
127
Set/display event
EV <address S>[˜<address E>][,<status>][,<data>[,{/B|/W|/D}] [,/N]][,/<count>]
EV/C{<list>|*}
EV
E V <address S>[,<~
E
This command sets an event.
The following table lists the options that can be specified for each event type.
Event type
Execution address event
Data event
<address S>
●
●
<address E>
❍
❍
<status>
EX
RW/R/W
<data>
❍
/B,/W,/D
❍
/N
❍
(●: Required, ❍: may be omitted, blank: may not be specified)
<address S> Specify a memory address or symbol. When specifying a
memory range, specify the start address versus the end address in
<address E>.
<address E> Specify a memory address or symbol. Specify the end address
versus the start address in <address S>.
<status>
EX:
Execution address event
RW:
Data event in read or write operation
R:
Data event in read operation
W:
Data event in write operation
Omitted: “RW” (data event in read or write operation) is assumed
if <data> is specified, and “EX” (execution address
event) is assumed if <data> is not specified.
Event-Related Commands
128
<data>
Specify the data for a data event. If omitted, the data is ignored
and only the address becomes the event target. The <data> can
be specified in binary format if the “@” symbol is added at the
start of the data. If the “@” symbol is omitted, hexadecimal
specification is assumed. In addition, as the examples show below, it is also possible to include masked bit specifications.
Specify “X” to indicate “don’t care” for a bit. The high-order
bits are also “don’t care.”
@10xx ..... The following values satisfy the condition:
@1000, @1001, @1010, and @1011.
C5xx ........ Any value from C500 to C5FF satisfies the condition.
Symbols can not be used in the <data> specification.
E V / C {<list>|*}
/B, /W, /D
Specify the data access width for a data event: 8-bit data (/B), 16bit data (/W), or 32-bit data (/D). If omitted, the access width
mode is “no specific size/don’t care.”
/N
Specifies that the event condition is met when the data accessed
in the data event did not match the value specified by <data>. If
this specification is omitted, the event condition is met when the
data does match.
/<count>
In the case of an execution address event, specify the pass count.
In the case of a data event, specify the access count. The event
occurs after the event condition is met the specified number of
times. The maximum setting is 256; if <count> is omitted, 1 is
assumed. Regardless of the setting of the N command, the base
of the count specification is decimal, unless 0x is added to the
value, which makes the base of the count specification hexadecimal.
When an event specified in the <list> occurs, program execution is not
halted; instead, all event flags are cleared, the pass count and access
count counters are initialized to “0”, and the counts are restarted.
This setting is not allowed for AND breaks, sequential breaks, and software
breaks. When an event whose number is specified in the <list> occurs, all events
are initialized.
Event-Related Commands
7. Dialog Commands
129
EV/C 1, 2, 7 ↵
In the above example, if any one of events 1, 2, or 7 occur, all events are
initialized.
Reference: The base used in <list> is assumed to be decimal regardless of the N
command specification. If “0x” is added, the base is hexadecimal.
E V
This command displays the events that have been set.
Example
>EV MAIN
>EV CNT60,/3
>EV SEC,5
>EV
NO.
SADR
E 1
80000039
E 2
80000058
E 3
0000080C
>tm 3
>ti max, /s1, /e2
>ev
E
E
E
>
NO.
1
2
3
Sadr
80000039
80000058
0000080C
EADR
Eadr
ST. DATA/SYMBOL
EX _0main
EX _cnt60
RW 05
st.
EX
EX
RW
Data/Symbol
_main
_cnt60
05
SZ CNT BRK TRC DLY TS TE CLR
-
1
3
1
SZ CNT BRK TRC DLY TS TE CLR
1
*
3
*
1
*
Reference: • “No.” is the number assigned to the event that was set. This number is
used by the BC/EC, BD, BE, BPA, BPS, TM, and TI commands for various settings.
• The “E” or “D” indicates whether that event is currently enabled (E) or
disabled (D).
• The meanings of the codes in the “st.” column are explained below:
EX: Execution address event
RW: Data event in read or write operation
RD: Data event in read operation
WR: Data event in write operation
• The "sz" column means the accessive range for data event:
B:
W:
8-bit data
16-bit data
D:
-:
32-bit data
size don't care
• * (asterisk): Indicates that the event in question was assigned to one of the
following functions:
BRK: Break [☞ BP command]
TRC: Trace with event conditions [☞ TM command]
DLY: Delayed trigger trace event [☞ TM command]
TS: Time measurement start event [☞ TI command]
TE: Time measurement end event [☞ TI command]
CLR: Event clear [☞ EV/C command]
Event-Related Commands
E
130
Set/display sofware break :
Set/display sotware break :
NO INFLUENCES
INFLUENCES
BP
On-the-fly
function
Set/display break event
BP<address S>[˜<address E>][,<status>][,<data>[,{/B|/W|/D}] [,/N]][,/<count>][,/C<command>]
BP
B P <address S>[,<~
This command sets an internal event, and that event is set in a hardware
break.
The following table lists the options that can be specified for each break type.
Break type
Execution address break
Data break
Software break
<address S>
●
●
●
<address E>
❍
❍
<status>
EX
RW/R/W
<data>
❍
/B,/W,/D
❍
/N
❍
/<count>
❍
❍
/C<command>
❍
❍
❍
( ●: required, ❍: may be omitted, blank: may not be specified)
<address S> Specify a memory address or symbol. When specifying a
memory range, specify the start address versus the end address in
<address E>.
<address E> Specify a memory address or symbol. Specify the end address
versus the start address in <address S>.
<status>
EX:
RW:
R:
W:
Omitted:
Event-Related Commands
Execution address break
Data break in read or write operation
Data break in read operation
Data break in write operation
“RW” is assumed if <data> is specified, “EX” is assumed if <data> is not specified and <address E> or
<count> is specified, and a software break is assumed
in all other cases.
7. Dialog Commands
131
B
<data>
Specify the data for a data break. If omitted, the data is ignored
and only the address becomes the break target. The <data> can
be specified in binary format if the “@” symbol is added at the
start of the data. If the “@” symbol is omitted, hexadecimal
specification is assumed. In addition, as the examples show below, it is also possible to include masked bit specifications.
Specify “X” to indicate “don’t care” for a bit. The high-order bits
are also “don’t care.”
@10xx ..... The following values satisfy the condition:
@1000, @1001, @1010, and @1011.
C5xx ........ Any value from C500 to C5FF satisfies the condition.
Symbols can not be used in the <data> specification.
/B, /W, /D
Specify the data access width for a data break: 8-bit data (/B),
16-bit data (/W), or 32-bit data (/D). If omitted, the access width
mode is “no specific size/don’t care.”
/N
Specifies that the break condition is met when the data accessed
in the data break did not match the value specified by <data>. If
this specification is omitted, the break condition is met when the
data does match.
/<count>
In the case of an execution address break, specify the pass count.
In the case of a data break, specify the access count. The break
occurs after the break condition is met the specified number of
times. The maximum setting is 256; if <count> is omitted, 1 is
assumed. Regardless of the setting of the N command, the base
of the count specification is decimal, unless 0x is added to the
value, which makes the base of the count specification hexadecimal.
/C<command> A C source code debugger command or macro of up to 40 characters can be specified for <command>. If this specification is
made, the specified <command> is automatically executed after
the break. If execution was initiated by using the F5 key, however, the <command> is not executed after the break.
Event-Related Commands
132
B P
This command displays the breaks that have been set.
Example
>bp main
>bp sec,w,5
>bp 100,rw
>bp
No.
Sadr
E 1
80000039
E 2
0000080C
E 3
00000100
>bp cnt60,ex
>bp
No.
Sadr
E 1
80000039
E 2
0000080C
E 3
00000100
E 4
80000058
>ev
No.
Sadr
E 2
0000080C
E 3
00000100
E 4
80000058
>
Eadr
st. Data/Symbol
SF _0main
WR 05
RW
Sz Cnt Command
1
- 1
- 1
Eadr
st.
SF
WR
RW
EX
Sz Cnt Command
1
- 1
- 1
1
Eadr
Reference:
Data/Symbol
_0main
05
_cnt60
st. Data/Symbol
WR 05
RW
EX _0cnt60
Sz Cnt BRK TRC DLY TS TE CLR
-1 *
-1 *
1 *
• The “No.” column indicates the number applied to the break event. This
number is used in the BC/EC, BD, and BE commands to specify the
break even to be cancelled, disabled, or enabled.
• The “E” or “D” indication indicates whether the break event is currently
enabled (E) or disabled (D).
• The meanings of the codes in the “st.” column are explained below:
SF: Software break
EX: Execution address break
RW:Data break in read or write operation
RD: Data break in read operation
WR:Data break in write operation
• The "sz" column means the accessive range for data event:
B: 8-bit data
W: 16-bit data
D: 32-bit data
-:
size don't care
[☞ BC/EC command, BD command, BE command, G command,
L command, or LP command]
Event-Related Commands
7. Dialog Commands
NO INFLUENCES
BPA
133
On-the-fly
function
Set AND break
BPA <list>
This command sets an AND break.
B P A <list>
The hardware break events specified in <list> become AND conditions.
Once all of the conditions are satisfied, a break occurs.
Specify up to eight break event numbers in <list>, delimited by commas.
If an AND break is set while a program is running, it becomes valid immediately. To cancel an AND break, execute the BD or BC/EC command on one of
the break events set as part of the AND break.
Example
Break event Nos.
2 and 3 form
an AND break.
>bp
No.
E 1
E 2
E 3
E 4
>bpa 2,3
>bp
No.
E 1
E 2 (& )
E 3 (& )
E 4
>
Sadr
80000039
00000100
00000800
80000058
Eadr
Sadr
80000039
00000100
00000800
80000058
Eadr
st.
SF
RW
RW
EX
Data/Symbol
_0main
@0xxxx100
_i
_0cnt60
Sz
st.
SF
RW
RW
EX
Data/Symbol
_0main
@0xxxx100
_i
_0cnt60
Sz
-
Cnt Command
1
1
1
1
Cnt Command
1
1
1
1
Reference: The base used in <list> is assumed to be decimal regardless of the N
command specification. If “0x” is added, the base is hexadecimal.
Event-Related Commands
B
134
NO INFLUENCES
BPS
On-the-fly
function
Set sequential break
BPS <list>
This command sets a sequential break.
B P S <list>
The hardware break events specified in <list> are set as a sequential
break.
Multiple break events can be specified in <list>, up to a maximum of eight.
A sequential break is generated if the break events occur in the specified sequence. A break event that is used in an AND break can also be used in a sequential break. To cancel a sequential break, execute the BD or BC/EC command on
one of the break events set as part of the sequential break.
If a sequential break is set while the user program is being executed
(on-the-fly) , all events are temporarily disabled and then are enabled. (There is an interval during which the events are temporarily
ignored.)
Event-Related Commands
7. Dialog Commands
135
B
Example
>bp
E
No.
1
Sadr
80000039
Eadr
st. Data/Symbol
SF _0main
Sz
Cnt Command
1
E
2
00000100
RW
@0xxxx100
-
1
E
E
3
4
00000800
80000058
RW
EX
_i
_0cnt60
-
1
1
>bps 2,3,4
Break event Nos. 2,
3, and 4 form a
sequential break.
>bp
No.
Sadr
-
Eadr
st. Data/Symbol
E
1
80000039
SF
_0main
E
E
2 ( 1) 00000100
3 ( 2) 00000800
RW
RW
@0xxxx100
_i
E
4 ( 3) 80000058
EX
_0cnt60
Sz
Cnt Command
1
-
1
1
1
>bd*
>be*
>bp
E
No.
1
Sadr
80000039
Eadr
st. Data/Symbol
SF _0main
Sz
Cnt Command
1
E
2
00000100
RW
@0xxxx100
-
1
E
E
3
4
00000800
80000058
RW
EX
_i
_0cnt60
-
1
1
>
Reference: The base used in <list> is assumed to be decimal regardless of the N
command specification. If “0x” is added, the base is hexadecimal.
Event-Related Commands
136
Hardware break:
Software break:
NO INFLUENCES
INFLUENCES
BC/EC
On-the-fly
function
Cancel break event
BC {<list>|*}
EC {<list>|*}
These commands cancel software break/hardware break events that were
set by the EV command and BP command.
The BC command can be used to cancel software breaks, and hardware
events/breaks. The EC command can only be used to cancel hardware events/
breaks. If <list> is specified, the break events with the specified numbers are
cancelled. If “*” is specified, all break events that were set are cancelled.
BC 1, 2, 7 ↵
In the above example, break events 1, 2, and 7 are cancelled.
BC * ↵
In the above example, all break events are cancelled.
If a cancelled event is used in an AND break, a sequential break, as a trace
event, or as a time measurement event, these functions are also cancelled.
Example
>BP
E
NO.
1
E
E
2
3
00000100
00000000
RW
RW
@0XXXX100
_I
1
1
E 4
>BC 1,4
80000056
EX
_CNT60
1
>BP
NO.
E
E
2
3
SADR
80000029
SADR
-
EADR
EADR
00000100
00000000
ST. DATA/SYMBOL
SF _MAIN
ST. DATA/SYMBOL
RW
RW
@0XXXX100
_I
CNT COMMAND
1
CNT COMMAND
1
1
>BC 2
>BP
NO.
E 3
SADR
00000000
EADR
ST. DATA/SYMBOL
RW _I
CNT COMMAND
1
>
Reference: The base used in <list> is assumed to be decimal regardless of the N
command specification. If “0x” is added, the base is hexadecimal.
[☞ EV command, BP command, BD command, and BE command]
Event-Related Commands
7. Dialog Commands
Hardware break: NO INFLUENCES
INFLUENCES
Software break:
BD
137
On-the-fly
function
B
Temporarily disable break event
BD {<list>|*}
E
This command temporarily disables software break/hardware break
events that were set by the EV command and BP command.
If <list> is specified, the break events with the specified numbers are disabled.
If “*” is specified, all break events that were set are disabled.
BD 1, 2, 7 ↵
In the above example, break events 1, 2, and 7 are temporarily disabled.
BD * ↵
In the above example, all break events are temporarily disabled.
If a disabled event is used in an AND break, a sequential break, as a trace
event, or as a time measurement event, these functions are also cancelled.
Even if a break event disabled by the BE command is subsequently enabled, these
break events remain cancelled.
Event-Related Commands
138
Example
>bp
E
No.
1
Sadr
80000039
Eadr
st. Data/Symbol
SF _0main
Sz
Cnt Command
1
E
2
00000100
RW
@0xxxx100
-
1
E
E
3
4
00000000
80000058
RW
EX
05
_0cnt60
-
1
1
>bd 2,3
>bp
No.
Sadr
-
Eadr
st. Data/Symbol
E
1
80000039
SF
_0main
D
D
2
3
00000100
00000000
RW
RW
@0xxxx100
05
E
4
80000058
EX
_0cnt60
Sz
Cnt Command
1
-
1
1
1
>bd *
>bp
No.
Sadr
D
D
1
2
80000039
00000100
-
Eadr
st. Data/Symbol
SF
RW
_0main
@0xxxx100
Sz
Cnt Command
-
1
1
D
3
00000000
RW
05
-
1
D
>
4
80000058
EX
_0cnt60
1
Reference: The base used in <list> is assumed to be decimal regardless of the N
command specification. If “0x” is added, the base is hexadecimal.
[☞ EV command, BP command, BC/EC command, and BE command]
Event-Related Commands
7. Dialog Commands
Hardware break:
Software break:
NO INFLUENCES
INFLUENCES
BE
139
On-the-fly
function
Enable break event
BE {<list>|*}
This command enables software break/hardware break events that were
temporarily disabled by the BD command.
If <list> is specified, the break events with the specified numbers are enabled.
If “*” is specified, all break events that were set are enabled.
BE 1, 2, 7 ↵
In the above example, break events 1, 2, and 7 are enabled.
BE * ↵
In the above example, all break events are enabled.
Event-Related Commands
B
140
Example
>bp
No.
Sadr
-
Eadr
st. Data/Symbol
D
1
80000039
SF
_0main
D
D
2
3
00000100
00000000
RW
RW
@0xxxx100
05
D
4
80000058
EX
_0cnt60
Sz
Cnt Command
1
-
1
1
1
>be 1,3
>bp
No.
Sadr
E
D
1
2
80000039
00000100
SF
RW
_0main
@0xxxx100
-
1
1
E
3
00000000
RW
05
-
1
80000058
EX
_0cnt60
D 4
>be *
-
Eadr
st. Data/Symbol
Sz
Cnt Command
1
>bp
E
No.
1
E
2
E
E
3
4
Sadr
80000039
Eadr
st. Data/Symbol
SF _0main
Sz
Cnt Command
1
00000100
RW
@0xxxx100
-
1
00000000
80000058
RW
EX
05
_0cnt60
-
1
1
>
Reference: The base used in <list> is assumed to be decimal regardless of the N
command specification. If “0x” is added, the base is hexadecimal.
[☞ EV command, BP command, BC/EC command, and BD command]
Event-Related Commands
7. Dialog Commands
4
141
B
Other Hardware-related Commands
TM Command
Sets and displays trace mode.
TG command
Starts tracing.
TS command
Stops tracing.
TD command, TDU command
Displays trace information.
TDW command
Displays trace information in a window format.
TI command
Sets and displays the timer.
TRIG command
Sets and displays the trigger.
MAP command (EX command)
Assigns memory.
Other Hardware-related Commands
142
NO INFLUENCES
TM
On-the-fly
function
Set/display trace mode
TM [<mode>][{/B|/C|/S|/T[<count>],<event number>}]
TM/F
TM
The trace function stores a record of the user program execution status in trace
memory, allowing the program execution status to be analyzed later. Execution
addresses, data addresses, data values, and information on the bus status can be
stored for up to 16K steps.
T M [<mode>][{/B|/C~
This command specifies the trace mode. The mode specification items include the bus specification, the trace storage conditions, and the trace stopping
conditions; these items can all be specified simultaneously, delimited by commas.
If a specification is omitted, the default value for that item is assumed.
Bus specification
Select one of the following:
INT
Internal RAM bus (default)
In internal RAM bus tracing, accesses to the
microprocessor’s internal RAM and special registers
and to external memory (excluding internal DMA accesses) can be traced in conjunction with the actual instruction operation timing.
EXT
Extended RAM bus
In extended RAM bus tracing, only accesses to the
microprocessor’s external memory (including internal
DMA accesses) can be traced in conjunction with the
external bus operation timing. In the MN10300 Series, because the external bus is accessed via the
microprocessor’s store buffer, operations are performed more slowly than the instruction operation
timing.
Trace storage condition Select one of the following:
ALL
Normal trace mode (default)
All cycles executed by the microprocessor are stored in
trace memory. Tracing of up to 16K steps is possible.
Other Hardware-related Commands
7. Dialog Commands
143
JMP
Branch trace mode
Only branch instructions are stored in trace memory;
compensation for the intervals between branch instructions is made by the software, making it possible to appear to trace for a longer time than normal tracing. However, after starting the trace, the trace display does not
appear until the first branch instruction appears.
<event number>
Trace mode with event condition
In tracing with an event condition, tracing is performed
only while the event condition specified by <event number> is satisfied.
Trace stop condition
Select one of the following.
/B
Trace full break mode
Tracing stops and user program execution also stops
(breaks) when trace memory becomes full.
/C
Trace continue mode (default)
Even if the trace memory becomes full, tracing continues until the user program stops. The last 16K of steps
executed before the user program stopped then remain as
the trace data.
/S
Trace full stop mode
Tracing is performed from the start (or resumption) of
user program execution until the trace memory becomes
full (16K steps). When the trace memory becomes full,
tracing stops, but the user program continues.
/T[<count>],<event number>
Delayed trigger trace mode
Once the event specified by <event number> occurs,
tracing continues for the number of cycles specified by
<count>, after which tracing stops. This mode makes it
possible to monitor the execution status of a program
before and after the occurrence of an event. <count> can
be specified over a range from 257 to 16,384. If omitted,
“257” is assumed for <count>. <event number> cannot
be omitted.
Other Hardware-related Commands
T
144
T M / F
This command sets the trace mode to default mode:
Bus selection:
Internal RAM bus
Trace storage condition: Normal trace mode
Trace stop condition:
Trace continue mode
T M
This command displays the trace mode that have been set.
If a trace event is cancelled or disabled, the emulator stops tracing
and trace mode is set to the default mode.
The table below indicates which modes can be used with memory accesses by
the microprocessor, internal DMA accesses, and external DMA accesses.
A “X” indicates that the space in question cannot be accessed through that
type of access in that mode.
Microprocessor
memory access
Microprocessor’s internal
❍
❍
✕
Microprocessor’s internal
special register space
❍
❍
✕
Microprocessor’s internal
instruction ROM/RAM space
❍
❍
✕
External memory space
❍
✕
✕
Microprocessor’s internal
data RAM space
✕
∆
✕
✕
∆
✕
✕
∆
✕
❍
❍
✕
INT mode
data RAM space
EXT mode
Internal DMA External DMA
Microprocessor’s internal
special register space
Microprocessor’s internal
instruction ROM/RAM space
External memory space
(∆: Possible only with a DMA access with an external memory space)
Other Hardware-related Commands
7. Dialog Commands
145
Example
>tm
Trigger
= OFF
Trace Full
= Continue
Trace Cycle = ALL & INT
Sample Event = NONE
>ev main~cnt60,ex
>tm 1
>ev
No.
Sadr
Eadr
st. Data/Symbol
E 1
80000039 ~ 80000058 EX _0main
>tm
Trigger
= OFF
Trace Full
= Continue
Sample Event = 1
Trace Cycle = INT
>ev sec,w,5
>tm /t1000,2
>ev
No.
Sadr
Eadr
st. Data/Symbol
E 1
80000039 ~ 80000058 EX _0main
E 2
0000080C
WR 05
>tm
Trigger
= ON
(Delay=1000/Sample Event=2)
Trace End
= Stop
Trace Cycle = ALL & INT
Sample Event = NONE
>tm /f
>tm
Trigger
= OFF
Trace Full
= Continue
Trace Cycle = ALL & INT
Sample Event = NONE
>
Sz
Cnt BRK TRC DLY TS TE CLR
1
*
Sz
Cnt BRK TRC DLY TS TE CLR
1
1
*
-
Reference: The base used in <event number> (trace with event conditions and
directory triggered trace) and <count> is assumed to be decimal
regardless of the N command specification. If “0x” is added, the
base is hexadecimal.
[☞ EV command]
Other Hardware-related Commands
T
146
INFLUENCES
TG
On-the-fly
function
Start trace
TG
If tracing was stopped due to the TS command or a “trace full” stop while
the user program was running, the TG command can be used to restart
tracing.
If tracing was stopped by a trigger being tripped in delayed trigger
trace mode, the TG command cannot be used to resume tracing.
The TG command can only be executed while the user program is
running.
Example
>tm
Trigger
= OFF
Trace Full
Trace Cycle
= Continue
= ALL & INT
>g
>ts
Trace stop
>tg
>
Other Hardware-related Commands
7. Dialog Commands
NO INFLUENCES
TS
147
On-the-fly
function
Stop trace
TS
This command stops tracing while the user program is running.
To restart tracing, use the TG command.
When TS is valid, the message “Trace stop” is output.
The TS command can only be executed while the user program is
running.
T
Other Hardware-related Commands
148
Dump :
Disassemble :
INFLUENCES
NO INFLUENCES
TD/TDU
On-the-fly
function
Display trace
TD
TDU
This command displays a hexadecimal dump (TD) or a disassembled
code dump (TDU) of the contents of trace memory every machine cycle.
If the contents of the frame to be displayed are identical to those of the previous frame, a semicolon (“:”) is displayed.
If this command is executed, the number of frames sampled is displayed and
trace display mode is initiated. In this mode, the prompt changes to “*” and the
system waits for a key to be pressed. The sub-commands that can be used are
shown on the following page.
If the TD command is executed while tracing, the message “Stop Trace? (Y/
N)” is displayed on the screen. Pressing “Y” stops tracing and displays the contents of trace memory. Pressing “N” does not stop tracing and returns control to
the command input state.
If trace display mode is exited while a program is running, the message “Go
Trace? (Y/N)” is displayed on the screen. To resume tracing, press “Y”.
In delayed trigger trace mode, this message is not displayed because tracing cannot be resumed.
If the Return key is pressed without pressing any other key, “N” is
assumed.
TD
Trace memory hexadecimal dump display
T D U
Trace memory disassembled code display
Other Hardware-related Commands
7. Dialog Commands
149
The available subcommands when the TD command is input are shown below.
B
This command displays the start of trace
memory.
-B
This command displays the end of trace
memory.
Pn
This command moves the display start frame “n”
pages, and then displays one page.
If a “-” is added in front, this command moves the
display back “n” pages. If the number of pages is
omitted, “1” is assumed. If only the Return key is
pressed, the frame moves to the next page, which is
then displayed.
P1
Nn
This command sets the display start frame at
“n”.
The first frame is frame 0, which contains the oldest
data.
D
This command changes the display mode to
hexadecimal display every machine cycle.
If “s” and “e” are specified, the data from frame address S to frame address E is displayed.
[<frame address S>]
[,<frame address E>]
L
[<frame address S>]
[,<frame address E>]
This command changes the display mode to disassembled code display.
If “s” and “e” are specified, the data from frame address S to frame address E is displayed.
C
This command erases frames indicated by “:”
from the screen.
If this command is executed again, “:” is displayed.
Q/.
This command quits the trace display mode.
• If less than 16K steps were traced, the first instruction after trace
start might not be traced.
• If a “trace full” break was used, several instructions prior to the
stopping of the user program might not be traced.
Other Hardware-related Commands
T
150
Example
>bp sec,rw,5,/d
>g
>
------IM=0 S=0 D0 =00000005 D1 =00000000 D2 =0000001C D3 =00000014
PSW=0000
A0 =00000000 A1 =80000098 A2 =FFFFF870 A3 =20000000
PC =8000005F
MDR=80000055 LIR=02A544F0 LAR=FFFFF0E0 SP =00000FF8
MDRQ=00800000
mov (80C _sec ),d0
>td
Sampled Frame Number = 16384
*d 0
Frame
ROM_A
RAM_A
Data
R/W
00000
00001
00002
*c 1000
Frame
80000015
:
:
01008 E
01009
01088 JE
*u 2000
Frame
80000017
80000017
80000013
ROM_A
Addr.
00000EE4
RAM_A
Data
R/W
00000EFC
00000EFC
00000EFC
Mnemo. Opr.
STARTUP.ASM:0058
02048 JE 80000013
STARTUP.ASM:0059
02049 E
80000014
*
Frame
Addr.
mov
mov d0,(a0)
inc4
inc4 a0
STARTUP.ASM:0060
02050
E 80000015
02051
80000015
*c
*q
>
add
add -4,d1
RAM_A
Data R/W
d0, (a0)
00000F14
a0
00000F18
Mnemo. Opr.
RAM_A
-4,d1
Other Hardware-related Commands
00000F18
00000F18
00000000 (wr)
Data R/W
7. Dialog Commands
Dump:
Disassemble:
TDW
NO INFLUENCES
INFLUENCES
151
On-the-fly
function
Display trace window
TDW
This command displays the contents of the trace memory in a window.
When this command is specified, it is possible to switch between the dump
display and the disassembled code display just as with the TD command. The F1
through F10 keys are used for this purpose. If the TDW command is executed
during tracing, the message “Stop Trace? (Y/N)” is displayed on the screen.
Pressing “Y” stops tracing and displays the contents of trace memory. Pressing
“N” does not stop tracing and returns control to the command input state.
If the trace display is exited while a program is running, the message “Go
Trace? (Y/N)” is displayed on the screen. To resume tracing, press “Y”. Note
that in delayed trigger trace mode, this message is not displayed because tracing
cannot be resumed.
F1 (Jump)
This function key jumps from the frame that is currently being displayed to
the next frame to be viewed.
F2 (Search)
This function key searches for a character string in the trace information.
To interrupt the search, press the ESC key.
F3 (Next)
In search mode, this function key searches the trace information for the
character string that was specified by the F2 key, searching in the direction of the end of the trace information (the most recent trace information).
F4 (Back)
In search mode, this function key searches the trace information for the
specified character string, searching in the direction of the beginning of the
trace information.
F5 (D/AS)
This function key switches the display between dump and disassembled
code.
F6 (First)
This function key displays the beginning of the trace memory.
F7 (Last)
This function key displays the end of the trace memory.
F10 (Compres)
This function key displays/erases the frames indicated by “:”.
ESC
This key quits this mode and returns to the debugging screen of the C
source code debugger.
Other Hardware-related Commands
T
152
• If less than 16K steps were traced, the first instruction after trace
start might not be traced.
• If a “trace full” break was used, several instructions prior to the
stopping of the user program might not be traced.
• If the microprocessor’s internal instruction RAM is overwritten
while collecting trace information, the trace disassembled code
display will be incorrect.
Sample screen
Other Hardware-related Commands
7. Dialog Commands
NO INFLUENCES
TI
153
On-the-fly
function
* Except TI RUN
Measure/display execution time
TI [<mode>][,/S<event number>][,/E<event number>]
TI <clock>
TI STOP
TI
These commands measure the user program execution time in units of the
timer clock. The maximum error is ± (timer clock). The timer clock can be
selected from among 25ns, 50ns, and 100ns. The available modes are
described below.
Continuous measurement mode
In this mode, the execution time of the user program is measured from beginning (or resumption) to end.
Partial mode
In this mode, the execution time of the user program is measured from the
occurrence of one event until the occurrence of another event. There are two
partial measurement modes:
FIRST mode
The execution time is only measured the first time between the two events.
MIN/MAX mode
The execution time is measured continuously between the two events, and
then the minimum and maximum execution times are determined.
T I [<mode>~
This command specifies the timer operation mode.
<mode> RUN: Continuous measurement mode
In this mode, the execution time of the program is measured
from beginning to end. However, the execution time of the
first instruction is not included in the measured time.
This mode cannot be set while the program is running.
Other Hardware-related Commands
T
154
FIRST: Partial one-shot mode
(
This mode measures the execution time between two events
one time.
MIN: Partial minimum/maximum mode
MAX: This mode measures the execution time continuously between two events, and then determines the minimum and
maximum execution times. If the timer clock is 25ns, a
maximum time of up to approximately 107 seconds can be
measured. The operation is the same, regardless of whether
“MAX” or “MIN” is displayed.
/S<event number>
This specifies the time measurement starting event.
/E<event number>
This specifies the time measurement ending event.
• The /S, /E<event number> specification cannot be made in continuous measurement mode.
• If an event being used by the timer is deleted (or disabled), the
measurement mode automatically switches to continuous measurement mode.
Reference: The base used in <event number> is assumed to be decimal regardless of the N command specification. If “0x” is added, the base is
hexadecimal.
T I <clock>
Clock setting
This command sets the timer clock.
<clock>
/T1:
/T2:
/T4:
/M:
25ns resolution
50ns resolution
100ns resolution
Microprocessor clock
If “/M” is specified, the measured value is the number of machine
cycles, not the actual time.
TI STOP
Timer mode cancellation
This command halts time measurement.
Other Hardware-related Commands
7. Dialog Commands
T I
155
This command displays the timer mode that is currently set and the timer
value.
If the interval between a time measurement ending event and a time
measurement starting event is four clocks or less, the execution time
will not be measured correctly.
Exapmle
>ti
Timer : Stop
>
>ev init_data,ex
>ev sec,rw
>ti max,/s1,/e2
>ev
No.
Sadr
-
Eadr
st. Data/Symbol
Sz
Cnt BRK TRC DLY TS TE CLR
E
1
80000083
EX
_init_data
1
E
2
0000000C
RW
_sec
1
*
*
>g
>ti
Timer Clock
= 1/1
Timer Start Event = 1
Timer End
Event = 2
MAX TIME = 2,025 (nS)
MIN TIME = 0 (nS)
>
---- IM=0 S=0 D0 =00000005 D1 =00000000 D2 =0000001C D3 =00000014
PSW=0000
A0 =00000000 A1 =80000098 A2 =FFFFF870 A3 =20000000
PC =8000005F
MDR=80000055 LIR=02A544F0 LAR=FFFFF0E0 SP =00000FF8
MDRQ=00800000
Timer Clock
T
= 1/1
Timer Start Event = 1
Timer End
Event = 2
MAX TIME = 2,025 (nS)
MIN TIME = 0 (nS)
>
>ti stop
>
[☞ EV command]
Other Hardware-related Commands
156
NO INFLUENCES
TRIG
On-the-fly
function
Set/display trigger
TRIG OUT <data>
TRIG RAM <address>
TRIG EVENT
TRIG
These commands set and display trigger output.
TRIG OUT
<data>
This command outputs the 8-bit port data <data>.
TRIG RAM
<address>
When the microprocessor accesses <address>, this command outputs
the contents of <address>.
TRIG EVENT
This command outputs the event occurrence status.
If a sequential break was set with the BPS command, the correspondence between an event output that is output due to a trigger and its
event number may change, so use the TRIG command to check the
correspondence of the numbers.
TRIG
This command displays the trigger output that is currently set.
Other Hardware-related Commands
7. Dialog Commands
157
Example
>trig
Trigger mode = Port Data (00/00000000)
>
>ev cnt60,ex
>ev sec,rw
>ev 80000100,ex
>trig event
>trig
Trigger mode = Event
Trig. No. #7 #6 #5 #4 #3 #2 #1 #0
Event No. — — — — — — — 3 2 1
>
>trig ram sec
>trig
Trigger mode = RAM Monitor
Address
>
= 0000000C (Data is invalid.)
T
Other Hardware-related Commands
158
Display:
Set:
NO INFLUENCES
CANNOT BE USED
MAP/EX
On-the-fly
function
Assign memory
MAPI <address S>,<address E>[,{/F|/S}]
MAPE <address S>,<address E>
MAP
EXI <address S>,<address E>[,{/F|/S}]
EXE <address S>,<address E>
EX
These commands specify which memory space will be assigned to in
memory within the in-circuit emulator (emulation memory).
The total memory (emulation RAM) assigned to the in-circuit emulator must
be less than the installed memory (512KB of standard/fast emulation RAM and
512KB of slow emulation RAM). The start and end of each block can be set in
4KB units. If an attempt is made to set a block in other than a 4KB unit, the
debugger will make adjustments automatically.
The MAP command and the EX command have the same function.
MAPI/ E XI
<address S>,<address E>
[,{/F|/S}]
This command assigns the memory within the specified range so that
when it is accessed, the memory inside the in-circuit emulator (emulation
memory) is used instead. A maximum of 8 blocks in 4KB units can be
specified.
“/F” assigns the memory to fast emulation RAM, and “/S” assigns the memory
to slow emulation RAM. If omitted, “/F” (fast emulation RAM) is assumed.
MAPI 80000000, 80000FFF, /F
In the above example, the 4KB space from address 0x80000000 to
0x80000FFF is assigned to fast emulation RAM inside the in-circuit emulator.
Depending on the assigned addresses, it may only be possible to set
a size that is smaller than the total size of the memory installed in
the in-circuit emulator.
[☞ Memory emulation function]
Other Hardware-related Commands
7. Dialog Commands
MAPE/EXE
<address S>,
<address E>
159
This command assigns the memory within the specified range so that
when it is accessed, user target system resources are used instead.
When the MAPE (EXE) command is used on the user target system side to
assign a space to be used as a stack, RAM must be installed in the user target
system for that space.
E
MAPE 80000000, BFFFFFFF
In the above example, the 1GB space from address 0x80000000 to
0xBFFFFFFF is assigned to a user target system resource (external memory).
MAP/EX
This command displays the current settings.
Reference: The meanings of the codes in the “Memory” column are explained
below:
Int RAM:
Internal RAM
Int REG:
Special register
Int ROM:
Internal ROM (or internal instruction RAM)
ICE ROM:
Emulation ROM
ICE RAM (fast): Fast emulation RAM
ICE RAM (slow): Slow emulation RAM
TARGET:
Example
User target system memory (external memory)
ERROR:
Access prohibited
MONITOR:
Area used by monitor (reserved for system)
>mape 80020000 - 8003ffff
CPU MEMORY MODE : EXMODE
Sadr
Eadr
Memory
00000000 - 00003FFF :Int RAM
00004000 - 1FFFFFFF :--20000000 - 3FFFFFFF :Int REG
40000000 - 40003FFF :Int ROM
40004000 - 7FFFFFFF :--80000000 - 8001FFFF :ICE RAM (fast)
80020000 - BFFFFFFF :TARGET
C0000000 - FFFFFFFF :MONITOR
>mapi 90000000~9001ffff
CPU MEMORY MODE : EXMODE
Sadr
Eadr
Memory
00000000 - 00003FFF :Int RAM
00004000 - 1FFFFFFF :--20000000 - 3FFFFFFF :Int REG
40000000 - 40003FFF :Int ROM
40004000 - 7FFFFFFF :--80000000 - 8001FFFF :ICE RAM (fast)
90000000 - BFFFFFFF :TARGET
C0000000 - FFFFFFFF :MONITOR
>
Other Hardware-related Commands
M
160
5
Performance Measurement
SM command
This command sets/releases the RAM monitor sample area.
PROF command
This command tabulates the access status.
Performance Measurement
7. Dialog Commands
NO INFLUENCES
SM
161
On-the-fly
function
Set/release sample area
SM <address>
SMB <address>
SMC <number>
SMW
SM
The commands select the RAM monitor function sample area.
The sample area consists of 32 blocks consisting of 64 bits (8 bytes each, for a
total of 256 bytes), starting from <address>.
CTRL + 5 can be used to switch between the RAM monitor screen and the C
source code debugger screen. To change the sample area while the RAM monitor
is displayed, press the SHIFT + arrow keys. (The sample area can be changed
only while the user program is running.)
Press CTRL + 5 again to return to the debugger screen.
While the user program is running, the memory data area (particularly the
RAM area) is sampled at a constant interval, allowing the user to see changes to
the data. (This is the RAM monitor function.) This function naturally does not
affect the execution of the user program. Only data accessed in memory is monitored and displayed.
The RAM monitor can display changes in data either in hexadecimal or in bit
units.
An underscore (_) indicates an address that has not been accessed.
S M <address>
This command specifies the starting address of the sample area.
S M B <address>
This command specifies an address to be displayed in bit units.
S M C <number>
This command clears an address displayed in bit units.
S M W
This command displays the RAM monitor screen.
S M
This command displays the current sample area.
Performance Measurement
S
162
RAM monitor screen
Hexadecimal display example
RAM monitor screen
Bit unit display example
The following sub-commands can be used when being displayed RAM
monitor.
F1 (Slow)
prolongs sampling cycle
F2 (Fast)
shortens sampling cycle
F3 (Bit)
displays in bits
F4 (Hex)
displays in hex
F5 (Rev)
displays in reverse order
Performance Measurement
7. Dialog Commands
163
>sm
RAM MONITOR MODE
Monitor Area = 00000000 - 000000FF
>sm 0x800
>smb sec
>smb 0x8f0
>sm
RAM MONITOR MODE
Monitor Area = 00000800 - 000008FF
NO Address
0 0000080C
1 000008F0
>smc 1
>sm
RAM MONITOR MODE
Monitor Area = 00000800 - 000008FF
NO Address
0 0000080C
>sm 1000
>sm
RAM MONITOR MODE
Monitor Area = 00001000 - 000010FF
>
S
Performance Measurement
164
NO INFLUENCES
PROF
On-the-fly
function
Tabulate access status
PROF [ON|OFF|CLR]
PROF
These commands tabulate which functions (subroutines) are accessed
what percentage of the time while the user program is running.
PROF ON
This command specifies the start of tabulation for the profile.
PROF OFF
This command stops tabulation for the profile.
This is the state in effect when the C source code debugger is started up.
PROF CLR
This command clears the profile information.
PROF
This command displays, based on the tabulated profile information, the
time that each function (subroutine) was executing and the percentage of
the total time that each function accounted for. The functions are displayed in order of time consumed, starting from the function that consumed the most time.
Because PROF ON/OFF can be specified whenever desired, it is possible to
create profile information concerning only a particular portion of a program.
• In order to use the profile function, it is necessary for the debugging information to be loaded beforehand.
• If an overlay load is made to the microprocessor’s internal instruction RAM during profile tabulation, the profile information will
not be tabulated correctly.
Performance Measurement
7. Dialog Commands
Example
Total number of
samples
Number of
samples within
user program
(number used by
the debugging
program)
>reset
>prof on
>g
>
—— IM=0 S=0 D0 =0001B072 D1 =00000000 D2 =00000000 D3 =00000000
PSW=0000
A0 =00000000 A1 =00000000 A2 =00000000 A3 =00000000
PC=8000007D MDR=8000007A LIR=40000000 LAR=00000000 SP =00001FE0
_0cnt60:
mov (200C _sec ), d0
>
>prof
**** Profile ****
Total sampling count =
36784
User sampling count =
36784
100.%
System sampling count=
0
0.0%
No.
1.
2.
3.
Number of samples
within in-circuit
emulator (time
used by the system)
165
Addr
8000007D
8000004B
80000073
Name
_0cnt60
_0main
_0display
Percent (Sum)
44.9% (44.9%)
31.0% (75.9%)
24.0% (100.%)
Samples
16541
11407
8836
>
>prof clr
>prof
Sampling was not performed.
>prof off
>
P
Performance Measurement
166
6
Data Display/Change
The C source code debugger can easily display and change memory, register,
and symbol data.
D command
This command displays a dump of the contents of memory. The display can
be modified by changing the display base number, etc.
E command
This command changes a value stored in memory to the specified value.
C command
This command compares the specified areas in memory.
F command
This command fills the specified area in memory with one repeated value.
M command
This command performs a block transfer of the specified area in memory.
S command
This command searches for data within the specified area memory.
R command
This command displays/changes the contents of registers.
H command
This command indicates the value of an expression in octal, decimal, hexadecimal and ASCII.
PRINTF/PF command
This command displays data in the specified format. (The format is similar to
that of the “printf” function in C.)
X command
This command displays symbols.
. command
This command registers/changes symbols.
Data Display/Change
7. Dialog Commands
INFLUENCES
D
167
On-the-fly
function
Display dump of contents of memory
D
D [<address S>][,<address E>][,<count>][,{/H|/D|/O}]
DB [<address S>][,<address E>][,<count>][,{/H|/D|/O}]
DW [<address S>][,<address E>][,<count>][,{/H|/D|/O}]
DD [<address S>][,<address E>][,<count>][,{/H|/D|/O}]
DS [<address S>][,<address E>]
DL [<address S>][,<address E>]
DA [<address S>][,<address E>][,<count>]
These commands display the contents of memory in the specified base
(octal, decimal, hexadecimal, or ASCII).
When the C source code debugger is started up, the display base for the D
command is hexadecimal. After the D command has been executed, input either
the ↓ key or CTRL + X to display the next line of the D command display.
<count> specifies the number of data items to be displayed on one line; the
maximum is 29 (0 x 1D).
Option
Use
When omitted
<address S>
<address E>
Display start address
Display end address
Starts display from the next address that follows the last displayed address.
Displays one line.
<count>
Number of data items
displayed on one line
Displays either 16, 8, or 4 (however many can fit on one line).
/H
Hexadecimal display
specification
Uses the base in effect for the last display.
/D
/O
Decimal display specification Uses the base in effect for the last display.
Octal display specification
Uses the base in effect for the last display.
Data Display/Change
168
D/DB
Byte (8 bits) display
DW
Word (16 bits) display
DD
Double word (32 bits) display
DS
4-byte real number (short floating-point) display
DL
8-byte real number (long floating-point) display
DA
ASCII display
Example
>d 100
00000100
86 74 CD 70 E8 95 98 BA
B1 B6 EB D2 7F 2A 99 4E
>d main
80000029
F8 FE F8 DD 16 00 00 00
00 08 DD 19 00 00 00 00
>dw main
80000029 FEF8 DDF8 0016 0000
>dd main,/o
80000029
0800 19DD 0000 0000
33576177370 00000000026
03167204000 00000000000
Data Display/Change
7. Dialog Commands
INFLUENCES
E
169
On-the-fly
function
Change specified memory contents
D
E [<address S>][,<data>]
EB [<address S>][,<data>]
EW [<address S>][,<data>]
ED [<address S>][,<data>]
ES [<address S>][,<data>]
E
These commands change the contents of memory at the specified addresses in units of 8 bits, 16 bits, or 32 bits.
When changing the data with a real number, the contents of memory at the
specified addresses are replaced with a 4-byte real number.
Option
Use
When omitted
<address>
Start address for change
Starts from the next address that follows the address used for the last E
command.
<data>
Data values to be written
(up to 16 values)
Enters data input mode, displays the specified address and the current
memory contents in ASCII, octal, decimal, or hexadecimal, and waits for
the new data to be input.
E /EB
Byte (8 bits) change
EW
Word (16 bits) change
ED
Double word (32 bits) change
ES
4-byte real number (short float) change
Data Display/Change
170
Reference: Data input mode rules
(1) After the contents of memory at the specified address are displayed, the function enters data input mode. Up to 16 data values, delimited by commas, can then be input. With the E command it is also possible to input a character string of up to 16
characters enclosed by single quotation marks (’).
(2) To proceed to the next address without making any changes,
simply press the Return key. The next address and the contents
of that address are then displayed, and the function enters data
input mode.
(3) To return to the previous address, input a minus sign (“–”).
The previous address and the contents of that addrss are then
displayed, and the function enters data input mode.
(4) In data input mode, the address can be changed to a specified
address by inputting “org<address> ↵”, or simply “/<address> ↵”.
(5) Input “.↵” to terminate the E command.
Example
>e sec
address
0000000C
0000000D
0000000E
0000000F
0000000E
0000000D
00000100
00000101
00000102
asc
‘£’
‘.’
‘!’
‘I’
‘.’
‘.’
‘.’
‘t’
‘Õ’
oct dec hex
243 -93 A3
373
-5 FB
041
33 21
111
73 49
005
5 05
000
0 00
206 -122 86
164 116 74
315 -51 CD
data
0
0
5
/100
0
0
.
>
A verify error will occur if a value is changed in data RAM with
unmounted bits (such as a special register area), write-only data
RAM, or read-only data ROM.
Data Display/Change
7. Dialog Commands
INFLUENCES
C
171
On-the-fly
function
Compare specified memory contents
C <address S>,<address E>,<address D>
E
This command compares the contents of memory from <address S> to
<address E> with the contents of memory starting from <address D>; if a
difference is found, the addresses and data are displayed in the Command window.
If the differences do not fit in the window, a message asking whether or not
to continue the comparison appears. To stop, press CTRL + C; to continue, press any other key.
Example
>d 0,2f
00000000
DC 06 00 00 00 FF 24 00
01 F2 F0 D7 00 2D 00 20
00000010
F1 00 60 20 04 29 FC 08
FB F8 FE FC FC FF 0D 00
00000020
00 00 F8 FE 04 CA F4 CB
CB F8 FE F8 DD 16 00 00
>d 80000000,8000002f
80000000
DC 06 00 00 00 CB 24 00
01 F2 F0 90 00 2D 00 20
80000010
F1 00 60 20 04 29 FC C1
FB F8 FE FC FC FF 0D 00
80000020
00 00 F8 FE 04 CA F4 CB
CB F8 FE F8 DD 16 00 00
>
>c 0,2f,80000000
Start to compare.
00000005
FF
CB
80000005
0000000B
D7
90
8000000B
00000017
08
C1
80000017
C
End to compare.
>
Data Display/Change
172
INFLUENCES
F
On-the-fly
function
Fill specified range of memory with data value
F <address S>,<address E>,<data>
FB <address S>,<address E>,<data>
FW <address S>,<address E>,<data>
FD <address S>,<address E>,<data>
These commands fill memory from <address S> to <address E> with the
value <data>.
When the length of <data> is shorter than the address range, <data> will be
repeated until the specified range of memory is filled. From 1 to 16 data items can
be specified for <data>.
F / FB
Byte (8 bits) fill
FW
Word (16 bits) fill
FD
Double word (32 bits) fill
The fill function cannot be used in the special register areas.
Data Display/Change
7. Dialog Commands
173
Example
>d 80000000,8000003f
80000000 DC 06 00 00 00 CB 24 00
01 F2 F0 90 00 2D 00 20
80000010
80000020
F1 00 60 20 04 29 FC C1
00 00 F8 FE 04 CA F4 CB
FB F8 FE FC FC FF 0D 00
CB F8 FE F8 DD 16 00 00
80000030 00 00 08 DD 19 00 00 00
>f 80000000,8000002f,55
00 08 DC F9 FF FF FF DF
>d 80000000,8000003f
80000000 55 55 55 55 55 55 55 55
55 55 55 55 55 55 55 55
80000010
80000020
55 55 55 55 55 55 55 55
55 55 55 55 55 55 55 55
55 55 55 55 55 55 55 55
55 55 55 55 55 55 55 55
80000030
>
00 00 08 DD 19 00 00 00
00 08 DC F9 FF FF FF DF
F
Data Display/Change
174
INFLUENCES
M
On-the-fly
function
Block transfer of specified range of memory
M <address S>,<address E>,<address D>
This command performs a memory block transfer of the contents of
memory from <address S> to <address E> to a position in memory starting
at <address D>.
Example
>d 0,2f
00000000
FF FF FF FF FF FF FF FF
FF FF FF FF FF FF FF FF
00000010
00000020
FF FF FF FF FF FF FF FF
FF FF FF FF FF FF FF FF
FF FF FF FF FF FF FF FF
FF FF FF FF FF FF FF FF
>d 80000000,8000002f
80000000 DC 06 00 00 00 CB 24 00
01 F2 F0 90 00 2D 00 20
80000010
80000020
F1 00 60 20 04 29 FC C1
00 00 F8 FE 04 CA F4 CB
FB F8 FE FC FC FF 0D 00
CB F8 FE F8 DD 16 00 00
>m 80000000,8000002f,0
>d 0,2f
00000000 DC 06 00 00 00 CB 24 00
01 F2 F0 90 00 2D 00 20
00000010
00000020
FB F8 FE FC FC FF 0D 00
CB F8 FE F8 DD 16 00 00
F1 00 60 20 04 29 FC C1
00 00 F8 FE 04 CA F4 CB
>
A block transfer cannot be made to special regiter areas.
Data Display/Change
7. Dialog Commands
INFLUENCES
S
175
On-the-fly
function
Memory pattern search
S <address S>,<address E>,<search pattern>
SB <address S>,<address E>,<search pattern>
SW <address S>,<address E>,<search pattern>
SD <address S>,<address E>,<search pattern>
These commands display the addresses in memory, from <address S> to
<address E>, where the data matches <search pattern>.
Option
Use
<address S>
Search starting address
<address E>
<search pattern>
Search ending address
Up to 16 items of data can be specified; up to 16 characters enclosed in single quotation marks (’)
M
can be specified for <search pattern> in the S and SB commands.
S / SB
Byte (8 bits) search
SW
Word (16 bits) search
SD
Double word (32 bits) search
S
Data Display/Change
176
Example
>d 80000000,8000002f
80000000 DC 06 00 00 00 FF 24 00
01 F2 F0 90 00 2D 00 20
80000010
80000020
FB F8 FE FC FC FF 0D 00
CB F8 FE F8 DD 16 00 00
F1 00 60 20 04 29 FC C1
00 00 F8 FE 04 CA F4 CB
>s 80000000,8000002f,ff
80000005
8000001D
>
Data Display/Change
7. Dialog Commands
R
177
Display/change register value
R
R {<register name>|<flag name>}
<register name>+REG=<value>
<flag name>+FLG=<value>
These commands display and change the contents of registers.
The register and flag names that can be used with the R command are listed
below:
<register name>
A0, A1, A2, A3, D0, D1, D2, D3, MDR, LIR, LAR, SP,
PC, PSW
<flag name>
C
Z
N
V
IE
IM
(carry flag)
(zero flag)
(negative flag)
(overflow flag)
(interrupt enable flag)
(interrupt mask level)
R
This command displays the contents of all registers and flags in hexadecimal.
R {<register name>~
This command displays the contents of <register name>/<flag name> and
then waits for input.
If a value is input at this point, the value in the register is replaced with the new
value. Pressing just the Return key returns control to the C source code debugger
without changing the value in the register.
R
S
<register name>+REG=<value> These commands change the value of the specified register/flag.
<flag name>+FLG=<value>
To change the status of a flag, code “flag name + FLG”. (For example, to
change the C flag, use “CFLG”.)
Reference: If the Register window is left open (F2 or CTRL + 4), the most
recent register contents can always be seen.
Data Display/Change
178
Example
>r
--- IM=0 S=0 D0 =00000000 D1 =00000000 D2 =00000000 D3 =00000000
PSW=0000
A0 =00000000 A1 =00000000 A2 =00000000 A3 =00000000
PC =40000000 MDR=00000000 LIR=00000000 LAR=00000000 SP =00000100
jmp
0x80000000
>d0reg=12345678
>r
--- IM=0 S=0 D0 =12345678 D1 =00000000 D2 =00000000 D3 =00000000
PSW=0000
A0 =00000000 A1 =00000000 A2 =00000000 A3 =00000000
PC =40000000 MDR=00000000 LIR=00000000 LAR=00000000 SP =00000100
jmp
0x80000000
>cflg=1
>r
—C— IM=0 S=0 D0 =12345678 D1 =00000000 D2 =00000000 D3 =00000000
PSW=0004
A0 =00000000 A1 =00000000 A2 =00000000 A3 =00000000
PC =40000000 MDR=00000000 LIR=00000000 LAR=00000000 SP =00000100
jmp
0x80000000
>_d2=abcdef
>r
—C— IM=0 S=0 D0 =12345678 D1 =00000000 D2 =00ABCDEF D3 =00000000
PSW=0004
A0 =00000000 A1 =00000000 A2 =00000000 A3 =00000000
PC =40000000 MDR=00000000 LIR=00000000 LAR=00000000 SP =00000100
jmp
80000000
>
Data Display/Change
7. Dialog Commands
NO INFLUENCES
H
179
On-the-fly
function
Display expression operation results
H <expression>
H <expression 1>,<expression 2>
These commands display the expression operations.
H
H <expression>
This command displays the specified expression in octal, decimal, hexadecimal, and ASCII.
H
This command displays the results of addition and subtraction of the values of the two expressions <expression 1> and <expression 2>.
In addition, this command also displays the 8-byte real number (long float)
value of the two expressions when combined into 64 bits (with <expression 1> as
the upper 32 bits and <expression 2> as the lower 32 bits).
<expression 1>,
<expression 2>
The H command handles all expressions as 32-bit values. For example, when the decimal number “–1” is displayed as a hexadecimal number, it is displayed not as “0xffff” but as “0xffffffff”.
Example
>h 1234>>8
oct
00000000022
>h 1a+b
oct
00000000045
>h 20*5
oct
00000000240
>
dec
18
hex
00000012
asc
'....'
dec
37
hex
00000025
asc
'...%'
dec
160
hex
000000A0
asc
'...†'
Data Display/Change
R
180
NO INFLUENCES
PRINTF/PF
On-the-fly
function
Display format
PRINTF <format>[,<parameter>]
PF <format>[,<parameter>]
This command displays data in a format similar to that of the “printf” function in C.
The PRINTF command and the PF command perform the same function.
<parameter>
Up to 10 data items with a 16-bit data width can be specified.
Two parameters are required for the long (32-bit) format specification.
Minus sign (“–”)
This sign is used to left-justify the converted parameter in its field.
Value (decimal indicating the field width)
The converted value or character string is displayed in a field specified by the
numeric value. If a numeric value or character string field is shorter than the field
width specified by the value, the left end of the field (or the right end if the leftjustification specification was made with the minus sign) is filled out with blanks.
Conversion characters
&d Converts the parameter to a decimal number.
&u Converts the parameter to an unsigned decimal number.
&x Converts the parameter to a hexadecimal number.
&o Converts the parameter to an octal number.
&c Handles the parameter as a character.
&s Handles the parameter as a character string.
Data Display/Change
7. Dialog Commands
181
Reference: • The symbol “&” is used as the equivalent of the conversion start
character “%” in the “printf” function in C.
• The field format can be specified between “&” and the conversion
character (“d”, “c”, “s”, etc.).
• Just as in C, the “/” symbol is used as an escape character.
Example
>?sec
(int [2]) @0000200C {7, 3}
>pf ‘&x’,sec
200C
>pf ‘&x’,*sec
7
>pf ‘&x’,*sec|10
17
>pf ‘&x’,*sec&4
4
>pf ‘&x’,*sec&8
0
>r
—CN- IM=0 S=0 D0 =00000007 D1 =00000000 D2 =00ABCDEF D3 =00000000
P
PSW=0006
A0 =00002000 A1 =00000000 A2 =00000000 A3 =00000000
PC=0x80000094 MDR=8000007A LIR=40000000 LAR=00000000 SP =00001FE0
jmp
800000C3
>pf ‘&x’,mdrreg
8000007A
>
Data Display/Change
182
NO INFLUENCES
X
On-the-fly
function
Display currently registered symbols
X
X <symbol name>
This command displays the names and contents of the currently registered
global symbols.
X
This command displays all symbols.
X <symbol name>
This command displays the symbols specified by <symbol name>.
The wildcard characters “*” and “?” (which function in the same manner as
the MS-DOS wildcard characters) can be used in the <symbol name> specification.
* Matches all patterns
? Matches all individual characters
Unlike normal symbol description, the underscore character (“_”)
that the C compiler adds to the front of all symbol names cannot be
omitted in the <symbol name> specification.
Data Display/Change
7. Dialog Commands
183
Example
>x
00000000 _i
00000004 _test
0000000C _sec
80000000 _Reset
80000029 _main
8000002C _0main
80000042 _initialize
80000042 _0initialize
8000004C _display
8000004C _0display
80000056 _0cnt60
80000056 _cnt60
8000009F _init_data
8000009F _0init_data
>
>tmp1=80001234
Registered symbol name.
>x
00000000 _i
00000004 _test
0000000C _sec
80000000 _Reset
80000029 _main
8000002C _0main
80000042 _initialize
80000042 _0initialize
8000004C _display
8000004C _0display
80000056 _0cnt60
80000056 _cnt60
8000009F _init_data
8000009F _0init_data
80001234 tmp1
>
>tmp1=*
>x
00000000 _i
00000004 _test
0000000C _sec
80000000 _Reset
80000029 _main
8000002C _0main
80000042 _initialize
80000042 _0initialize
8000004C _display
8000004C _0display
80000056 _0cnt60
80000056 _cnt60
8000009F _init_data
8000009F _0init_data
>__debinf__=*
>x
No debugging information found.
>d 100
00000100 86 74 CD 76 E8 95 98 BA
>j=*100
Registered symbol name.
>x
76CD7486 j
>
B1 B6 EB D2 7F 2A 99 4E
X
Data Display/Change
184
NO INFLUENCES
.
On-the-fly
function
Register/change/delete symbol
[.] <symbol name>=<address>
<symbol name> ↵ <address>
[.] <symbol name>= *
These commands are used to register, change, or delete symbols.
The period [“. ”] at the start of the line may be omitted.
[.] <symbol name>
=<address>
This command sets (registers) the immediate <address> for <symbol
name>.
. <symbol name> ↵
<address>
This command inputs the symbol name and then its setting value.
If “.<symbol name>” is input in the C source code debugger’s command
mode, the mode changes to one-line keyboard input mode, even from within a
macro command, and then the program waits for the setting value to be input.
This input method is useful when setting data within a macro. In the case of this
specification, the period [“.”] may not be omitted.
[.]<symbol name>=*
This command deletes the specified symbol from the symbol table.
The C source code debugger has a special reserved symbol “_ _DEBINF_ _”.
If the following line is input:
_ _DEBINF_ _=* ↵
all registered symbols will be deleted. In this case, the source line information
is also deleted.
Symbols are used as variables in macro commands. An example is shown
below.
Example
i=0
do {
T
; Single-step execution command
i=i+1
} while i<3
In this example, the symbol “i” is used as a loop variable in the DO{..}WHILE
command. This sample macro code causes three steps to be executed.
Data Display/Change
7. Dialog Commands
185
When registering a symbol with the same name as a CPU register
name [☞ R command], the period (“.”) cannot be omitted. If the
period is omitted, the command will be interpreted as a “change
register” command.
Example
>x
00000000 _i
00000004 _test
0000000C _sec
80000000 _Reset
80000029 _main
8000002C _0main
80000042 _initialize
80000042 _0initialize
8000004C _display
8000004C _0display
80000056 _0cnt60
80000056 _cnt60
8000009F _init_data
8000009F _0init_data
>tmp1=80001234
Registered symbol name.
>tmp1=80000020
Registered symbol name.
>x
00000000 _i
00000004 _test
0000000C _sec
80000000 _Reset
80000020 tmp1
80000029 _main
8000002C _0main
80000042 _initialize
80000042 _0initialize
8000004C _display
8000004C _0display
80000056 _0cnt60
80000056 _cnt60
8000009F _init_data
8000009F _0init_data
80001234 tmp2
>__debinf__=*
>x
No debugging information found.
>
>d 100
00000100 86 74 CD 76 E8 95 98 BA
>j=*100
Registered symbol name.
>x
76CD7486 j
>k=*100&ffff
Registered symbol name.
>x
00007486 k
76CD7486 j
>
B1 B6 EB D2 7F 2A 99 4E
[☞ R command and X command]
Data Display/Change
Symbol
186
7
Code Display/Change
The C source code debugger displays the source code or the results of disassembly in the Code window. Changes in the displayed contents can easily be
referenced by using Window commands to switch between the source code and
the disassembled code. The V and U Dialog commands can also be used to execute similar processing.
[☞ Chapter 6, “Window Commands”]
V command
This command displays the source code in the Code window.
U command
This command displays the disassembled results in the Code window.
A command
This command performs line assembly.
K command
This command back traces the C stack frame.
Code Display/Change
7. Dialog Commands
NO INFLUENCES
V
187
On-the-fly
function
Display source lines from specified position in Code window
V [.][<file name>:][<line>]
V <symbol>
These commands display the specified source lines in the Code window.
V [.][<file name>:][<line>]
This command displays the contents of the file specified by <file name>,
starting from the specified line.
If the <line> specification is omitted, the first line of the file is assumed. If
<file name> is omitted, the source file currently displayed in the Code window is
assumed. The V command also permits the specification of a file without source
information. In other words, it is possible to load any ASCII file into the Code
window, in a similar manner to a text editor.
V <symbol name>
This command displays a source file containing the function specified by
<symbol name>.
The F1 Window command can be used to open the file selection window and
change the displayed file.
• If a file that has no source line information is opened with the V
command, source level execution within the file and command
input with source line specifications are not possible.
If the environment variable PANASRC has been set, the V command displays the files in the directory specified by PANASRC.
If PANASRC is not set, the V command displays the files in the
current directory.
• Even if the line number is omitted, the “:” after the file name is
required.
V
Example
Display the source code
in the Code window,
starting from the location where the symbol
“init_data” is defined.
Displays the file “startup.
asm” in the Code window.
>v init_data
>v startup.asm:
[☞ Chapter 6, Window Commands for the U command]
Code Display/Change
188
INFLUENCES
U
On-the-fly
function
Display disassembled code
U [<address>]
UPUSH [<address>]
UPOP
UEND
UX [<address S>][,<address E>]
These commands display one screen of disassembled code in memory,
starting from <address>, in the Code window or the Command window.
The display of disassembled code in the Code window can be easily scrolled
up and down by using the ↑ and ↓ keys, or the ROLL UP and ROLL DOWN keys.
U [<address>]
This command displays the disassembled code, starting from the specified address, in the Code window.
Valid symbols can be used in the <address> specification.
UPUSH
[<address>]
This command PUSHes the current displayed address onto the address
stack (an 8-level internal stack) and then displays the disassembled code,
starting from the specified address.
UPOP
This command POPs the last address that was UPUSHed onto the stack
and displays the disassembled code, starting from that address.
UEND
This command displays the disassembled code, starting from the last address that was UPUSHed onto the stack.
UX
This command displays the disassembled code, starting from the specified address, in the Command window.
If <address E> is specified, the code is displayed in the Command window up
to that address. If <address E> is omitted, as many lines of code as are needed to
fill the Command window are displayed. This command is useful for saving the
results of disassembly in a file.
[☞ “>” command]
[<address S>]
[<address E>]
Code Display/Change
7. Dialog Commands
Example
Display the disassembled
code in the Command
window, starting from the
symbol “main”.
Save the disassembled
code output in addresses 80000000 to
8000005F in the file
“test.log”.
189
>u main
>ux cnt60
_cnt60:
SAMPLE.C:0043:
sec[0]++;
80000056 FCA40C000000
8000005C 40
mov
inc
(0x0C _sec ),d0
d0
8000005D FC810C000000
>
mov
d0,(0x0C _sec )
>>test.log
>ux 80000000,8000005f
>>
>
[☞ V command and A command]
Reference: Disassembled code display rules
(1) Differentiating register names and immediate values
In order to differentiate register names from immediate values,
immediate values are displayed in upper-case letters.
<Example>
MOV
d0,
a0
D0 register → A0 register
MOV
D0, a0
Immediate value 0xd0 → A0 register
(2) The display of disassembled code in the Code window can
be scrolled up and down by using the ↑ and ↓ keys, or the
ROLL UP and ROLL DOWN keys.
However, when the ↑ or ROLL UP key is pressed, if the first
address that is displayed happens to be an operand, the display
is shifted so that the subsequent instruction is displayed.
U
Code Display/Change
190
INFLUENCES
A
On-the-fly
function
Input assembly language line
A [<address>]
If the A command is input, the system enters mnemonic input mode, displays the specified address, and waits for a mnemonic to be input.
If the <address> specification is omitted, input starts at the next address following the last address used by the A command.
The mnemonic that is input is then assembled, and the resulting instruction
code is stored in memory at the specified address. If the mnemonic that was input
is correct, the machine language code that was stored in the address is displayed
to the right of the address, and then the system begins waiting for the next input.
Press the [Return] key to return to the C source code debugger’s command
mode from assembly language input mode.
Reference: Subcommands in assembly language input mode
/<address>
Changes the address.
ORG<address>
Changes the address.
↵ (Return)
Proceeds to the next address.
–
Returns to the previous address
<symbol>:
Registers a symbol.
DB<data>
Stores 8-bit data.
DW<data>
Stores 16-bit data.
DD<data>
Stores 32-bit data.
In order to differentiate hexadecimal immediate values that begin
with the letters “A” through “F” from register names, add a zero in
front of the immediate value.
Example
>a 80000000
80000000
80000003
add 16,sp
jmp 80000062
Change the address to
80000062.
80000006
80000062
/80000062
add &ffee,sp
“???” indicates an input
error.
???
80000062
80000068
>
add ffee,sp
.
[☞ V command and U command]
Code Display/Change
7. Dialog Commands
K
191
A
Back trace
K
This command back traces the C stack frame and displays the process
(addresses) by which the current function was called from the “main” function.
If back tracing is selected for the Option window, the most recent back trace
information is always displayed in the Option window.
The K command is valid only in C debugging mode.
Code Display/Change
K
192
8
Watch Display
The C source code debugger is equipped with a function that displays the contents of memory, variables, and other information important for debugging work
in the Watch window in the specified format. This function can be used to continuously display the most recent contents of data at those checkpoints that must
be monitored most carefully during debugging. As a result, it is possible carry out
debugging work smoothly, without interruption and without the need to input data
display commands each time a break or trace is executed, as is required in conventional debuggers.
INS command
This command displays the contents of the specified C expression or symbol.
W command
This command registers the specified memory contents or variables for watching.
VAL/? command
This command displays the contents of a C expression or variable.
Y command
This command deletes the specified watch point.
Watch Display
7. Dialog Commands
Global variable:
Local variable:
INS
INFLUENCES
CANNOT BE USED
193
On-the-fly
function
Inspect
INS <variable name>[,<function name>]
This command displays the specified variable, array, or bit value in the
Inspect window according to the variable data.
Local variables can be displayed by specifying <function name> for the function in which that local variable is used. If <function name> is omitted, the current function is assumed.
The following local commands can be used.
F4 (Zoom)
F5 (16 < > 10)
When inspecting pointers, arrays, or structs, this command enlarges the
window to fill the screen.
This function is extremely useful when referencing an array with a large number of elements, etc. If this key is pressed again while the window is enlarged to
fill the screen, the window is reduced to its original size.
In the scalar display, values are displayed in both decimal and hexadecimal
format. However, if the number of elements in an array or struct is such that they
cannot all be displayed on one line, they are displayed in either decimal format
(default) or hexadecimal format, not both.
The F5 key is used to switch the base.
F6 / Ctrl+I / I
(Inspct)
This command displays an array or struct element that is selected (highlighted) through the use of the cursor keys in a newly opened Inspect window.
The ESC key is used to close the current Inspect window.
F7 / Ctrl +W / W
(Watch)
This command registers the variable that is inspected, or the element that
is selected, for watching in the Watch window.
Watch Display
I
194
F8 / Ctrl + V / V
(View)
F9 / Ctrl +R / R
(Range)
F10 (Change)
This command displays the variable that is inspected, or the element that
is selected, for viewing in the Command window.
This command changes the array or pointer display element number or
the maximum element number.
If these keys are pressed, the window that is used to input the number of the
element to be referenced opens. At this point, the current display element and the
maximum element number are displayed, highlighted. Input the new display element number and maximum display element number (may be omitted). During
line input, the history and line edit shell functions can be used.
This command is extremely useful when referencing a large array or when
referencing the area around a pointer.
This command changes the value of the variable that is inspected, or the
element that is selected. The variables that can be changed by this command must have either the scalar attribute (char, int, etc.) or the pointer
attribute.
Pressing this key opens a window that is used to input the new value (expression). Once the expression has been input, it is evaluated; if no errors are found,
the value of the variable is changed to the new value. During line input, the
history and line edit shell functions can be used.
[☞ Chapter 6, section 2-1 for the Inspect function]
Watch Display
7. Dialog Commands
Global variable:
Local variable:
NO INFLUENCES
On-the-fly
function
CANNOT BE USED
W
195
Register watch
W <address>[,<count>][,{/H|/D|/O}]
WB <address>[,<count>][,{/H|/D|/O}]
WW <address>[,<count>][,{/H|/D|/O}]
WD <address>[,<count>][,{/H|/D|/O}]
WA <address>[,<count>][,{/H|/D|/O}]
WS <address>
W? C expression
I
These commands register the specified memory contents or symbol for
watching.
Just as with the D command, the watch specification has a number of display
patterns (formats). When an address or symbol is registered for watching, its
content is displayed in the Watch window in the specified format.
<count> specifies the number of data items to be displayed in one line, up to a
maximum of 29 (0x1D). WA (only) supports a maximum of 99 (0x63).
Option
Use
When omitted
<address>
<count>
Watch address
Number of data items
Error
1 data item is displayed; in the case
/H
displayed on one line
Hexadecimal display specification
of WA, 32 characters are displayed
Hexadecimal display
/D
/O
Decimal display specification
Octal display specification
Hexadecimal display
Hexadecimal display
W
Watch Display
196
W/W B
Byte (8 bits) display
W W
Word (16 bits) display
W D
Double word (32 bits) display
W A
ASCII display (8-bit units)
W S
4-byte real number (short floating point) display
W ?
C expression display
Example
>W SEC
>W? SEC[1]
>W 100,5
>
[☞ Y command]
Reference: Some C variables, such as local variables, have a limited scope
(range of use). As a result, some variables cannot be evaluated, depending on the position of the program counter. In case such as
when local variables are assigned to registers automatically by the
C compiler, the value of the C expression in the Watch window
changes to “????”.
Watch Display
7. Dialog Commands
Global variable:
Local variable:
VAL/?
NO INFLUENCES
CANNOT BE USED
197
On-the-fly
function
Evaluate C expression
VAL <C expression>[,<function name>]
VAL <variable name>[,<function name>]
? <C expression>[,<function name>]
? <variable name>[,<function name>]
This command displays the contents of a C expression or a variable.
Local variables can be displayed by specifying <function name> for the function in which that local variable is used.
If <function name> is omitted, the current function is assumed.
V A L <C expression>~
? <C expression>~
These commands display the expression type and its value.
V A L <variable name>~
? <variable name>~
These commands display the variable type, variable name, and variable
value.
The “*” and “?” wild cards can be used in <variable name>.
* Matches all patterns
? Matches all single characters
For example, if the command “? ab*↵” is input, all variables that begin with
“ab” are displayed.
When displaying a C expression or variable that has multiple elements, such
as an array, the elements are enclosed in rounded brackets (“{}”) and as many
elements as will fit on one line are displayed.
V
W
Watch Display
198
The VAL command can use substitution operators and operators with secondary effects, such as “++” or “– –”. If an
operator with a secondary effect is used with the “?” command, the message “Operator with possible harmful side
effect cannot be used” is displayed and an error is generated.
• When only referencing data, do not use the VAL command; use
the “?” command.
• When using an operator that has a secondary effect, such as
changing data, use the VAL command. Doing so will eliminate
inadvertent changes to variables in a program resulting from mistakes in the evaluation of C expressions (for example, mixing up
“==” and “=”).
• In the VAL command and the “?” command, all variables contained in a C expression must be in a usable state.
The following example uses a cast operator as an example of how to use the
“?” command. Proper use of the cast operator makes it possible to display the
contents of memory in an easy-to-understand format.
Example
>d sec
0000000C
08 00 00 00 03 00 00 00
00 00 00 00 00 00 00 00
................
00 00 00 00 00 00 00 00
................
>? sec
(int [2]) @0000000C {8,3}
>d
0000001C
00 00 00 00 00 00 00 00
>
[☞ Chapter 6, section 3-1 “Inspect function”]
Watch Display
7. Dialog Commands
On-the-fly
function
NO INFLUENCES
Y
199
Delete watch
Y {<list>|*}
This command deletes the watch registrations set with the W command.
If <list> is specified, the watch registrations with the specified numbers are
deleted. If “*” was specified, all watch registrations that were set are deleted and
the Watch window is closed.
Y 1, 2, 7 ↵
In the above example, watch registrations 1, 2 and 7 are deleted.
Y *↵
In this example, all watch registrations are deleted and the Watch window is
closed.
[☞ W command]
V
Y
Watch Display
200
9
System Control Commands
The Dialog commands listed below are provided for system control, such as
quitting the C source code debugger, and for help, subprocesses, and history.
Q/EXIT command
This command quits the C source code debugger.
HELP command
This command displays a help message.
! command
This command executes a subprocess.
!!/! command
This command displays/searches the command history.
System Control Commands
7. Dialog Commands
INFLUENCES
Q/EXIT
201
On-the-fly
function
Quit C source code debugger
Q
EXIT
E
These commands quit the C source code debugger and return control to
MS-DOS.
However, if a subprocess is running when this command is issued, the C
source code debugger cannot be terminated. In such a case, the following error
message is displayed and control returns to the C source code debugger prompt:
“Not terminated subprocess.”
In this case, terminate the subprocess first and then execute the Q/EXIT command.
Q
System Control Commands
202
NO INFLUENCES
HELP
On-the-fly
function
Display help screen
HELP
This command switches to the help display screen and displays the help menu.
The highlighting on the screen can be moved to the desired menu item by using
the →, ←, ↑, or ↓ key.
When the [Return] key is pressed, the content of the item selected on the help
menu is displayed. To return to the debugging menu, press the ESC key.
In order to use the C source code debugger’s help function, the help file
PT103. HLP must be located either in the current directory or in the directory
specified by the environment variable HELP.
After the command is input, the screen switches to the help screen.
Sample screen
System Control Commands
7. Dialog Commands
NO INFLUENCES
!
203
On-the-fly
function
Execute subprocess
!
!
<MS-DOS external command name>
It is possible to execute MS-DOS commands in parallel with debugging.
H
An MS-DOS command initiated by the “!” command is called a “subprocess.”
Once a subprocess is initiated by the “!” command, it is possible to switch back
and forth between the subprocess and the C source code debugger by means of
certain key sequences (multi-job function).
CTRL + 1 (numeric keypad):Shifts from C source code debugger to subprocess
CTRL + 0 (numeric keypad):Returns from subprocess to C source code
debugger
This function makes it possible to startup an editor as a subprocess and perform debugging work while referencing the source listing. In addition, by using
the overlap function and correcting and assembling the program in the subprocess, it is possible to load the executable file again.
!
This command executes COMMAND.COM.
!
<MS-DOS external
command name>
This command executes the specified MS-DOS external command
(.COM, .EXE).
Symbol
System Control Commands
204
• This function does not run processes simultaneously (multi-tasking). The subprocess does not run until control is switched to it.
In addition, the different processes do not handle files in an exclusive fashion from each other. Therefore, the subprocess must not
modify or delete files that the C source code debugger is using
(such as the environment variable TEMP or the TMP work file,
etc.). In addition, some applications cannot be used as subprocesses.
• In order to differentiate this command from the history display
and search command, always insert at least one space or tab between the “!” and <character string>.
! <MS-DOS external command name> Subprocess initiation
! <character string>
History display/search
• The message “Insufficient memory” may be output after inputting
the “! ” command or an MS-DOS external command.
In this case, if EMS memory is available for use, the problem can
be resolved by specifying the -F or -B option when starting up the
debugger so that EMS memory is used.
[☞ Chapter 5 for the startup options]
[☞ Chapter 6, section 2-6 “Shell functions”]
System Control Commands
7. Dialog Commands
NO INFLUENCES
!!/!
205
On-the-fly
function
Display/search history
!!
! <character string>
The C source code debugger has an internal 16-level command line input
buffer that can be used to display up to the last 16 command lines that were input.
It is also possible to search for character strings in the buffer, from most recent to
oldest. The information displayed by this command can be freely edited within
the Command window.
! !
This command displays the previous command that was input (history display).
! <character string>
This command searches for a character string in the history buffer that
begins with <character string>, starting from the most recent command.
If a character string that meets the condition is found, it is displayed.
In order to differentiate this command from the subprocess initiation command, do not insert a space or tab between the “!” and
<character string>.
! <MS-DOS external command name> Subprocess initiation
! <character string>
History display/search
[☞ Chapter 6, section 2-6 “Shell functions”]
Symbol
System Control Commands
206
10
Other Commands
The C source code debugger is provided with other commands for Command
window display control (cursor control, clear screen, etc.), memos, option settings, log output, and batch execution.
CLS command
This command clears the Command window.
HOME command
This command moves the Command window cursor to the home position.
LIST command
This command enables Command window display output.
NLIST command
This command disables Command window display output.
BEL command
This command sounds a beep.
TIME command
This command displays the current time.
WAIT command
This command causes the system to wait.
PRMPT command
This command changes the prompt.
* command
This command specifies comments.
Other Commands
7. Dialog Commands
207
> command
This command outputs a log of the Command window display contents.
< command
This command performs batch processing.
MEM (memo) command
This command displays, registers, and deletes memos.
N command
This command selects the base used for parameters as either decimal or hexadecimal.
OPTION command
This command sets options.
Other Commands
208
NO INFLUENCES
CLS
On-the-fly
function
Clear Command window screen
CLS
This command clears the Command window.
This command is used in combination with the HOME, PRINTF/PF, LALL,
and SALL commands for display control within macro commands.
[☞ HOME command]
NO INFLUENCES
HOME
On-the-fly
function
Move cursor to home position
HOME
This command moves the Command window cursor to the home position
(the left end of the command input line).
This command is used in combination with the CLS, PRINTF/PF, LALL, and
SALL commands for display control within macro commands.
[☞ CLS command]
Other Commands
7. Dialog Commands
LIST
NO INFLUENCES
209
On-the-fly
function
Specify display output
C
This command resumes Command window display output after it has
been suppressed by the NLIST command.
The LIST state is the default state when the C source code debugger is started
up. The LIST command and the NLIST command have opposing functions.
H
LIST
[☞ NLIST command, SALL command, and LALL command]
L
NO INFLUENCES
NLIST
On-the-fly
function
Suppress display output
NLIST
This command suppresses Command window display output.
This command can be used to suppress the display of unnecessary data.
The NLIST command and the LIST command have opposing functions.
[☞ LIST command, SALL command, and LALL command]
Other Commands
N
210
NO INFLUENCES
BEL
On-the-fly
function
Sound beep
BEL
This command causes the host computer to beep.
This command can be used in macro commands, etc., to sound a beep.
NO INFLUENCES
TIME
On-the-fly
function
Display current time
TIME
This command displays the current time in the Command window.
Example
>time
11:45:17
>
Other Commands
7. Dialog Commands
NO INFLUENCES
WAIT
211
On-the-fly
function
B
Wait
WAIT [<count>]
This command causes the system to wait either until a key is pressed or
until the specified time (<count> x 0.1) elapses.
If <count> is omitted, the system waits until a key is pressed.
This command can be used in macros to cause the system to wait.
Example
>wait
>wait
;Stops for one second
;Waits until a key is pressed
>
NO INFLUENCES
PRMPT
On-the-fly
function
Change prompt
P
This command changes the prompt used by the C source code debugger.
When the C source code debugger is first started up, the prompt character is “>”.
Only one character can be specified for <prompt character>.
T
PRMPT <prompt character>
Example
>prmpt %
%prmpt !
W
!prmpt >
>
Other Commands
212
NO INFLUENCES
*
On-the-fly
function
Comment
* [<character string>]
This command allows the use of comments (specified in <character
string>).
Therefore, anything may be written in <character string>; it will not affect the
operation of the C source code debugger in any way.
Use this command in macros, etc., to include comments in the code.
Example
>* This is a comment.
>
Other Commands
7. Dialog Commands
NO INFLUENCES
>
213
On-the-fly
function
Output log
> <file name>
>> <file name>
>
The C source code debugger is provided with a log output function that outputs the information that is output to the command window during debugging to a
file simultaneously with the screen display.
> <file name>
This command creates a new file with the specified <file name> and begins log output to that file.
If the specified file already exists, that file is deleted and a new one is created.
The <file name> specification can include a drive name and path name.
> > <file name>
This command adds (appends) the screen output information to an existing file.
If the specified file does not already exist, a new file is created.
The <file name> specification can include a drive name and path name.
>
This command stops the log output operation.
Example
>>test.log
>UX 0,1FF
>>
Appends log information
to the file “test1.log”
>>>test1.log
Stops the log output
operation
>>
>t 10
>
Symbol
Other Commands
214
NO INFLUENCES
<
On-the-fly
function
Batch
< <file name>
This batch function inputs and executes a series of commands from a file
instead of from the keyboard.
The C source code debugger sequentially executes the commands that it reads
from the file that was specified by this command. The file name can include a
drive name and path name. This function is similar to batch processing in DOS,
and is useful for repeated execution of a predetermined sequence of operations.
However, unlike DOS batch processing, it is not possible to pass parameters to
this function. If the ability to pass parameters is needed, use a macro function.
In addition, if the INIT.MCR file is located in the current directory when the C
source code debugger is started up, the C source code debugger loads and executes automatically. This file is equivalent to the AUTOEXEC.BAT file in
DOS.
In other words, by writing any preprocessing (such as loading the user program) essential for program debugging in this file, it is possible to automatically
execute that processing when the C source code debugger starts up.
The batch function is useful if used for macro definition (registration). Although macros can be defined from within the C source code debugger, it is also
possible to use a text editor to write large macros outside of the C source code
debugger, and then use the batch function to register those macros in the C source
code debugger.
It is also possible to use the MLIST command to load macros written in a file.
Batch execution can be interrupted by pressing the ESC key.
Example
Execute commands
from the file “m1.mcr”
><m1.mcr
.
.
.
.
>
[☞ MLIST command and macro definition]
Other Commands
7. Dialog Commands
NO INFLUENCES
MEM
215
On-the-fly
function
Display/register/delete memo
MEM <number>[,<character string>]
MEM*
MEM
These commands are used to display, register, and delete memos.
The contents of the memos are displayed in the Memo window, one of the
Option windows. A character string set by the MEM command can also be called
up by the CTRL + SHIFT + function key sequence.
M E M <number>
[,<character string>]
This command registers the specified character string in the memo indicated by <number>.
If <character string> is omitted, any memo registered in the specified memo
number is deleted.
M E M *
This command deletes all of the memos that are currently registered.
M E M
This command displays the contents of the memos that are currently registered.
M
Example
>mem1,Panasonic
>mem2,PanaX
>mem3,MN10300
>mem
MEMO 1 : Panasonic
MEMO 2 : PanaX
MEMO 3 : MN10300
>mem2
>mem
MEMO 1 : Panasonic
MEMO 3 : MN10300
>mem *
>mem
>
[☞ Chapter 6, section 2-7 for the Memo command]
Symbol
Other Commands
216
NO INFLUENCES
N
On-the-fly
function
Change input format base
N {10|16}
This command changes the base for parameters input in Dialog commands to either decimal or hexadecimal.
When the C source code debugger starts up, the base is 16.
N 10
N 16
Example
>N 10
Other Commands
Changes the input base to 10.
Changes the input base to 16.
7. Dialog Commands
NO INFLUENCES
OPTION
217
On-the-fly
function
Set option
OPTION <reg>[,<code>[,<case>]]
This command can be used to set various C source code debugger options.
The items that can be set by this command can also be displayed/changed by
using the Window command SHIFT + F10. The options that can be set by this
command are listed below.
Option
Parameters
<reg>
<code>
(ON|OFF)
(SRC|ASM)
Register window display control
Code window source/disassembled code display switching
<case>
(ON|OFF)
Symbol name uppercase/lowercase discrimination on/off
Example
Description
>option ON,SRC,OFF
>option OFF
N
>
>
O
Other Commands
218
Other Commands
Chapter 8
Macro Commands
1. Macro Command Overview
2. Macro Commands
220
1
Macro Command Overview
1-1 Macro function
The macro function makes it possible to construct new commands by combining existing commands. In the C source code debugger, it is possible to create
sophisticated macro commands by using a wide variety of commands and powerful macro control structures.
The features of the C source code debugger’s macro function are listed below.
(1) The macro function supports control structures similar to those used in C,
making it possible to describe easy-to-understand macros in a block format
without using GOTOs.
(2) It is possible to nest up to 255 IF statements, making it possible to handle
different possibilities with tremendous detail.
(3) It is possible to nest up to 15 macros, so that separate macros can be used as
subroutines and expanded within other macros.
(4) Up to 10 parameters can be passed to a macro command.
(5) It is possible to define macro commands that use combinations of cursor control commands, the PRINTF/PF command, etc., to create formatted screen
output, and that use combinations of symbol definition functions to perform
interactive processing.
Macro commands can be used in the same manner as the C source code
debugger’s internal commands. In other words, there is no special command that
is needed in order to execute a macro command. A macro command can be interrupted by using the ESC key.
By using special symbols, execution control commands can be used to make
even more efficient debugging possible. Some specific examples are shown below.
Example
{test1
bp sec,w
do{
g
while{_ _run_ _
}
}while val(sec[0]!=9)
}
Macro Command Overview
8. Macro Commands
221
This macro sets a hardware break at the address assigned to the variable “sec”.
The 3rd through 7th lines form a “do{}while” loop, and as long as the condition
sec!=9 that follows the “do{}while” loop is not met, the G command is executed.
Example
{TEST2
bp .45
ti run
g
while{_ _run_ _
}
if{val(sec[1]==1)
g
}
if {_ _run_ _!=1
ti
}else{
esc
pf 'Forced break was executed'
}
}
In this example, a break point is set in the 45th line first. The third line measures the execution speed of the timer command. The fourth line initiates execution. Then, in the 9th line, if the user program is stopped, the time required to
execute from the 45th line to the 45th line is displayed and the macro is exited.
On the other hand, if the user program is running in the 9th line, the macro inputs
“ESC”, displays a message indicating that fact, and exits the macro. (User program execution can be interrupted by inputting ESC from within a macro.)
These are just two examples of how macros can be used to make more efficient debugging possible. This function can also be used in durability testing by
collecting the results of macro command execution in a file and determining
whether the same commands yield the same results.
Macro Command Overview
222
2
Macro Commands
The following Dialog commands are provided as macro definition/execution
commands and as control commands supported by the C source code debugger to
provide control structures similar to those in C.
DO{ }WHILE command
This command executes do{..}while macro control.
FOR{ }command
This command executes for{..} macro control.
WHILE{ }command
This command executes while{..} macro control.
REPEAT{ }command
This command executes repeat macro control.
BREAK command
This command exits a macro.
LALL command
This command specifies display output by a macro.
SALL command
This command suppresses display output by a macro.
MLIST command
This command displays the registered macros.
KILL command
This command deletes registered macros.
IF{ } command
This command executes a command under conditional control.
KEYIN command
This command specifies input from the keyboard.
Macro Commands
8. Macro Commands
{< > < >}
223
Execute macro command
{<macro name><macro body>}
This command defines a macro command.
<macro name> is the name of the macro being defined.
If {<macro name> ↵ is input, the macro input prompt “?” appears and the
system waits for the input of the body of the macro being defined.
Multiple internal commands and macro commands can be freely written in the
<macro body> portion; there is no limit on the number of commands that can be
included, except for the capacity of the macro buffer.
No error checking of the commands is performed while <macro body> is being input. Error checking is performed only when the macro is executed. The
input of <macro body> is terminated by inputting “} ↵”. If a macro is defined
with the same name as an internal command of the C source code debugger, the
following error message appears:
“Conflicting Dialog command.”
In addition, if a macro is defined with a name that is the same as that of a
previously defined macro, the old macro definition is deleted.
A macro command cannot be defined from within a macro command.
In other words, macro commands can only be defined in the C source code
debugger command input mode (when the “>” prompt is displayed).
Reference: The user can change the “>” prompt to a different character by using the PRMPT command.
While this command can be used to define simple macro commands after the
C source code debugger has been started up, large macro commands can be more
easily described by using an editor beforehand and then using the batch function
for macro registration.
In addition, in order to save macro commands that were defined within the C
source code debugger, it is possible to use the MLIST command to write the macros to a file.
Symbol
Macro Commands
224
Example
>{TEST1
? bp sec, ex
? do{
?
g
?
while{_ _run_ _
?
}
? }while val(sec[0]!=9)
?}
>
[☞ < command and MLIST command]
Notes on macro description
(1) An error will result if the description “%0” is made within a
macro.
Example of a description that generates an error:
{test
while{_ _ run _ _
}
repeat {wi0, wi1, wi2
d %0
}
}
In order to implement “%0” in a macro, use “%%”.
Example of a description that does not generate an error:
repeat {wi0, wi1, wi2,
d %%0
}
(2) In the case of <macro command>{<parameter list, etc.>}, a
space between the macro command and the “{” will prevent the
macro from being properly recognized. The “{” should follow
immediately after the macro command.
Examples where macro is recognized normally:
for{<command 1>,<expression>,<command 2>
<macro body>
if{<parameter list>
Examples where macro is not recognized normally:
for {<command 1>,<expression>,<command 2>
<macro body>
if {<parameter list>
Macro Commands
8. Macro Commands
[]
225
Execute macro command
<macro name>[<parameter list>]
A defined macro can be executed with the same input format as an internal
command of the C source code debugger. In other words, there is no special
command that is needed in order to execute a macro command. (As long as the C
source code debugger prompt is displayed, a macro command can be executed
simply by inputting the macro name.)
In addition, up to 10 parameters can be specified for a macro command. The
parameters are delimited by commas. The parameters specified in the macro
command replace the pseudo-parameters %0, %1, ..., %9 within <macro body>
when the command is executed.
%0 Corresponds to the first parameter in the macro command
%1 Corresponds to the second parameter in the macro command
.
.
.
%9 Corresponds to the tenth parameter in the macro command
A macro command that is executing can be interrupted by pressing the ESC
key. When specifying parameters, commas (“,”) and single quotation marks (’)
can be enclosed in square brackets ([..]) when they are included within a character
string so that the string is treated as a single parameter. In this case, the square
brackets are deleted from the character string when it is passed to the macro as a
parameter.
Symbol
Macro Commands
226
Example
>{calc
?h %0
?}
>calc 1,2
>h 1
oct
dec
00000000001
>calc [1,2]
1
hex
00000001
asc
'....'
float
0.000000e+00
>h 1,2
oct
dec
hex
asc
float
+: 00000000003
3
00000003
'....'
0.000000e+00
-: 37777777777
-1
FFFFFFFF
'....'
-6.805647e+38
double: 0.000000000000000e+00
>
Macro Commands
8. Macro Commands
DO{ }WHILE
227
Macro control execution
D
DO {<macro body>} WHILE <expression>
In the same manner as a macro command definition, if “DO{↵” is input, the
macro input prompt “?” is displayed and the system enters macro input mode.
Multiple commands and macros can be freely written in the <macro body> portion; there is no limit on the number of commands that can be included, except for
the capacity of the macro buffer.
The input of <macro body> is terminated by inputting
“{WHILE<expression>↵”.
After the entire <macro body> is executed, the value of <expression> is evaluated. If the value is 0, the macro terminates; if the value is not 0, <macro body> is
executed again, starting from the beginning. The commands in <macro body> are
always executed at least once in a DO{..}WHILE macro.
Example
{test3
reset
do{
t
}while val(sec[0]!=9)
}
[☞ Macro command definition]
Symbol
Macro Commands
228
FOR{ }
Macro control execution
FOR {<command 1>,<expression>,<command 2><macro body>}
In the same manner as a macro command definition, if “FOR{<command
1>,<expression>,<command 2>}↵” is input, the macro input prompt “?” is displayed and the system enters macro input mode. Multiple commands and macros
can be freely written in the <macro body> portion; there is no limit on the number
of commands that can be included, except for the capacity of the macro buffer.
The input of <macro body> is terminated by inputting “}↵”.
In the FOR{..} macro, <command 1 > is executed and then the value of <expression> is evaluated. If the value is 0, the macro terminates; if the value is not
0, <macro body> is executed from the beginning. After <macro body> is executed, <command 2> is executed and then <expression> is evaluated again.
<macro body> and <command 2> are then executed in turn until the value of the
expression is 0. In the FOR{..} macro, if the value of <expression> is 0 the first
time it is evaluated, the commands in <macro body> are not executed even once.
Example
{fort
for{j=0x100,j<0x200,j=j+1
e j,ff
}
}
This macro command writes the data specified by parameter 3 in every other
byte in memory, starting from the address indicated by parameter 1 and continuing to the address indicated by parameter 2.
[☞ Macro command definition]
Macro Commands
8. Macro Commands
WHILE{ }
229
Macro control execution
WHILE {<expression><macro body>}
F
In the same manner as a macro command definition, if “WHILE{<expression> ↵”
is input, the macro input prompt “?” is displayed and the system enters macro
input mode. Multiple commands and macros can be freely written in the <macro
body> portion; there is no limit on the number of commands that can be included,
except for the capacity of the macro buffer.
The input of <macro body> is terminated by inputting “}↵”.
In the WHILE{..} macro, the value of <expression> is evaluated first. If the
value is 0, the macro terminates; if the value is not 0, <macro body> is executed
from the beginning. After <macro body> is executed, <expression> is evaluated
again. <macro body> is executed continually until the value of the expression is
0. In the WHILE{..} macro, if the value of <expression> is 0 the first time it is
evaluated, the commands in <macro body> are not executed even once.
Example
>while{_PC!= 4000009f
?t
?}
>
>
This macro command step executes the program until the PC register reaches
0x4000009f.
[☞ Macro command definition]
W
Macro Commands
230
REPEAT{ }
REPEAT {..}
Macro control execution
REPEAT {<parameter list><macro body>}
In the same manner as a macro command definition, if “REPEAT{<parameter
list>}↵” is input, the macro input prompt “?” is displayed and the system enters
macro input mode. Multiple commands and macros can be freely written in the
<macro body> portion; there is no limit on the number of commands that can be
included, except for the capacity of the macro buffer.
The input of <macro body> is terminated by inputting “}↵”.
In the REPEAT{..} macro, the pseudo-parameter “%0” in <macro body> is
replaced by each element in <parameter list>, one by one, as <macro body> is
executed. Therefore, <macro body> is repeatedly executed a number of times
equal to the number of elements in <parameter list>. The maximum number of
parameters that can be specified is 10.
Example
>d 80000000
80000000
A3 06 86 00 ED CB 31 00
01 F2 F0 90 00 2D 00 20
>repeat{80000000,80000002,80000004,80000006
?e %0,ff
?}
>e 80000000,ff
>e 80000002,ff
>e 80000004,ff
>e 80000006,ff
>d 80000000
80000000
FF 06 FF 00 FF CB FF 00
01 F2 F0 90 00 2D 00 20
>
[☞ Macro command definition]
Macro Commands
8. Macro Commands
231
B
BREAK
Exit macro
BREAK
This command can only be used within the <macro body> portion of a
macro command. If a BREAK command is executed in a macro, that
macro is forcibly exited one level.
Example
>{chkgo
?bp .45
?while{1
? g
while{_ _run_ _
}
? if{val(sec[0]==9)
?
break
? }
?}
?}
>
In this example, when the IF condition in the CHKGO macro is satisfied, the
BREAK command is used to exit the WHILE loop.
R
Macro Commands
232
LALL
Macro display output specification
LALL
This command resumes display of the commands within the macro command and of the prompt in the Command window after such display was
suppressed by the SALL command.
The C source code debugger is in the LALL state when it is started up. The
LALL command and the SALL command have opposite functions.
Example
>{test
?sall
?t
?d 80000000
?lall
?t
?d
?}
>test
>sall
—— IM=0 S=0 D0 =00000000 D1 =00000000 D2 =00000000 D3 =00000000
PSW=0000
A0 =00002000 A1 =00000000 A2 =00000000 A3 =00000000
PC=80000008 MDR=00000000 LIR=80000006 LAR=00000000 SP =00002000
add
-0C,sp
80000000
>t
FC DC 00 20 00 00 F2 F0
F8 FE F4 FC CD 14 20 00
—— IM=0 S=0 D0 =00000000 D1 =00000000 D2 =00000000 D3 =00000000
PSW=0000
A0 =00002000 A1 =00000000 A2 =00000000 A3 =00000000
PC=8000000B MDR=00000000 LIR=80000008 LAR=00000000 SP =00001FF4
mov
2014,d1
>d
80000010
>
00 A5 00 C3 0F FC DC 00 00
00 00 00 60 50 29 FC
[☞ SALL command, LIST command, and NLIST command]
Macro Commands
8. Macro Commands
SALL
233
Macro display suppression specification
SALL
This command suppresses display of the commands within the macro
command and of the prompt in the Command window.
The SALL command and the LALL command have opposite functions.
Example
>{test
?sall
?t
?d 100
?}
L
>
>test
>sall
—— IM=0 S=0 D0 =00000000 D1 =00000000 D2 =00000000 D3 =00000000
PSW=0000
A0 =00000000 A1 =00000000 A2 =00000000 A3 =00000000
PC=80000000 MDR=00000000 LIR=40000000 LAR=00000000 SP =00000100
mov 2000 _i ,a0
00000100 D7 16 B1 F0 E7 79 FD 7B
DE 1D D2 86 B7 8F 33 D3
>
>
S
[☞ LALL command, LIST command, and NLIST command]
Macro Commands
234
MLIST
Display macros
MLIST
MLIST <macro name>
MLIST> <macro file name>
These commands display the macros.
M L I S T
This command displays all of the macro names currently defined.
M L I S T
<macro name>
This command displays the macro body (the contents of the macro definition) of the macro command specified by <macro name>.
M L I S T >
<macro file name>
This command writes the contents of all of the currently defined macros
into the file specified by <macoro file name>.
This file can be loaded by means of the C source code debugger batch function
(“<” command).
Example
>mlist
Q
TLALL
TSALL
>mlist tlall
sall
t
d10
lall
t
d
>mlist>macro.log
>
[☞ “<” command]
Macro Commands
8. Macro Commands
KILL
235
Delete macro
KILL <macro name>
KILL*
These commands delete currently registered macro commands.
K I L L <macro name>
This command deletes the macro command specified by <macro name>.
K I L L*
This command deletes all of the macro commands that were defined by
the user.
K
Example
>mlist
BKSET
M
DISP
INIT
Q
RUN
>kill run
>mlist
BKSET
DISP
INIT
Q
>kill*
>mlist
Q
>
[☞ Macro command definition]
Macro Commands
236
IF{ }
Conditional execution
IF {<expression><command>[} ELSEIF{<expression>]<command>[} ELSE{]<command>}
This macro command is valid only within a <macro body>. First, <expression> is evaluated, and if the value is not 0, the next <command> is executed.
If the evaluated value is 0, the <command> that follows the ELSE that corresponds to the IF is executed.
Example
If the value of the program counter is
“0x4000009f”, dump
the contents of memory,
starting from the “sec”
symbol address; otherwise execute five steps.
{chkgo
g
esc
while{_ _run_ _
}
if{_PC==0x4000009f
d sec
}else{
t 5
}
}
{chkram
t 5
If the data in address 70
is “8”, output the message; otherwise, output
the data in address 70.
if{(*70&0xff)==8
pf'test OK'
}else{
pf'&x',*70&0xff
}
}
Macro Commands
8. Macro Commands
KEYIN
237
Specify input from the keyboard
KEYIN
This command is used within a user-defined macro command to ask for the
next line to be input from the keyboard.
Example
>{setd
?e 80000100
I
?11
?22
?33
?44
K
?keyin
?66
?.
?}
>setd
>e 80000100
address asc oct
80000100 ‘.’ 370
dec hex data
-8 F8 11
80000101 ‘.’ 347
80000102 ‘.’ 003
-25 E7
3 03
22
33
80000103 ‘$’ 044
80000104 ‘¡’ 301
36 24
-63 C1
44
55
80000105 ‘&’ 046
80000106 ‘{‘ 173
38 26
123 7B
66
.
>
In this example, the “55” in address 80000104 was input from the keyboard;
all of the other data was input through macro expansion.
Macro Commands
238
Macro Commands
Chapter 9
Appendix
1.
2.
3.
4.
In-circuit Emulator Specifications
Switch Settings for Interface Board
Notes for Probe Section
C Source Code Debugger
Error Messages
5. Quick Reference
6. Supplement for the PC/AT (DOS/V)
Version
240
1
In-circuit Emulator Specifications
1-1. Functional Specifications
Item
Specifications
Target device
MN10300 Series
Memory capacity
Emulation memory
1024K (standard)
(high-speed memory:512K,
low-speed memor:512K)
2560K (maximum)
(high-speed memory:512K,
low-speed memory:2048K)
Break functions
Execution address
breaks
4 events maximum
Conditions: area specification,
pass count specification
4 events maximum
Conditions: area specification,
pass count specification, bit
mask, read/write/access specification, data width specification,
match/no match specification
Available
8 levels
Available
None
Data breaks
AND breaks
Sequential breaks
“Trace full” breaks
External breaks
Trace functions
Trace memory
capacity
Data acquired
through tracing
Trace mode
16K steps
Measurement mode
Time measurement
resolution
Continuous measurement mode,
maximum/minimum execution
time measurement mode
Switchable among 25ns/50ns/
100ns
Trigger output
function
Trigger outputs
8 signals
RAM monitor
function
Sample memory
256 bytes
Display mode
Dump list mode
Bitmap mode
Performance
measurement
function
Profile
measurement
Execution ratio (%) display
Clock
OSC1
Target side
(separate excitation only)
XI
Target side
Timer functions
Execution address, data address,
data, bus status information
Normal mode, branch trace
mode, event condition trace
mode
(separate excitation only)
In-circuit Emulator Specifications
9. Appendix
241
1-2. Electrical Specifications
Item
Rating
Emulator and probe supply voltage
0.5 to 3.6V
Trigger output voltage
-0.3 to 3.6V
Trigger output current
±4mA
1-3. Environment Specifications
Item
Rating
Temperature
During operation
During storage
10°C to 30°C
0°C to 45°C
Humidity
During operation
During storage
20% to 80%
No more than 90%
1-4. External Dimensions
Length x Width x Height
130mm x 100mm x 40mm
In-circuit Emulator Specifications
242
1-5. Target Interface
Trigger output section (PROBE CN2)
ICE Control chip
PROBE CN2
2˚
CMOS driver
In-circuit Emulator Specifications
9. Appendix
2
243
Interface Board Switch Settings
The interface between the host computer and the In-circuit Emulator uses one
byte of I/O space in the host computer. Only the lower eight bits of the I/O address are decoded. The upper eight bits are used within the board. Set the interface board switches in accordance with the computer system being used. Although any address may be used as an I/O address, as long as it is an unused
address, the addresses shown in the table that follows should normally be set.
2-1. When the Host Computer is the PC-9800 Series
Fuseless circuit breaker
DSW3
DIP switches
DSW6
CN2
DSW1 DSW2
DSW4 DSW5
DSW7 DSW8
Rotary switches
The function of the fuseless circuit breaker is to protect the 5V power supply from damage due to overcurrent. If overcurrent flows through the
breaker for any reason, the white button pops out and the current is interrupted. If the fuseless circuit breaker is tripped, determine what the cause
was before pushing the white button back in. When pushing the white
button, do not use too much force.
The white button is deemed to have popped out when it extends 1 or 2 mm
out from the fuseless circuit breaker when viewed from above.
Interface Board Switch Settings
244
• Rotary switch settings (DSW1,2,4,5,7,8)
I/O address DSW1 DSW2
xxD0H
--xxD1H
--:
:
:
xxDFH
--xxE0H
--xxE1H
--:
:
:
xxEFH
---
DSW4
0
0
:
0
0
0
:
0
DSW5
--:
---:
--
DSW7
D
D
:
D
D
E
:
E
DSW8
0
1
:
F
F
1
:
F
Note: “The “-” indicates any position is fine.
Set an unused address from xxD0H to xxEFH as the I/O address.
•
DIP switch (DSW3, 6 ) settings
DSW3
DSW6
1
OFF
OFF
Interface Board Switch Settings
2
OFF
OFF
3
ON
OFF
4
ON
ON
9. Appendix
245
2-2. When the Host Computer is the PC-98 NOTE Series
Open this panel to set the switches.
+
PanaXSeries
ICE POWER
The DC jack is used to supply the power for
Panasonic EPROM programmers used independently.
(The AC adapter, sold separately, is required.)
Connector to It is not required when the power for PanaX is
PC-98 NOTE used.
The ICE POWER indicator lights when the
power is supplied from the DC jack.
DC jack
DIP switch
Rotary switch 1 [A19-A16]
Rotary switch 2 [A15-A12]
Rotary switch 3 [A7-A4]
Rotary switch 4 [A3-A0]
12345678
›
›
›
›
ICE POWER
Interface Board Switch Settings
246
•
Rotary Switch (DSW1 to 4) settings
I/O address
xxD0H
xxD1H
:
xxDFH
xxE0H
xxE1H
:
xxEFH
DSW2
–
–
:
–
–
–
:
–
DSW1
–
–
:
–
–
–
:
–
DSW3
D
D
:
D
E
E
:
E
DSW4
0
1
:
F
0
1
:
F
Note: The “-” indicates any position is fine.
Set an unused address from xxD0H to xxEFH as the I/O address.
•
DIP switch settings
1
2
3
4
5
6
7
8
ON
ON
OFF
OFF
ON
ON
ON
OFF
Interface Board Switch Settings
9. Appendix
247
2-3. When the Host Computer Is a PC/AT (DOS/V Series)
Machine
DIP switch
Rotary DIPRotary
switches
BCD
789A
012
EF
34 5 6
DSW4
DIP switch
DIP switches
OFF
DSW6
DSW7
OFF
789A
012
EF
34 5 6
1 2 3 4
1 2 3 4
IBM PC/AT (XT) I/F BOARD
DSW5
BCD
789A
012
EF
34 5 6
DSW3
BCD
789A
012
EF
34 5 6
DSW2
BCD
BCD
•
789A
012
EF
34 5 6
DSW1
Rotary switch (DSW1, 2, 3, 4, 6) settings
I/O address
DSW3
DSW2
DSW1
DSW4
DSW6
0300H
0301H
:
030FH
0310H
0311H
:
03FFH
3
3
:
3
3
3
:
3
0
0
:
0
1
1
:
F
0
1
:
F
0
1
:
F
–
–
:
–
–
–
:
–
–
–
:
–
–
–
:
–
Note: “-” indicates any position is fine.
Set an unused address from 0300 to 03FFH as the I/O address.
•
DIP switch (DSW5, 7) settings
1
2
3
4
DSW5
OFF
OFF
OFF
ON
DSW7
OFF
ON
ON
ON
Interface Board Switch Settings
248
3
Special Notes on the Probe
3-1. Electrical Specifications
The absolute maximum ratings and electrical characteristics are the same as
those of the microcomputer inside the probe. When power is supplied from the
target, the supply voltage must be between -0.5V and 3.6V, and while the unit is
in operation, stable voltage between 2.5V and 3.6V must be supplied. Operation
is not guaranteed if the supply voltage is not stable.
3-2. Environment Specifications
Item
Ratings
Temperature
During operation
During storage
10°C to 30°C
0°C to 45°C
Humidity
During operation
During storage
20% to 80%
No more than 90%
Special Notes on the Probe
9. Appendix
4
249
C Source Code Debugger Error
Messages
The C source code debugger displays an error message when an error is found in
a command that was input by the user.
The C source code debugger error messages are explained below.
Not enough memory.
The C source code debugger could not be started up because there is not enough
available memory. Restart the C source code debugger with the -B or -F option.
EMS driver not found./Not enough free space in EMS.
This error message appears when an attempt was made to use EMS memory as a
work area with the -FEMS or -BEMS option, but either the EMS driver could not
be found or there was not enough free space in the EMS memory. Check the
EMS-related settings in the CONFIG.SYS file.
Help file not found.
The PT103.HLP file was not found. Place the PT103.HLP file either in the current directory or in the directory specified by the environment variable HELP.
The Emulator is operating abnormally (free-run timer error).
The timer in the in-circuit emulator is not operating properly. If this error occurs,
contact us at the address indicated at the end of this manual.
The Emulator is operating abnormally (profile address latch error).
The profile address latch function (get execution address function) in the in-circuit emulator is not operating properly. If this error occurs, regardless of whether
or not the target system is operating correctly, contact us at the address indicated
at the end of this manual.
The emulator controller power is off.
The in-circuit emulator could not be started up because the emulator controller
power is off. Turn the power adapter on and restart the C source code debugger.
C Source Code Debugger Error Messages
250
The target system power is off.
The target system power is off. Turn the target system on and restart the C source
code debugger. When starting up the C source code debugger without a target
system, use the -NOTARGET option.
The “-NOTARGET” option cannot be specified while a target system is connected.
Only specify the “-NOTARGET” option when using the in-circuit emulator by
itself without connecting a target system. The “-NOTARGET” option cannot be
specified while a target system is connected.
The emulator controller is not outputting any voltage.
The C source code debugger could not be started up because the emulator controller is not outputting any voltage. If this error occurs, contact us at the address
indicated at the end of this manual.
Check for an address conflict, etc., with the interface board.
Check to see whether the interface board address and the address set by the Installer (PINS103.EXE) are the same.
Monitor program loading failed.
The loading of the Monitor program (MON103.EX) failed. There is most likely a
problem either in the hardware or in the Monitor program file.
Monitor program (MON103.EX) not found.
The Monitor program file (MON103.EX), which is needed in order to start up the
C source code debugger, was not found. Copy the MON103.EX file either into
the current directory or into the directory specified by the environment variable
PATH.
Monitor program initialization failed.
The Monitor program was not started up. There is most likely a problem either in
the hardware or in the Monitor program file.
Wrong Monitor program version.
The C source code debugger could not be started up because the Monitor program
is the wrong version. Copy the Monitor program file that is suited to this
Debugger either into the current directory or into the directory specified by the
environment variable PATH.
C Source Code Debugger Error Messages
9. Appendix
251
Overvoltage from the target system was detected.
Turn off all power, eliminate the cause of the problem, and then restart.
Overvoltage from the target system was detected. Turn off all power, and then
check the target system for any problems.
An error occurred in communications between the Emulator and the microcontroller.
An error occurred in communications between the in-circuit emulator and the
microcontroller. Check whether the microcontroller is hung up or if there is a
problem in the target system.
Quit the Debugger.
A problem occurred in the in-circuit emulator, microcontroller, or emulator controller (including cases where the power is off). Quit the Debugger immediately.
Execute the INIT command.
Execute the INIT command to initialize the in-circuit emulator because a problem
occurred in the in-circuit emulator.
Execute the RESET command.
Execute the RESET command to initialize the microcontroller because a problem
occurred in the microcontroller.
Insufficient overlap area.
There is insufficient overlap area (free disk space). Either use the -B option to
reduce the size of the debugging information area or the macro registration area,
or else allocate free space on the disk.
Cannot be used in overlap mode.
An attempt was made to execute a command that cannot be used in overlap mode.
Illegal command name.
The specified command name could not be recognized as a C source code
debugger internal command or as a macro command.
Illegal command format.
The command input format, parameter specification method or number of parameters is incorrect.
C Source Code Debugger Error Messages
252
Illegal parameter.
The parameter specification method or number of parameters is incorrect.
Illegal address specification.
This error occurs when either an address that is not appropriate for the address
input field was input, or the start address and end address are reversed. This error
also occurs when an unregistered symbol name was used.
Illegal data specification.
This error occurs when a value that is not appropriate for the data specification
field (because it is outside of the allowable range, etc.) was specified. This error
also occurs when an unregistered symbol name was used.
Illegal alignment.
This error occurs when the address alignment for the F or S command is not correct (i.e., an odd address was specified for 16-bit data or an address that is not a
multiple of four was specified for 32-bit data).
C equation calculation error.
An error occurred in a C equation calculation in the “?” command or the VAL
command.
C variable not found.
The C variable specified by the “?” command or the VAL command was not
found.
Operators with secondary effects cannot be used.
Operators with secondary effects (=, +=, –=, etc.) cannot be used in the “?” command. Use the VAL command with operators with secondary effects.
A macro cannot be defined within a macro.
Define macro commands at the C source code debugger command level. Macro
commands cannot be defined within a macro command.
A macro cannot be deleted within a macro.
Delete macro commands at the C source code debugger command level. Macro
commands cannot be deleted within a macro command.
C Source Code Debugger Error Messages
9. Appendix
253
Macro name duplicates an internal command.
The macro name that was being defined matches the name of an internal command of the C source code debugger. Use a different macro name.
Insufficient macro registration area.
Either the macro command registration area is full, or else too many macro commands are being defined. Use the -B option to expand the macro command registration area and then start up the C source code debugger.
Macro command definition was not terminated properly. { }
There is an error in the correspondence of the brackets (“{}”) within the macro
command definition.
Macro nesting has exceeded 15 levels.
Macro commands can be nested (i.e., a macro command can be executed from
within a macro command) up to a maximum of 15 levels.
Specified file not found.
The specified file was not found.
Specified file cannot be opened.
The specified file could not be opened. Confirm that the file exists. This error
also occurs if there are too many files open at one time.
File cannot be created.
The file could not be created, either because there is not enough free disk space, or
because there are too many files open at one time. First, confirm the amount of
free disk space; if there is adequate disk space, close any unnecessary files.
Insufficient free disk space.
There is not enough free disk space.
Checksum error.
A loading operation failed because there is a problem in a Motorola S format or
Intel HEX format file.
C Source Code Debugger Error Messages
254
Illegal file format.
Subprocess execution failed because of a problem in the contents of the MS-DOS
command file (execution format: .COM/.EXE).
No debugging information found.
The debugging information was not found when an execution format file
(Matsushita EX format) was loaded with the L command. Compile/assemble the
file with the option that outputs debugging information.
Bad debugging information.
There is a problem in the format of the debugging information. This error should
normally not occur; if it does occur and it is reproducible, contact us at the address
indicated at the end of this manual.
Insufficient debugging information area.
There is no free space in the debugging information area. Use the -B option to
enlarge the debugging information area and then start up the C source code
debugger.
Subprocess not terminated.
When a subprocess has been started up, the C source code debugger cannot be
quit before the subprocess is terminated. Terminate the subprocess first, before
quitting the C source code debugger.
Cannot return to PICE without terminating the subprocess.
(Press the space bar to return to the subprocess.)
It was not possible to return to the C source code debugger because the subprocess
is using too much memory. Terminate the subprocess first, before returning to the
C source code debugger.
Corresponding command does not exist.
The help screen could not be displayed because the specified command does not
exist.
User program cannot be executed because the reset pin is low.
A user program could not be executed because the user reset pin is low. Set the
user reset pin high before executing the user program.
C Source Code Debugger Error Messages
9. Appendix
255
User program cannot be executed.
The user program cannot be executed. Check the target system for any problems.
The stack pointer cannot be set to an address that is not a multiple of four.
The stack pointer must be set to an address that is a multiple of four. This error
occurs if the stack pointer is set to an address that is not a multiple of four and an
attempt is made to execute a user program.
Stack pointer cannot be set to internal ROM area./
Stack pointer cannot be set to special register area./
Stack pointer cannot be set to an unmounted area.
The stack pointer can only be set to internal RAM, external memory, and emulation RAM areas. These errors occur if the stack pointer is set to any other area and
then an attempt is made to execute a user program.
User reset was generated.
This warning message is displayed when a user reset was generated in the target
system.
Data strobe error.
This error is generated when an external bus access in a user program does not
terminate within a certain period of time.
Forced break failed.
Although a forced break was issued, the user program did not terminate. Check
the target system for problems.
User program is running.
This error occurs when an attempt was made to execute a command that does not
have an on-the-fly function while a user program was running.
User program is halted.
The TG and TS commands cannot be executed while the user program is halted.
Tracing is in progress.
The trace results cannot be displayed without halting the tracing operation.
C Source Code Debugger Error Messages
256
Tracing has already been halted.
Because tracing has already been halted, the TS command cannot be used to halt
tracing.
Tracing has not been halted.
Because tracing did not halt even though the trace halt processing was executed,
the trace results cannot be displayed. Because it is likely that there is a problem
with the in-circuit emulator, contact us at the address indicated at the end of this
manual.
Trace contents have been cleared.
If the trace contents have been cleared or if tracing has not been performed even
once since the C source code debugger was started up, the commands that display
the trace results (TD and TDW) cannot be executed.
The delay counter specification is not correct.
An attempt was made to specify a value for the delay counter that was outside of
the permitted range from 257 to 16,384.
Cannot be used after delay trigger has been tripped.
In delay trigger trace mode, tracing cannot be resumed (with the TG command)
once tracing was halted because the conditions were met.
Canceling a trace event.
This warning message indicates that a trace event is being cancelled or disabled.
Event/break cannot be set. (32 maximum)
No more than 32 software breaks and hardware breaks in total can be set.
Software break has already been set at the same address.
A software break has already been set at the specified address. Multiple software
breaks cannot be set at the same address.
Command cannot be registered.
A command could not be registered because there was insufficient area to register
<command> with the BP ~ or /C<command> command.
C Source Code Debugger Error Messages
9. Appendix
257
No further events/breaks can be set.
Up to four execution address events can be set, up to four data events each can be
set in internal data RAM and the external memory space, respectively, and a further 8 events total can be set. These numbers cannot be exceeded. (The same
applies to hardware breaks.)
Event/break was not set.
This error occurs if a nonexistent break number was specified, or if a software
break was specified in a location that calls for a hardware event/break.
Event status does not change.
Hardware events/breaks cannot be set or changed while the microcontroller is in a
state where it does not operate, such as STOP, HALT, or SLEEP.
Could not map to the specified area.
An attempt was made to map emulation memory/extend memory to an area (internal RAM, special register area, etc.) that can not be mapped.
Could not map due to insufficient mapping blocks./
Could not map due to insufficient emulation blocks.
An attempt was made to map in excess of 8 emulation blocks.
Could not map due to insufficient emulation memory.
An attempt was made to map emulation memory in excess of the memory capacity installed in the in-circuit emulator.
Changing mapping addresses to 4KB units.
Although mapping is performed in 4KB units, if the addresses were specified in
other than 4KB units, the C source code debugger adjusts the addresses so that
they are in 4KB units before mapping. This warning message is displayed in such
a case.
Changing time measurement to continuous mode.
This warning message indicates that time measurement was changed to continuous mode because a timer event was cancelled or disabled.
C Source Code Debugger Error Messages
258
Paused time measurement.
Time measurement is paused if a timer event was changed while the user program
was running with time measurement in partial mode. Furthermore, the measured
results up to that point are cleared. This warning message is displayed in such a
case.
Time measurement error occurred.
While the time measurement mode was partial mode, the length of time that the
in-circuit emulator can measure was exceeded.
Time measurement not completed.
While the time measurement mode was partial mode, time measurement was not
completed because a timer event (time measurement start/stop events) did not
occur.
Time measurement events not set.
The time measurement start and stop events were not set when the time measurement mode was set as partial mode (measurement of time from the occurrence of
one event until the occurrence of a different event).
Memory access failed. (timeout)
An emulation memory read or write operation failed. If this error occurs frequently, it is likely that there is a problem with the in-circuit emulator, so contact
us at the address indicated at the end of this manual.
Verify error.
Data was not written to memory properly. This error occurs when data was written to an address in memory that has not been installed, or if a write was made to
write-only I/O, etc.
Cannot write special registers.
A fill and block transfer (F or M command) cannot be made to the special register
area.
Duplicate watch point specification.
A watch point specification with the same contents has already been made.
C Source Code Debugger Error Messages
9. Appendix
259
Watch point cannot be set.
This error occurs when an attempt was made to set more than 16 watch points.
Specified setting does not exist.
The watch point registration that was to be deleted by the Y command does not
exist.
Sampling was not performed.
An attempt was made to display profile results before sampling the execution
status of each function with the profile function.
PICE internal error.
This error message is displayed when an error occurs in the C source code
debugger’s internal processing. This error should normally not occur; if it does
occur and it is reproducible, contact us at the address indicated at the end of this
manual.
C Source Code Debugger Error Messages
260
5
Quick Reference
5-1. Window Commands
■ Screen Control
Switch cursor (command/code)
HOME
Move cursor one character to left
←
(CTRL+S)
Move cursor one character to right
→
(CTRL+D)
Move cursor up one line
↑
(CTRL+E)
Move cursor down one line
↓
(CTRL+X)
Move cursor one word to left
CTRL+A
Move cursor one word to right
CTRL+F
Move cursor to beginning of line
CTRL+Q•S
Move cursor to end of line
CTRL+Q•D
Scroll up one screen
ROLL UP
(CTRL+C)
Scroll down one screen
ROLL DOWN
(CTRL+R)
Move cursor to beginning of text
CTRL+Q•R
Move cursor to end of text
CTRL+Q•C
Enlarge Option window
CTRL+←
Reduce Option window
CTRL+→
Enlarge Command window
CTRL+↑
Reduce Command window
CTRL+↓
Redisplay screen
CTRL+J
Maximize Command window
CTRL+Q•W
Minimize Command window
CTRL+Q•Z
Redisplay screen (and restore window to initial size)
CTRL+Q•J
Display/hide Option window
F2
(CTRL+4)
Switch option window
CTRL+F2
(CTRL+O)
Switch between source and disassembled display
F3
Switch between source and disassembled display
(cursor specification)
CTRL+F3
Quick Reference
9. Appendix
261
■ Execution/Breaks
Execute (Go)
F5
Execute up to cursor position (Come)
F7
Single-step execution (SglStp)
F8
Set/cancel break (software break) (Break)
F9
Function-step execution (FncStp)
F10
Forced break
ESC
Forcibly terminate command
CTRL+SHIFT+GRPH
■ Get/Select Text String
Get text string at cursor position (Get)
CTRL+F9
Select text string according to cursor position (Sel)
CTRL+F10
(CTRL+G)
Local commands for text string selection
Register memo (Memo)
F1~F5,F10
Inspect (Inspct)
F6
(CTRL+I)
(I)
Register watch (Watch)
F7
(CTRL+W)
(W)
Display view (View)
F8
(CTRL+V)
(V)
Get text string (Get)
F9
(CTRL+G)
(G)
■ File-related Commands
Switch source file
SHIFT+HOME
Select file (File)
F1
Search for text string (down↓) (Search)
F4
Input/search for text string (down↓)
CTRL+Q•F
Search for text string (up↑) (Srch↑)
CTRL+F4
Stop search
ESC
(CTRL+L)
(CTRL+B)
Quick Reference
262
■ Process Control
Return to Debugger
CTRL+0
Go to subprocess
CTRL+1
Display/hide Option window
CTRL+4
Display/hide RAM monitor
CTRL+5
■ Shell
Backspace (delete one character)
BS
Move cursor one character to left
←
SHIFT+←
(CTRL+S)
Move cursor one character to right
→
SHIFT+→
(CTRL+D)
Move cursor to beginning of line (Ln Top)
SHIFT+F4
(CTRL+A)
Move cursor to end of line (Ln Bot)
SHIFT+F5
(CTRL+F)
Delete one character at cursor position
DEL
(CTRL+G)
Delete all characters (Ln Can)
SHIFT+F7
(CTRL+U)
Switch between insert mode and replace mode
INS
(CTRL+V)
Display/find last history buffer
SHIFT+↑
(CTRL+W)
Display/find next history buffer
SHIFT+↓
(CTRL+Z)
Copy one character from history buffer (C1)
SHIFT+F1
Display History window (Histry)
SHIFT+F2
Copy from history buffer (CA)
SHIFT+F3
Display Extended Symbol window (ExtSym)
SHIFT+F6
Clear history buffer (All Can)
SHIFT+F8
Quick Reference
(CTRL+H)
SHIFT+→
(CTRL+D)
9. Appendix
263
■ Others
Specify memo text string
CTRL+SHIFT+F1~F10
Display/change option menu (Option)
SHIFT+F10
Interrupt/quit Window command
ESC
Interrupt display, interrupt step execution, etc.
STOP
Pause/resume Command window display
CTRL+S
Echo output to printer
CTRL+P
Display help
HELP
(CTRL+C)
■ Referencing/changing data
Inspect variables (Inspct)
F6
(CTRL+I)
Local commands for Inspection
Zoom in/out (Zoom)
F4
Change base (16<>10)
F5
Inspect (Inspct)
F6
(CTRL+I)
(I)
Register watch (Watch)
F7
(CTRL+W)
(W)
Display view (View)
F8
(CTRL+V)
(V)
Specify array range (Range)
F9
(R)
Change value (Change)
F10
(C)
Register variable watch (Watch)
CTRL+F7
(CTRL+W)
Display variable view (View)
CTRL+F8
(CTRL+V)
Quick Reference
264
5-2. Dialog Commands
■ Loading Programs
L [<file name>]
Loads both the program that is to be debugged and the debugging information for that program.
LP [<file name>]
Loads just the program that is to be debugged.
■ Reading/Writing Files
RD<file name>[,<address>]
Loads the specified file at the specified address.
WR<file name>,<address S>,<address E>
Writes the contents of memory in the specified range of addresses to the specified file.
■ Running Programs
T [<count>]
Runs a program under single-step execution. (F8)
P [<count>]
Runs a program under function-step execution. (F10)
G [=<address S>][,<address B>][,/W]
Runs a user program. (F5, F7)
/W :
RESET
Runs a user program, with the on-the-fly functions
disabled.
Resets the microprocessor.
■ Breaks/Events
EV<address S>[~<addressE>][,<status>][,<data>[,{/B|/W|/D}][,/N]][,/<count>]
Sets an event.
<status>
EX
: Execution address event
RW
: A data event is generated upon a read or write
operation
R
W
: A data event is generated upon a read operation
: A data event is generated upon a write
operation
Omitted : If <data> is specified, RW (a data event is
generated upon a read or write operation) is
assumed. If <data> is not specified, EX
(execution address event) is assumed.
<access width>
Specifies the data access width for a data event.
/B
: An event is generated upon a 8-bit data access
/W
: An event is generated upon a 16-bit data access
/D
: An event is generated upon a 32-bit data access
Omitted : Access width does not matter
Quick Reference
9. Appendix
/N
265
An event is generated when the data does not match <data>.
EV /C {<list|*>}
When the specified event is generated, all event generation flags
and counters are cleared.
EV
Displays the events that have been set.
BP <address S>[~<address E>][,<status>][,<data>[,{/B|/W|/D}] [,/N]][,/<count>]
[,/C<command>]
Sets a break event. (F9)
<status>
EX
: Execution address break
RW
: A data break is generated upon a read or write
operation
R
: A data break is generated upon a read operation
W
: A data break is generated upon a write operation
Omitted : If <data> is specified, RW is assumed. If <data> is not
specified, and <address E> or <count> is specified,
EX is assumed. Otherwise, a software break is
assumed.
<access width>
Specifies the data access width for a data break.
/B
: A break is generated upon an 8-bit data access
/W
: A break is generated upon a 16-bit data access
/D
: A break is generated upon a 32-bit data access
Omitted : Access width does not matter
/N
A break is generated when the data does not match <data>.
/C <command> Executes <command> automatically after the break.
BP
Displays the breaks that have been set.
BPA <list>
Sets the break events specified in the list as AND breaks.
BPS <list>
Sets the break events specified in the list as sequential breaks.
BC/EC {<list>|*} Cancels the break events specified in the list.
BD {<list>|*}
Temporarily disables the break events specified in the list.
BE {<list>|*}
Enables the break events specified in the list.
■ Hardware-related
TM [<mode>][{/B|/C|/S|/T[<count>],<event number>}]
Sets the trace mode.
<mode>
INT
: Internal RAM bus (default)
EXT
: Extended RAM bus
ALL
: Normal trace mode (default)
JMP
: Branch trace mode
<event number> : Event conditional trace mode
Quick Reference
266
/B
Breaks when the trace memory becomes full.
/C
/S
Tracing continues until program execution is halted.
Only tracing halts when the trace memory becomes full.
(User program execution does not halt.)
/T [<count>],<event number>
After the event condition specified by <event number> has
been met the number of times specified by <count>, tracing
halts.
TM /F
Sets the default trace mode (INT,ALL,/C)
TM
Displays the current trace mode settings.
TG
Resumes tracing.
TS
Halts tracing.
TD
Displays the contents of trace memory (as a hex dump).
TDU
Displays the disassembled contents of trace memory.
Subcommands for trace display mode:
[-]B
Displays the top (bottom) of trace memory.
P <pages>
Moves the display start frame the number of pages specified
by <pages>, and then displays one page.
N <frame address>
Sets the display start frame to <frame address>.
D [<frame address S>][<frame address E>]
Displays the contents of the range of frames in hexadecimal.
L [<frame address S>][<frame address E>]
Displays the disassembled contents of the range of frames.
C
Hides frames labelled with “:”. Executing this command
displays frames labelled with “:” again.
Q/.
Terminates trace display mode.
TDW
Displays the contents of trace memory in window mode.
TI [<mode>]
<mode>
Sets the timer mode.
RUN
: Measures the time from the start of program
execution until it halts.
FIRST
: Measures the time between events once.
/S<event number>
MIN/MAX : Continuously measures the time between
events, and determines the maximum and
minimum times.
Specifies the event at which time measurement is to start.
/E<event number>
Specifies the event at which time measurement is to end.
TI <clock>
<clock>
Sets the timer clock.
/T1 : 25ns resolution
/T2 : 50ns resolution
/T4 : 100ns resolution
/M : Microprocessor clock
Quick Reference
9. Appendix
267
TI STOP
Cancels timer mode.
TI
Displays the current timer mode and the timer value.
TRIG OUT <data>
Outputs the 8-bit port data <data>.
TRIG RAM <address>
Outputs the contents of <address> when the microprocessor
accesses <address>.
TRIG EVENT
Outputs the event status.
TRIG
Displays the trigger outputs that are currently set.
MAPI/EXI <address S>,<address E>[,{/F|/S}]
Allocates memory to emulation RAM.
/F
Fast emulation RAM
/S
Slow emulation RAM
MAPE/EXE <address S>,<address E>
MAP/EX
Allocates memory to a resource in the user target.
Displays the memory allocation settings.
■ Measuring Performance
SM [<address>]
Specifies the starting address of the sample area.
SMB [<address>]
SMC <number>
SMW
SM
Specifies the address to be displayed at the bit level.
Clears the address to be displayed at the bit level.
Displays the RAM monitor screen.
Displays the current sample area.
PROF [<mode>]
Tabulates the subroutine access status. (Profile function)
<mode>
ON : Profile ON
OFF : Profile OFF
CLR : Clears the profile results.
PROF
Displays the profile results.
Quick Reference
268
■ Memory
D [<type>][<address S>,<address E>][,<count>][,<base>]
Displays the contents of memory from <address S> to
<address E> in the specified base.
<type>
B : Byte (8 bits) display
W : Word (16 bits) display
D : Double-word (32 bits) display
S : 4-byte real number (short floating point) display
L : 8-byte real number (long floating point) display
A : ASCII display
<base>
/H : Hexadecimal display specification
/D : Decimal display specification
/O : Octal display specification
E [<type>][<address>][<data>]
Changes the contents of memory, starting from the specified
address, to the format specified by <type>.
<type>
B : Changes format to byte (8 bits) format.
W : Changes format to word (16 bits) format.
D : Changes format to double-word (32 bits) format.
S : Changes format to 4-byte real number (short
floating point) format.
C <address S>,<address E>,<address D>
Compares the contents of memory extending from <address
S> to <address E> with the contents of memory starting at
<address D>.
F [<type>]<address S>,<address E>,<data>
Fills the specified range of addresses with the value <data>
in the format specified by <type>.
<type>
B : Byte (8 bits) fill
W : Word (16 bits) fill
D : Double-word (32 bits) fill
M <address S>,<address E>,<address D>
Transfers the memory block extending from <address S> to
<address E> to the position in memory starting at <address
D>.
S [<type>]<address S>,<address E>,<target pattern>
Displays the memory addresses within the range of addresses whose contents match <target pattern>.
<type>
B : Byte (8 bits) search
W : Word (16 bits) search
D : Double-word (32 bits) search
Quick Reference
9. Appendix
269
■ Registers
R
Displays the contents of all flags and registers in
hexadecimal.
R <register name>
Changes the contents of <register name>/<flag name>.
<register>+REG=<value>
Changes the value of the specified register.
<flag>+FLG=<value>
Changes the value of the specified flag.
■ Displaying Expressions
H <expression>
Displays the value of <expression> in octal, decimal, hexadecimal and ASCII.
H <expression 1>,<expression 2>
Displays the sum and difference of <expression 1> and
<expression 2>.
PRINTF/PF <format>[,<parameter>]
Displays in the same format as the “printf” function in C.
■ Symbols
X <symbol name>
Displays <symbol name>. (All symbols are displayed if
none is specified.)
[.]<symbol name>=<address>
Sets (registers) the immediate value <address> in <symbol
name>.
[.]<symbol name>=*
Deletes <symbol name> from the symbol table.
■ Displaying Code
V[.][<file name>:][<line>]
Displays the specified line of the specified file in the Code
window.
V <symbol name>
Displays the source file for the specified symbol in the Code
window.
U [<address>]
Displays disassembled code starting from the specified address in the Code window.
Pushes the currently displayed address onto the address
stack and then displays disassembled code starting from the
specified address in the Code window.
Displays disassembled code starting from the last address
that was UPUSHed, and pops the address from the address
stack.
UPUSH [<address>]
UPOP
UEND
Displays disassembled code starting from the last address
that was UPUSHed.
UX [<address S>]
[,<address E>]
K
Displays disassembled code starting from the specified address in the Command window.
Function backtrace
Quick Reference
270
■ Assembly
A [<address>]
Assembles code starting from the specified address and
expands it directly in memory.
■ Referencing/Changing C Data
INS <variable name>[,<function name>]
Displays (inspects) the variable, array, etc., specified by
variable name.
W [<type>]<address>[,<count>][,<base>]
Registers an address for watching.
<type>
B : Byte (8 bits) display
W : Word (16 bits) display
D : Double-word (32 bits) display
A : ASCII display (units of 8 bits)
S : 4-byte real number (short floating point) display
<base>
/H : Hexadecimal display specification
/D : Decimal display specification
/O : Octal display specification
W? <C expression>
Registers the C expression display for watching.
VAL/? <C expression>[,<function name>]
Evaluates and displays the C expression.
Y {<list>|*}
Deletes the watch registrations specified by the list.
Q/EXIT
Quits the C source code debugger.
HELP
Displays the Help screen.
!<command>
!!
!<character string>
Executes <command>.
Displays history.
Searches for the history indicated by <character string>
■ System
■ Screen Control/Miscellaneous
CLS
Clears the Command window.
HOME
Moves the Command window cursor to the Home position.
LIST
Command window display output specification
NLIST
Command window display output suppression specification
BEL
TIME
Rings the bell.
Displays the current time (HH:MM:SS).
WAIT
PRMPT <prompt character>
*
Pauses the system.
Changes the system prompt to the specified character.
Comment line specification
Quick Reference
9. Appendix
271
■ Log Output/Batch Processing
> <file name>
Outputs the Command window display/input log to the
specified file. (Log Output function)
>> <file name>
Appends log output to the specified file.
>
Halts log output (closes the log file).
<<file name>
Reads Command window input from a file (batch function).
Batch processing can be interrupted by the ESC key.
■ Memo
MEM <number>[,<character string>]
Registers the character string in the memo indicated by
<number>.
MEM *
Deletes all memos that are currently registered.
MEM
Displays the contents of all memos that are currently
registered.
N {10|16}
Changes the input base to either decimal or hexadecimal.
■ Changing Base
■ Setting Options
OPTION <reg>[,<code>[,<case>]]
Sets various options. (SHIFT+F10)
<reg>
{ON|OFF}
<code>
{SRC|ASM} : Switches the Code window between
source and disassembled code.
{ON|OFF} : Controls discrimination between upperand lower-case characters in symbol
names.
<case>
: Suppresses Register window display.
Quick Reference
272
■ Macro Commands
{<macro name><macro body>}
Defines the macro body for a macro name.
DO {<macro body>} WHILE <expression>
A macro command similar to the “do...while” statement in
C.
FOR {<command 1>,<expression>,<command 2><macro body>}
A macro command similar to the “for” statement in C.
WHILE {<expression><macro body>}
A macro command similar to the “while” statement in C.
REPEAT {<parameter list><macro body>}
Repeat macro command.
BREAK
Exits the macro.
LALL
SALL
Display output specification in a macro.
Display output suppression specification in a macro.
MLIST<macro name>
Displays <macro name>.
MLIST ><file name>
Writes all macros that are currently defined to the specified
file.
KILL <macro name>
Deletes <macro name>.
IF {<expression><command>[} ELSEIF {<expression>]<command>[} ELSE {]<command>}
KEYIN
Conditional control command similar to the “if, elseif, else”
statement in C.
Instructs that the next line is to be input from the keyboard.
<{file name}
Loads a macro from the specified macro file.
■ Special Symbols
__ERR__
“1” when the previously executed command generated an
error, “0” when the command was executed normally.
__RUN__
“1” while a user program is running, “0” otherwise.
__DEBINF__
Special debugger symbol that is used delete all symbols.
Quick Reference
9. Appendix
6
273
Supplement for the PC/AT (DOS/V) Version
This section explains the differences in keyboard functions when using the PC/
AT (DOS/V) version of the C Source Code Debugger, as compared to those of the
PC-9800 Series version.
* The key combinations shown in parentheses are those used in the PC-9800 Series.
6-1. Screen Operations
PageUp / Ctrl + C
(RollUp / Ctrl + C)
[☞ p67]
When the cursor is located in the Code window, pressing these keys scrolls the
PageDown / Ctrl + R
(RollDown / Ctrl + R)
[☞ p67 ]
When the cursor is located in the Code window, pressing these keys scrolls the
Alt + F1
(Ctrl+ ← )
[☞ p68 ]
Pressing these keys enlarges the Option window. In other words, the vertical
Alt + F2
(Ctrl + → )
[☞ P 68 )
Pressing these keys reduces the Option window. In other words, the vertical divi-
Alt + F3
(Ctrl + ↑ )
[☞ P68 ]
Pressing these keys enlarges the Command window (and reduces the Code win-
contents of the Code window up one screen. (Applies to both C source code
display and disassembled code display.)
contents of the Code window down one screen. (Applies to both C source code
display and disassembled code display.)
division between the Option window and the Command/Code window moves to
the left.
sion between the Option window and the Command/Code window moves to the
right.
dow). In other words, the division between the Command window and the Code
window moves up one line.
Pressing these keys reduces the Command window (and enlarges the Code winAlt + F4
(Ctrl + ↓ )
[p68 ]
dow). In other words, the division between the Command window and the Code
window moves down one line.
Supplement for the PC/AT (DOS/V) Version
274
6-2. Data Change/Reference Commands
Local commands within the Inspect window
PageUp / Ctrl + R
(RollUp / Ctrl + R)
[☞ p89]
PageDown / Ctrl + C
(RollDown / Ctrl + C)
[☞ p89 ]
Pressing these keys moves the displayed item up one item.
Pressing these keys moves the displayed item down one item.
6-3. Process Control Commands
Ctrl + Pause /
Ctrl + Break
(Ctrl + 0)
[☞ p77 ]
Ctrl + 1(ten-key pad)
Alt + 1
(Ctrl + 1 )
[☞ P 77 )
Pressing these keys while a subprocess is being executed pauses (halts) the subprocess and returns control to the C Source Code Debugger.
Pressing these keys while a subprocess is paused pauses (halts) the C Source
Code Debugger and passes control to the subprocess.
Ctrl+ 4(ten-key pad)
Alt + 4
(Ctrl + 4 )
[☞ P77 ]
These keys are used to hide and display the Register window and the Option window. If the Register window and Option window are not currently displayed,
pressing these keys displays the windows. If the windows are currently displayed, pressing these keys hides the windows. (These keys function in the same
manner as the F2 key.)
Alt + 5
(Ctrl + 5 )
[☞ p77 ]
Pressing these keys switches to the RAM monitor display. To return to the
Debugger screen display, press “Alt+5” again.
Supplement for the PC/AT (DOS/V) Version
9. Appendix
275
6-4. Shell Commands
Key operations for the History window and the Extended Symbol window
PageUp / Ctrl + R
(RollDown / Ctrl + R)
[☞ p80]
Pressing these keys scrolls the displayed items up one page.
PageDown / Ctrl + C
(RollUp / Ctrl + C)
[☞ p80 ]
Pressing these keys scrolls the displayed items down one page.
6-5. Other Window Commands
End
(Help)
[ ☞ p83 ]
Pressing this key saves the debugging screen and displays help. When this key is
pressed, help for the last dialog command is displayed. For example, if this key is
pressed after there was an input error in a dialog command, the help screen for the
dialog command in question is displayed. In addition, if this key is pressed during
an Inspect operation or during character string selection (Sel), help is displayed
for the various local commands. To close the help screen, press the ESC key.
[
Ctrl + Shift + Alt
(Ctrl + Shift + Grph)
[☞ P 71 )
☞HELP command]
If the microprocessor is hung up for some reason and the command that was input
will not terminate, press these keys in order to forcibly terminate the command.
Supplement for the PC/AT (DOS/V) Version
276
Index
Symbols
Alphabetic
278
Index
Break Point Control commands
Symbols
BC/EC command ---------------------------------- 133
BD command --------------------------------------- 137
BE command --------------------------------------- 139
! command
History function command ----------------------- 205
BP command ---------------------------------------- 130
Subprocess startup command -------------------- 203
BPA command ------------------------------------- 133
!! command (History function) ----------------------- 205
BPS command -------------------------------------- 134
* command (comment) -------------------------------- 212
Break Program -------------------------------------------- 45
.
Break source ---------------------------------------------- 64
Breaks
command (register/change/delete symbol) ----- 184
< command (batch processing) ----------------------- 214
> command (log output) ------------------------------- 213
Cancel command (BC/EC) ----------------------- 136
? command (evaluate C expression) ----------------- 197
Disable command (BD) --------------------------- 137
__DEBINF__ ------------------------------------------- 184
Enable command (BE) ---------------------------- 139
__ERR__ -------------------------------------------------- 99
Set AND Break command (BPA) --------------- 133
__RUN__ -------------------------------------------------- 99
Set Sequential Break command (BPS) ---------- 134
Set/Display command (BP) ----------------------- 130
Alphabetic
C
A
C (Compare Memory) command -------------------- 171
C Source Code Debugger --------------------------- 36,53
A (Assemble) command ------------------------------- 190
C Source Code Debugger Floppy Disk --------------- 20
Access status tabulation command (PROF) -------- 164
C source code display ----------------------------------- 43
Assemble command (A) ------------------------------- 190
CLS (Clear Screen) command ------------------------ 208
Cancel all break events ---------------------------------- 46
B
Cancel break ---------------------------------------------- 45
Cancel event command (EC) ------------------------- 136
BC (Cancel Break) command ------------------------ 136
Change Base command (N) --------------------------- 216
BD (Disable Break) command ----------------------- 137
Change Memory command (E) ---------------------- 169
BE (Enable Break) command ------------------------ 139
Change Prompt command (PRMPT) ---------------- 211
BEL (Bell) command ---------------------------------- 210
Character Strings
BP (Set/Display Break) command ------------------- 130
BPA (Set AND Break) command -------------------- 133
BPS (Set Sequential Break) command -------------- 134
Values that can be handled by the C Source
Code Debugger ------------------------------------- 100
Clear Screen command (CLS) ------------------------ 208
BREAK (Exit Macro) command --------------------- 231
Code window --------------------------------------------- 62
Backtrace command (K) ------------------------------ 191
Command input format ---------------------------------- 96
Batch command (<) ------------------------------------ 214
Command window --------------------------------------- 62
Bell command (BEL) ---------------------------------- 210
Comment command (*) ------------------------------- 212
Binary operator ----------------------------------------- 104
Compare Memory command (C) -------------------- 171
Cursor Home command (HOME) ------------------- 208
Symbols/Alphabetic
9. Appendix
279
Display/Change Registers command (R) ----------- 177
D
D (Display Memory) command ---------------------- 167
DIP switches -------------------------------------- 243-247
DO{}WHILE
(Execute “do...while” Macro) command ----------- 227
Data Reference function----------------------------- 84-94
Default extension specification, startup option (-E) 58
Delete Watch command (Y) -------------------------- 199
Delete all in watch window ----------------------------- 48
Device Connection Procedure -------------------------- 25
Dialog command ----------------------------------- 95-218
Disassembled code display ----------------------------- 43
Display Disassembled Code command (U) -------- 188
E
E (Change Memory) command ---------------------- 169
EC (Cancel Break Event) command ----------------- 136
EV (Set event) command ----------------------------- 127
EX (Allocate Memory) command ------------------- 158
EXIT (Exit) command --------------------------------- 201
Electrical Specifications -------------------------- 241,248
Environment Specifications --------------------- 241,248
Environment Variables
HELP -------------------------------------------- 25,202
PANASRC --------------------------------- 24,114,187
Display Expression command (H) ------------------- 179
PATH -------------------------------------------------- 25
Display Format commands
PF 180
PRINTF---------------------------------------------- 180
Display Help command
HELP ------------------------------------------------ 202
TMP/TEMP ------------------------------------------- 25
Error Messages ----------------------------------------- 249
Execute Program commands
G command ----------------------------------------- 121
P command ------------------------------------------ 119
Display Memory command (D) ---------------------- 167
Display Output Specification command (LIST) --- 209
Display Output Suppression Specification
command (NLIST) ------------------------------------- 209
T command ----------------------------------------- 117
Execution -------------------------------------------------- 70
External dimensions ----------------------------------- 241
Display Source Line command (V) ------------------ 187
Display Time command (TIME) --------------------- 210
F
Display Trace Dump Window command (TDW) - 151
Display Watch command
F (Fill Memory) command ---------------------------- 172
W command ---------------------------------------- 195
FOR {} (Execute “for...” Macro) command ------- 228
Display/Change Data commands
. command ---------------------------------------- 184
File selection ----------------------------------------- 42, 43
File selection window display -------------------------- 42
A command ----------------------------------------- 190
Fill Memory command (F) ---------------------------- 172
C command ----------------------------------------- 171
Flat cable -------------------------------------------------- 18
D command ----------------------------------------- 167
Flow of debugging operations -------------------------- 33
E command ----------------------------------------- 169
Forced termination --------------------------------------- 83
F command ------------------------------------------ 172
H command ----------------------------------------- 179
Function key ---------------------------------------------- 82
Function-step execution --------------------------------- 44
M command ----------------------------------------- 174
Function-step execution command (P) -------------- 119
PF command ---------------------------------------- 180
PRINTF command --------------------------------- 180
R command ----------------------------------------- 177
G
S command ------------------------------------------ 175
U command ----------------------------------------- 188
G (Go) command --------------------------------------- 121
V command ----------------------------------------- 187
Go to Editor Screen -------------------------------------- 50
Go command (G) --------------------------------------- 121
X command ----------------------------------------- 182
Alphabetic
280
H
L
H (Display Expression) command ------------------- 179
L/LP (Load Program) command --------------------- 114
HELP (Display Help) command --------------------- 202
LALL (Output Macro Display) command ---------- 232
HELP (environment variable) ------------------------ 202
LIST (Display Output Specification) command --- 209
HOME (Cursor Home) command ------------------- 208
Hardware List --------------------------------------------- 18
Load Program --------------------------------------------- 40
Load Program command ------------------------------ 112
Hardware break ----------------------------------------- 125
L/LP command ------------------------------------- 114
Hardware-related commands
RD command --------------------------------------- 115
MAP/EX command -------------------------------- 158
WR command -------------------------------------- 116
TD/TDU command -------------------------------- 148
TDW command ------------------------------------ 151
TG command --------------------------------------- 146
M
TI command ---------------------------------------- 153
M (Transfer Memory) command--------------------- 174
TM command --------------------------------------- 142
MAP/EX (Allocate Memory) command ------------ 158
TRIG command ------------------------------------ 156
MEM (Memo) command ------------------------------ 215
TS command ---------------------------------------- 147
MLIST (Display Registered Macros) command --- 234
Help
Display Help window ------------------------------- 38
Macro ------------------------------------------------------ 51
Macro command execution ----------------------------- 51
Hide Help window ----------------------------------- 39
Delete Registered Macros command (KILL) -- 235
History function commands
Display Registered Macros
! ------------------------------------------------------- 205
command (MLIST) -------------------------------- 234
!! ------------------------------------------------------ 205
Keyboard Input command (KEYIN) ------------ 237
Macro Break command (BREAK) -------------- 231
Host computer settings ---------------------------------- 25
Macro Conditional Execution
command (IF{}) ------------------------------------ 236
I
Macro Display Output Suppression
IF {}
command (SALL) ---------------------------------- 233
(Conditional Execution of Macro) command ------ 236
INS (Inspect) command ------------------------------- 193
Macro Display Output command (LALL) ----- 232
Repeat Macro Execution
In-circuit Emulator ------------------------------- 16,18,19
command (REPEAT{}) --------------------------- 230
Indicator disabled specification (-N),
“do...while” Macro Execution
startup options -------------------------------------------- 56
command (DO{}WHILE) ------------------------ 227
Inspect command (INS) ------------------------------- 193
“for...” Macro Execution command (FOR{}) - 228
Inspect function ------------------------------------------- 84
Interface board -------------------------------------- 18,243
“while...” Macro Execution
Installation -------------------------------------------- 22
command (WHILE{}) ------------------------ 229
Measure Execution Time command (TI) ----------- 153
Memo ------------------------------------------------------ 82
Memo command (MEM) ------------------------------ 215
K
Memo window -------------------------------------------- 64
K (Backtrace) command ------------------------------ 191
KEYIN (Keyboard Input) command ---------------- 237
Display ------------------------------------------------ 41
Hide ---------------------------------------------------- 41
KILL (Delete Registered Macro) command ------- 235
Memory allocation (MAP/EX) ----------------------- 158
Monadic operator--------------------------------------- 104
Alphabetic
9. Appendix
Move cursor between windows ------------------------ 42
281
REPEAT {}
(Repeat Macro Execution) command --------------- 230
N
RESET (Reset User CPU) command --------------- 123
Read File/Program command (RD) ----------------- 115
N (Change Base) command --------------------------- 216
Real-time Trace Display command (TD/TDU) ---- 148
NLIST (Display Output Specification) command - 209
Reference memory --------------------------------------- 47
Register Watch command (W) ----------------------- 195
Register window ------------------------------------------ 63
O
OPTION (Set Options) command ------------------- 217
On-the-fly functions --------------------------------- 11,16
Operating environment ----------------------------------- 2
Operations ----------------------------------------------- 104
Display ------------------------------------------------ 41
Hide ---------------------------------------------------- 41
Reset command (RESET) ----------------------------- 123
S
Option window ------------------------------------------- 64
Output Log command (>) ----------------------------- 213
S (Search Memory) command ------------------------ 175
Overcurrent prevention -------------------------------- 243
SALL
(Macro Display Output Suppression) command --- 233
P
P (Function-step Execution) command ------------- 119
PANASRC (Environment Variable) ------- 25,114,187
PATH (Environment Variable) ------------------------ 25
PF (Format Display) command ---------------------- 180
PRINTF (Format Display) command --------------- 180
PRMPT (Change Prompt) command ---------------- 211
PROF (Access Status Tabulation) command ------ 164
Pause command (WAIT) ------------------------------ 211
Power ON/OFF ------------------------------------------- 29
Process control -------------------------------------------- 77
Profile function ------------------------------------- 11,164
Program execution --------------------------------------- 44
SM (Set/Cancel Sample Area) command ----------- 161
Screen control --------------------------------------------- 66
Scrolling --------------------------------------------------- 42
Search Memory command (S) ------------------------ 175
Set Option command (OPTION)--------------------- 217
Set break --------------------------------------------------- 45
Set event command (EV) ----------------------------- 127
Set/Cancel Sample Area command (SM) ----------- 161
Set/Display Trigger command (TRIG) -------------- 156
Shell function --------------------------------------------- 78
Single-step execution ------------------------------------ 44
Single-step execution command (T) ----------------- 117
Size specification (-B), startup options --------------- 56
Software break ------------------------------------------ 125
Special symbols ------------------------------------------ 99
Stack window --------------------------------------------- 64
Q
Display ------------------------------------------------ 41
Q/EXIT (Exit) command ------------------------------ 201
Hide ---------------------------------------------------- 41
Start Trace command (TG) --------------------------- 146
Quit command (Q/EXIT) ----------------------------- 201
Startup ----------------------------------------------------- 56
Quitting the C Source Code Debugger ---------------- 52
Status display area --------------------------------------- 64
Stop Trace command (TS) ---------------------------- 147
R
Structure and union inspection ------------------------- 88
R (Display/Change Register Value) command ---- 177
Subprocess ------------------------------------------------ 49
Return from subprocess ----------------------------- 50
RAM Monitor --------------------------------------------- 77
Startup ------------------------------------------------- 49
RD (Fail/Program Read) command ----------------- 115
Startup command (!) ------------------------------- 203
Alphabetic
282
Supplied power ----------------------------------------- 241
Values that can be handled by the C Source Code
Symbols
Display command (X) ----------------------------- 182
Debugger in register names --------------------------- 100
View function --------------------------------------------- 93
Register/Change/Delete command (.) ----------- 184
Symbols handled
by the C Source Code Debugger ------------------- 97
W
System Control commands
W (Watch Registration) command ------------------ 195
! command ---------------------------------------- 203-205
!! command --------------------------------------------- 205
WAIT (Pause) command ------------------------------ 211
? command ---------------------------------------------- 197
(Execute “while...” Macro) command -------------- 229
HELP command ---------------------------------------- 202
WR (Write File/Program) command ---------------- 116
Q command --------------------------------------------- 201
Watch Window ------------------------------------------- 64
Watch function ------------------------------------------- 92
WHILE {}
Window ---------------------------------------------------- 32
T
Window command ----------------------------- 66-83,256
T (Single-step Execution) command ---------------- 117
Window display -------------------------------------- 62-65
TD/TDU (Real-time Trace Execution) command - 148
Write File/Program command (WR) ---------------- 116
TDW (Trace Dump Window Display) command - 151
TG (Trace Start) command1 -------------------------- 146
TI (Timer) command ---------------------------------- 153
TIME (Time Measurement) command -------------- 210
X
X (Display Symbol) command ----------------------- 182
TM (Set/Display Trace) command ------------------ 142
TMP/TEMP (environment variable) ------------------ 25
TRIG (trigger setting/display) command ----------- 156
TS (Halt Trace) command ---------------------------- 147
Target interface ----------------------------------------- 242
Timer command (TI) ---------------------------------- 153
Title display ----------------------------------------------- 65
Trace Memory command (TM) ---------------------- 142
Transfer Memory command (M)--------------------- 174
U
U (Disassembled Code Display) command -------- 188
V
V (Display Source Line) command ------------------ 187
VAL/? (Evaluate C expression) command --------- 197
Values that can be handled as addresses
by the C Source Code Debugger --------------------- 100
Values that can be handled as line numbers
by the C Source Code Debugger --------------------- 101
Alphabetic
Y
Y (Delete Watch) command -------------------------- 199
MN10300 Series
C Source Code Debugger User's Manual
March, 2000 2nd Edition 2nd Printing
Issued by Matsushita Electric Industrial Co., Ltd.
© Matsushita Electric Industrial Co., Ltd.
Semiconductor Company, Matsushita Electronics Corporation
Nagaokakyo, Kyoto, 617-8520 Japan
Tel: (075) 951-8151
http://www.mec.panasonic.co.jp
SALES OFFICES
■ U.S.A. SALES OFFICE
Panasonic Industrial Company
[PIC]
● New Jersey Office:
2 Panasonic Way, Secaucus, New Jersey 07094
Tel: 201-392-6173
Fax: 201-392-4652
● Milpitas Office:
1600 McCandless Drive, Milpitas, California 95035
Tel: 408-945-5630
Fax: 408-946-9063
● Chicago Office:
1707 N. Randall Road, Elgin, Illinois 60123-7847
Tel: 847-468-5829
Fax: 847-468-5725
● Atlanta Office:
1225 Northbrook Parkway, Suite 1-151,
Suwanee, Georgia 30174
Tel: 770-338-6940
Fax: 770-338-6849
● San Diego Office:
9444 Balboa Avenue, Suite 185
San Diego, California 92123
Tel: 619-503-2940
Fax: 619-715-5545
■ CANADA SALES OFFICE
Panasonic Canada Inc.
[PCI]
5700 Ambler Drive Mississauga, Ontario, L4W 2T3
Tel: 905-624-5010
Fax: 905-624-9880
■ GERMANY SALES OFFICE
Panasonic Industrial Europe G.m.b.H.
● Munich Office:
Hans-Pinsel-Strasse 2 85540 Haar
Tel: 89-46159-156
Fax: 89-46159-195
[PIEG]
■ U.K. SALES OFFICE
Panasonic Industrial Europe Ltd.
[PIEL]
● Electric component Group:
Willoughby Road, Bracknell, Berkshire RG12 8FP
Tel: 1344-85-3773
Fax: 1344-85-3853
■ FRANCE SALES OFFICE
Panasonic Industrial Europe G.m.b.H.
● Paris Office:
270, Avenue de President Wilson
93218 La Plaine Saint-Denis Cedex
Tel: 14946-4413
Fax: 14946-0007
[PIEG]
[PIEG]
■ HONG KONG SALES OFFICE
Panasonic Shun Hing Industrial Sales (Hong Kong)
Co., Ltd.
[PSI(HK)]
11/F, Great Eagle Centre, 23 Harbour Road,
Wanchai, Hong Kong.
Tel: 2529-7322
Fax: 2865-3697
Matsushita Electronics Corporation 2000
Panasonic Industrial Sales Taiwan Co.,Ltd.
[PIST]
● Head Office:
6th Floor, Tai Ping & First Building No.550. Sec.4,
Chung Hsiao E. Rd. Taipei 10516
Tel: 2-2757-1900
Fax: 2-2757-1906
● Kaohsiung Office:
6th Floor, Hsien 1st Road Kaohsiung
Tel: 7-223-5815
Fax: 7-224-8362
■ SINGAPORE SALES OFFICE
Panasonic Semiconductor of South Asia
300 Beach Road # 16-01
The Concourse Singapore 199555
Tel: 390-3688
Fax: 390-3689
[PSSA]
■ MALAYSIA SALES OFFICE
Panasonic Industrial Company (Malaysia) Sdn. Bhd.
● Head Office:
[PICM]
Tingkat 16B Menara PKNS PJ No.17,Jalan Yong
Shook Lin 46050 Petaling Jaya Selangor Darul Ehsan
Malaysia
Tel: 03-7516606
Fax: 03-7516666
● Penang Office:
Suite 20-17,MWE PLAZA No.8,Lebuh Farquhar,10200
Penang Malaysia
Tel: 04-2625550
Fax: 04-2619989
● Johore Sales Office:
39-01 Jaran Sri Perkasa 2/1,Taman Tampoi
Utama,Tampoi 81200 Johor Bahru,Johor Malaysia
Tel: 07-241-3822
Fax: 07-241-3996
■ CHINA SALES OFFICE
Panasonic SH Industrial Sales (Shenzhen)
Co., Ltd.
[PSI(SZ)]
7A-107, International Business & Exhibition Centre,
Futian Free Trade Zone, Shenzhen 518048
Tel: 755-359-8500
Fax: 755-359-8516
Panasonic Industrial (Shanghai) Co., Ltd.
[PICS]
1F, Block A, Development Mansion, 51 Ri Jing Street,
Wai Gao Qiao Free Trade Zone, Shanghai 200137
Tel: 21-5866-6114
Fax: 21-5866-8000
■ THAILAND SALES OFFICE
■ ITALY SALES OFFICE
Panasonic Industrial Europe G.m.b.H.
● Milano Office:
Via Lucini N19, 20125 Milano
Tel: 2678-8266
Fax: 2668-8207
■ TAIWAN SALES OFFICE
Panasonic Industrial (Thailand) Ltd.
[PICT]
252/133 Muang Thai-Phatra Complex Building,31st
Fl.Rachadaphisek Rd.,Huaykwang,Bangkok 10320
Tel: 02-6933407
Fax: 02-6933423
■ PHILIPPINES SALES OFFICE
National Panasonic Sales Philippines
[NPP]
102 Laguna Boulevard Laguna Technopark Sta.
Rosa. Laguna 4026 Philippines
Tel: 02-520-3150
Fax: 02-843-2778
181199
Printed in JAPAN