1
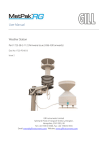
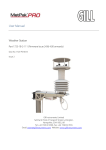
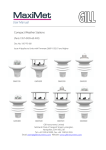
USER’S MANUAL
ENVIROTECH INSTRUMENTS PVT. LTD
A-271, Okhla Industrial Area, Phase I, New Delhi 110 020
Phone: 91 11 2681 3887, 4139 Fax: 91 11 26811833 Email: [email protected]
Website: www.envirotechindia.com
CONTENTS
1. Introduction……………………………………………………………………...
3
2. Key Features…………………………………………………………………….
4
3. System Requirements…………………………………………………………
4
4. Installation Instructions……………………………………………………….
5
4.1. Installing JRE 1.6…………………………………………………………..
5
4.2. Installing MetView…………………………………………………………
5
5. Using MetView with WM251 DOS Software………………………………..
6
6. Interpreting Data using MetView…………………………………………….
7
6.1. Open/View LOGAA Files………………………………………………….
7
6.2. Daily Graphs………………………………………………………………..
9
6.3. Averages Table and Averages Graph………………………………….
10
6.4. Windrose and Distribution Chart……………………………………….
11
7. User Settings……………………………………………………………………
14
2
Envirotech Instruments
MetView V1.0 05/07
1.0 INTRODUCTION
Computer hardware configurations are rapidly changing and operating systems
have been frequently modified to suit changing needs. Today the default operating
system has become Windows XP. A long-standing requirement from users of
Envirotech WM251 has been a Software package compatible with current
computers & operating systems. Our new MetView Software is Windows XP
compatible and has been designed to process data saved from old versions of
Envirotech Wind Monitors running DOS based software.
The “Archive” utility of the OLD DOS based software was provided to save Wind
Data in ASCII form so that the raw data could be accessed by Text Editors etc.
The new MetView Software accepts the Archive Files as input sources of data.
Importing data into the system is easy: just browse to the path where the Archive
files are saved and click to select an Archive file. The new software opens it on the
screen in a tabular form, automatically filtering the power failure & system restart
comment lines.
Export to Excel: Often users wish to perform trend analysis or some mathematical
operations on the data. MetView makes this easy by exporting data into an Excel
Spreadsheet. This utility can also be used to prepare a Met File for Air Quality
Modeling software packages. To print Met data for inclusion in reports just add
suitable headings / captions etc. to the Excel file
and print.
Diurnal Trends: Most met parameters show a
distinct diurnal behavior. MetView provides a
powerful graph plotting utility that helps to analyze
typical Temperature / RH, Solar Radiation data and
spot diurnal trends. MetView allows simultaneous
plots of different parameters which make it easy to
identify co-relations and discern seasonal changes.
Windrose Diagrams: Perhaps the most
important use of MetView will be to plot
Windrose diagrams. Our new software
generates colored Windroses in the
standard format as shown. User selectable
color schemes and a save option has been
provided so that the diagrams can be easily
incorporated in reports and presentations.
Moreover, as MetView works through
Windows XP you have complete freedom to
use any Laser / Inkjet printer supported by
your OS.
3
Envirotech Instruments
MetView V1.0 05/07
2.0 Key Features
•
Windows XP compatible
•
Designed to process Archive files of Envirotech Wind Monitoring Systems
(Like the WM251)
•
Allows data export to an Excel spread-sheet for analysis and printing
•
New Averaging & Graph plotting utility to study diurnal variations
•
Improved Windrose plotter allows color choice and saves Windrose
diagrams as image files
•
Simultaneous viewing of various graphs/diagrams and tables
•
Customized setting of Graph Titles, Station Location and Organization
Name
3.0 SYSTEM REQUIREMENTS
•
Pentium 2 or above
•
128 MB RAM, 4GB HDD (software takes ~ 5MB of HD space)
•
16x CD ROM Drive
•
2 button mouse
•
VGA Monitor (software runs best at a resolution of 1024x768)
•
RS-232 or USB port for data transfer
•
Standard LPT or USB Printer (compatible with your OS) for printing Graphs
and Tables
•
OS – Windows 98, 2000, XP
•
Java Run Time Environment 1.6 (included in the installation CD)
4
Envirotech Instruments
MetView V1.0 05/07
4.0 INSTALLATION INSTRUCTIONS
4.1 INSTALLING JAVA RUNTIME ENVIRONMENT
•
In order to run MetView, one must install Java Run Time Environment in his
PC. This package is available in the software CD provided to you and can
also be downloaded for free from the following link:
http:\\java.sun.com\javase\downloads\
4.2 INSTALLING METVIEW
•
•
•
•
Kindly confirm that the Software CD is supplied to you along with the
instrument.
Insert the CD in the CPU drive and close it.
Click CD/DVD icon shown in ‘My Computer’. Then open ‘MetView 1.0’
folder.
Double click on the MetView.msi icon (or on the setup file) and follow the
installation instructions to install the software on your machine. Note that the
software will get automatically installed in the drive where your Windows
was installed (see Figure 1).
FIG 1: Installation of MetView 1.0
•
Once the software is installed, an icon will be shown on the desktop by the
name of ‘MetView’. Double clicking this icon will launch the program.
5
Envirotech Instruments
MetView V1.0 05/07
5.0 USING METVIEW WITH WM251 DOS SOFTWARE
MetView has been developed to meet the requirement of its existing customers (of
Wind Monitor WM251) for Windows XP compatible software. The software enables
the user to interpret meteorological data, which is logged by WM251 and
transferred to the PC using the existing DOS based software.
The user must understand the following steps in order to use MetView in
conjunction with the existing DOS based software for WM251.
•
•
•
•
•
•
Switch off the computer and insert the floppy disk provided with the MetView
software package, in its floppy disk drive.
Switch on the computer and press “DEL” or “F2” key to enter computer’s
Bios.
Browse through the Bios and verify if First Boot Device is a floppy disk or
not. Your computer’s boot order should be 1) Floppy 2) Hard Disk 3) CD.
Save your Bios settings and quit. The computer will restart itself.
If correct settings are made in Bios, the computer will boot in DOS through
the floppy.
On the command prompt type the following command:
A:\> wm.exe
•
•
•
•
•
•
This will launch the DOS based software for transferring data from WM251
to your computer.
Select the COM port and specify the Directory Paths and start transferring
data. Note that all Directory Paths must reside in the floppy disk, i.e. in “A:”.
Once the data is transferred and Archived as LOGAA.AAx in the floppy, exit
the software and shut down the computer.
Take out the floppy from the floppy disk drive and switch on the computer.
The PC will now boot in your operating system (e.g. in Windows XP).
Once the PC is booted insert the floppy again in the floppy disk drive and go
to My Computer.
Copy/Cut and paste the Archived files (LOGAA.AAx Files) at any location in
your hard disk. One can simply copy/cut these files and paste into:
C:\Program Files\MetView\Database\
•
•
You can rename the files without changing their extension, though it is
advised to make a backup of existing files before renaming them.
Now launch MetView by double clicking its icon available on the Desktop.
The next section explains in depth how to use MetView to interpret the
Archived LOGAA.AAx files.
6
Envirotech Instruments
MetView V1.0 05/07
6.0 INTERPRETING DATA USING METVIEW
MetView is designed specifically to open LOGAA.AAx files and generates an error
if it is used to open other file extensions.
6.1 OPEN/VIEW LOGAA FILE
Once the main screen of the software shows up (see Figure 2) go to File->Open
Database and browse for a LOGAA.AAx file. Once an appropriate file is selected,
the data from the database will be loaded in tabular form as shown in Figure 2.
FIG 2: MetView Main Screen
If however, a user wishes to view the Archived file (i.e. the ASCII form of
LOGAA.AAx) then he can simply go to the drop-down menu View->LOGAA File
and select an appropriate database file. It will get open in Notepad.
7
Envirotech Instruments
MetView V1.0 05/07
The main screen of the software also shows the following panels:
•
File Info: This panel highlights the start and the end date of the loaded
database. It also shows the complete path and filename of the database file
that is tabulated.
•
Organization Info: This panel highlights the name of the organization which
is using the instrument and the monitoring station location where the
readings were obtained.
•
User Info: This panel shows the log-in username and current date recorded
by the computer on which MetView is running.
•
Daily Graphs: Explained in length in section 6.2
•
Averages Table: Explained in length in section 6.3
If a user wishes to take prints of the tabulated data, he can simply export the table
to MS Excel or Notepad by going to File->Export Table. Note that MetView will
prompt the user to save the file before launching the chosen application. Exporting
to MS Excel has another advantage, i.e., its different features can be used for
preparing reports, graphs and databases as per user requirement.
FIG 3: Export tabulated data to MS Excel
8
Envirotech Instruments
MetView V1.0 05/07
6.2 DAILY GRAPH
A special feature of MetView is, drawing daily graphs of the tabulated data. In
order to do so, a user must first load/tabulate a database file (see section 6.1) and
then select a particular date from the table. Next the user must select a parameter
for which the graph will be drawn from the drop down menu in the Daily Graph
panel.
FIG 4: Daily Graphs can be viewed simultaneously
Once this is done the “View Graph” button in the Daily Graph panel will be made
available and pressing it will bring the graph of the chosen parameter (for the
chosen date) on the screen.
The graph window enables the user to save the graph in *.png format, print the
graph and set a title for it. One can also see the daily graph of the next and the
previous day(s) by pressing the appropriate buttons available here. MetView
comes with a unique feature of comparing different daily graphs of different
parameters simultaneously; enabling user for analyzing recorded data in an
efficient manner.
Moreover, the Organization Info, viz. Organization Name and Station Location
entered by the user is automatically captured and available in the graph.
9
Envirotech Instruments
MetView V1.0 05/07
6.3 AVERAGES TABLE AND AVERAGES GRAPH
Often it is desirable to view maximum, minimum and average values of a metsensor. MetView serves this purpose by re-tabulating the data from the LOGAA file
and calculating these basic mathematical functions.
(b)
(a)
FIG 5: Averages Table and Averages Graph of a Parameter (Temperature in this case).
(a) Hourly Trend of Temperature for a month. (b) Hourly Averages Table exported to MS Excel.
In order to view this table, the user must first load/tabulate a database file (see
section 6.1) and then select a particular parameter from the drop-down menu of
the Averages Table panel. Once a parameter is selected, the “View Averages
Table” will be made available, pressing which will open the Hourly Averages Table.
The table not only shows the average value of a parameter in a particular day, but
also calculates monthly average of each hour. Further, a user can select a
continuous range of dates by dragging the mouse over the table and plot the
hourly trend of parameter values in this range (see Figure 5). Again these trends
(graphs) can be saved for documentation or printed directly.
Moreover, one can also export this table to MS Excel to prepare formatted reports
or taking its print.
10
Envirotech Instruments
MetView V1.0 05/07
6.4 WINDROSE AND DISTRIBUTION CHART
Meteorological data is incomplete without a wind pattern in the form of a Windrose.
MetView provides its users with state of art colored Windrose diagrams with user
defined color schemes.
A Windrose can be drawn by loading a database file (see Section 6.1) and
selecting Windrose->Windrose Settings in the menu of the main screen.
FIG 6: Windrose with color selection feature
Clicking the Windrose Settings will open a window loaded with default settings for
plotting a Windrose. A user can alter the settings but he must specify a date range,
a time range, number of sectors and speed ranges to plot a Windrose or see the
associated Distribution Chart. Note that the “% Range” field provided in the
Channel Option panel is used to scale the Windrose diagram and is therefore not
used/required for making the Distribution Chart. Its default value is set as 30%.
The settings window also enables the user to select different color schemes for
different Windrose diagrams through color swatches (see Figure 6). The user can
save his custom color settings and load them when he next logs into the software.
11
Envirotech Instruments
MetView V1.0 05/07
(b)
(a)
FIG 7: (a) Save and (b) Print Options for Windrose
FIG 8: Multiple Windrose diagrams with different color schemes
12
Envirotech Instruments
MetView V1.0 05/07
MetView also comes with a special feature to view multiple Windrose diagrams
simultaneously (see Figure 7). This is particularly useful not only for analyzing the
wind patterns for different date and time ranges but also for finalizing the diagrams
before saving/printing them. The saved Windrose can be re-sized or/and zoomed
in any photo editor as per user requirements.
FIG 9: Distribution Chart along with a Windrose diagram
Unlike Windrose, a Distribution Chart is a tabulated representation of wind patterns
in date-time range. It can be obtained using the same settings made for a
Windrose diagram. The Distribution Chart can be exported to MS Excel as well, for
printing or developing formatted reports. Using MetView, one can analyze both
Distribution Chart and Windrose diagram simultaneously.
13
Envirotech Instruments
MetView V1.0 05/07
7.0 USER SETTINGS
An important feature of MetView is provision of custom user settings. The software
comes with a secured log-in module with a utility to change the username and the
password. Note that only one user can log-in and work with one copy of the
software.
To change a username/password, simply click the Preferences menu-item
available in the main screen and select Change User. Fill-up the necessary fields
and press Ok to change the existing username/password.
(b)
(a)
FIG 10: User Settings. (a) Changing Username/Password. (b) Changing Organization Info and Station
Location
Inclusion of Station Location where the Met data was collected and the name of
the organization collecting/analyzing the data is often required on graphical
diagrams and reports. MetView provides automatic inclusion of these fields at key
places. The user simply needs to enter these details in the main menu, by clicking
Preferences->Organization Info and this information will be copied in subsequent
plots and tables.
14
Envirotech Instruments
MetView V1.0 05/07