1
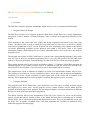
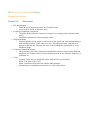
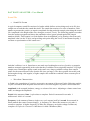
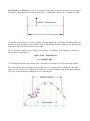
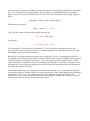
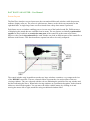
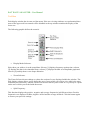
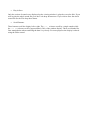
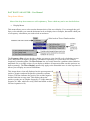
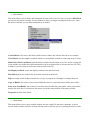
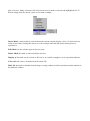
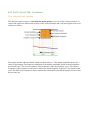
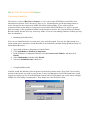
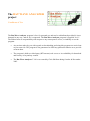
The BAT WAVE ANALYZER project Conditions of Use The Bat Wave Analyzer program is free for personal use and can be redistributed provided it is not changed in any way, and no fee is requested. The Bat Wave Analyzer program is supplied "as is". The author bears no responsibility with respect to any consequences of use, or inability to use the program. Any actions taken by you with regards to downloading and using this program are carried out at your own risk. The program is not guaranteed to fulfil any particular function or to provide accurate data. The program is held on a third party (BT Internet) web server so its availability for download and security is beyond my control. The Bat Wave Analyzer V1:01 was created by Chris Skellern during October & November 2003. The BAT WAVE ANALYZER Project - User Manual Introduction Freeware The Bat Wave Analyzer program is freeware which means it’s free to download and distribute. Program History & Design The Bat Wave Analyzer is a computer program which allows sound files to be viewed, manipulated and played. It has a number of handy functions, some of which are designed specifically for bat sounds. After attending a Bat course this year (2003) and being completely fascinated by the little ugly critters I decided to take a peek at sound files in general and see how easy it would be to display sound waves graphically on a PC screen. It turned out to be surprisingly easy (thanks to the masses of helpful information available on the Internet) and within a few hours I had a few initial subroutines written which displayed waves in their sinusoidal form. A few weeks later, the analyzer program is born. The program was written in 'MS Visual Basic 6', which is not a programming language I have much love for (I am at heart an assembler programmer) but is very easy and quick to use and lends itself readily to object programming. Its disadvantages are that it can be slow when processing graphics. The program should work on all versions of windows (above 3.1). Being a Visual Basic program its function requires a few runtime resource files to be installed on your PC. Most users will have the necessary DLL files installed, if you don't, these can be downloaded where necessary. The program uses colour to enhance its displays so results on a monochrome monitor may be poor. The program was written on a screen resolution of 800 x 600 so this is the minimum recommended resolution. If you use a lower resolution I would expect parts of the screen and its controls to be missing. The program has been tested at higher resolution and appears to resize correctly. Using the Program The program loads WAV format files. Once loaded the wave file can be scrolled, zoomed, played and displayed in various ways. As the program evolves, further features will be added and the program download page will be updated. The spectrogram display is the most important as different Bat species make their own individual call patterns. The 'Block' function allows some manipulation of the file to be carried out. Areas can be copied, pasted, cleared and played. Another feature is the 'Mark' function where comments can be inserted into the WAV file at a particular position and displayed on screen. They are automatically saved with the WAV file. A number of sample WAV files with comments are available for download from within the program download page. The BAT WAVE ANALYZER Project Program Specification Version 1:01 - First release File Input/Output o Loads WAV PCM format at 8 bit & 16 bit Mono only. o Saves as WAV PCM 16 bit mono only. Frequency/Amplitude Calculation o Calculates half & full wave frequencies using zero crossing points as measurement points. o Amplitude calculated as existing sample values. Display Methods o Displays graphics using single or split screen. Each screen can work independently to look at different places of the same wave file. This allows the easy comparison of patterns within the file. Displays the wave as an oscillogram, spectrogram or as an amplitude graph. Frequency/Amplitude Display o The Frequency plot can be displayed with different colours to represent the differing amplitude. Or a single colour to represent the part of the wave which the frequency is calculated for. Tools o Cleanup. Filters out low amplitude values from the file (user defined). o Block. Cut, Paste, Play, Clear. o Mark. Comments can be inserted with the Mark function. o Instant display of sample/frequency data at a click of the mouse. BAT WAVE ANALYZER - User Manual Sound File Sound File Format A typical computer sound file consists of a header which defines various things such as its file size, sample rate etc and then the sound data itself. The sound data consists of a series of numbers. Each number represents the positive or negative amplitude for that particular sample point along the sound file. Amplitude is the height of the wave along the vertical (Y axis). The following graphic was taken from the analyzer program and shows the amplitude values (green) plotted against the sample numbers (black). Each sample is a fixed distance from its neighbour, so by plotting a line from each amplitude value (on the Y axis), and providing each point along the X axis is incremented equally, I can draw a representation of the sound wave. And that’s all there is to it. Sound waves are made up of nothing but a series of positive or negative numbers arranged sequentially in the order that they would have been originally sampled. Very high sample rates return higher quality sound as the same wave shape would have many more sample points for the same amount of time (but the file sizes get larger). The above graphic shows the peak and trough as being a bit 'angular', a higher sample rate would have enabled a more accurate plot of these areas. Waveform Characteristics A Cycle is the completion of a positive to negative movement of the sound. In the following graphic, a cycle is measured from the point where the wave rises from negative to positive and crosses zero. Amplitude is the strength, loudness, energy or volume of the wave. Adjusting a volume control on a radio, etc changes the amplitude. Period is the amount of time 1 cycle takes to complete. Period is measured in seconds. 1 millisecond= 0.001 of a second. Frequency is the amount of times a single wave cycle repeats itself in 1 second. Its measured in Hertz (named after some German chappy). A frequency of 1 Hertz (Hz) means a cycle takes 1 second to complete. A higher frequency of 50hz (the frequency our mains voltage oscillates at) completes 50 cycles in 1 second. A 1000 hertz is called a Kilohertz (Khz). Wavelength is the distance 1 cycle covers (sound travels in air at around 340 meters per second so a frequency of 1khz means the period of each cycle = 340000mm /1000 cycles = 340mm or 0.34m. To calculate the frequency of a cycle within a computer sound file, we first need to first calculate the distance (in samples) that 1 cycle measures. This is then divided into the sample rate to find out how many times the cycle could repeat in one second. So, if I am using a sample rate of 22050 per sec and my 1 cycle takes 4.789 samples to complete, I can calculate its frequency as: 22050 / 4.789 = 4604.3015 Hz (or 4.6043015 Khz) To calculate the distance (in samples) that a cycle takes to complete, I use the following method. First calculate the total full samples between the two zero crossing points (remember: the point where a wave crosses zero is unknown, the chances of a sample being exactly at this point would be very rare). In the following example there are 3 full samples. Now, we need to calculate the distance between the first zero crossing point and the first full sample line (327). To do this we use trigonometry. First the angle is calculated between the two sample points (326 & 327) located on either side of the zero line. I can calculate the angle using Tangent where: Tan(angle) = Opposite Side / Adjacent Side. With the above example, Angle = Atan( 9061 + 4797 ) / 1 Now I use this angle to calculate the smaller adjacent size. adj = 9061 / Tan( Angle ) Or, simplify, adj = 9061 / (9061 + 4797) The calculated [adj] will always be a fraction of 1. I now repeat this calculation for next zero crossing point (between samples 330 & 331) and then add these two calculated values to the total full sample count to get my total distance. But, the above calculation has been carried out for only half a Cycle. If I multiply this result by 2, I can calculate the frequency for this half cycle (which has its uses if I want to compare the frequencys of positive half cycle to negative half cycle). To get the frequency of the complete cycle I would carry out the above calculation on the zero crossing points located on each side of a complete cycle. Alternatively, I can calculate the distance for a positive half cycle and then add it to the distance for the following negative half cycle. One problem with using zero crossing as a calculation point is that we are assuming a straight line exists between the two samples (which of course in reality there isnt). Subsequently, the measurment of frequency will be very, very slightly inaccurate. The higher the sample rate the better the accuracy. The error is tiny and for our purposes is not a problem. To calculate precisely, we would need to predict the wave curve between these two points. BAT WAVE ANALYZER - User Manual Screen Layout The Bat Wave Analyzer screen layout uses the conventional Microsoft windows with drop menus, toolbars, display areas etc. The screen is split into two frames, each with its own menu bar to the right hand side. A single large frame can be selected from a drop down menu if preferred. Each frame acts as a window enabling you to view an area of the loaded sound file. Different ways of displaying the sound data are available from its menu. The two frames are initially synchronized together so they both look at exactly the same part of the sound file at the same zoom factor. However, they can be desynchronized so each window can look at different parts of the sound file at different zoom factors. This function allows separate bat calls to be easily compared. The central window strip located between the two large windows contains a very compressed view of the WHOLE sound file. The two coloured sliders represent the size and position of the two viewing windows. They are coloured with the red one indicating the position of the top window and the blue indicating the lower. When both viewing windows are synchronized together, both coloured sliders are also locked together. You can move the slider with the mouse by clicking on it and moving the mouse left or right, much like using a traditional window slider. BAT WAVE ANALYZER - User Manual Tool Bars Each display window has its own tool bar menu. If the two viewing windows are synchronised then most of the upper tool bar controls will be disabled as the top window matches the display of the lower one. The following graphic defines the controls. Display Mode Selectors. Select how you wish to view the sound data. Selector [1] displays frequency against time, selector [2] displays the data in its sinusoidal form, selector [3] displays the data as an amplitude graph and selector [4] crudely shows wave shape distortion. Zoom Selectors. The Zoom In/Out selectors enlarge or reduce the section of wave displayed within the window. The Pick display selector allows you to define the area of wave which you wish to view (this is the most commonly used function). And the Zoom Point selector allows you to zoom in very closely to a point on the wave which you clicked with the mouse. Split Frequency. This function displays the positive, negative and average frequencies in different colours. Positive frequencies are displayed in Blue, negative in Red and the average in Black. Click the button again to restore your previous settings. Play & Save. Only the section of sound wave displayed on the viewing window is played or saved to disk. If you wish to play the whole sound file go to the Tools drop-down menu. If you wish to Save the whole sound file use the File drop-down menu. Scroll Buttons. These buttons scroll the display left or right. The < > selectors scroll by a single sample while the << >> selectors scroll by approximately 50% of the window display. These are intended for finer manipulation when examining the data very closely. For most purposes the display is altered using the slider control. BAT WAVE ANALYZER - User Manual Drop down Menus Most of the drop down menus are self-explanatory. Those which may not be are detailed below. Display Menu. This menu allows you to select certain characteristics of the wave display. You can toggle the grid lines, select whether you want the horizontal scale to display time or samples, determine which part of a frequency calculation you wish to look at and more. The Frequency Plot selector decides whether you want to view the full cycle calculation (zero to zero), the positive & negative frequency calculations separately or if you wish to see all three frequencies plotted together. The Plot Colours lets you switch between a gradient colour linked to amplitude size or a single colour (if you display a number of frequencies then use this option to see them separately). The Wave Display options only apply to the sinusoidal wave in close up where it allows you to display on screen calculations. This image shows a bat call displayed on the spectrogram with positive, negative and total frequencies plotted in separate colours. The blue indicates the positive, the red the negative and the black the average sum. This display shows the positive (peaks) are at a higher frequency (5.2 kHz) than the negative (4.5 kHz, which are really 52khz and 45khz to allow for time expansion x10). Block Menu. This menu allows you to define and manipulate an area of the wave file. Once you select Plot Block you can use the mouse crosshair on any window to draw a rectangle around part of the wave. Once the block is defined you can then manipulate it as needed. 'Cancel Block' will remove the block outline from a window but will not alter the wave contents. 'Clear Block' sets the samples enclosed within it to 0 amplitude (useful for removing areas of noise). 'Make Wave File From Block' turns the block contents into the whole wave file. So the existing file is lost and the area within the block transferred to the waveform buffer to become the new file. This is handy if you only want to work on a small section of the file. 'Set Display to Block' zooms the display windows onto the block area. 'Play Block' plays the sound of the waveform enclosed by the block. 'Flip' not really useful for Bat sounds but very easy to program so I thought I would put them in! 'Copy to Buffer' the section of waveform within the block is copied and stored in the paste buffer. 'Paste over from Buffer' the section of waveform stored within the paste buffer can be pasted back into the file Once this is selected use the mouse to plot the start position of the paste position. 'Properties' details of the block. Mark Menu. This menu allows you to insert a small window into the sound file and enter comments. it can be used to mark positions, label the sounds with the name of the bat species or perhaps describe certain parts of a wave. Many selections will only activate once a mark is selected and highlighted red. To do this simply click the mouse cursor over a mark rectangle. 'Insert Mark' a mark window is inserted into the current window display. Once it is inserted it can easily be moved by clicking the mouse over the rectangle and with the mouse button pressed, reposition it. 'Edit Mark' an edit window appears for text entry. 'Delete Mark' the mark is removed and the text lost. 'Display as' the mark can be viewed as full size or as a small rectangle to act as a position indicator. 'Clear All' will remove all marks from the whole file. 'Hide All' the mark are hidden from the large viewing windows but their positions remain marked on the indicator window. BAT WAVE ANALYZER - User Manual View Sample Details Function This function appears when you left click the mouse pointer over one of the viewing windows. A vertical line appears to indicate the position of the selected sample and a text box appears with a list of data (see below). The sample number indicates which sample the data relates to. The sample amplitude shows the +/value for this sample. The frequency amplitude is the highest amplitude which occurred within the current half cycle. The Cycle Frequency is the frequency of the current whole cycle. The Positive Frequency is the frequency of the positive half cycle and the negative frequency is for negative half cycle. The half cycle frequencies always include the current half cycle that the sample is part of and the previous one. The BAT WAVE ANALYZER Project Converting Sound Files The current version of Bat Wave Analyzer (v1:01) only accepts PCM Mono sound files in an uncompressed format. This is because, I have as yet, not managed to get the decoding routine to work correctly for the compressed (ADPCM) format. Subsequently, if you wish to look at compressed files on the analyzer you need to convert them into PCM Mono 8 or 16bit. I am sure there are plenty of free programs available on the internet to do this, but I use the Microsoft Sound Recorder utility because its in my Accessory folder. If you are not running windows 98 then you may have an alternative. Installing Sound Recorder You can use Sound Recorder to record, mix, play, and edit sounds. You can also link sounds to or insert sounds into a document. Sound Recorder is not installed by default during Windows Setup. To install Sound Recorder........ 1. Open Add or Remove Programs in Control Panel. 2. Click Add/Remove Windows Components. 3. In the Windows Components Wizard, select Accessories and Utilities, and then click Details. 4. Select Multimedia, and then click Details. 5. Select the Sound Recorder check box. Using Sound Recorder Load the sound file and then select Properties from the drop down menu. Now click 'Convert Now' and select the format you wish to convert into. It may recommend an 8 bit PCM format but I would suggest you always go for 16 bit PCM Mono format with a 22050 sample rate. Only choose a higher sample rate if the utility recommends it. Then simply save the file back to disk.