1
USER’S
MANUAL
Water Quality Capture
Optimization and
Statistics Model
(WQ-COSM)
April 2011 Edition (rev. 7/23/2011)
Copyright of this manual and the software it describes,
April 1, 2011 by Urban Watersheds Research Institute, Inc.,
Denver, CO, USA. All rights reserved.
DISCLAIMER AND TERMS OF USE
ATTENTION TO PERSONS AND ORGANIZATIONS USING ANY URBAN
WATERSHEDS RESEARCH INSTITUTE, INC. SUPPLIED OR SUPPORTED SOFTWARE,
SPREADSHEET, DATABASE OR OTHER PRODUCT.
It is likely that some non-conformities, defects, and errors with the products or their intended use
will be discovered as they are used. We welcome user feedback in helping to identify these
potential problems so that improvements can be made to future releases of Urban Watersheds
Research Institute, Inc. supplied or supported software, spreadsheet, database or other product.
Any of the aforementioned may be shared with others without restriction provided this
disclaimer accompanies the product(s) and each user agrees to the terms that follow.
BY THE INSTALLATION AND/OR USE OF ANY URBAN WATERSHEDS RESEARCH
INSTITUTE, INC. SUPPLIED OR SUPPORTED SOFTWARE, SPREADSHEET,
DATABASE OR OTHER PRODUCT, THE USER AGREES TO THE FOLLOWING:
THE URBAN WATERSHEDS RESEARCH INSTITUTE, INC. SUPPLIED OR SUPPORTED
SOFTWARE, SPREADSHEET, DATABASE AND OTHER PRODUCT ARE PROVIDED BY
URBAN WATERSHEDS RESEARCH INSTITUTE, INC. (“UWRI”) AND ITS
CONTRACTORS, ADVISORS AND REVIEWERS (“CONTRIBUTORS”) "AS IS" AND
“WITH ALL FAULTS”. ANY EXPRESS OR IMPLIED WARRANTIES, INCLUDING, BUT
NOT LIMITED TO, THE IMPLIED WARRANTIES OF MERCHANTABILITY AND
FITNESS FOR A PARTICULAR PURPOSE ARE DISCLAIMED. IN NO EVENT SHALL
UWRI OR ITS CONTRIBUTORS BE LIABLE FOR ANY DIRECT, INDIRECT,
INCIDENTAL, SPECIAL, EXEMPLARY, OR CONSEQUENTIAL DAMAGES
(INCLUDING, BUT NOT LIMITED TO, PROCUREMENT OF SUBSTITUTE GOODS OR
SERVICES; LOSS OF USE, DATA, INFORMATION OR PROFITS; OR BUSINESS
INTERRUPTION) HOWEVER CAUSED AND ON ANY THEORY OF LIABILITY,
WHETHER IN CONTRACT, STRICT LIABILITY, OR TORT (INCLUDING NEGLIGENCE
OR OTHERWISE) ARISING IN ANY WAY OUT OF THE USE OF THE URBAN
WATERSHEDS RESEARCH INSTITUTE, INC. SUPPLIED OR SUPPORTED SOFTWARE,
SPREADSHEET, DATABASE AND OTHER PRODUCT.
This software may be downloaded and used free of charge. Copies may be made and shared, but
reverse engineering of the source code, or its commercial distribution in total or in parts or any
derivative resulting from it is not permitted without explicit written permission by the Urban
Watersheds Research Institute, Inc.
Table of Contents
Table of Contents ....................................................................................................................3
Introduction.............................................................................................................................4
Installing WQ-COSM..............................................................................................................5
Using WQ-COSM...................................................................................................................5
Advanced Usage .....................................................................................................................9
Introduction
Water Quality Capture Optimization Statistical Model (WQ-COSM) is a Windows-based
computer program that uses recorded rainfall data from the National Climatological Data Center
(NCDC) and information about the catchment’s hydrologic parameters to help the user
determine the water quality capture volume (WQCV) and the maximized WQCV for any type of
stormwater treatment facility (i.e., structural Best Management Practice (BMP)) that captures
runoff in temporary storage vessel for mitigating of hydrologic changes caused by urbanization
and treatment of water quality through sedimentation, biological uptake of pollutants and/or
filtration/infiltration.
This program replaces a DOS based program called PondRisk (ref.: Guo, James C.Y. (1986).
PONDRISK Computer Model for Determination of Maximized Detention Volume, Dept. of Civil
Engineering, U. of Colorado Denver, Denver, Colorado). WQ-COSM provides a modern user
interface and adds additional functionality that was not available in PondRisk. WQ-COSM
computes runoff using continuous runoff simulation using either Rational Method or Horton’s
infiltration method and calculates the WQCV based on the runoff simulation.
WQCV is an integral part of any BMP that remove significant portions of pollutants from the
majority of runoff events and to help mitigate the hydrologic changes caused by urbanization.
These BMPs differ from flow-through BMPs that do not have a WQCV and do not mitigate the
effects of increased stormwater runoff peaks and volumes that result from urbanization. Flowthrough BMPs are primarily used to remove gross pollutants consisting of floating trash and
coarse sediment, but for the most part, do not remove fine sediment and associated pollutants,
bacteria, and dissolved constituents in significant amounts. A WQCV is a part of the following
types of BMPs:
Total storage for an Extended Detention Basin (i.e., dry) basin (EDB)
As surcharge storage above the permanent pool of a Retention Pond (i.e., wet) pond (RP)
As surcharge storage above the permanent pool of Wetland Basin (WB)
Above or upstream of a Media Filters (MF)
Above of upstream of a Rain Gardens (RG), sometimes called bio-retention cell.
The size (i.e., volume) of the WQCV vessel, or basin, dependent on the runoff that results over
time at the catchment and the time it takes to empty a brim-full WQCV vessel (i.e., the rate of
discharge from the vessel) when there is no additional runoff entering it.
WQ-COSM is implemented as two programs, a user interface and the math engine. The user
interface collects information from the user, generates properly formatted input files for the math
engine and displays the results after the math engine has successfully processed the information
in the input file.
This manual provides information for installing and running WQ-COSM. For information on the
underlying math model, the user is referred to other sources such as the following two:
Guo, James C.Y. and Urbonas, Ben. (2002). Runoff Capture and Delivery Curves for Storm
Water Quality Control Designs, ASCE J. of Water Resources Planning and Management,
Vol 128, Vo. 3, May/June.
Urbonas, B., Guo, Jim C.Y., Tucker, L.S. (1990). Maximization of Stormwater Quality Volume,
Urban Stormwater Quality Enhancement, Proceedings of an Engineering Foundation
Conference held in October 1989, Davos, Switzerland, published by ASCE, Reston, MD.
Description of the WQ-COSM Computer Model to Generate a Capture Volume for Stormwater
BMPS, a special report posted on www.urbanwatersheds.org and www.udfcd.org websites
under technical papers.
Installing WQ-COSM
WQ-COSM is distributed as a Microsoft Installer package (*.msi). To install, simply doubleclick on the WQ-COSM.msi installer. During the installation process you will be prompted to
select an installation type. The ‘Typical’ install is appropriate for most users. If you select the
‘Custom’ option, you will with have the option of selecting individual components to install, but
unless you have and/or are prepared to install your own support software for the preparation of
input files for this model, other options than ‘Typical’ would be of no benefit and should not be
used.
Certain components used by WQ-COSM, particularly Nokia’s Qt Framework, are released under
the GNU LGPL. Under the terms of this license you are permitted to omit installation of these
components in favor of your own version.
WQ-COSM can be uninstalled using the ‘Add/Remove Programs’ dialog in Windows or by rerunning the installer and selecting the ‘Uninstall’ option.
Using WQ-COSM
To use WQ-COSM, browse on your computer to ‘Start->All Programs->UWRI Programs’
and click on ‘WQ-COSM.’ This will launch the user interface and open up a new WQ-COSM
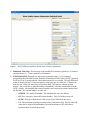
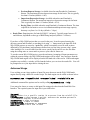
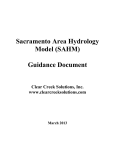
project. Figure 1 is the user interface that will appear.
Parameters are entered or edited using the ‘Input Parameters’ section of the interface located
on the right hand side of the screen. When entering or editing parameters, once the parameter is
selected by the use, a brief description of the selected parameter is provide in the ‘Description’
area at the bottom right hand side of the screen.
The values that can be entered or edited under ‘Input Parameters’ of the WQ-COSM user
interface are as follows:
Input File: For a new run, enter the name (without a file extension) of the file that holds the
WQ-COSM input parameters, including its directory location. Software assigns a standard
extension *.wqin. The directory location where you want to place this file may be found
using the ‘…’ button. To locate an existing input file, use the ‘…’ button to navigate
yourself to where the file is located.
Figure 1. WQ-COSM user interface for the entry of project parameters.
Simulation Time Step: The time step of the rainfall file in minutes (options are 15 minutes
and 60 minutes (i.e., 1-hour), defaults to 60 minutes).
NWS Rainfall File: Program uses the comma separated values (*.csv) formatted
precipitation data obtained from the National Climatological Data Center (NCDC) operated
by NOAA. The 15-minute and the 1-hour data formats are very similar. The only difference
is that an hourly file has 25 time-precipitation value pairs per row while the 15 minute file
only has one. Either file must have at least three lines. The first line contains column
headers. The second line is ignored to allow compatibility with files downloaded from the
NCDC website. All remaining lines should contain values associated with the headers from
the first line. The column headers, in order, are:
o COOPID- The Station ID number. This should be the same for all lines.
o CD-The Cooperative Network Division Number. WQ-COSM does not use it.
o ELEM- The type of data stored in this record. WQ-COSM does not use it.
o UN- The minimum reporting increment of the precipitation data. May be either HI
when data is reported in hundredths of an inch increments or HT when data is
reported tenths of an inch increments.
o YEAR- Four digit year of the data on the current line.
o MO- Two digit month of the year.
o DA- Two digit day of the month.
o TIME- Depending on the type of NCDC data used (i.e., 15-minute or 1-hour) the
format will differ. For the one-hour data there are 25 entries of rainfall depth per line
(one for each hour plus 1 for the daily total). For the 15-minute data, there is only
one rainfall depth entry per line, with the 25th hour line being the daily total value.
WQ-COSM does not use the daily total values.
o One value of precipitation depth immediately to the right of each TIME column. The
headers vary between the 15-minute and 1-hour data files:
For 15-minute data the columns are TIME and VALUE, the second being the depth
value.
--Or--
For 1-hour data the columns that follow are pairs of TIME and HOUR{N} and
Value- Where HOUR{N} is a header for the precipitation depths for times {1}
through {25} (i.e., hours 1:00 through 25:00 of the day where hour 25 column
contains the daily total that WQ-COSM does not use).
o F- There should be two of these to the right of each VALUE or HOUR{N} column.
This header indicates that the column holds flags associated with the data. Currently
WQ-COSM ignores (i.e., does not use) any of the flagged data.
It is recommended the user screen the raw data from the NCDC by first opening it in
Excel and examining the flags. This examination may cause the user to exclude
certain data ranges from analysis.
Location: The user input location describing the location of the rainfall gage used or the
location of the project.
WQ-COSM Output File: Enter the output file name, including its directory.
o The software will generate an HTML format file used to inspect the report generated
by the WQ-COSM Math engine. If the display of the results does not occur, add the
extension html at the end of the file name (i.e., *.html)
o This file will be overwritten each time the model runs, unless the user specifies a new
file name for the subsequent run.
o The information contained in the report varies depending on the value of the
‘WQ-COSM Output Report Type’ specified by the user.
WQ-COSM Output Report Type: User may specify the type of WQ-COSM report to
generate. The different report types are:
o Type 1: WQCV summary report. Provides a table of all Water Qaulity Capture
Volumes calculated by both Volume Capture Ratio and Event Capture Ratio methods,
and displays the maximized capture volumes for each method. User may copy and
paste the tables generated for subsequent analysis or generation of figure using Excel
or other software.
o Type 2: Statistical summary report. Provides a statistical summary of the storm
population along with the maximized water quality capture volume for both Volume
Capture Ratio and Event Capture Ratio methods.
o Type 3: Storm summary report. Provided a table of all storms processed by the WQCOSM program that include total precipitation, runoff, storm duration, time the storm
starts and dry period separating the start of the storm and the end of the storm that
occurred. Water quality capture information is not reported.
Storm Output File: If the user elects this option, a comma separated file of the same name
as the input file is generated that contains all the data listed in Type 3 output above. This file
will be overwritten by subsequent runs unless a different input file name is used. User may
import this file into Excel or other software for further analysis.
Exclude dates: Launches a dialog that allows the user to select dates to exclude from
analysis. Typically this would be used to exclude data from the winter season. If no dates are
specified, WQ-COSM will consider the entire input file.
Minimum Storm Separation Time: Minimum time between consecutive rainfall events that
marks the start of a new storm (hours). Typically between 3 - 24 hours (default = 6-hours).
Min. Depth to exclude non-runoff events: Minimum storm depth to be analyzed (inches).
Used to exclude non-runoff producing storms. State-of-practice for urban runoff suggests
between 0.06 and 0.12 in. (default = 0.08 inches).
Storm Outlier Cutoff Percentage: The upper percentile of the storms to use in WQCV
analysis to exclude large outlier storms (default = 99.5%). Storms above this percentile value
are not used in finding the Maximized WQCV.
Runoff Method: The type of method to use in calculating the runoff using the continuous
rainfall data. Two options are provided, ‘Continuous Rational’ and Continuos Horton’s.
o Rational ‘C’: User need to enter the Runoff Coefficient when the ‘Continuous
Rational’ method is selected. Runoff coefficient is between 0 and 1.
o Horton’s Parameters. Enter the following parameters when “Continuous Horton’s”
is selected:
Initial Infiltration Rate: Available when the runoff method is ContinuousHorton. The initial infiltration rate in inches per hour (no default recommended).
Final Infiltration Rate: Available when the runoff method is ContinuousHorton. The final infiltration rate in inches per hour (no default recommended).
Infiltration Decay Rate: Available when the runoff method is ContinuousHorton. The infiltration decay rate in 1.0/hr units (no default recommended).
Imperviousness: Available when the runoff method is Continuous-Horton. The
imperviousness of the basin in percent (no default recommended).
Pervious Depress Storage: Available when the runoff method is ContinuousHorton. The maximum pervious depression storage for the basin. This is typically
less than 0.5 inches (default = 0.40).
Impervious Depression Storage: Available when the runoff method is
Continuous-Horton. The maximum impervious depression storage for the basin.
This is typically less than 0.15 inches (default = 0.10).
Drying Time: Available when the runoff method is Continuous-Horton. The time
required for the basin to recover its infiltration and depression storage capacity
that may vary from 1 to 14 days (default = 3 days).
Drain Time: Emptying time for brim-full WQCV (in hours). Typically range between 12
and 48 hours, dependent on the type of BMP being analyzed (default = 24 hours).
If you have a WQ-COSM project that was saved in the past. It can be opened entering the
directory stream and file name or searching for it using ‘…’ button next to the input file field.
WQ-COSM projects are stored as *.qvin files, which is essentially a text file with sections
delimited by [SectionName] and parameters defined one per line using ‘param=value’ syntax.
After loading a file, it can be edited just like a new system, but be sure to save the file either
using the exiting name or a new name to preserve your edits for future use.
To run the current WQ-COSM project, press the run button. Assuming all input parameters are
within the expected range, the WQ-COSM math engine will be called. Any messages from the
WQ-COSM math engine will be displayed on the left hand side of the screen. If the math engine
completes successfully, a window will be launched where you can view the results file. You will
be prompted to save your input before closing the run.
Advanced Usage
Users wishing to run a large number of input files may choose to run the WQ-COSM math
engine directly using a batch file or other script. The math engine can be called as shown below:
WQ-COSMMath.exe -i=inputfile.ini -o=outputFile.html –r=rainfallFile.csv
Additional command line options can be seed by calling WQ-COSMMath.exe --help.
Users may also choose to create or edit input files using tools other than the Pond Risk User
Interface. The required syntax for input files is provided below:
[WQ-COSM]
COOPID= Either 0 or a specific station id to extract from the rainfall file.
cutoffPercent= A value between 1 and 100. Indicates the maximum percentile
storm to consider in calculations.
stormSepTime= A value in minutes
minStormDepth= A depth in inches
simulationType= SINGLEPOINT or CONTINUOUS
drainTime= A WQCV drain time in hours
includeDates= Date ranges in the form ‘mm/dd/yyyy HH:MM:00 - mm/dd/yyyy
HH:MM:00’ Multiple ranges are separated by semicolons.
excludeDates= Date ranges in the form ‘mm/dd/yyyy HH:MM:00 - mm/dd/yyyy
HH:MM:00’ Multiple ranges are separated by semicolons.
reportType= The type of output report to generate.
Plus one of the following sections:
[HortonBasin]
initInfRate= Initial infiltration rate in in/hr
finalInfRate= Final infiltration rate in in/hr
infDecayRate Infiltration decay rate in 1/hr
imperviousness= Basin imperviousness in percent
pervDepStg= Pervious depression storage capacity in inches
impervDepStg= Impervious depression storage capacity in inches
dryingTime= The drying time of the basin in days
[RationalBasin]
rationalCoeff= The runoff coefficient of the basin. Between 0 and 1
APPENDIX – A
Ranges in Rainfall Losses for Rational and Horton’s Methods
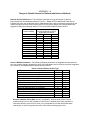
Rational Runoff Coefficient ‘C’. This coefficient varies with soil type and degree of effective
imperviousness of the catchment between 0.0 and 1.0. Based on EPS’s Nationwide Urban Runoff
Program Data from over 60 different sites in United States and the follow-up analysis performed by the
Urban Drainage and Flood Control District (UDFCD) in the Denver Region, the following tables offer
suggested values when selecting values of C for use with WQ-COSM to find the WQCV:
Percentage
Imperviousness
0%
10%
20%
30%
40%
50%
60%
70%
80%
90%
100%
Runoff Coefficient by NRCS
Hydrologic Soil Groups
C&D
B
A
0.04
0.11
0.17
0.22
0.28
0.34
0.41
0.49
0.60
0.73
0.89
0.02
0.06
0.12
0.18
0.23
0.29
0.37
0.45
0.57
0.71
0.89
0.00
0.00
0.06
0.13
0.19
0.25
0.33
0.42
0.54
0.69
0.89
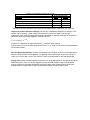
Horton’s Method Parameters. The following infiltration parameters are suggested and are based for
pervious surfaces originally suggested by Akan (1993) and others and for impervious surfaces suggested
by a number of investigators and the studies done by UDFCD:
Horton’s Initial Infiltration by Soil Type
Soil Type
(in/hr)
Dry sandy soils with little or no vegetation
5.0
Dry loam soils with little or no vegetation
3.0
Dry clay soils with little or no vegetation
1.0
Dry sandy soils with dense vegetation
10.0
Dry loam soils with dense vegetation
6.0
Dry clay soils with dense vegetation
2.0
Moist sandy soils with little or no vegetation
1.7
Moist loam soils with little or no vegetation
1.0
Moist clay soils with little or no vegetation
0.3
Moist sandy soils with dense vegetation
3.3
Moist loam soils with dense vegetation
2.0
Moist clay soils with dense or no vegetation
0.7
(mm/hr)
127
76.2
25.4
254
152
51
43
25
7.6
84
5.1
18
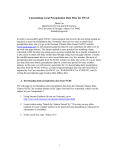
Horton’s Infiltration Decay Rate can vary considerably. Most reported values in use by
modelers range from 2 to 6/hr (0.00056 to 0.00167/sec). Because there is little sensitivity in
final results after the value of 3/hr is used, it is recommended for use with WQ-COSM when
evaluating B, C and D soil types and a value of 2/hr when evaluating type A soils.
Horton’s Final Infiltration Rate by Soil Type
Final Infiltration Rate
Soil Type
(in/hr)
(mm/hr)
Clay loam, silty clay loam, sandy clay, silty clay, clay
0.00 - 0.05
0.00 - 1.3
Sandy clay loam
0.05 - 0.15
1.3 - 3.8
Silt loam, loam
0.15 - 0.30
3.8 – 7.6
Sand, loamy sand, sandy loam
0.30 - 0.45
7.6 – 11.4
The final or minimum infiltration rate is often the saturated hydraulic conductivity rate of the soil
Impervious Surface Depression Storage can also vary considerably depending on the type of the
surface and its condition. Water stored in depressions on impervious areas is lost through
evaporation. Kidd (1978) developed the following relationship for depression storage as a function of
catchment slope which has a regression coefficient of 0.85:
(ܭ = ܦ0.0303 ∙ ܵି.ସଽ)
In which, D = depression storage, inches and S = catchment slope, percent.
Typical values in use by modelers range form 0.04 to 0.12. A value of 0.08 inches is recommended for
use with WQ-COSM
Pervious Depression Storage in inches or millimeters has to be filled up before runoff begins and is
subject to both infiltration and evaporation. For grassed urban surfaces this ranges from 0.25 to 0.5
inches (6 to 13 mm) and a value 0 0.3 inches (7.6 mm) is recommended for use with WQ-COSM.
Drying Time used by modelers typically varies from 1 to 14 day depending on local climate during the
rainfall seasons. A value of 3 days is suggested for use with WQ-COSM in most of United States
except in regions of prolonged precipitation and high humidity where longer periods may be more
appropriate and in regions with very dry climates where shorter periods should be used.