1
Preface, Table of Contents
User Information
The Organon XDB
User Interface
SIMATIC
ProC/C++ for M7-300
and M7–400
Debugging C Programs
User Manual
This manual is part of the documentation package
with the order number:
6ES7812–0CA01–8BA0
C79000–G7076–C520–01
1
Reference Information
Commands of Organon XDB
2
Organon XDB Error Messages
3
Safety Guidelines
!
!
!
This manual contains notices which you should observe to ensure your own personal safety, as well as
to protect the product and connected equipment. These notices are highlighted in the manual by a
warning triangle and are marked as follows according to the level of danger:
Danger
indicates that death, severe personal injury or substantial property damage will result if proper precautions
are not taken.
Warning
indicates that death, severe personal injury or substantial property damage can result if proper
precautions are not taken.
Caution
indicates that minor personal injury or property damage can result if proper precautions are not taken.
Note
draws your attention to particularly important information on the product, handling the product, or to a
particular part of the documentation.
Qualified Personnel
The device/system may only be set up and operated in conjunction with this manual.
Only qualified personnel should be allowed to install and work on this equipment. Qualified persons
are defined as persons who are authorized to commission, to ground, and to tag circuits, equipment,
and systems in accordance with established safety practices and standards.
Correct Usage
!
Note the following:
Warning
This device and its components may only be used for the applications described in the catalog or the
technical description, and only in connection with devices or components from other manufacturers which
have been approved or recommended by Siemens.
This product can only function correctly and safely if it is transported, stored, set up, and installed correctly,
and operated and maintained as recommended.
Trademarks
SIMATIC is a registered trademark of SIEMENS AG.
Third parties using for their own purposes any other names in this document which refer to
trademarks might infringe upon the rights of the trademark owners.
Copyright Siemens AG 1997 All rights reserved
The reproduction, transmission or use of this document or its contents is
not permitted without express written authority. Offenders will be liable for
damages. All rights, including rights created by patent grant or registration
of a utility model or design, are reserved.
We have checked the contents of this manual for agreement with the
hardware and software described. Since deviations cannot be precluded
entirely, we cannot guarantee full agreement. However, the data in this
manual are reviewed regularly and any necessary corrections included in
subsequent editions. Suggestions for improvement are welcomed.
Siemens AG
Automation Group
Industrial Automation Systems
Postfach 4848, D-90327 Nürnberg
Technical data subject to change.
Siemens AG 1997
Siemens Aktiengesellschaft
C79000–G7076-C520-01
Preface
Purpose
The information in this manual will enable you to debug programs using the
Organon XDB Debugger.
Contents
This user manual describes the Organon XDB Debugger.
The manual provides you with information on the following subjects:
Organon XDB User Interface
Organon XDB Commands
Organon XDB Error Messages
Audience
This manual is intended for STEP 7 users wishing to create and debug C and
C++ application programs for SIMATIC M7.
In order to create and debug M7 applications using textual high language
programming in C/C++, the following knowledge is required:
using STEP 7
A sound knowledge of the STEP 7 standard software is essential for project management, symbol editing and transferring new programs from the
programming device to the PLC.
You will find the relevant information in the STEP 7 User Manual.
the programming languages C and C/C++
Knowledge of the programming languages C and C++ is necessary for
creating applications. You should also be familiar with the integrated development environment of Borland C/C++.
You will find the required information in the documentation supplied with
Borland C/C++.
Debugging C Programs
C79000–G7076-C520-01
iii
Preface
Other Manuals
The following table contains a list of manuals you will require in addition to
this user manual.
Title
How to Use this
Manual
Contents
Standard Software for S7 and M7 STEP 7
User Manual
Installing and using STEP 7
M7-300 and M7–400
Program Design,
Programming Manual
Introduction to creating M7 appliocations in C/C++
System Software for M7-300 and M7–400
System and Standard Functions,
Reference Manual
Descriptions of the RMOS system calls,
M7–API library and standard CRUN
library
System Software for M7-300 and M7–400
Installation and Operation
User Manual
Installing, starting up and operating M7
PLCs
Pro C/C++ for M7–300/400
Writing C Programs
Using the optional Package M7–ProC/
C++ and the Symbol Import Editor
Borland C/C++
Documentation on CD ROM
D C/C++ Programming
D Using the integrated development environment and tools
To enable you to access specific information more easily, this manual contains the following access help:
S At the start of the manual you will find a complete list of contents.
S At the start of each chapter you will find an overview of the chapter.
Additional
Assistance
If you have any questions regarding the products described in this manual,
and cannot find the answers here, please contact the Siemens representative
in your area. You can find the address of your local Siemens representative in
the appendix “Siemens Companies and Representatives” in the STEP 7 User
Manual.
If you have any questions or remarks on the manual, please fill out the remarks format the end of the manual and return it to the address provided. We
also invite you to enter your personal opinion of the manual in this remarks
form.
We hold training courses to help introduce you to SIMATIC S7 programmable controllers. For more information, please contact your regional training center or the central training center in D–90327 Nuremberg Germany
(Tel. +49 911 895-3154).
iv
Debugging C Programs
C79000–G7076-C520-01
Preface
Up–To–Date
Information
You can find up–to–date information on SIMATIC products from the following sources:
On the Internet under http://www.aut.siemens.de/
Via Fax – Polling number +49–8765–9300–5500
In addition, the SIMATIC Customer Support provides up–to–date information
and download facilities for users of SIMATIC products:
On the Internet under http://www.aut.siemens.de/simatic–cs
Via SIMATIC Customer Support Mailbox under the following number:
+49 (911) 895–7100
For dialing into the mailbox use a modem of up to V. 34 (28. 8 Kbps) and set
the following parameters: 8, N, 1, ANSI, or alternatively use ISDN (x. 75, 64
Kbps).
The telephone and fax numbers of the SIMATIC Customer Support service
are:
Tel: +49 (911) 895–7000
Fax: +49 (911) 895–7002
You may also ask questions directly using E–mail on the Internet or via the
above mentioned mailbox.
Debugging C Programs
C79000–G7076-C520-01
v
Preface
vi
Debugging C Programs
C79000–G7076-C520-01
Contents
1
Organon XDB User Interface
1.1
1.1.1
1.1.2
Starting Organon XDB
Start–up Dialog
Starting problems
1.2
1.2.1
1.2.1.1
1.2.1.2
1.2.1.3
1.2.1.4
1.2.1.5
1.2.1.6
1.2.1.7
1.2.1.8
1.2.2
1.2.2.1
1.2.2.2
1.2.3
1.2.3.1
1.2.3.2
1.2.3.3
1.2.3.4
1.2.3.5
1.2.3.6
1.2.3.7
1.2.3.8
1.2.3.9
1.2.3.10
1.2.3.11
1.2.3.12
1.2.3.13
1.2.3.14
1.2.3.15
1.2.3.16
1.2.3.17
1.2.3.18
Description of the Main Window
Menu Panel
File
Display
Run
Debug
Language
Options
Windows
Help
Browsers
The Windows File Browser
The XDB Symbol Browser
Buttons
Load
Search
Step
Next
Run
Recapture
Set Scope up
Set Scope down
Set Scope here
Display/Hide Source Window
Display/Hide Assembler Window
Display/Hide Register Window
Display/Hide Task Window
Display/Hide Remote System Window
Evaluate
Create Memory Window
Display Callstack
Break
1–8
1–9
1–10
1–19
1–21
1–25
1–35
1–36
1–44
1–45
1–46
1–46
1–47
1–49
1–49
1–50
1–51
1–51
1–51
1–52
1–52
1–52
1–53
1–53
1–53
1–53
1–54
1–54
1–54
1–55
1–56
1–56
1.3
1.3.1
1.3.1.1
1.3.2
1.3.3
1.3.4
Description of the Subwindows
Command Window
Command Window Editor
Source Window
Assembler Window
Register Window
1–57
1–57
1–58
1–59
1–62
1–64
Debugging C Programs
C79000–G7076-C520-01
1–3
1–3
1–7
vii
Contents
2
viii
1.3.5
1.3.6
1.3.7
1.3.8
1.3.8.1
1.3.9
1.3.10
Task Window
Remote System Window
Evaluation Windows
Memory Windows
Memory Window Context Menu
Trace Windows
Copy and Paste
1–65
1–66
1–66
1–69
1–70
1–74
1–75
1.4
1.4.1
1.4.1.1
1.4.1.2
1.4.1.3
1.4.2
1.4.2.1
1.2.2
1.4.3
1.4.3.1
1.4.3.2
Descriptor and Register Tables
Descriptor Tables
Modify
Reload Table
Set Range
Control Register
Modify
Update
Register Window
General Register
Segment Register
1–78
1–78
1–80
1–82
1–82
1–82
1–83
1–85
1–85
1–85
1–86
Organon XDB Command Set
2.1
BATCH
2–6
2.2
BREAK
2–8
2.3
CLOSE
2–9
2.4
CONTINUE
2–10
2.5
DEFINE Commands
2–11
2.6
DEFINE Button
2–12
2.7
DEFINE KEY
2–13
2.8
DEFINE MACRO
2–15
2.9
DEFINE SYMBOL
2–17
2.10
DELETE Commands
2–18
2.11
DELETE BREAKPOINT
2–19
2.12
DELETE BUTTON
2–20
2.13
DELETE DEBUG
2–21
2.14
DELETE DIRECTORY
2–22
2.15
DELETE EVALUATE
2–23
2.16
DELETE KEY
2–24
2.17
DELETE MACRO
2–25
2.18
DELETE MODULE
2–26
2.19
DELETE TRACEPOINT
2–27
2.20
DELETE WATCHPOINT
2–28
2.21
DISABLE Commands
2–29
2.22
DISABLE BREAKPOINT
2–30
2.23
DISABLE EVALUATE
2–32
2.24
DISABLE TRACEPOINT
2–33
2.25
DISABLE WATCHPOINT
2–35
Debugging C Programs
C79000–G7076-C520-01
Contents
2.26
DISPLAY
2.27
DISPLAY Descriptor Table
2–39
2.28
DISPLAY SYSREG
2–40
2.29
ENABLE Commands
2–41
2.30
ENABLE BREAKPOINT
2–42
2.31
ENABLE EVALUATE
2–43
2.32
ENABLE TRACEPOINT
2–44
2.33
ENABLE WATCHPOINT
2–45
2.34
ERASE
2–46
2.35
ERASE SYSREG
2–47
2.36
EVALUATE
2–48
2.37
EXIT
2–51
2.38
GOTO
2–52
2.39
HELP
2–53
2.40
IF
2–54
2.41
Label
2–56
2.42
LINE
2–57
2.43
LOAD
2–59
2.44
MESSAGE
2–62
2.45
NEXT
2–63
2.46
PAGE
2–64
2.47
PRINT
2–66
2.48
REMOTE
2–67
2.49
RUN
2–68
2.50
SCAN
2–70
2.51
SEARCH
2–71
2.52
SET Commands
2–72
2.53
SET BREAKPOINT
2–73
2.54
SET DEBUG
2–76
2.55
SET DESCRIPTOR
2–78
2.56
SET DIRECTORY
2–80
2.57
SET ESCAPE
2–81
2.58
SET EVALUATE
2–82
2.59
SET INTERFACE
2–85
2.60
SET LANGUAGE
2–86
2.61
SET LOGFILE
2–87
2.62
SET MODULE
2–88
2.63
SET OPTION
2–89
2.64
SET PROTFILE
2–92
2.65
SET REGISTER
2–94
2.66
SET SCOPE
2–99
2.67
SET SCROLL
3–94
Debugging C Programs
C79000–G7076-C520-01
2–37
ix
Contents
3
x
2.68
SET TASK
2–100
2.69
SET TRACEPOINT
2–102
2.70
SET VALUE
2–104
2.71
SET WATCHPOINT
2–109
2.72
SHOW Commands
2–112
2.73
SHOW ACTIVE
2–113
2.74
SHOW BREAKPOINT
2–114
2.75
SHOW BUTTON
2–115
2.76
SHOW CALLS
2–116
2.77
SHOW DBVAR
2–118
2.78
SHOW DEBUG
2–119
2.79
SHOW DECLARATOR
2–120
2.80
SHOW DESCRIPTOR
2–121
2.81
SHOW DIRECTORY
2–124
2.82
SHOW ESCAPE
2–125
2.83
SHOW EVALUATE
2–126
2.84
SHOW INFO
2–127
2.85
SHOW KEY
2–128
2.86
SHOW LANGUAGE
2–129
2.87
SHOW LEVEL
2–130
2.88
SHOW LOGFILE
2–131
2.89
SHOW MACRO
2–132
2.90
SHOW MEMORY
2–133
2.91
SHOW MODULE
2–135
2.92
SHOW OPTION
2–136
2.93
SHOW PROTFILE
2–137
2.94
SHOW REGISTER
2–139
2.95
SHOW SCOPE
2–139
2.96
SHOW SEGMENT
2–140
2.97
SHOW SOURCE
2–141
2.98
SHOW STATUS
2–142
2.99
SHOW SYMBOL
2–143
2.100
SHOW TASK
2–144
2.101
SHOW TRACEPOINT
2–145
2.102
SHOW TYPE
2–146
2.103
SHOW VERSION
2–147
2.104
SHOW WATCHPOINT
2–148
2.105
SPAWN
2–149
2.106
STEP
2–150
2.107
WHILE
2–152
Organon XDB Error Messages
Debugging C Programs
C79000–G7076-C520-01
Organon XDB User Interface
1 ORGANON XDB USER INTERFACE
1
1-3
1.1
Starting Organon XDB
1-3
1.1.1
Start-up Dialog
1-3
1.1.2
Starting problems
1-7
1.2
Description of the Main Window
1-8
1.2.1
1.2.1.1
1.2.1.2
1.2.1.3
1.2.1.4
1.2.1.5
1.2.1.6
1.2.1.7
1.2.1.8
Menu Panel
File
Display
Run
Debug
Language
Options
Windows
Help
1-9
1-10
1-19
1-21
1-25
1-35
1-36
1-44
1-45
1.2.2
1.2.2.1
1.2.2.2
Browsers
®
The Windows File Browser
The Organon XDB Symbol Browser
1-46
1-46
1-47
1.2.3
1.2.3.1
1.2.3.2
1.2.3.3
1.2.3.4
1.2.3.5
1.2.3.6
1.2.3.7
1.2.3.8
1.2.3.9
1.2.3.10
1.2.3.11
1.2.3.12
1.2.3.13
1.2.3.14
1.2.3.15
1.2.3.16
1.2.3.17
1.2.3.18
Buttons
Load
Search
Step
Next
Run
Recapture
Set Scope Up
Set Scope Down
Set Scope Here
Display/Hide Source Window
Display/Hide Assembler Window
Display/Hide Register Window
Display/Hide Task Window
Display/Hide Remote System Window
Evaluate
Create Memory Window
Display Callstack
Break
1-49
1-49
1-50
1-51
1-51
1-51
1-52
1-52
1-52
1-53
1-53
1-53
1-53
1-54
1-54
1-54
1-55
1-56
1-56
Debugging C Programs
C79000-G7076-C520-01
1-1
Organon XDB User Interface
1.3
Description of the Subwindows
1-57
1.3.1
1.3.1.1
Command Window
Command Window Editor
1-57
1-58
1.3.2
Source Window
1-59
1.3.3
Assembler Window
1-62
1.3.4
Register Window
1-64
1.3.5
Task Window
1-65
1.3.6
Remote System Window
1-66
1.3.7
Evaluation Windows
1-66
1.3.8
1.3.8.1
Memory Windows
Memory Window Context Menu
1-69
1-70
1.3.9
Trace Windows
1-74
1.3.10
Copy and Paste
1-75
1.4
Descriptor and Register Tables
1-78
1.4.1
1.4.1.1
1.4.1.2
1.4.1.3
Descriptor Tables
Modify
Reload Table
Set Range
1-78
1-80
1-82
1-82
1.4.2
1.4.2.1
1.4.2.2
Control Registers
Modify
Update
1-82
1-83
1-85
1.4.3
1.4.3.1
1.4.3.2
Register Window
General Registers
Segment Registers
1-85
1-85
1-86
1-2
Debugging C Programs
C79000-G7076-C520-01
Organon XDB User Interface
1 Organon XDB User Interface
1.1 Starting Organon XDB
1.1.1 Start-up Dialog
The first thing Organon XDB does is reading the Windows registry, which contains
information about the preferred window sizes and colors, the directories where the
sources of your target program are located, and details of the connection to the
target machine. If there are no entries Organon XDB starts anyway, using the builtin default values for size and color. The other informations Organon XDB needs
must be entered by you into the start-up window (see below).
Now the start-up window appears where you enter the information the debugger
needs to begin its work. Check the displayed information and modify if necessary.
To start Organon XDB click the Start XDB button. When you close the start-up
window, the registry entries are updated (or created if not present) thereby saving
the actual start-up data for the next session.
If you decide not to start, click the Cancel button which ends the start-up routine
immediately and cancels the session, leaving the start-up data untouched.
This is the start-up window. You can enter the following data:
• Working Directory: This is the directory Organon XDB works in.
• Organon XDB assumes all files it wants to read or write to be in the working
directory, unless explicitly stated otherwise.
Debugging C Programs
C79000-G7076-C520-01
1-3
Organon XDB User Interface
• Source Directories: In this field you specify the list of directories where
Organon XDB looks for source files. The working directory is always searched
first. So you don’t have to enter the working directory here again. For all other
directories you may write the complete directory path, or the path relative to the
working directory. If you enter more than one directory, separate them with
commas.
• Initial batch file: A batch file is a file containing Organon XDB commands (see
the Command Reference). It is a convenient way to store a list of commands you
usually issue. If a file name is entered in this line, Organon XDB will read and
execute this file prior to any command you issue. If the initial batch file is not
located in the working directory, you may write the complete directory path, or
the path relative to the working directory.
• Target Connection: Here you tell Organon XDB how to connect to the target
machine. Organon XDB expects this information in the following form:
mpi:<H>,<T>
<H> is the host address of the communication partner in the MPI segment.
<T> is the TSAP-ID for communication with the terminal server.
Typical values for all boards connected to MPI or partyline (CPU-4xx, CPU-3xx,
FM-3xx) are:
mpi:2,12
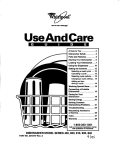
For other communication boards (for example FM-400) the TSAP-ID has to be
modified as follows.
B y te 1
B y te 0
0000
R a c k-N r.
1100
S lo t-N r.
A FM-400 in rack 1 at slot 4 (240CH) has to be addressed with mpi:2,9228.
1-4
Debugging C Programs
C79000-G7076-C520-01
Organon XDB User Interface
If you click the button More Options, the window changes to this:
Now you can set or change the following options:
• Mode: You can choose between Interactive (which is the default value) and
Non Interactive. In the interactive mode, Organon XDB expects you to issue
commands, whereas the debugger finishes the session immediately after reading
and executing the initial batch file if you switch to non-interactive mode.
• Add Underscore: Your compiler might change the symbol names by adding an
underscore or dot to it, e.g. a procedure you named "init" might be called "init",
"_init", "init_", or ".init" in the assembler code. You have to tell Organon XDB
which way the compiler translating your program uses. The default value is
None.
• CPU: Organon XDB disassembles opcode due to the instruction set of the
chosen processor. During a debug session this option can be modified with the
SET OPTION command.
Debugging C Programs
C79000-G7076-C520-01
1-5
Organon XDB User Interface
• Use only hardware breakpoints: Breakpoints are points which can be set
arbitrarily into your program, and whenever the execution of the program meets
such a breakpoint, it is stopped at this point, enabling you to examine the state
the program is in. Organon XDB can simulate breakpoints by maintaining a list
of set breakpoints and looking whether the execution encountered one of them.
But looking for breakpoint encounters before every step of execution is rather
time-consuming, slowing down the execution speed. If you want to use debug
register breakpoints only to enhance the performance, choose this option.
• Convert symbols to upper case: If you enter this option, Organon XDB does
not distinguish between symbols written in lowercase and in uppercase. This
setting is on by default and must not be changed.
• Additional Args: This line allows you to enter all options and arguments which
are not displayed in this window.
• IO-timeout after .. seconds: If the connection cannot be built up within this
amount of time, Organon XDB asks whether to try again or to end the session:
Click Yes if you want to continue, or No to quit.
If the connection is established but the target machine does not respond to a
request within the amount of time given in this field, Organon XDB assumes the
connection to be lost and quits the session, issuing an error message in the
command window.
• About: Displays the version of Organon XDB without the need to start Organon
XDB and establish a target connection.
When you dismiss the start-up window by clicking Start XDB, the debugger will
read and execute your initial batch file (if such a file was specified). Now the file
1-6
Debugging C Programs
C79000-G7076-C520-01
Organon XDB User Interface
"startup.xdb" is read and executed. This file is located in the installation directory,
and it is assumed to be written in the Organon XDB command language (see
Command Reference), like the initial batch file. After this file is processed, Organon
XDB waits for your commands if the mode was set to Interactive, or exits if in Non
Interactive mode.
1.1.2 Starting problems
During the start of Organon XDB the following problems can occur.
First is when you try to start Organon XDB a second time. Doing so the following
window appears. In this case exit the running Organon XDB.
If Organon XDB can not find the authorization for software package ProC/C++ the
following window appears. Check the ProC/C++ installation.
Debugging C Programs
C79000-G7076-C520-01
1-7
Organon XDB User Interface
1.2 Description of the Main Window
When Organon XDB is ready, its main window will appear on the screen. This main
window consists of four parts whose elements and functions are described in the
following chapters. These parts are:
(1) the menu panel
(2) the tool bar
(3) a panel with user-defined buttons — this panel exists only if there are such
buttons
(4) and the subwindow area.
Chapter 1.2 contains a detailed explanation of the menu items, followed by a
description of the tool bar. The subwindows are covered in chapter 1.3.
The status bar at the bottom of the main window shows some general information
about the status of the target task and the debugger:
1-8
Debugging C Programs
C79000-G7076-C520-01
Organon XDB User Interface
The first field contains the debug info number and the position of the execution
(source file name, function name, line number).
The second field shows the task name and the contents of the program counter.
The third field indicates the execution mode Organon XDB is in: C/C++ or PAS for
source code mode, and Asm for assembler mode. If the display is stopped (e.g. by
typing <ctrl-S>), the mode field changes to hold.
The last field is the status field, telling what Organon XDB is doing at the moment.
1.2.1 Menu Panel
The keywords in this panel give access to the menus listed below. To enter any of
these menus, click the appropriate keyword, or type <Alt x>, x being the underlined
letter in the keyword.
Example:
Organon XDB supports the high level languages C/C++ and Pascal as well as the
assembly language. To switch between these languages, perform the following
steps:
Hit <Alt L>, or click the word "Language" with the left mouse button, to get the
language menu.
Now choose one language by clicking it.
Debugging C Programs
C79000-G7076-C520-01
1-9
Organon XDB User Interface
1.2.1.1 File
The menu File offers the commands you see above. Most of them deal with the
handling of files on the host system or the target system. Using this menu, you can
load tasks, run Organon XDB command files, and load additional modules of the
target program. All your activities and the informations Organon XDB shows can be
written to protocol files for further examination. A quick method to search for certain
strings and patterns in the source code of the target program is offered, too. If you
have changed the appearance of the Organon XDB windows according to your
personal taste, you can save these changes for subsequent sessions. And if your
work is done, you can end the Organon XDB session using the last item of the
menu.
You can issue these commands by clicking them, or by hitting the underlined letter
while pushing down the <Alt> key. Some commands are linked to "hot keys" so that
they can be issued without opening the menu. You see these hot keys on the right
side of the menu. For example, you can start a search without opening the file
menu just by hitting <Alt S>.
• Load
loads the task to be debugged into the debugger. Assuming your next Organon
XDB session will deal with the same task, the information which files to load are
stored in the Windows registry and is read at the beginning of every Organon XDB
session. In other words, the values you enter now will be the default values for the
next Load.
The pop-up window that asks for the boundfile and task to be loaded looks like this:
1-10
Debugging C Programs
C79000-G7076-C520-01
Organon XDB User Interface
The boundfile is the file which contains the debug information. It is created by the
converter and has the suffix ".bd". Enter the boundfile name and the taskfile name,
then click Ok. You can quit the load mode anytime by clicking the Cancel button.
If you are not sure which file to load, the Browse button gives you the opportunity
to check the existing files. You find a detailed description of the file browser in
chapter 1.2.2.
To load a task click the Task button and enter the name of the taskfile. The task is
supposed to be on the target machine unless you activate the Download from
Debugger button in which case Organon XDB locates the taskfile on the host and
downloads it to the target.
You can connect to a task already loaded by clicking the Segment button and
entering the Loader Result Segment (which was displayed when loading or is
available through tcb low-level debugger command) and the RMOS Task ID (see
also LOAD in the Command Reference).
• Batch
asks for the batch file to be executed, and the arguments to provide it with.
A batch file is a file containing Organon XDB commands (see Command
Reference). It is a convenient way to store a list of commands you usually issue (for
example, you always set a breakpoint at the call of a certain subroutine, then let the
execution run). As the Organon XDB command language can deal with
parameters, the batch file can be given arguments these parameters are set to. The
Debugging C Programs
C79000-G7076-C520-01
1-11
Organon XDB User Interface
commands in the file are executed as if they were typed into the command window;
however, the EXIT command makes Organon XDB leave the batch file rather than
quit the session altogether.
Enter the file name into the File field, and the batch file arguments (if the batch file
expects them) into the Arguments field. When the Ok button is clicked, the
execution starts.
If the option Force single stepping is activated, the execution stops before every
command, and you are asked whether to continue:
The next line of the batch file is displayed (batch arguments and macros are
already expanded) in the command window. Click Yes (or hit <Alt Y>) to execute it,
or click Exit (resp. hit <Alt E>) to quit the execution of the batch file. Cont (or <Alt
C>) ends the single step mode, i.e. the rest of the batch file is executed without
further questions. If you want Organon XDB not to execute the command on
display but to continue the single step execution with the next command of the
batch file, click Skip (or hit <Alt S>).
If the command Organon XDB reads from the file is syntactically wrong, you are
not asked whether to execute it. Instead, Organon XDB tries to find the next
correct command in the file and continues the single step execution here.
Depending on the sort of error in the batch file, Organon XDB might skip one or
more correct commands until it finds a point to recover.
1-12
Debugging C Programs
C79000-G7076-C520-01
Organon XDB User Interface
If an error occurs during the execution of the batch file, the rest of the batch file is
still executed, unless the option Stop on errors was activated. In this case,
Organon XDB skips the rest of the batch file.
Anyway, if an error is detected in the batch file, Organon XDB issues an error
message in the command window, telling you the batch file line where this error
was found, and the sort of error detected.
You can choose among the existing batch files by clicking the Browse button. You
find a detailed description of the file browser in chapter 1.2.2.
• Set Module
shows a list of the modules of the task to be debugged.
The display shows the names of the available modules and their memory
addresses. By a double-click the module is loaded. The source window (see
chapter 1.3.2) shows the source code of this module, and the scope is set
appropriately.
If you click the window with the right mouse button the following menu appears.
Debugging C Programs
C79000-G7076-C520-01
1-13
Organon XDB User Interface
• Search
This menu item searches for a specified pattern in the source code of the module
displayed in the source window. If the end of the module is encountered, a
message is issued in the command window, and the search starts at the top again.
The metacharacters "?" (matches any character) and "*" (matches any string) are
recognized.
The source window displays the appropriate part of the source code, coloring the
line containing the matching string in the enhanced color (see menu item "Options /
Edit Colors", chapter 1.2.1.6).
Note that the search always starts at the beginning of the source code unless you
search again for the same pattern (in which case the search starts at the line after
the one where the last matching string was found).
The search algorithm distinguishes between uppercase and lowercase unless
Organon XDB was started with the option Convert symbols to upper case.
Examples:
Search for all strings starting with "t", followed by two unspecified characters and a
"s". This search will find the strings "this", "those", "it is", for example.
Search for an ampersand ("&") and a semicolon which are separated by an
unknown number (possibly 0) of unknown characters, i.e. letters, digits, spaces, etc.
The following strings (and many more) match this search pattern:
1-14
Debugging C Programs
C79000-G7076-C520-01
Organon XDB User Interface
&;
&x;
& pointer_7 ;
• Open Protocol
opens an output file to protocol the debug session. This feature enables you to write
important informations into files for further examination. Choose between the
following protocol modes:
All to get a complete protocol. All information is just written into this protocol, even if
some of the other protocols are opened.
Command to protocol the commands given in the command window (see chapter
1.3.1).
Source to copy the source code lines executed into the protocol file.
Assembler to protocol the executed line of the assembler window (see chapter
1.3.3).
Trace to copy the contents of the trace window (see chapter 1.3.9).
Evaluate to protocol general information messages (as opposed to error
messages) as shown in the command window (see chapter 1.3.1).
Error to protocol all error messages.
Debugging C Programs
C79000-G7076-C520-01
1-15
Organon XDB User Interface
Click the type of protocol you want, and the file browser (see chapter 1.2.2.1) is
invoked. Choose the directory where you want the protocol file to be in, then enter
the file name.
Example:
You have already opened an assembler protocol. Now you wish to protocol the
commands you want to issue. After hitting <Alt F> and <Alt P> (or clicking the
appropriate keywords), you see this:
You see the menu File and its submenu Open Protocol. The keyword Assembler
is disabled because this protocol is opened already.
Now click the keyword Command or type <Alt C> to open the protocol file.
Imagine the source window looking like this:
1-16
Debugging C Programs
C79000-G7076-C520-01
Organon XDB User Interface
Now you perform the following steps:
You open a source code protocol file by hitting <Alt F> <Alt P> <Alt S> before you
type
step;
eval d0
into the command window. After examining the value of the variable d0 you click the
line 168 in the source window, then you hit <ctrl-N> (shortcut for Run until) to let
the execution continue to this line. After you end the session by typing "exit", the
command protocol file looks like this:
! ! creation date: Thu Feb 9 14:23:51 1995
SET PROTFILE/WINDOW=SOURCE/OVERWRITE "C:/ORGANON/CHECK/PROT.SRC"
step; eval d0
run until @line 168
exit
The source protocol file contains the lines where the execution stopped:
!(SRC) creation date: Thu Feb
!
!(SRC) CRM\@line 164
!(SRC)
d0.flgs = 1;
!(SRC) CRM\@line 168
!(SRC)
pd0 = &d0;
9 14:24:41 1995
/* These flags dictate
*/
The assembler protocol contains the assembler instructions where the execution
stopped (or nothing if the assembler window was hidden):
!(ASM) creation date: Thu Feb 9 14:20:16 1995
!
!(ASM) 0188:0000001D: C7 05 70 00
MOV DWORD PTR DS:MAIN+$00000070,$00000001
!(ASM) 0188:00000045: C7 05 90 00
MOV DWORD PTR DS:MAIN+$00000090,$00000054
Debugging C Programs
C79000-G7076-C520-01
1-17
Organon XDB User Interface
• Open Logfile
All commands written into the command window are copied into the logfile so that it
can be used later as a batch file to repeat the session. Some restrictions apply
when using logfiles as batch files if XDB works in the multitasking mode. If you
issue this command, the file browser (see chapter 1.2.2.1) is invoked. Choose the
appropriate directory, then enter a file name. Because opening a logfile that existed
already will destroy the contents of the old file, you will be asked to confirm this.
• Close Logfile
Closes the logfile. None of the following commands will appear in the logfile.
• Save Settings
Saves the colors, fonts, and window positions for subsequent sessions. These
informations are written into the Windows registry. You are asked to confirm this to
avoid an accidental change.
• Exit
Ends the Organon XDB session, closing all output files still open. You are asked to
confirm the exit to assure you really want to leave Organon XDB.
1-18
Debugging C Programs
C79000-G7076-C520-01
Organon XDB User Interface
1.2.1.2 Display
This menu allows the opening (or closing, if already open) of several subwindows.
For a detailed description of these windows see chapter 1.3. Windows are
checkmarked in this menu if they are currently open.
You can open/close these subwindows by clicking their names in the menu, or by
hitting the underlined letter while pushing down the <Alt> key. For example, hit
<Alt A> to open the assembler window.
• Source
Displays or hides the source window which shows the source code of the task you
debug.
• Assembler
Displays or hides the assembler window which shows the assembly code of the
task you debug.
• Register
Displays or hides the register window.
• Remote
Displays or hides the remote system window which gives access to the target
system.
Debugging C Programs
C79000-G7076-C520-01
1-19
Organon XDB User Interface
• Task
Displays or hides the task window which shows all the tasks XDB knows about.
• Memory
Choosing this item causes the creation of a new memory window. Note that more
than one memory window may be open.
When you select the item „Memory“, the following dialog box pops up:
Enter the memory address and choose the size and the format the memory
contents are to be displayed in. The Browse button summons the XDB symbol
browser. You find a detailed description of the symbol browser in chapter 1.2.2.
Updating the memory window automatically whenever the contents of the memory
are changed might reduce the performance; thus you can choose whether the
memory window is to be updated automatically by activating the Auto Update
checkbutton.
If the start address of the memory window is not a constant expression, you may
want the memory window to follow whenever the value of the expression changes.
In this case, activate the Based checkbutton to set the memory window to the socalled based mode.
Example:
Define a debugger variable called MEMSTART with the initial value 3 by issuing the
following line in the command window:
DEFINE SYMBOL /VALUE=3 MEMSTART
1-20
Debugging C Programs
C79000-G7076-C520-01
Organon XDB User Interface
Now create a memory window in based mode with the start address
0x1000 * @MEMSTART
and the new memory window starts at address 0x3000. Now change the value of
the variable by typing
SET VALUE @MEMSTART = 5
into the command window, and the memory window displays the memory starting at
address 0x5000.
• CPU-Structures
This item enables you to manipulate some CPU-specific data. This feature is
available for Intel processor targets only. See chapter 1.4 for a detailed description.
• I80386EX Registers
This item enables you to manipulate some CPU-specific data. This feature is
available for Intel 386EX targets only.
1.2.1.3 Run
This menu offers several ways to execute the target program. The execution can be
continuous or stepwise. You can also issue commands to the host system. If the
connection between host and target is noisy, it can be reestablished.
You can issue these commands by clicking them, or by hitting the underlined letter
while pushing down the <Alt> key. Some commands are linked to "hot keys" so that
Debugging C Programs
C79000-G7076-C520-01
1-21
Organon XDB User Interface
they can be issued without opening the menu. You see these hot keys on the right
side of the menu. For example, you can start the execution without opening the
Run menu just by hitting <ctrl-R>.
• Run
Execute the target program. The execution stops if a breakpoint or watchpoint is
encountered.
• Run until ...
Executes the target program until a certain condition is true. Possible conditions are
Line: The execution reaches the specified line of code (Note that this line is not
executed).
Expression: The location denoted by the expression is reached. The execution
stops immediately before this location is executed. For example, if the current line
(i.e. the next line to be executed) is line 100, the expression
@LINE ( @SOURCELINE + 10 )
makes Organon XDB continue the execution until line 110 is reached.
Blockend: The end of the block is reached. A block is a number of statements
which are bundled together, e.g. statements enclosed in braces ("{}") in a C
program.
Procend: The end of the procedure is reached. The next step of execution will be
the jump back to the calling routine. If this command is issued while the execution is
in the main routine, it continues until the end of the program is reached.
Caller: Run until the calling routine is reached (useful in subroutines only).
1-22
Debugging C Programs
C79000-G7076-C520-01
Organon XDB User Interface
If the condition is true already when you issue this command (e.g. run until line 50
when the current line is line 50), the execution stops immediately, i.e. nothing is
done.
Note that the execution stops if a breakpoint or a watchpoint is encountered
regardless of the condition you chose.
Example:
As the line pointer of the source window marks the source code line 168, Organon
XDB suggests to execute until this line. You can confirm this by clicking the Ok
button or hitting <Return>, or you can enter another line number or choose any
other condition. Browse invokes the symbol browser which is explained in chapter
1.2.2.2.
By default, the Line checkbutton is activated. You can enter the line number and
click the Ok button, or choose one of the other conditions. Browse invokes the
symbol browser which is explained in chapter 1.2.2.2.
• Step
Execute the next instruction. If a subroutine call is encountered, the execution stops
at the first instruction of the subroutine. If Organon XDB is in assembler mode,
“instruction“ means “assembler instruction“, otherwise the next source code
instruction is executed.
Debugging C Programs
C79000-G7076-C520-01
1-23
Organon XDB User Interface
• Next
Execute until the next line of code. If a subroutine call is encountered, the whole
subroutine is executed. If Organon XDB is in assembler mode, “line of code“
means “assembler instruction“, “source code line“ otherwise.
• Recapture
Organon XDB tries to restore the current situation. Therefore Organon XDB
disregards the current status information (e.g. register values, task states) and does
an update from the target. Useful if the connection between host and target is noisy.
This functionality is also available via the command SET TASK /SET (see
Command Reference).
• Spawn
Opens a window in which a command to the host system can be issued. Type the
command into the pop-up window, then click Ok, and the command will be
transferred to the command interpreter of your host machine.
1-24
Debugging C Programs
C79000-G7076-C520-01
Organon XDB User Interface
1.2.1.4 Debug
The menu items described in this chapter allow you to evaluate expressions (and
watch the variables of the target program), display the stack of procedure calls, and
to manipulate breakpoints, watchpoints, and tracepoints (features which are
explained also in this chapter).
You can issue these commands by clicking them, or by hitting the underlined letter
while pushing down the <Alt> key. Some commands are linked to "hot keys" so that
they can be issued without opening the menu. You see these hot keys on the right
side of the menu. For example, you can set a breakpoint without opening the
Debug menu just by hitting <ctrl-B>.
• Evaluate
The user is asked to enter an expression to be evaluated. The result is shown
either in the command window or in an evaluation window (see chapters 1.3.1 and
1.3.7). In the former case the evaluation takes place only once while in the latter
case every subsequent change of the result is visible.
The symbols known at this time and scope can be obtained with the Browse
button. You find a detailed description of the symbol browser in chapter 1.2.2.
Organon XDB allows you to write expressions in more than one language. Open
the "Language" menu to see which languages are available. The language
Organon XDB expects is checkmarked. To change to another language, click the
language name.
Debugging C Programs
C79000-G7076-C520-01
1-25
Organon XDB User Interface
Enter the expression you want to be evaluated, using the current language. Choose
the format you like the result to be in. If the expression denotes a pointer to a
character string or a character array, ascii might be useful. If you choose ascii, you
may enter the number of characters to be displayed into the Length field.
Memory access: Some processors allow byte-wise or word-wise memory access
only. If your target processor behaves this very restrictive way, click the sort of
access it accepts. In most cases, default works fine.
Level: If the expression denotes a structure containing sub-structures, you can
specify how many levels to step down into the structure.
Note that arrays may be evaluated partially, e.g. if A is an array of appropriate
length, A[2..5] denotes the elements 2, 3, 4, and 5.
If you click the Ok button, the result is printed to the command window. If you click
the Window button instead, an evaluation window is created.
• Set Breakpoint
When debugging a program, you may wish the program to stop at a certain line of
code so you can examine the state it is in (e.g. the value of a variable). This
stopping is done by setting a breakpoint.
Similar to the SET BREAKPOINT command described in the Command Reference,
a breakpoint can be defined by giving its Location (default: current line), possibly
followed by a Condition (identical to SET BREAKPOINT option WHEN), a list of
1-26
Debugging C Programs
C79000-G7076-C520-01
Organon XDB User Interface
Actions, and a Skip number. The condition must be written in the current language
(see chapter 1.2.1.5).
The execution of the target program stops when the location denoted by the
expression in the Location field is reached and the Condition is true. If a positive
Skip number was specified, every (n+1)st encounter of the breakpoint only will
cause a stop (n being the Skip number). For example, a breakpoint with the Skip
number 2 would stop the execution when encountered for the third, sixth, ninth, ...
time.
Actions may contain a list of Organon XDB commands. When the execution is
stopped by the breakpoint, these commands are processed. If the Continue
checkbutton is activated, the execution of the target program will continue after
processing the Actions list.
Symbol: The breakpoint can be given a symbolic name which can be used as a
debugger variable in commands.
Note that the breakpoint is supposed to be at the beginning of the line. For
example, a breakpoint at source code line 100 will stop the program after line 99
was executed.
By default, Organon XDB implements breakpoints by software interrupts, which are
inserted into the code. If you want to use processor-maintained breakpoints only,
choose the Hard option. This is especially useful when the program code to be
debugged is stored in EPROM.
Browse shows, as usual, a list of the known symbols. You find a detailed
description of the symbol browser in chapter 1.2.2. Click Ok to create the
breakpoint, or Cancel to cancel the operation.
Debugging C Programs
C79000-G7076-C520-01
1-27
Organon XDB User Interface
• Edit Breakpoints
This is useful when details of existing breakpoints are to be changed. The pop-up
window shows all existing breakpoints:
The breakpoints are displayed in the following form:
<n> : <p1> (<p2>) [WHEN <cond>] : <status>
(S=<skip>, CS=<current_skip>, [A,] [C,] [HW=<hard>,] <scope>)
[(@SYMBOL=<name>)] [THEN <actions> END]
where <n> is the id number of the breakpoint.
<p1> and <p2> are the location in the source code resp. assembler code.
<cond> is the condition (if a condition was specified).
<status> may be enabled, disabled, or current. The latter indicates that the
execution is halted due to this breakpoint.
<skip> is the skip number.
<current_skip> indicates how many times this breakpoint will be skipped until it
stops the execution. I.e. whenever this breakpoint is encountered, <current _skip>
is decremented by one until it reaches zero. Now the execution is halted, and
<current _skip> is set to <skip> again.
A indicates that a non-empty list of actions is attached to the breakpoint.
C is displayed if the option “Continue“ is set.
1-28
Debugging C Programs
C79000-G7076-C520-01
Organon XDB User Interface
<hard>: If the breakpoint is a hardware breakpoint, this is its internal number.
<scope> is S for space usually. <scope> can be T for task or G for global, too.
<name>: If a symbolic name was given to the breakpoint, it is displayed here.
<actions>: If a list of actions is attached to the breakpoint, it is displayed here.
Note that the condition of a breakpoint, if existent, is always written in the current
language (see chapter 1.2.1.5) no matter in which language it was entered in the
creation of the breakpoint.
Disable disables the breakpoint, i.e. while the breakpoint still remains existent, the
execution does not stop here. Of course, disabled breakpoints can be enabled
again by clicking the Enable button (which is visible only if you click a disabled
breakpoint).
Delete and Delete all delete the breakpoint marked by inverted color display resp.
all existing breakpoints.
Modify allows the change of the details of the specified breakpoint. Just click the
item you want to change and edit it. Note that the condition, if existent, must follow
the rules of the current language (see chapter 1.2.1.5).
Like in Set Breakpoint (see above), the ability to Browse is given. You find a
detailed description of the symbol browser in chapter 1.2.2.
Debugging C Programs
C79000-G7076-C520-01
1-29
Organon XDB User Interface
• Set Watchpoint
When debugging a program, you may wish the program to stop whenever a certain
piece of memory is accessed. This stopping is done by setting a watchpoint.
A watchpoint is set by specifying its symbolic address (the Location), the Length
of the memory in bytes to be watched (4 by default), and the Access mode (default:
All). A Skip number can also be issued (see below). Browse gives a list of usable
symbolic addresses (see chapter 1.2.2 for a detailed description of the symbol
browser). The watchpoint can be given a Symbol, or name, for easy access in
commands.
If the hardware interface supports real time watchpoints including all the specified
conditions, the program runs on full execution speed. If not, XDB must simulate
them by maintaining a list of watched memory pieces and looking whether they are
accessed. If you want to use processor-maintained watchpoints only, choose the
Hard option.
The execution of the target program stops when the watched piece of memory is
accessed in the specified way. If the Skip number is n, n > 0, the execution stops at
every (n+1)st access. For example, a watchpoint with the Skip number 2 and the
access mode "write" would stop the execution at the third, sixth, ninth, ... attempt to
write into the watched memory. If a list of Organon XDB commands was entered
into the Actions field, these commands are processed upon the encounter of the
watchpoint. If the checkbutton Continue was activated, the execution continues
after the processing of the Actions list (see also SET WATCHPOINT command in
the Command Reference).
1-30
Debugging C Programs
C79000-G7076-C520-01
Organon XDB User Interface
• Edit Watchpoints
This item shows the list of existing watchpoints. To change them, choose one and
click the Modify button.
Disable disables the watchpoint, i.e. while the watchpoint still remains existent, the
execution does not stop when the watched piece of memory is accessed. Of
course, disabled watchpoints can be enabled again (The Enable button is visible
only if you click a disabled breakpoint).
Delete and Delete all delete the watchpoint marked by inverted color display resp.
all existing watchpoints.
The watchpoints are displayed in the following form:
<n> : <pos1> (addr=<pos2>, len=<length>, acc=<access>) :
<status>
(S=<skip>, CS=<current_skip>, [A,] [C,] [HW=<hard>,] )
[(@SYMBOL=<name>)] [THEN <actions> END]
where <n> is the id number of the watchpoint.
<pos1> and <pos2> are the location in the source code resp. assembler code.
<length> is the length (in bytes) of the watched memory.
<access> can be R for read, W for write, F for fetch, or X for all.
<status> may be enabled, disabled, or current. The latter indicates that the
execution is halted due to this watchpoint.
Debugging C Programs
C79000-G7076-C520-01
1-31
Organon XDB User Interface
<skip> is the skip number.
<current_skip> indicates how many times this watchpoint will be skipped until it
stops the execution. I.e. whenever this watchpoint is encountered, <current _skip>
is decremented by one until it reaches zero. Now the execution is halted, and
<current _skip> is set to <skip> again.
A indicates that a non-empty list of actions is attached to the watchpoint.
C is displayed if the option “Continue“ is set.
<hard>: If the watchpoint is a hardware maintained watchpoint, this is its internal
number.
<name>: If a symbolic name was given to the watchpoint, it is displayed here.
<actions>: If a list of actions is attached to the watchpoint, it is displayed here.
• Set Tracepoint
Similar to watchpoints, tracepoints can be used to watch a piece of memory, e.g. a
variable. A trace window is opened for every tracepoint, and the value stored in the
memory to be traced is displayed. Unlike breakpoints or watchpoints, the encounter
of a tracepoint does not stop the execution.
Enter the location into the Location field.
If the hardware interface supports real time tracepoints including all the specified
conditions, the program runs on full execution speed. If not, XDB must simulate
them by maintaining a list of set tracepoints and looking whether the execution
changed one of them. But looking for these events at every step of execution is
rather time-consuming, slowing down the execution speed. If you want to use
1-32
Debugging C Programs
C79000-G7076-C520-01
Organon XDB User Interface
processor-maintained tracepoints only to enhance the performance, click the Hard
checkbutton (see also SET TRACEPOINT command in the Command Reference).
As always, Browse shows all known symbols. You find a detailed description of the
symbol browser in chapter 1.2.2.
• Edit Tracepoints
This menu item shows all existing tracepoints and offers the opportunity to Modify
them.
Disable disables the tracepoint, i.e. while the tracepoint still remains existent, a
change of the traced memory is not displayed. Of course, disabled tracepoints can
be enabled again by clicking the Enable button (which is visible only if you click a
disabled tracepoint).
Delete and Delete all delete the tracepoint marked by inverted color display resp.
all existing tracepoints.
The tracepoints are displayed in the following form:
<n> : <pos1> [ (addr=<pos2>) ] : <status> [ (HW=<hard>) ]
where <n> is the id number of the tracepoint.
<pos1> is the symbolic address to be traced.
<pos2> is the memory address.
<status> is either enabled or disabled.
<hard>: If the tracepoint is a hardware maintained one, this is its internal number.
Debugging C Programs
C79000-G7076-C520-01
1-33
Organon XDB User Interface
• Calls
The stack of procedure calls is displayed. The procedures are listed with their
names, addresses, and arguments.
To change the scope of symbols visible to Organon XDB, click one of the
procedures, then click the Set Scope button. An alternative way to set the scope is
to doubleclick the procedure line. Note that continuing the execution changes the
scope back to the procedure being executed.
For performance reasons, the procedure arguments are shown only if you ask for
them. Click the Arguments button, and the windows changes to:
1-34
Debugging C Programs
C79000-G7076-C520-01
Organon XDB User Interface
1.2.1.5 Language
The expressions entered for evaluation as well as the breakpoint conditions are, by
default, assumed to be C expressions. You can switch to another language by
clicking it, or by hitting the underlined letter while pushing down the <Alt> key (for
example, hit <Alt P> to set the language to Pascal). This menu allows you to
change to the following languages:
• C/C++
Note that expressions with side effects (like "++i") don't make much sense in this
context, and are not supported. Apart from that, Organon XDB follows the ANSI
standard.
• Pascal
Organon XDB follows the standard as described by K. Jensen and N. Wirth.
• Assembler
When setting the language to Assembler, the assembler window is displayed
automatically.
The checkmark in the menu window marks the language Organon XDB expects.
Note that Organon XDB works in either source code mode or assembler mode.
The mode influences e.g. the execution of the command STEP (see chapter 1.2.1.3
or Command Reference). The only way to switch to assembler mode is to set the
language to Assembler. To switch back to source code mode, change the language
to any of the high level languages.
Debugging C Programs
C79000-G7076-C520-01
1-35
Organon XDB User Interface
1.2.1.6 Options
This set of commands allows you to customize and adapt Organon XDB, according
to your taste and needs. You can change the size and color of texts displayed,
create new buttons, or redefine the function keys of your keyboard. The advanced
user will find a quick and convenient way to manipulate the command language
macros, and to change some details in the behaviour of Organon XDB.
You can issue these commands by clicking them, or by hitting the underlined letter
while pushing down the <Alt> key. Some commands are linked to "hot keys" so that
they can be issued without opening the menu. You see these hot keys on the right
side of the menu. For example, you can create a button without opening the
Options menu just by hitting <ctrl-U>.
• Options
You can switch on/off the following options:
1-36
Debugging C Programs
C79000-G7076-C520-01
Organon XDB User Interface
Use mixed assembly window
The mixed assembly window does not only show the assembler code but also the
next source code line to be executed. This option is switched off by default.
Format for pointers
When displaying a character pointer in an evaluation window, the value it points to
can either be displayed as a hexadecimal number or as a character (which is the
default).
Automatic debug loading
When the execution steps into another module, this module is loaded automatically
if this option is switched on (which is the default value). Otherwise, you are asked
whether to load it. If you refuse to load it, the step command will execute until the
next line of the currently loaded module.
Show tracepoint time
If this option is switched on, the actual time is shown whenever the memory
watched by a tracepoint is changed. The option is switched off by default.
Attach segments
Can be set to Local (default) or Global. In the latter case, all segments specified at
initial load (or loaded with the menu item "File / Load") are attached to the global
segment map. Otherwise, loaded segments are attached to the current task.
Assign tasks
Can be set to Local or Global (default). In the Global mode, all target system tasks
are assigned to one virtual debugger task; otherwise, all tasks are monitored
separately.
Debugging C Programs
C79000-G7076-C520-01
1-37
Organon XDB User Interface
• Keys
You can use the function keys to store commands. The menu item "Options / Keys"
shows the strings connected to the function keys so far. You can change them by
using the Modify button. If you want the string to contain a newline, write "\n"
instead. To delete a key, mark it by clicking it, then click Delete.
Whenever you hit a function key, the text connected to it is written into the
command window.
To create a new key assignment select an unused key from the list and klick the
Modify button. The F10 function key is assigned with the default Windows key
definition and may not be changed. The following window appears.
Enter the command into the Command field. When you are finished, click Ok.
1-38
Debugging C Programs
C79000-G7076-C520-01
Organon XDB User Interface
• Macros
The Organon XDB command language is a powerful tool, containing features like
loops and macros. This menu item allows the convenient manipulation of macros.
Mark the macro you wish to modify or delete by using the mouse or the cursor keys,
then click the Delete resp. Modify button. See Command Reference for a
description of macros in the command language.
Modify allows you to change the command list connected to the macro.
To create a new macro, click the Add new button (or hit <Alt A>). The following
window appears:
Enter the macro name into the Name field and the macro body into the Command
field. When you are finished, click Ok.
Debugging C Programs
C79000-G7076-C520-01
1-39
Organon XDB User Interface
Button:
When adding a new macro to the list, you have the option to create a button with
the same name. To do so, click the checkbutton Button. If the macro contains
parameters, you will be asked to provide them upon activation of the button.
Note that modification or deletion of the macro deletes the appropriate button while
manipulation of the button (see below, menu item "Options / Buttons") has no effect
on the macro.
• Buttons
Organon XDB allows you to define additional buttons and to link them to lists of
commands. Whenever one of these user-defined buttons is clicked, its command
list is issued into the command window and processed as if it was typed there. The
menu item "Options / Buttons" shows the names of all user-defined buttons and
their respective command lists, and gives you opportunity to delete or modify them,
or to create a new button. To delete or modify an existing button, mark it with a
mouse click or with the cursor keys, then click the Delete resp. Modify button.
Modify allows you to change the command list connected to the button.
1-40
Debugging C Programs
C79000-G7076-C520-01
Organon XDB User Interface
Add new asks for the name and command list of a button to be created:
Enter the name of the button to be created into the first field. Type the command list
in the second field. If you try to write a newline into the command list, Organon XDB
takes this as a signal that the creation or modification is completed. If you want the
command list to end with a newline, write "\n" instead. If the list contains more than
one command, separate them by a semicolon rather than a newline or "\n".
The resulting buttons are placed in the bar below the tool bar:
• Source path
Organon XDB assumes the source files of the task to be debugged to be in the
working directory. If this is not the case, or if the sources are placed in different
directories, you can tell Organon XDB where to look for them.
Click Add new to enter another source path.
Debugging C Programs
C79000-G7076-C520-01
1-41
Organon XDB User Interface
You can enter the complete path (i.e. the whole way from the root directory down);
otherwise, the path is assumed to be relative to the working directory you specified
when you started Organon XDB.
• Window updates
This menu item allows you to determine when to check the content of Evaluation or
Memory Window and when to update it. This item is applicable only in
asynchronous mode. Repeat Time specifies the period after which XDB checks the
window contents. Update Rate specifies the number of check operations after
which a recognized change will be updated.
• Select font
As the name implies, this menu item allows you to change the font and the size of
the displayed text. This change is effective in this session only unless you make it
permanent by activating the menu item "File / Save Settings".
1-42
Debugging C Programs
C79000-G7076-C520-01
Organon XDB User Interface
• Edit colors
You don't like the color of the texts in the subwindows? Choose this menu item, and
change to your favorite color. This change is effective in this session only unless
you make it permanent by activating the menu item "File / Save Settings".
Some texts are written in a different color to get your attention, e.g. a register value
that changed during the last instruction. This is called the enhanced color, and you
can change it, too.
Debugging C Programs
C79000-G7076-C520-01
1-43
Organon XDB User Interface
1.2.1.7 Windows
While you are free to move the subwindows in the subwindow area, this menu
enables you to arrange them quickly in one of these ways:
• Tile
All windows are visible, no window is fully or partially hidden by another one.
• Cascade
The windows are resized and positioned along the diagonal across the area, one on
top of the other, so that their upper left corners are visible.
1-44
Debugging C Programs
C79000-G7076-C520-01
Organon XDB User Interface
• Arrange Icons
Like all windows, the subwindows can be iconized. While you are free to arrange
the icons everywhere within the subwindow area, this menu item rearranges them
along the lower edge of the subwindow area. Note that icons of windows being
open in the moment are rearranged, too.
• Other Subwindows
The lower part of the menu shows a list of all subwindows being on display, open or
iconized, in the moment. The active subwindow is checkmarked in the list. If you
click the name of a subwindow, this window is activated, i.e. positioned on top (and
opened if it was iconized).
You can issue these commands by clicking them, or by hitting the underlined letter
or digit while pushing down the <Alt> key. For example, hitting <Alt A> rearranges
the subwindow icons while hitting <Alt 3> would activate the third subwindow (in the
picture at the beginning of this chapter, this would be the assembler window).
1.2.1.8 Help
While working with Organon XDB, you can get online help. Choose one of the
following items by clicking it or by hitting <Alt x>, x being the underlined letter in the
menu. For example, hitting <Alt H> has the same effect as clicking Using Help.
• Reference manual
Invokes the interactive help mechanism which corresponds to the Command
Reference.
Debugging C Programs
C79000-G7076-C520-01
1-45
Organon XDB User Interface
• Using Help
Choose this if you have no experience with online help. It offers a good introduction
how to work with this feature.
• About
General information about Organon XDB.
1.2.2 Browsers
Browsers are mechanisms that help you to look over a set of items, and to choose
one of them. Several features of Organon XDB allow you to browse e.g. the files of
your host system. These browse mechanisms are described in this chapter.
1.2.2.1 The Windows® File Browser
Some commands, like reading a batch file, require you to enter a file name. If you
are unsure which file is the one to use, you can use the Browse function to get a
list of available files. Note that this function is not a Organon XDB builtin but a
Windows® library function.
1-46
Debugging C Programs
C79000-G7076-C520-01
Organon XDB User Interface
This is the pop-up window you see after clicking the Browse button. The three
fields on the left side help you to choose among the files in the directory you
browse. The lower left field shows the suffix Browse looks for. You can change this
suffix by clicking the arrow on the right side of the subwindow, then clicking the
appropriate suffix (or "*.*", matching all suffixes) in the menu that appears. Now the
middle left field shows all files with the suffix you chose. Click the file you want to
load, or enter the file name into the upper left field. As a last step, click the OK
button, and the chosen file will be loaded.
Maybe the file you look for is in another directory, maybe even on another disk. In
this case, you have to find the correct directory first, using the fields on the right
side. Choose the disk drive in the lower right field (first click the arrow, then click the
appropriate disk drive). The upper right field shows the available directories.
Doubleclick a directory to open it. When you have found the right directory, perform
the steps described above to select the right file.
Note that opening an existing file for writing will destroy the contents of this file;
therefore, the browser asks you to confirm this to avoid accidental destruction of
important data.
1.2.2.2 The Organon XDB Symbol Browser
When the compiler transforms your program into assembler code, it marks some of
the more interesting points (e.g. subroutine entry points, or the location of a
variable) by giving them an internal name, or symbol. In the case of variables and
Debugging C Programs
C79000-G7076-C520-01
1-47
Organon XDB User Interface
subroutines, these symbolic names are derived from the names you use in the
source code.
Sometimes Organon XDB expects you to enter a symbol name. The symbol
browser can give you an overview over the known symbols, and helps you to
choose one. The symbols are shown with their task, module, and symbol name,
together with their addresses.
The fields on the right side help you to change the set of visible symbols.
You can change the scope level by clicking the scope level you want: Procedure
for all symbols within this subroutine, Module for all symbols within the current
module, and Global for all symbols. Current (which is the default value) sets the
scope level according to the current state of execution. You can also set the scope
level by hitting the <Alt> key and the underlined letter, e.g. <Alt R> for Procedure.
To reduce the set of symbols displayed on the left side, you may write a pattern into
the Pattern field. Finish the pattern entry by pressing <Tab>. Similar to the menu
item "File / Search", a pattern consists of characters (letters, digits, etc) which are
recognized as such, and meta-characters which have a special meaning. In this
case, the metacharacters "?" (matches any character) and "*" (matches any string)
are recognized. For example, the symbols "PD0", "PD1", and "PDX" match the
pattern "PD?", while "*D0" is matched by "D0" and "PD0". The default pattern, "*",
matches every symbol.
1-48
Debugging C Programs
C79000-G7076-C520-01
Organon XDB User Interface
If you click the Select functions only box, only symbols denoting subroutines are
shown.
Now enter the symbol name into the Symbol field, or click the symbol on display,
then click the Ok button (or hit <Alt O>). You can dismiss the symbol browser
anytime you want by clicking the Cancel button (or hitting <Alt C>).
1.2.3 Buttons
While you can use the full capacity of Organon XDB by typing commands into the
command window, some of the most important commands are attached to predefined buttons; thus, you can issue them by a single click. Clicking a button with
your left mouse button activates the command while a click with the right mouse
button summons a brief explanation text.
Organon XDB checks whether the use of the buttons is meaningless in the current
situation (e.g. search for a pattern when the source window is not visible), and
disables buttons whose use would make no sense in the moment.
Tool Bar
1.2.3.1 Load
This button is identical to the menu item "File / Load" which is explained in detail in
chapter 1.2.1.1.
Debugging C Programs
C79000-G7076-C520-01
1-49
Organon XDB User Interface
1.2.3.2 Search
This button is identical to the menu item "File / Search".
This command searches for a specified pattern in the source code of the module
displayed in the source window. If the end of the module is encountered, a
message is issued in the command window, and the search starts at the top again.
The metacharacters "?" (matches any character) and "*" (matches any string) are
recognized.
The source window displays the appropriate part of the source code, coloring the
line containing the matching string in the enhanced color (see menu item "Options /
Edit Colors", chapter 1.2.1.6).
Note that the search always starts at the beginning of the source code unless you
search again for the same pattern (in which case the search starts at the line after
the one where the last matching string was found).
The search algorithm distinguishes between upper case and lower case unless
Organon XDB was started with the option Convert symbols to upper case.
Examples:
Search for all strings starting with "t", followed by two unspecified characters and a
"s". This search will find the strings "this", "those", "it is", for example.
1-50
Debugging C Programs
C79000-G7076-C520-01
Organon XDB User Interface
Search for an ampersand ("&") and a semicolon which are separated by an
unknown number (possibly 0) of unknown characters, i.e. letters, digits, spaces, etc.
The following strings (and many more) match this search pattern:
&;
&x;
& pointer_7 ;
1.2.3.3 Step
This button is identical to the menu item "Run / Step". It tells Organon XDB to
execute the next instruction. If this instruction is a subroutine call, the execution
stops at the first instruction of the subroutine.
1.2.3.4 Next
This button is identical to the menu item "Run / Next". XDB continues the execution
until the next line of code. If a subroutine call is encountered, the whole subroutine
is executed.
1.2.3.5 Run
The execution of the target program is continued, beginning with the current line
(the line printed in inverted color in the source window). The execution stops if a
breakpoint or watchpoint is encountered.
This button is identical to the menu item "Run / Run".
Debugging C Programs
C79000-G7076-C520-01
1-51
Organon XDB User Interface
1.2.3.6 Recapture
This button is identical to the menu item "Run / Recapture". Organon XDB tries to
restore the current situation. Therefore Organon XDB disregards the current status
information (e.g. register values, task states) and does an update from the target.
1.2.3.7 Set Scope Up
If the execution enters a subroutine, the scope is set to this subroutine, i.e. the
source window shows the source code of this subroutine, and only the symbols
(variable names etc.) visible within this subroutine are accessible by the symbol
browser (see chapter 1.2.2.2). Clicking this button moves the scope one level
upward, i.e. to the calling routine. The symbols known there are accessible now,
and the source window shows the text of this calling routine, the line containing the
subroutine call being the current line.
1.2.3.8 Set Scope Down
If the execution enters a subroutine, the scope is set to this subroutine, i.e. the
source window shows the source code of this subroutine, and only the symbols
(variable names etc.) visible within this subroutine are accessible by the symbol
browser (see chapter 1.2.2.2). The scope can be changed by the menu item
"Debug / Calls". Clicking this button moves the scope one level downward, i.e. from
the calling routine to the called one. The symbols known there are accessible now,
and the source window shows the text of this routine.
1-52
Debugging C Programs
C79000-G7076-C520-01
Organon XDB User Interface
1.2.3.9 Set Scope Here
If the execution enters a subroutine, the scope is set to this subroutine, i.e. the
source window shows the source code of this subroutine, and only the symbols
(variable names etc.) visible within this subroutine are accessible by the symbol
browser (see chapter 1.2.2.2). The scope can be changed by the menu item
"Debug / Calls". Clicking this button moves the scope back to the active subroutine,
i.e. the one being executed in the moment. The symbols known there are
accessible now, and the source window shows the text of this calling routine, the
line to be executed next being the current line.
1.2.3.10 Display/Hide Source Window
As the name suggests, this button displays the source window if it is hidden, or
hides it if it is displayed already. Identical to the menu item "Display / Source". The
source window is explained in chapter 1.3.2.
1.2.3.11 Display/Hide Assembler Window
Hides or displays the assembler window. See chapter 1.3.3 for a description of this
window.
1.2.3.12 Display/Hide Register Window
Like the menu item "Display / Register", this button hides or displays the register
window (which is explained in chapter 1.3.4).
Debugging C Programs
C79000-G7076-C520-01
1-53
Organon XDB User Interface
1.2.3.13 Display/Hide Task Window
Like the menu item "Display / Task", this button hides or displays the task window .
1.2.3.14 Display/Hide Remote System Window
Displays or hides the remote system window (see chapter 1.3.6), like the menu item
"Display / Remote".
1.2.3.15 Evaluate
Does the same as the menu item "Debug / Evaluate". The user is asked to enter an
expression to be evaluated. The result is shown either in the command window or
in an evaluation window (see chapters 1.3.1 and 1.3.7). In the former case the
evaluation takes place only once while in the latter case every subsequent change
of the result is visible.
The symbols known at this time and scope can be obtained with the Browse
button. You find a detailed description of the symbol browser in chapter 1.2.2.
Organon XDB allows you to write expressions in more than one language. Open
the "Language" menu to see which languages are available. The language
Organon XDB expects is checkmarked. To change to another language, click the
language name.
1-54
Debugging C Programs
C79000-G7076-C520-01
Organon XDB User Interface
Enter the expression you want to be evaluated, using the current language. Choose
the Format you like the result to be in. If the expression denotes a pointer to a
character string or a character array, ascii might be useful. If you choose ascii, you
may enter the number of characters to be displayed into the Length field.
Memory access: Some processors allow byte-wise or word-wise memory access
only. If your target processor behaves this very restrictive way, click the sort of
access it accepts. In most cases, default works fine.
Level: If the expression denotes a structure containing sub-structures, you can
specify how many levels to step down into the structure.
Note that arrays may be evaluated partially, e.g. if A is an array of appropriate
length, A[2..5] denotes the elements 2, 3, 4, and 5.
If you click the Ok button, the result is printed to the command window. If you click
the Window button instead, an evaluation window is created.
1.2.3.16 Create Memory Window
This button is identical to the menu item "Display / Memory". It causes the creation
of a new memory window. The Browse button shows the addresses of all symbols
visible within this scope. You find a detailed description of the symbol browser in
chapter 1.2.2. More than one memory window may be open.
Debugging C Programs
C79000-G7076-C520-01
1-55
Organon XDB User Interface
1.2.3.17 Display Callstack
This button is identical to the menu item "Debug / Calls". The stack of procedure
calls is displayed. The procedures are listed with their names, addresses, and
arguments.
To change the scope of symbols visible to Organon XDB, click one of the
procedures, then click the Set Scope button. An alternative way to set the scope is
to doubleclick the procedure line. Note that continuing the execution changes the
scope back to the procedure being executed.
For performance reasons, the procedure arguments are shown only if you ask for
them. Click the Arguments button, and the window changes to:
1.2.3.18 Break
This button tries to stop the current action so that new commands can be entered.
Useful if the XDB waits for some event that takes too long or that never happens.
1-56
Debugging C Programs
C79000-G7076-C520-01
Organon XDB User Interface
1.3 Description of the Subwindows
The most informative part of Organon XDB is the subwindow area where different
sorts of subwindows may appear. As usual, all windows can be iconized and
reopened. Subwindows can also be hidden, (i.e. completely invisible), with the
exception of the command window which is always visible. Closing the command
window exits the XDB.
The uppermost subwindow is called the active subwindow. Depending on the sort of
subwindow being active, the behaviour of Organon XDB changes in some details
which are described in the following chapters. To activate another subwindow, just
click this window.
1.3.1 Command Window
In this window, you are prompted for commands as described in the Command
Reference. All diagnostics and error messages are written here.
Debugging C Programs
C79000-G7076-C520-01
1-57
Organon XDB User Interface
1.3.1.1 Command Window Editor
All the commands you give in the current session (including commands read from
batch files or issued by user-defined buttons) are kept in a buffer, enabling you to
repeat and edit them. The following commands are available:
Key
Command
<Cursor up>
go up one line
<Cursor down>
go down one line
<Cursor left>
move cursor left
<Cursor right>
move cursor right
<PgUp>
one page up
<PgDown>
one page down
<Home>
go to beginning of line
<End>
go to end of line
<Delete>
delete character at cursor position
<Backspace>
delete character left of cursor
<Escape>
delete whole line
Everything else you type is inserted into the line. When you hit <Return>, the
command is issued and executed.
You can change from insert mode to overstrike mode (and back again) by hitting
the <Insert> key.
1-58
Debugging C Programs
C79000-G7076-C520-01
Organon XDB User Interface
1.3.2 Source Window
This window shows the source code of the target program. Unless you switch to
another module by using the menu item "File / Set Module", the module being
executed is displayed. The left part of the source window shows the line numbers;
the source lines are displayed in the right part. A line number marked with a stop
sign indicates that this line contains a breakpoint. The current line, i.e. the line of
code to be executed next, is displayed inverted, i.e. white on black background. The
environment variable XDBTABLEN controls the position of the tabstops for
adjusting the source code. To mark a line for further manipulation (e.g. to set a
breakpoint), position the line pointer (the black arrow left of the line numbers) by
clicking the line. You can also move the line pointer by hitting the <Cursor up> and
<Cursor down> keys. To scroll up or down in the source window, you can use the
<PgUp> and <PgDown> keys.
Note: Not every line of code contains information useful for debugging purposes,
e.g. comment lines. The line numbers of such lines are written in a different color
and a blue point is placed behind the line number.
If you click the left part of the window (i.e. a line number) with the right mouse
button, the line pointer is set to this line, and the following menu appears:
Debugging C Programs
C79000-G7076-C520-01
1-59
Organon XDB User Interface
You can click one of these items (or hit <Alt> + the underlined letter), and Organon
XDB will react as follows:
• Go here: Execute the program until the line pointer is reached. The line you
clicked is not executed.
• Set Breakpoint: Set a breakpoint at the specified line. This menu item is not
visible if a breakpoint exists already at this position. An alternative way to set a
breakpoint is to doubleclick the line number.
• Delete Breakpoint: Delete the breakpoint in this line. This menu item is visible
only if a breakpoint exists at this position. An alternative way to delete a
breakpoint is to doubleclick the line number.
• Run until caller: Useful in subroutines only. The execution is continued until it
returns to the calling routine. If the line containing the call is completely
processed upon the return, the next line becomes the current line. Otherwise the
calling line remains the current line. Example: The calling line stores the return
value of the subroutine in the variable a, viz:
a = sub( x, y);
When the execution is inside the subroutine sub(), you click Run until caller,
and the rest of sub() is processed. Now the line above is still the current line;
sub() was processed but its return value is not yet stored in a.
• Run until return: Execute until the routine is left but still remain in this routine.
The current line is the last source line of the routine. If the execution is in the
main routine, it continues until the end of the program is reached.
• Set PC: The program counter is set to the line marked by the line pointer i.e. the
execution will continue by processing this line. This feature enables you to jump
over pieces of the program, leaving them unprocessed, or to repeat the
execution of a piece of the program. As this feature forces the program to
behave in a way its author has never intended, it should be used carefully.
1-60
Debugging C Programs
C79000-G7076-C520-01
Organon XDB User Interface
If some of the menu items cannot be applied to the source code line you clicked
(e.g. setting the program counter into a comment), these items are disabled.
If you mark a piece of source text with the left mouse button, then click the window
with the right mouse button, the following menu appears:
If you click one of these items (or hit <Alt> + the underlined letter), Organon XDB
will react as follows:
• Evaluate: The marked text is taken as an expression to be evaluated, as if you
issued the command EVALUATE. The result is printed to the command window.
• Evaluate from pointer: The marked text is taken as an expression to be
evaluated, as if you issued the command EVALUATE. The result of the
evaluation is taken as a pointer, and the contents of the memory this pointer
points to are displayed in the command window.
• Create evalwindow: The marked text is evaluated, and an evaluation window
which displays the result appears.
• Create evalwindow from pointer: Same as Evaluate from pointer, but the
result is displayed in an evaluation window.
Debugging C Programs
C79000-G7076-C520-01
1-61
Organon XDB User Interface
1.3.3 Assembler Window
This window shows the assembler code of the loaded task. Similar to the source
window, the current assembler instruction (i.e. the next to be executed) is displayed
inverted.
If you click the left part of the window (i.e. an address) with the right mouse button,
the line pointer is set to this line, and the following menu appears:
You can click one of these items (or hit <Alt> + the underlined letter), and Organon
XDB will react as follows:
• Go here: Execute the program until the line pointer is reached. The line you
clicked is not executed.
• Set Start Address: Start Address for the assembler window.
1-62
Debugging C Programs
C79000-G7076-C520-01
Organon XDB User Interface
• Home: Choosing this item makes the assembler window go back to the start
address.
• Set Breakpoint: Set a breakpoint at the specified line. This menu item is not
visible if a breakpoint exists already at this position. An alternative way to set a
breakpoint is to doubleclick the address.
• Delete Breakpoint: Delete the breakpoint in this line. This menu item is visible
only if a breakpoint exists at this position. An alternative way to delete a
breakpoint is to doubleclick the address.
• Run until caller: This item is useful only if the menu is called from the source
window. Thus, it is disabled.
• Run until return: This item is useful only if the menu is called from the source
window. Thus, it is disabled.
• Set PC: The program counter is set to the line marked by the line pointer i.e. the
execution will continue by processing this line. This feature enables you to jump
over pieces of the program, leaving them unprocessed, or to repeat the
execution of a piece of the program. As this feature forces the program to
behave in a way its author has never intended, it should be used carefully.
Debugging C Programs
C79000-G7076-C520-01
1-63
Organon XDB User Interface
1.3.4 Register Window
This window allows you to examine the contents of the registers. Registers which
were changed by the last instruction executed are displayed in a different color, the
so-called enhanced color (see menu item "Options / Edit Colors", chapter 1.2.1.6).
If you click the register window with the right mouse button, the following menu
appears:
Selector register
or
other registers
• Value
You can change arbitrarily the value of the register in the register window. Just click
the word “Value“ in the context menu or doubleclick the value part of the register
window to make the Value window pop up. Enter an expression into the "Value"
field, then choose the appropriate Format. When you click Ok, the expression is
evaluated and its result is assigned to the register in the register window.
1-64
Debugging C Programs
C79000-G7076-C520-01
Organon XDB User Interface
1.3.5 Task Window
This window displays all currently active tasks. It shows the task names, XDB task
IDs, and the scope information of the tasks. You can doubleclick any task to make it
the current task for XDB. The scope info of this task is set and the source window is
updated to reflect this task’s source code.
If you click the task window with the right mouse button, this popup window
appears:
You can select each of these items to get the following actions:
• Set Task: Sets the scope of the currently highlighted task; this is equal to
doubleclicking this task.
• Task Info: Displays the output of the command "SHOW TASK /ID=<task_id>" in
the command window, where <task_id> is the ID of the highlighted task.
• Current Task: Sets the currently active task. As in RMOS the active task is the
current task, this is a "no operation". This menu item exists for compatibility
reasons only.
Debugging C Programs
C79000-G7076-C520-01
1-65
Organon XDB User Interface
1.3.6 Remote System Window
This window offers you access to the target system. Within the remote system
window you can’t use shortcuts (for example ^X,^R). Only the escape-character is
active and closes the remote window.
1.3.7 Evaluation Windows
These windows are opened when you evaluate an expression (see the menu item
"Debug / Evaluate", chapter 1.2.1.4, and the command SET EVALUATE in the
Command Reference). If the expression denotes a complex structure, like a record
or an array, all components are shown together with the declaration of the structure.
Whenever the result of the expression changes, the new value is displayed in a
different color, the so-called enhanced color (see menu item "Options / Edit Colors",
chapter 1.2.1.6). You can open as many evaluation windows as you want.
If the expression denotes a complex structure, like a record or an array, you can get
information about its type declaration by doubleclicking the left part of the
evaluation window.
1-66
Debugging C Programs
C79000-G7076-C520-01
Organon XDB User Interface
If you want to change the value of the expression, just doubleclick the value
displayed, and a pop-up window appears which allows you to manipulate the
memory, assuming the expression has a memory address.
If you click the window with the right mouse button, the cursor is set to this line, and
the following menu appears:
or
(if on a structure)
(otherwise)
You can click one of these items (or hit <Alt> + the underlined letter), and XDB will
react as follows:
• Value
You can change arbitrarily the value of the expression in the active evaluation
window. Just click the word “Value“ in the context menu or doubleclick the value
part of the evaluation window to make the Value window pop up. Enter an
expression into the "Value" field, then choose the appropriate Format. When you
click Ok, the expression is evaluated and its result is assigned to the address of the
expression in the active evaluation window.
If the expression has no address (e.g. "i+1"), Organon XDB will issue an error
message.
If the expression denotes a structured variable, you can change only one
component at a time. First click the component in the evaluation window, then
choose the item Value.
Debugging C Programs
C79000-G7076-C520-01
1-67
Organon XDB User Interface
• Type
Clicking this item or doubleclicking the type part of the evaluation window makes
the Type window pop up, showing some information about the expression of the
active evaluation window, like its address and type declaration. Note that an
expression like "i+1" has a type but not an address.
You can summon this pop-up window by doubleclicking the left (i.e. component
name) part of the evaluation window.
• Follow
If the expression denotes a pointer, the Follow button makes the evaluation
window follow it and show the structure the pointer references to. Follow is
disabled if the expression is not a pointer.
1-68
Debugging C Programs
C79000-G7076-C520-01
Organon XDB User Interface
• Expand
If the expression denotes a structure, the Expand button replaces the current
evaluation window content with the detailed listing of the structure.
• Back
If the evaluation window followed a pointer or expanded a structure (see below,
menu item "Value"), this item makes it go back again.
1.3.8 Memory Windows
A memory window displays a certain piece of the memory. Values that were
changed by the last instruction executed are displayed in a different color, the socalled enhanced color (see menu item "Options / Edit Colors", chapter 1.2.1.6).
Memory windows are opened by the menu item "Display / Memory" or by the button
Create Memory Window. You can open as many memory windows as you want.
The title bar contains the name of the memory window. The text "[based]" is
displayed if the window is in based mode. The string "[?]" indicates that the window
is not updated automatically and something happened since the last update which
possibly changed the memory on display.
Debugging C Programs
C79000-G7076-C520-01
1-69
Organon XDB User Interface
The first line of the Memory Windows contains the start address. If the Memory
Window cursor is located at the address of a (program or XDB) symbol, the first line
of the window displays the symbol name inclusively the path of the respective
debug information.
In bytewise display, the contents of the memory are not only displayed numerically
but also interpreted as characters and written on the right side of the memory
window. Invisible characters are replaced by a dot.
Note that a window in based mode always displays the memory denoted by the
start address expression and, therefore, cannot be scrolled.
1.3.8.1 Memory Window Context Menu
If you click the memory part of the window (i.e. not the title bar, scroll bar or first
line) with the right mouse button, the following menu pops up:
The menu can also be summoned by typing <ctrl-Return> into the window.
You can choose an item from the menu by either clicking it or by typing the
underlined letter.
• Modify
Select this item if you want to change the memory contents. The following dialog
box pops up:
1-70
Debugging C Programs
C79000-G7076-C520-01
Organon XDB User Interface
You can enter the address where the modification starts (the memory window
cursor location is the default value for the address) and choose the size of the
information to be written. Click the Browse button to invoke the symbol browser
which helps you getting the addresses of program symbols. Enter the value to be
written into the Expression List field. As the name implies, you can enter a list
of expressions here, separated by commas. The amount of memory being
accessed is the size times the number of expressions. For example, if you enter
"1000" into the Start Address field and the list "1, 0, 1, 1" into the Expression
List field and select the size "BYTE", the bytes 1000 through 1003 are modified.
The same operation with the size "WORD" would affect the bytes 1000 through
1007.
• Start Address
You can change the start address of the memory window by selecting this item.
Enter the new start address in the dialog box popping up. This dialog box also
offers the ability to invoke the symbol browser which helps you getting the
addresses of program symbols.
Debugging C Programs
C79000-G7076-C520-01
1-71
Organon XDB User Interface
• Reload
This menu item updates the window contents. This is especially useful if the
memory window is not updated automatically.
• Home
Choosing this item makes the window go back to the start address.
• Follow
If the format is one of the pointer types "Near 16", "Far 16", etc., this menu item
makes the memory window follow the pointer marked by the memory window
cursor, i.e. the contents of the marked piece of memory are interpreted as
memory address which becomes the new start address. This menu item is
disabled if the format is not a pointer type.
• Back
If the start address is changed by Start Address or Follow, the old start address
is saved. By selecting the menu item Back you reset the start address to its
previous value. Note that not only the last change but all changes done by
Start Address or Follow can be undone; in other words, you can go back to the
initial start address after an arbitrary number of address changes. If no previous
address exists, this menu item is disabled.
• Assembler
This menu item opens the assembler window (unless it is open already). The
assembler window is set to the address marked by the memory window cursor.
1-72
Debugging C Programs
C79000-G7076-C520-01
Organon XDB User Interface
• Watchpoint
Select this item to set a watchpoint to the location marked by the memory
window cursor. The dialog box popping up is the same as invoked by the main
menu item "Debug / Set Watchpoint" described in chapter 1.2.1.4.
• Size
You can tell XDB how to group the array of bits it extracts from the memory. Click
the size you want or hit the underlined letter. The current size is checkmarked.
• Format
This menu item enables you to change the display format of the memory window.
Click the format you want or hit the underlined letter. The current format is
checkmarked.
Debugging C Programs
C79000-G7076-C520-01
1-73
Organon XDB User Interface
• Based Mode
If the start address of the memory window is not a constant expression, you may
want the memory window to follow whenever the value of the expression
changes. This is the so-called based mode. You can toggle between based
mode and constant mode by selecting this item. The menu item is checkmarked
if the memory window is in based mode. Note that the automatical start address
change of a based memory window cannot be undone by means of the item
Back.
• Auto Update
If this item is checkmarked, the window is updated automatically whenever the
memory on display is changed. Otherwise, it is updated only when you select the
menu item Reload. You can toggle between these two update modes by
selecting Auto Update.
1.3.9 Trace Windows
Tracepoints can be used to watch a piece of memory, e.g. a variable. You can set a
tracepoint using the Debug menu in the tool bar (see chapter 1.2.1.4), or you can
issue the SET TRACEPOINT command in the command window. A trace window is
opened for every tracepoint, and the value stored in the memory to be traced is
displayed.
If a value has changed in the last execution step, it is displayed in a different color,
the so-called enhanced color (see menu item "Options / Edit Colors", chapter
1.2.1.6) to catch your attention.
1-74
Debugging C Programs
C79000-G7076-C520-01
Organon XDB User Interface
Here you see two trace windows which were named "trace[0]" and "trace[1]" by the
debugger. trace[0] was set on the integer variable J which has the value 4 at the
moment. The variable D0 is a compound structure, thus Organon XDB shows the
structure component names in the left part of the trace window while displaying the
values of these components in the right part. The value of the component RFS is
displayed in enhanced color because it was changed in the last execution step.
The handling of trace windows is - excepted the missing Pop-Up menues available
by pressing the the right mouse button - exactly the same as the handling of
evaluation windows.
1.3.10 Copy and Paste
It is possible to transfer text from one subwindow to another by using the mouse.
Just brush over the text with the mouse while pressing down the left mouse button.
To paste the copied text into another window, move the mouse into this window and
click the right mouse button. Note that the text copied into the copy-and-paste
buffer remains there until you mark another text.
Debugging C Programs
C79000-G7076-C520-01
1-75
Organon XDB User Interface
You can copy text from the following subwindows:
Command window, source window, assembler window, remote window.
You can paste the copied text into the following subwindows:
Command window, remote window.
When you choose the menu item "Debug / Evaluate" or click the Evaluate button, a
pop-up window appears where you enter the expression to be evaluated. If you
have copied text into the copy-and-paste buffer, this text is the default value for the
expression. The same holds for the Search command which can be issued by
clicking the Search button or choosing the menu item "File / Search": When the
search window pops up, the content of the copy-and-paste buffer is in the pattern
field already.
Example:
Examining the C program displayed in the source window, you wonder whether the
condition in the if-statement on line 23 is true in the moment:
1-76
Debugging C Programs
C79000-G7076-C520-01
Organon XDB User Interface
You place the mouse at the beginning of the condition, press down the left mouse
button, and drag the mouse across the condition, marking it:
Now you click the tool bar button Evaluate, and this window pops up:
The expression you marked is already in the Expression field. All you have got to
do is to click the Ok button, and the result appears in the command window.
Debugging C Programs
C79000-G7076-C520-01
1-77
Organon XDB User Interface
1.4 Descriptor and Register Tables
The menu item "Display / CPU-Structures" gives access to the CPU structures used
by the processors Intel386 and upward. Open the menu and choose the table you
want to manipulate by clicking it (or by hitting <Alt> and the underlined letter).
If one of these tables is displayed already, its name is checkmarked. Clicking this
name is the appropriate way to dismiss the table.
1.4.1 Descriptor Tables
If you choose to display the GDT (Global Descriptor Table) or the IDT (Interrupt
Descriptor Table), the following dialog box pops up:
Enter the number of the first table item to be displayed into the Table Start field and
activate the button Index or enter the selector into the Table Start field and activate
the button Selector (The Selector option makes sense only in the case of a GDT
1-78
Debugging C Programs
C79000-G7076-C520-01
Organon XDB User Interface
and is therefore disabled in the IDT case). Write the number of items to be
displayed into the Length field, then click Ok or hit <Return>.
A similar dialog box appears when you choose to display an LDT (Local Descriptor
Table). Additionally to the items mentioned above, you have to choose which LDT
to display by entering the appropriate GDT index number; to display the LDT of the
current task (which is referenced to by the LDTR register), activate the LDTR
button.
Now, the descriptor table is loaded from the target. During loading the following is
displayed:
Afterwards the descriptor table is displayed:
If you want to change the table or examine an item in detail, click it with the right
mouse button to summon this pop-up menu:
Debugging C Programs
C79000-G7076-C520-01
1-79
Organon XDB User Interface
Choose one of the items by clicking it or by hitting <Alt> and the underlined letter.
The items are described in the following chapters.
If you hit <Return> while the descriptor table window is active, Organon XDB
directly goes into the modify mode, skipping the pop-up menu. The descriptor to be
modified is the one being displayed in inverted colors in the descriptor table
window.
1.4.1.1 Modify
The following dialog box enables you to examine or modify the chosen item of the
GDT, LDT, or IDT:
The modification becomes effective when you click the Set button. The Close
button dismisses the dialog box, discarding all changes you made. Clicking the
1-80
Debugging C Programs
C79000-G7076-C520-01
Organon XDB User Interface
Restore button discards all changes made since the opening, but the dialog box
remains open.
To change the type of the descriptor, open the Descriptor Type pull-down menu
and choose one of the offered types. You can modify the values of the segment
base address and the segment limit by entering a number (octal, decimal, or hex).
The Descriptor Layout field helps you modifying the contents of the descriptor bit
for bit. Click the bit or bit group (or its name displayed in the field) to set the focus
on it. The focused bit or bit group can be altered by a click or by hitting the space
bar. This increases the value of the bit group by 1 (wrapping around the maximal
value). The focus can be moved left or right with the "cursor left" and "cursor right"
keys.
Some bit groups are so large that changing them in the manner described above
would be cumbersome. Thus, a different mechanism to change their contents was
implemented: Just doubleclick the bit group (or its name displayed in the layout
field), then enter the new value as a decimal, octal or hex number. Bit groups with
this change mechanism are displayed hatched, viz:
You find a short description of the focused bit group and its current value below the
Descriptor Layout field. The Description field at the bottom of the box shows a
summary of the contents of the descriptor.
Changed bits are displayed in enhanced color in the Descriptor Layout field.
Bits which are not accessible directly (i.e. by clicking them in the Descriptor
Layout field) are displayed in gray, indicating they are "disabled".
Debugging C Programs
C79000-G7076-C520-01
1-81
Organon XDB User Interface
1.4.1.2 Reload Table
The descriptor table is not updated automatically when the target memory is
changed (e.g. by performing a step). Choose this menu item to update the table on
display. Note that the whole table on display is updated; it does not matter which
line was clicked to summon the pop-up menu.
1.4.1.3 Set Range
This menu item enables you to change the range of the list of descriptors on
display. Enter the number of the first table item to be displayed and the number of
items to be displayed, then click Ok or hit <Return>.
1.4.2 Control Registers
If you choose to display the control registers, the following window appears:
Clicking a line with the right mouse button summons the following menu whose
items are explained in the chapters below:
If you hit <Return> while the control register table window is active, Organon XDB
directly goes into the modify mode, skipping the pop-up menu. The register to be
modified is the one being displayed in inverted colors in the register table window.
1-82
Debugging C Programs
C79000-G7076-C520-01
Organon XDB User Interface
1.4.2.1 Modify
The following dialog box enables you to examine or modify the selected register:
The modification becomes effective when you click the Set button. The Close
button dismisses the dialog box, discarding all changes you made. Clicking the
Restore button discards all changes made since the opening, but the dialog box
remains open.
You can change the whole register value by entering a number (octal, decimal or
hex) into the Register Value field.
You can change the value of a bit group by clicking it (or its name) in the Register
Layout field, then set the focus to the Group Value field and enter a number (octal,
decimal or hex). The Bits field shows which bits belong to this group.
The Register Layout field helps you modifying the contents of the descriptor bit for
bit. Click the bit or bit group (or its name displayed in the field) to set the focus on it.
The focused bit or bit group can be altered by a click or by hitting the space bar.
This increases the value of the bit group by 1 (wrapping around the maximal value).
The focus can be moved left or right with the "cursor left" and "cursor right" keys.
Debugging C Programs
C79000-G7076-C520-01
1-83
Organon XDB User Interface
Some bit groups are so large that changing them in the manner described above
would be cumbersome. Thus, a different mechanism to change their contents was
implemented: Just doubleclick the bit group (or its name displayed in the layout
field), then enter the new value as a decimal, octal or hex number. Bit groups with
this change mechanism are displayed hatched, viz:
You find a short description of the focused bit group and the meaning of its current
value below the Register Layout field. The Description field at the bottom of the
box shows a detailed explanation of the contents of the register.
Changed bits are displayed in enhanced color in the Register Layout field.
Bits which are not accessible directly (i.e. by clicking them in the Register Layout
field) are displayed in gray, indicating they are "disabled".
Some registers contain only numerical values rather than single and independent
bits. These registers are displayed without the Register Layout field, e.g. the
register IDTR:
To change the register value, set the focus to one of the value fields (i.e. click the
field or hit <Alt> and the underlined letter), then enter a number (octal, decimal or
hex).
1-84
Debugging C Programs
C79000-G7076-C520-01
Organon XDB User Interface
1.4.2.2 Update
The control register table is not updated automatically when the target CPU
registers change (e.g. by performing a step). Choose this menu item to update the
table on display. Note that the whole table on display is updated; it does not matter
which line was clicked to summon the pop-up menu.
1.4.3 Register Window
The Organon XDB386 offers the ability to manipulate the register contents. This
feature is explained in this chapter.
1.4.3.1 General Registers
If you click a register name or register value with the right mouse button, this menu
appears:
Only the first item, Value, is enabled. Select it to summon the following dialog box.
This dialog box also pops up if you doubleclick the register value, circumventing the
menu.
The Format radio buttons determine the display format of the value. You can
change the register value by entering an expression into the Value field. The
change takes place if you click Ok or hit <Return>. Note that the Follow button is
always disabled.
Debugging C Programs
C79000-G7076-C520-01
1-85
Organon XDB User Interface
1.4.3.2 Segment Registers
The behaviour of the segment registers CS, ES, DS, etc, is somewhat different.
Clicking one of them with the right mouse button summons this menu:
Only the items Value and Descriptor are enabled. The item Value is described in
the previous chapter. Selecting Descriptor activates the descriptor modification
mechanism described in chapter 1.4.1.1.
Both menu items can be selected without summoning the menu. Doubleclick the
segment register name to activate the descriptor modification mechanism or
doubleclick the segment register value to activate the value modification
mechanism.
1-86
Debugging C Programs
C79000-G7076-C520-01
Organon XDB Command Set
2
2
Organon XDB Command Set
2-5
2.1
BATCH
2-6
2.2
BREAK
2-8
2.3
CLOSE
2-9
2.4
CONTINUE
2-10
2.5
DEFINE Commands
2-11
2.6
DEFINE BUTTON
2-12
2.7
DEFINE KEY
2-13
2.8
DEFINE MACRO
2-15
2.9
DEFINE SYMBOL
2-17
2.10
DELETE Commands
2-18
2.11
DELETE BREAKPOINT
2-19
2.12
DELETE BUTTON
2-20
2.13
DELETE DEBUG
2-21
2.14
DELETE DIRECTORY
2-22
2.15
DELETE EVALUATE
2-23
2.16
DELETE KEY
2-24
2.17
DELETE MACRO
2-25
2.18
DELETE MODULE
2-26
2.19
DELETE TRACEPOINT
2-27
2.20
DELETE WATCHPOINT
2-28
2.21
DISABLE Commands
2-29
2.22
DISABLE BREAKPOINT
2-30
2.23
DISABLE EVALUATE
2-32
2.24
DISABLE TRACEPOINT
2-33
2.25
DISABLE WATCHPOINT
2-35
2.26
DISPLAY
2-37
2.27
DISPLAY Descriptor Table
2-39
2.28
DISPLAY SYSREG
2-40
2.29
ENABLE Commands
2-41
2.30
ENABLE BREAKPOINT
2-42
Debugging C Programs
C79000-G7076-C520-01
2-1
Organon XDB Command Set
2.31
ENABLE EVALUATE
2-43
2.32
ENABLE TRACEPOINT
2-44
2.33
ENABLE WATCHPOINT
2-45
2.34
ERASE
2-46
2.35
ERASE SYSREG
2-47
2.36
EVALUATE
2-48
2.37
EXIT
2.38
GOTO
2-52
2.39
HELP
2-53
2.40
IF
2-54
2.41
Label
2-56
2.42
LINE
2-57
2.43
LOAD
2-59
2.44
MESSAGE
2-62
2.45
NEXT
2-63
2.46
PAGE
2-64
2.47
PRINT
2-66
2.48
REMOTE
2-67
2.49
RUN
2-68
2.50
SCAN
2-70
2.51
SEARCH
2-71
2.52
SET Commands
2-72
2.53
SET BREAKPOINT
2-73
2.54
SET DEBUG
2-76
2.55
SET DESCRIPTOR
2-78
2.56
SET DIRECTORY
2-80
2.57
SET ESCAPE
2-81
2.58
SET EVALUATE
2-82
2.59
SET INTERFACE
2-85
2.60
SET LANGUAGE
2-86
2.61
SET LOGFILE
2-87
2.62
SET MODULE
2-88
2.63
SET OPTION
2-89
2.64
SET PROTFILE
2-92
2.65
SET REGISTER
2-94
2.66
SET SCOPE
2-97
2.67
SET SCROLL
2-99
2-2
2-51
Debugging C Programs
C79000-G7076-C520-01
Organon XDB Command Set
2.68
SET TASK
2-100
2.69
SET TRACEPOINT
2-102
2.70
SET VALUE
2-104
2.71
SET WATCHPOINT
2-109
2.72
SHOW Commands
2-112
2.73
SHOW ACTIVE
2-113
2.74
SHOW BREAKPOINT
2-114
2.75
SHOW BUTTON
2-115
2.76
SHOW CALLS
2-116
2.77
SHOW DBVAR
2-118
2.78
SHOW DEBUG
2-119
2.79
SHOW DECLARATOR
2-120
2.80
SHOW DESCRIPTOR
2-121
2.81
SHOW DIRECTORY
2-124
2.82
SHOW ESCAPE
2-125
2.83
SHOW EVALUATE
2-126
2.84
SHOW INFO
2-127
2.85
SHOW KEY
2-128
2.86
SHOW LANGUAGE
2-129
2.87
SHOW LEVEL
2-130
2.88
SHOW LOGFILE
2-131
2.89
SHOW MACRO
2-132
2.90
SHOW MEMORY
2-133
2.91
SHOW MODULE
2-135
2.92
SHOW OPTION
2-136
2.93
SHOW PROTFILE
2-137
2.94
SHOW REGISTER
2-138
2.95
SHOW SCOPE
2-139
2.96
SHOW SEGMENT
2-140
2.97
SHOW SOURCE
2-141
2.98
SHOW STATUS
2-142
2.99
SHOW SYMBOL
2-143
2.100
SHOW TASK
2-144
2.101
SHOW TRACEPOINT
2-145
2.102
SHOW TYPE
2-146
2.103
SHOW VERSION
2-147
2.104
SHOW WATCHPOINT
2-148
Debugging C Programs
C79000-G7076-C520-01
2-3
Organon XDB Command Set
2.105
SPAWN
2-149
2.106
STEP
2-150
2.107
WHILE
2-164
2-4
Debugging C Programs
C79000-G7076-C520-01
Organon XDB Command Set
2 Organon XDB Command Set
Organon XDB contains a rich set of commands. These commands are listed in
alphabetical order below:
BATCH
EXIT
REMOTE
BREAK
CLOSE
CONTINUE
DEFINE
DELETE
DISABLE
DISPLAY
ENABLE
ERASE
EVALUATE
GOTO
HELP
IF
Label
LINE
LOAD
MESSAGE
NEXT
PAGE
PRINT
RUN
SCAN
SEARCH
SET
SHOW
SPAWN
STEP
WHILE
Note that commands and keywords may be abbreviated as long as they are
unambiguous. E.g., "DEF" is recognized as "DEFINE" while "DIS" is illegal because
it could mean "DISABLE" as well as "DISPLAY".
Debugging C Programs
C79000-G7076-C520-01
2-5
Organon XDB Command Set
2.1 BATCH
Syntax
BATCH [/STEP] [/ERROR] [/NOOUT] [/ARGUMENTS = "arg1[,arg2...]"] "<filename>"
Description
<filename>
The name of the batch file. To avoid problems with path names including
special characters, the file name must be enclosed in double quotes.
/STEP
This option forces single-stepping through the batch file (and its possible
recursive descendants), asking for every command to be executed. The
command is shown at the command window.
There are four choices for each command:
Choice
Description
y
s
c
e
execute the command
skip the command
continue without asking anymore
exit batch mode and return to interactive mode
/ERROR
This option stops the execution of commands if XDB detects an error, and
returns to interactive mode.
/NOOUT
This option switches off any update of windows except the error window
during execution of a BATCH file.
/ARGUMENTS="arg1[,arg2...]"
This option allows to pass arguments to BATCH files. Up to 40 arguments
are allowed. An argument is referenced with &<argument-number>. The
argument 0 contains the name of the BATCH file. To suppress the expansion
2-6
Debugging C Programs
C79000-G7076-C520-01
Organon XDB Command Set
of a positional parameter use a '\' (backslash) character as prefix. Undefined
parameters are treated as empty strings. The parameters are passed as
textual strings.
The qualifiers /STEP, /NOOUT, and /ERROR are propagated through nested
batch file calls.
Examples
BATCH
BATCH
BATCH
BATCH
/STEP "cmdfile"
/ERROR "validate"
/STEP /ERROR "test"
"..\cmddir\setup"
Debugging C Programs
C79000-G7076-C520-01
2-7
Organon XDB Command Set
2.2 BREAK
Syntax
BREAK
Description
BREAK terminates the current WHILE loop. This command has no effect if
called outside a loop.
Example
WHILE i > 10
THEN
EVAL j
IF j < 20
THEN
BREAK
END
END
References
WHILE
CONTINUE
2-8
Debugging C Programs
C79000-G7076-C520-01
Organon XDB Command Set
2.3 CLOSE
Syntax
CLOSE LOGFILE
CLOSE PROTFILE/WINDOW = <window>
CLOSE PROTFILE/ALL
Description
CLOSE stops writing into the specified logfile or protocol file. If the last
window of a protocol file is closed, the file itself is closed, too.
<window> may have the following names:
ASSEMBLER EVALUATE
COMMAND
REGISTER
ERROR
SOURCE
TRACEPOINT
/ALL closes all protocol files immediately.
Examples
CLOSE LOGFILE "session"
CLOSE PROTFILE /WINDOW=EVAL
CLOSE PROTFILE /ALL
References
SET LOGFILE
SET PROTFILE
SHOW LOGFILE
SHOW PROTFILE
Debugging C Programs
C79000-G7076-C520-01
2-9
Organon XDB Command Set
2.4 CONTINUE
Syntax
CONTINUE
Description
CONTINUE skips the remaining part of a loop and resumes at the test
expression.
Example
WHILE i > 10
THEN
EVAL i
IF j < 10
THEN
CONTINUE
END
EVALUATE j
END
References
BREAK
WHILE
2-10
Debugging C Programs
C79000-G7076-C520-01
Organon XDB Command Set
2.5 DEFINE Commands
Syntax
DEFINE <item>
The item <item> to be defined can be one of the following:
BUTTON
KEY
MACRO
SYMBOL
Debugging C Programs
C79000-G7076-C520-01
2-11
Organon XDB Command Set
2.6 DEFINE BUTTON
Syntax
DEFINE BUTTON [/OVERWRITE] <name> "<text>"
Description
The DEFINE BUTTON command creates a new button in the toolbar of the
command window. Whenever this button is pressed, the string <text> is sent
to the command line processor.
/OVERWRITE
Redefining an existing button causes an error message. But it is possible to
redefine a button if the qualifier /OVERWRITE is used. In this case only a
warning message appears.
Examples
DEFINE
DEFINE
DEFINE
DEFINE
BUTTON
BUTTON
BUTTON
BUTTON
step "step\n"
break "SET breakpoint at "
Assem "SET language assembler\n"
/OVERWRITE oldbutton "newcommand"
References
DELETE BUTTON
SHOW BUTTON
2-12
Debugging C Programs
C79000-G7076-C520-01
Organon XDB Command Set
2.7 DEFINE KEY
Syntax
DEFINE KEY [ /OVERWRITE ] <key> "<text>"
Description
The function key with the symbolic code <key> is defined to send the text
<text>.
Unlike the other DEFINE commands redefining an existing key causes no
error or warning message.
/OVERWRITE
Although redefining a key without the qualifier /OVERWRITE causes no
warning message it is good practice to use this qualifier for redefining.
Currently possible key codes are:
Key Code
Name
F1
:
F9
F11
:
F20
F21
:
F24
function key
:
function key
function key
:
function key
function key
:
function key
Function Key F10 is reserved for Windows.
A defined key does not send the newline character automatically; thus, a
command can be combined by pressing a couple of function keys. If a string
is to be sent to the debugger immediately, add the newline escape "\n"
(backslash -n) to the end of the string.
Debugging C Programs
C79000-G7076-C520-01
2-13
Organon XDB Command Set
XDB does not check whether the key is really available on your current
terminal.
Examples
DEFINE KEY F1 "set break at"
DEFINE KEY /OVERWRITE F2 "step\n"
DEFINE KEY F3 "/ALL"
References
SHOW KEY
DELETE KEY
2-14
Debugging C Programs
C79000-G7076-C520-01
Organon XDB Command Set
2.8 DEFINE MACRO
Syntax
DEFINE MACRO [/OVERWRITE] [/BUTTON] <name> "<text>"
Description
<name>
The macro <name> is defined. <name> is a name consisting of letters and
digits. The first character has to be a letter. The names of internally
predefined variables and macro functions must not be used (see SET
VALUE). <text> is the replacement text of the macro. <text> can contain
more than one line. The maximum number of parameters for a macro is 20.
These parameters can be addressed by @<number>. The macro may
contain any text. Macros cannot be used recursively.
The execution of the macro on the command level is done by:
@name (parameter1,...,parameter9)
Only the parameters actually used must be specified. The others are
replaced by empty strings. The macro is replaced, and the replacement text
is interpreted like any other input. Macros can be nested and used as
parameters to other macros. The parameters are expanded during the
scanning of the parameter list. If no parameters are given, the parentheses
may be omitted. Macros must not be recursive!
Macros and debugger variables use the same designations. In case of equal
names, the macro definition is used.
/OVERWRITE
Redefining an existing macro causes an error message. But it is possible to
redefine a macro if the qualifier /OVERWRITE is used. In this case only a
warning message appears.
Debugging C Programs
C79000-G7076-C520-01
2-15
Organon XDB Command Set
/BUTTON
It is possible to define toolbar buttons for the macro by using the /BUTTON
qualifier. The macro is executed whenever the associated button is pressed.
If a macro body spans more than 1 line, a '\' (backslash) character must be
entered immediately before the newline character. If the macro contains
more than one command, the commands must be separated by semicolons.
Examples
DEFINE
DEFINE
DEFINE
DEFINE
DEFINE
MACRO
MACRO
MACRO
MACRO
MACRO
MAC0 "SET BREAK AT @1"
CONTINUE "RUN"
FILENAM "testset.@1"
/OVERWRITE OLDMAC "parr@1[@2]"
/BUTTON Symbols "SHOW ACTIVE @1"
Some macro invocations:
@MAC0 (@LINE20)
SET LOGFILE @FILENAM(log)
@MAC1 (BREAKPOINT,main)
References
DELETE MACRO
SHOW MACRO
SHOW BUTTON
2-16
Debugging C Programs
C79000-G7076-C520-01
Organon XDB Command Set
2.9 DEFINE SYMBOL
Syntax
DEFINE SYMBOL [ /OVERWRITE ]
[ /ADDRESS = <expression> ]
[ /TYPE = "<type>" ]
[ /VALUE = <expression> ]
<symbol-name>
Description
This command generates a symbol called <symbol-name> which behaves
like a debugger variable or a program symbol. The optional parameter /TYPE
can be used to define a type for the symbol. To store an initial value, use the
/VALUE option.
/ADDRESS = <expression>
This optional parameter specifies the address of the symbol. If no address is
given, the symbol is taken to be a debugger variable.
/OVERWRITE
By default, overwriting an existing symbol causes an error message. If this
option is set, only a warning message is issued, and the old symbol is
destroyed.
Examples
DEFINE SYMBOL /TYPE="int" /VALUE=-1 n
DEFINE SYMBOL /OVERWRITE /ADDRESS=2000 main
Debugging C Programs
C79000-G7076-C520-01
2-17
Organon XDB Command Set
2.10 DELETE Commands
Syntax
DELETE <item>
The item to be deleted, <item>, may be one of the following:
BREAKPOINT
BUTTON
DEBUG
DIRECTORY
EVALUATE
2-18
KEY
MACRO
MODULE
TRACEPOINT
WATCHPOINT
Debugging C Programs
C79000-G7076-C520-01
Organon XDB Command Set
2.11 DELETE BREAKPOINT
Syntax
DELETE BREAKPOINT AT <expression>
DELETE BREAKPOINT /ID = <halt-id>
DELETE BREAKPOINT /ALL
Description
A breakpoint is deleted. It can be selected by the ID number or the location
where it is set.
AT <expression>
The expression which yields the address of the breakpoint to be deleted.
/ID=<halt-id>
This is a decimal number or a debugger variable. <halt-id> is the number of
the breakpoint to be deleted.
The ID number and expression of the deleted breakpoint are displayed in the
command window.
/ALL
This option deletes all specified breakpoints.
Examples
DELETE
DELETE
DELETE
DELETE
BREAKPOINT
BREAKPOINT
BREAKPOINT
BREAKPOINT
AT main\@LINE 256
/ID=5
/ALL
AT main
References
DISABLE BREAKPOINT
ENABLE BREAKPOINT
SHOW BREAKPOINT
Debugging C Programs
C79000-G7076-C520-01
2-19
Organon XDB Command Set
2.12 DELETE BUTTON
Syntax
DELETE BUTTON <name>
DELETE BUTTON /ALL
Description
This command can be used to delete a user-defined button. <name> is the
name of the button to be deleted. The option /ALL deletes all user-defined
buttons in the tool bar.
Examples
DELETE BUTTON break
DELETE BUTTON /ALL
References
DEFINE BUTTON
SHOW BUTTON
2-20
Debugging C Programs
C79000-G7076-C520-01
Organon XDB Command Set
2.13 DELETE DEBUG
Syntax
DELETE DEBUG <debug-id>
Description
This command deletes the debug information tree addressed by <debug-id>.
This is useful if a loaded module is changed and compiled again. By deleting
and reloading the debug info the changed version can be debugged without
a restart of the debugger.
Example
DELETE DEBUG 12
References
LOAD /DEBUG
SET DEBUG
SHOW DEBUG
Note
The debug id 0 cannot be deleted.
Debugging C Programs
C79000-G7076-C520-01
2-21
Organon XDB Command Set
2.14 DELETE DIRECTORY
Syntax
DELETE DIRECTORY "<name>"
Description
The directory named <name> is deleted from the list of directories in the
search path.
Example
DELETE DIRECTORY "oldsrcs"
References
SET DIRECTORY
SHOW DIRECTORY
2-22
Debugging C Programs
C79000-G7076-C520-01
Organon XDB Command Set
2.15 DELETE EVALUATE
Syntax
DELETE EVALUATE <expression>
DELETE EVALUATE /ID = <eval-id>
DELETE EVALUATE /ALL
Description
Removes a member from the list of expressions which are to be evaluated at
every program halt.
<expression>
Deletes all items with an equal expression stored.
/ID = <eval-id>
The expression with the ID number <eval-id> is selected.
/ALL
All expressions from the list are deleted.
Examples
DELETE EVALUATE globstat
DELETE EVALUATE /ID = 3
References
DISABLE EVALUATE
ENABLE EVALUATE
SET EVALUATE
SHOW EVALUATE
Debugging C Programs
C79000-G7076-C520-01
2-23
Organon XDB Command Set
2.16 DELETE KEY
Syntax
DELETE KEY <name>
DELETE KEY /ALL
Description
<name>
Deletes the user-definition of the specified key <name>.
/ALL
All user-defined function keys are deleted.
Examples
DELETE KEY F1
DELETE KEY /ALL
References
DEFINE KEY
SHOW KEY
2-24
Debugging C Programs
C79000-G7076-C520-01
Organon XDB Command Set
2.17 DELETE MACRO
Syntax
DELETE MACRO <name>
DELETE MACRO /ALL
Description
<name>
Delete the macro <name>. The macro <name> must be specified without the
leading '@'. Otherwise the content of <name> is considered to be the macro
to be deleted.
/ALL
All currently defined macros are deleted.
Examples
DELETE MACRO getid
DELETE MACRO /ALL
References
DEFINE MACRO
SHOW MACRO
Debugging C Programs
C79000-G7076-C520-01
2-25
Organon XDB Command Set
2.18 DELETE MODULE
Syntax
DELETE MODULE <name>
DELETE MODULE /ALL
Description
This command frees all dynamic memory space needed by the debug
information of the selected module(s). All symbol and line number
information for the selected module are deleted. To regain the information,
the module must be reloaded using the command SET MODULE.
<name>
The module <name> of the internal module list is deleted. This name is not
the file name of the source module. It contains no path name and extension.
/ALL
All modules from the module list are deleted.
The command is invoked internally by XDB when it runs out of heap space.
The current module of the program cannot be deleted.
Use the command SHOW DEBUG to obtain the current status of the
modules.
Examples
DELETE MODULE fileio
DELETE MODULE /ALL
References
SET MODULE
SHOW DEBUG
2-26
Debugging C Programs
C79000-G7076-C520-01
Organon XDB Command Set
2.19 DELETE TRACEPOINT
Syntax
DELETE TRACEPOINT AT <expression>
DELETE TRACEPOINT /ID = <halt-id>
DELETE TRACEPOINT /ALL
Description
A tracepoint is deleted. It can be selected by the ID number or the location
where it is set.
AT <expression>
The expression which yields the address where the tracepoint to be deleted
is located.
/ID=<halt-id>
This is a decimal number or a debugger variable. <halt-id> is the number of
the tracepoint to be deleted.
The ID number and the expression of the deleted tracepoint are displayed in
the command window.
/ALL
This option deletes all specified tracepoints.
Examples
DELETE
DELETE
DELETE
DELETE
TRACEPOINT
TRACEPOINT
TRACEPOINT
TRACEPOINT
AT main\buffercount
AT globptr
/ID=5
/ALL
References
DISABLE TRACEPOINT
ENABLE TRACEPOINT
SHOW TRACEPOINT
Debugging C Programs
C79000-G7076-C520-01
2-27
Organon XDB Command Set
2.20 DELETE WATCHPOINT
Syntax
DELETE WATCHPOINT AT <expression>
DELETE WATCHPOINT /ID = <halt-id>
DELETE WATCHPOINT /ALL
Description
A watchpoint is deleted. It can be selected by the ID number or the location
where it is set.
AT <expression>
The expression which yields the address where the watchpoint to be deleted
is located.
/ID=<halt-id>
This is a decimal number or a debugger variable. <halt-id> is the number of
the watchpoint to be deleted.
The ID number and the expression of the deleted watchpoint are displayed in
the command window.
/ALL
This option deletes all specified watchpoints.
Examples
DELETE
DELETE
DELETE
DELETE
WATCHPOINT
WATCHPOINT
WATCHPOINT
WATCHPOINT
AT main\buffercount
AT globptr
/ID=5
/ALL
References
DISABLE WATCHPOINT
ENABLE WATCHPOINT
SHOW WATCHPOINT
2-28
Debugging C Programs
C79000-G7076-C520-01
Organon XDB Command Set
2.21 DISABLE Commands
Syntax
DISABLE <item>
The item <item> can be one of the following:
BREAKPOINT
EVALUATE
TRACEPOINT
WATCHPOINT
Debugging C Programs
C79000-G7076-C520-01
2-29
Organon XDB Command Set
2.22 DISABLE BREAKPOINT
Syntax
DISABLE BREAKPOINT AT <expression>
DISABLE BREAKPOINT /ID = <halt-id>
DISABLE BREAKPOINT /ALL
Description
A breakpoint is set inactive. This means that a program does not stop at
such a haltpoint. However, XDB preserves all information about the selected
haltpoints in the internal tables. Therefore it is easy to activate them again.
This is very useful if you want to reuse haltpoints with complex conditions
and actions later.
<expression>
This is the expression which yields the address where a breakpoint is
located.
/ID= <halt-id>
This is the number of the breakpoint to be set inactive. It is a decimal number
or a debugger variable containing the ID number.
/ALL
All breakpoints are set inactive.
On the target system this breakpoint is really cleared. The resources (like
debug registers) used by the disabled breakpoint can be reused.
2-30
Debugging C Programs
C79000-G7076-C520-01
Organon XDB Command Set
Examples
DISABLE
DISABLE
DISABLE
DISABLE
BREAKPOINT
BREAKPOINT
BREAKPOINT
BREAKPOINT
AT putrecord
AT calculate\erg0
AT @LINE 170
/ALL
References
DELETE BREAKPOINT
ENABLE BREAKPOINT
SET BREAKPOINT
SHOW BREAKPOINT
Note
The option /HARD is lost by using ENABLE or DISABLE BREAKPOINT command.
Debugging C Programs
C79000-G7076-C520-01
2-31
Organon XDB Command Set
2.23 DISABLE EVALUATE
Syntax
DISABLE EVALUATE <expression>
DISABLE EVALUATE /ID = <id>
DISABLE EVALUATE /ALL
Description
The denoted expression is not evaluated anymore but still remains in the list
of expressions to be evaluated.
<expression>
The item with this expression is disabled. Note that <expression> has to
match literally the expression to be disabled, e.g. "a+b" does not match
"b+a".
/ID = <eval-id>
The expression with the ID number <eval-id> is disabled.
/ALL
All expressions from the list are disabled.
Examples
DISABLE EVALUATE globstat
DISABLE EVALUATE /ID = 3
References
DELETE EVALUATE
ENABLE EVALUATE
SET EVALUATE
SHOW EVALUATE
2-32
Debugging C Programs
C79000-G7076-C520-01
Organon XDB Command Set
2.24 DISABLE TRACEPOINT
Syntax
DISABLE TRACEPOINT AT <expression>
DISABLE TRACEPOINT /ID = <halt-id>
DISABLE TRACEPOINT /ALL
Description
A tracepoint is set inactive. This means that XDB does no longer check the
memory location until this tracepoint is set active again by the ENABLE
TRACEPOINT command. However, XDB preserves all information about the
selected tracepoints in the internal tables. Therefore it is easy to activate
them again.
<expression>
This expression yields the address where a tracepoint is located.
/ID= <halt-id>
This is the number of the tracepoint to be set inactive. It is a decimal number
or a debugger variable containing the ID number.
/ALL
All tracepoints are set inactive.
On the target system this tracepoint is really cleared. The resources (like
debug registers) used by the disabled tracepoint can be reused.
Examples
DISABLE
DISABLE
DISABLE
DISABLE
TRACEPOINT
TRACEPOINT
TRACEPOINT
TRACEPOINT
Debugging C Programs
C79000-G7076-C520-01
AT putrecord
AT calculate\erg0
/ID=@BRKSYM1
/ALL
2-33
Organon XDB Command Set
References
DELETE TRACEPOINT
ENABLE TRACEPOINT
SET TRACEPOINT
SHOW TRACEPOINT
2-34
Debugging C Programs
C79000-G7076-C520-01
Organon XDB Command Set
2.25 DISABLE WATCHPOINT
Syntax
DISABLE WATCHPOINT AT <expression>
DISABLE WATCHPOINT /ID = <halt-id>
DISABLE WATCHPOINT /ALL
Description
A watchpoint is set inactive. This means that a program does not stop at
such a haltpoint. However, XDB preserves all information about the selected
haltpoints in the internal tables. Therefore it is easy to activate them again.
This is very useful if haltpoints with complex conditions and actions are to be
deleted temporarily.
<expression>
This is the expression which yields the address where a watchpoint has been
set.
/ID= <halt-id>
This is the number of the watchpoint to be set inactive. It is a decimal
number or a debugger variable containing the ID number.
/ALL
All watchpoints are set inactive.
On the target system this watchpoint is really cleared. The resources (like
debug registers) used by the disabled watchpoint can be reused.
Debugging C Programs
C79000-G7076-C520-01
2-35
Organon XDB Command Set
Examples
DISABLE
DISABLE
DISABLE
DISABLE
WATCHPOINT
WATCHPOINT
WATCHPOINT
WATCHPOINT
AT putrecord
AT calculate\erg0
/ID=@BRKSYM1
/ALL
References
DELETE WATCHPOINT
ENABLE WATCHPOINT
SET WATCHPOINT
SHOW WATCHPOINT
2-36
Debugging C Programs
C79000-G7076-C520-01
Organon XDB Command Set
2.26 DISPLAY
Syntax
DISPLAY <window>
Description
With this command, it is possible to display additional windows. These
windows can be displayed (and erased) at any time during the debugging
session.
DISPLAY <window>
<window> may have the following values:
ASSEMBLER
GDT
IDT
LDT
MODULE
REGISTER
REMOTE
SOURCE
SYSREG
TASK
DISPLAY ASSEMBLER
Displays the assembler window.
DISPLAY MODULE
Displays the module window. This window shows all modules which are
mentioned in the debug information.
DISPLAY REGISTER
Displays the register window.
DISPLAY REMOTE
Displays the remote window which works like a terminal and shows the
output of the RMOS low level debugger. For details see REMOTE.
DISPLAY SOURCE
Displays the source window.
Debugging C Programs
C79000-G7076-C520-01
2-37
Organon XDB Command Set
DISPLAY TASK
Displays the task window.
DISPLAY GDT
DISPLAY IDT
DISPLAY LDT
DISPLAY SYSREG
These commands are described in the sections following.
Examples
DISPLAY ASSEMBLER
DISPLAY REMOTE
Reference
ERASE
REMOTE
2-38
Debugging C Programs
C79000-G7076-C520-01
Organon XDB Command Set
2.27 DISPLAY Descriptor Table
Syntax
DISPLAY GDT [ /REPEAT = <count> ] [<first>]
DISPLAY IDT [ /REPEAT = <count> ] [<first>]
DISPLAY LDT [ /REPEAT = <count> ] [ /GDT = <index> ] [<first>]
Description
A window displaying one of the descriptor tables GDT (Global Descriptor
Table), LDT (Local Descriptor Table) or IDT (Interrupt Descriptor Table) is
opened.
<first>
This optional expression denotes the number of the first table entry to be
displayed. The default value is 1 for the GDT and 0 otherwise.
/REPEAT=<count>
The expression <count> specifies the number of table entries to be
displayed. If this option is not specified, 64 entries will be displayed.
/GDT=<index>
The expression <index> denotes the number of the GDT entry. This entry
must be an LDT selector. If this option is not specified, the register LDTR is
taken so that the descriptor table of the current task will be displayed.
Examples
DISPLAY IDT
DISPLAY GDT /REPEAT = 20 1
DISPLAY LDT /REPEAT=5 /GDT=1
Reference
ERASE
Debugging C Programs
C79000-G7076-C520-01
2-39
Organon XDB Command Set
2.28 DISPLAY SYSREG
Syntax
DISPLAY SYSREG /<register>
Description
DISPLAY SYSREG displays the system register windows. <register> may
have the following value:
CONTROL
/CONTROL
The 80386 control register window is displayed.
Example
DISPLAY SYSREG /CONTROL
Reference
ERASE SYSREG
2-40
Debugging C Programs
C79000-G7076-C520-01
Organon XDB Command Set
2.29 ENABLE Commands
Syntax
ENABLE <item>
The item <item> can be one of the following:
BREAKPOINT
EVALUATE
TRACEPOINT
WATCHPOINT
Debugging C Programs
C79000-G7076-C520-01
2-41
Organon XDB Command Set
2.30 ENABLE BREAKPOINT
Syntax
ENABLE BREAKPOINT /ID <halt-id>
ENABLE BREAKPOINT /ALL
Description
The breakpoint that was set inactive by DISABLE BREAKPOINT is
reactivated.
<halt-id>
This is the number of the breakpoint to be reactivated. It is a decimal number
or a debugger variable containing the ID number of the breakpoint.
/ALL
All currently inactive breakpoints are set active again.
Examples
ENABLE
ENABLE
ENABLE
ENABLE
BREAKPOINT
BREAKPOINT
BREAKPOINT
BREAKPOINT
/ID=15
AT @LINE 170
AT location
/ALL
References
DELETE BREAKPOINT
DISABLE BREAKPOINT
SET BREAKPOINT
SHOW BREAKPOINT
2-42
Debugging C Programs
C79000-G7076-C520-01
Organon XDB Command Set
2.31 ENABLE EVALUATE
Syntax
ENABLE EVALUATE <expression>
ENABLE EVALUATE /ID = <eval-id>
ENABLE EVALUATE /ALL
Description
The expression which was prevented from evaluation by DISABLE
EVALUATE is to be evaluated again.
<expression>
The item with this expression is enabled. Note that <expression> has to
match literally the expression to be enabled, e.g. "a+b" does not match
"b+a".
/ID = <eval-id>
The expression with the ID number <eval-id> is enabled.
/ALL
All disabled expressions from the list are enabled.
Examples
ENABLE EVALUATE globstat
ENABLE EVALUATE /ID = 3
References
DELETE EVALUATE
DISABLE EVALUATE
SET EVALUATE
SHOW EVALUATE
Debugging C Programs
C79000-G7076-C520-01
2-43
Organon XDB Command Set
2.32 ENABLE TRACEPOINT
Syntax
ENABLE TRACEPOINT /ID <halt-id>
ENABLE TRACEPOINT /ALL
Description
The tracepoint that was set inactive by DISABLE TRACEPOINT is
reactivated.
<halt-id>
This is the number of the tracepoint to be reactivated. It is a decimal number
or a debugger variable which contains the ID number of the tracepoint.
/ALL
All currently inactive tracepoints are set active again.
Examples
ENABLE
ENABLE
ENABLE
ENABLE
TRACEPOINT
TRACEPOINT
TRACEPOINT
TRACEPOINT
/ID=15
/ID=@BPID
AT location
/ALL
References
DELETE TRACEPOINT
DISABLE TRACEPOINT
SET TRACEPOINT
SHOW TRACEPOINT
2-44
Debugging C Programs
C79000-G7076-C520-01
Organon XDB Command Set
2.33 ENABLE WATCHPOINT
Syntax
ENABLE WATCHPOINT /ID <halt-id>
ENABLE WATCHPOINT /ALL
Description
The watchpoint that was set inactive by DISABLE WATCHPOINT is
reactivated.
<halt-id>
This is the number of the watchpoint to be reactivated. It is a decimal number
or a debugger variable which contains the ID number of the watchpoint.
/ALL
All currently inactive watchpoints are set active again.
Examples
ENABLE
ENABLE
ENABLE
ENABLE
WATCHPOINT
WATCHPOINT
WATCHPOINT
WATCHPOINT
/ID=15
/ID=@BPID
AT location
/ALL
References
DELETE WATCHPOINT
DISABLE WATCHPOINT
SET WATCHPOINT
SHOW WATCHPOINT
Debugging C Programs
C79000-G7076-C520-01
2-45
Organon XDB Command Set
2.34 ERASE
Syntax
ERASE <window>
ERASE SYSREG /<window>
Description
<window>
This command closes the window <window>. <window> may have the
following values:
ASSEMBLER
GDT
IDT
LDT
MODULE
REGISTER
REMOTE
SOURCE
SYSREG
TASK
SYSREG /<window>
This command is explained in the chapter ERASE SYSREG.
Example
ERASE REGISTER
Reference
DISPLAY
ERASE SYSREG
2-46
Debugging C Programs
C79000-G7076-C520-01
Organon XDB Command Set
2.35 ERASE SYSREG
Syntax
ERASE SYSREG /<window>
Description
This command closes the system register window <window>. <window> may
have the following value:
CONTROL
Example
ERASE SYSREG /CONTROL
Reference
DISPLAY SYSREG
Debugging C Programs
C79000-G7076-C520-01
2-47
Organon XDB Command Set
2.36 EVALUATE
Syntax
EVALUATE [<format>] [<size>] [/ADDRESS] [/LEVEL[=<nr>]] [/WINDOW[=<nr>]]
<expr>
Description
<expr>
The given expression <expr> is evaluated, and the result is displayed in the
command window. <expr> has to be in the notation of the currently selected
language. If no qualifier is supplied, the output is formatted according to the
type of the result.
All members of structured data types are shown with their member names.
The value of a union is shown in the format of all union members. All
elements of arrays are displayed.
As a default, scalar values are in decimal and all pointers are in hexadecimal
notation.
If a pointer has the value 0, the string “(NIL)“ is printed. In case of function
pointers, the name of the procedure which is referenced by the pointer is
printed.
<format>
The option <format> may be one of the following:
/ASCII [:<length>]
/BINARY
2-48
/DEC
/HEX
/OCTAL
Debugging C Programs
C79000-G7076-C520-01
Organon XDB Command Set
/BINARY
/DEC
/HEX
/OCTAL
Values are shown in binary, decimal, hexadecimal, or octal notation if you
use the /BINARY, /DEC, /HEX, or /OCTAL qualifier.
/ASCII[:<length>]
The qualifier /ASCII is used to show a char pointer or a char array as a
readable string enclosed in double quotes ("). Nonprintable characters are
shown as '.' signs. By default, a string is shown up to the first 0-byte. This
can be avoided by giving a length declaration after the /ASCII qualifier
separated by ':' (/ASCII:<length>). Then up to <length> bytes are shown
where <length> is any expression.
/ADDRESS
The qualifier /ADDRESS shows the address where the result of the
expression is stored. If the expression refers to a register, the register name
is printed. Note that this option is rather meaningless when applied to
expressions like "42" or "i+1" which do not have a memory address.
/LEVEL[=<nr>]
If the expression to be evaluated, <expr>, denotes a structure containing
sub-structures, the /LEVEL qualifier limits the depth of the evaluation to the
number <nr>. If the depth number is omitted, the complete substructure is
taken. This is also the case if the option /LEVEL is omitted.
/WINDOW[=<nr>]
<nr> denotes the ID number of the evaluation window. Using an ID number
not in use at the moment creates a new window. If an evaluation window with
the ID <nr> exists already, this window now evaluates <expr> instead of its
old expression. If no window number is given, a new window is created.
Debugging C Programs
C79000-G7076-C520-01
2-49
Organon XDB Command Set
/<size>
The type of memory access is defined by the qualifier <size>. Possible
values are:
/BYTE
/WORD
/LONG
The amount of memory read from the target must be a multiple of the
selected size. The default is /BYTE. The /<size> option can be used with any
<format> qualifier. It is ignored when /ASCII is used which forces byte
access.
Examples
EVALUATE
EVALUATE
EVALUATE
EVALUATE
EVALUATE
EVALUATE
EVALUATE
EVALUATE
EVALUATE
EVALUATE
EVALUATE
EVALUATE
EVALUATE
EVALUATE
EVALUATE
EVALUATE
EVALUATE
EVALUATE
struct1.member1
(i%5) - 10 + (x * i - b)
ptr->pmember.a[2]
struct1.array[i]
i*10 + struct1.member2 - x
/DEC
pointer1
/DEC
structa
/BIN
ptr->pmember
/OCTAL
i
/HEX struct1.member1
&i
/ADDRESS i
/ADDRESS struct1
/ADDRESS struct1.member1
/ADDRESS ptr->pmember->next->next
/ASCII *char_array[0]
/ASCII:10
*char_pointer
@DBVPTR->next[idx]
References
SET EVALUATE
SET OPTION
2-50
Debugging C Programs
C79000-G7076-C520-01
Organon XDB Command Set
2.37 EXIT
Syntax
EXIT
Description
EXIT terminates the execution of the actual batch file. If EXIT is used
interactively on command level, the debug session is finished.
To avoid leaving XDB by mistake, this command must be confirmed by the
user. The message
really quit ?
appears in a pop-up window. If the Yes button is selected, XDB quits. In any
other cases the command is ignored, and XDB resumes execution.
Example
IF @quit
THEN exit
END
Reference
BATCH
Debugging C Programs
C79000-G7076-C520-01
2-51
Organon XDB Command Set
2.38 GOTO
Syntax
GOTO <label>
Description
This command can be used in a batch file only. It is not allowed to use this
command in interactive mode. The command makes the command execution
continue at the batch file line marked with <Label>. Forward references to
currently undefined labels are allowed, but labels cannot be referenced from
outside of the batch file where they are defined.
<label>
A label is a sequence of letters followed by a ':'.
Example
line
1
2
3
4
text
SET BREAK AT fune
label:RUN
EVALUATE I+J
GOTO label
Reference
Label
2-52
Debugging C Programs
C79000-G7076-C520-01
Organon XDB Command Set
2.39 HELP
Syntax
HELP
Description
You can enter HELP to activate the Windows online help mechanism for XDB. By
default the F1 key is defined as "HELP\n" in the startup.xdb file, so that you can
also press F1 to activate the online help.
Example
HELP
Debugging C Programs
C79000-G7076-C520-01
2-53
Organon XDB Command Set
2.40 IF
Syntax
IF <expression>
THEN <commandlist>
[ELSE <commandlist>]
END
Description
<expression>
<expression> is evaluated. If the result of <expression> is not zero, the
command list between THEN and ELSE (or THEN and END if ELSE is
omitted) is executed. If the result of <expression> is zero, the optional ELSEpart or the command after the END keyword is executed.
<commandlist>
The <commandlist> is an arbitrary list of commands separated by command
delimiters. The command delimiter is the ';' character.
The IF command can be nested.
In batch files it is additionally possible to separate commands with the
newline character.
The whole sequence between IF and END is one command. If it is itself a
member of a command list, the command delimiter must follow the END
keyword.
Example
IF commandtype == 4
THEN
EVALUATE/ASCII *commandname
ELSE
EVALUATE commandclass
END
2-54
Debugging C Programs
C79000-G7076-C520-01
Organon XDB Command Set
References
WHILE
GOTO
Label
Debugging C Programs
C79000-G7076-C520-01
2-55
Organon XDB Command Set
2.41 Label
Syntax
<label>:
Description
The actual line is marked by the label <label>. This command is allowed in
batch files only. Labels must start with an alphabetic character.
Labels can be used as jump targets of the GOTO command.
Example
line
1
2
3
4
text
SET BREAK AT fune
Label:RUN
EVALUATE I+J
GOTO Label
References
GOTO
BATCH
2-56
Debugging C Programs
C79000-G7076-C520-01
Organon XDB Command Set
2.42 LINE
Syntax
LINE
LINE
LINE
LINE
UP [ <lines> ]
DOWN [ <lines> ]
<line-number>
CURRENT
Description
With the LINE command, you can scroll up or down in the source window.
UP [ <lines> ]
DOWN [ <lines> ]
UP or DOWN specifies the direction of the movement. The <lines>
parameter is optional. The default value is 1. The movement is relative to the
currently displayed line.
<line-number>
If UP or DOWN is omitted, <line-number> denotes an absolute line in the
shown source file.
CURRENT
The cursor is positioned at the current location of the program.
Examples
LINE
LINE
LINE
LINE
DOWN
UP 20
127
CURRENT
Debugging C Programs
C79000-G7076-C520-01
2-57
Organon XDB Command Set
Reference
PAGE
Notes
This command is not available in assembler mode because it is tied to the source
window.
2-58
Debugging C Programs
C79000-G7076-C520-01
Organon XDB Command Set
2.43 LOAD
Syntax
LOAD /ARGUMENTS = "<string>"
LOAD /BINARY
/DEBUG[ = <debug-id>]
/GLOBAL
/SEGMENT = "<Loader Result Segment>,<RMOS-Task-ID>"
/TASK[ = <tname>]
OF "<file>"
Description
Load parts of an executable file <file>. The options specify which part of
<file> is to be loaded.
/ARGUMENTS="<string>"
The loaded program gets <string> as parameter list. Blanks are used to split
<string> into several parameters. During a set task /attach command, this
string is passed to the target process.
/BINARY
Binary download of an executable file.
/DEBUG[=<debug-id>]
Debug information of <file> is loaded. If the optional argument <debug-id> is
omitted, a new debug id is created, else the symbols are added to the
symbols of <debug-id>.
/GLOBAL
The segment is assigned to global level, thus the information is not bound to
any task. This means global sharing of segment information.
/SEGMENT="<Loader Result Segment>,<RMOS-Task-ID>"
This option allows you to load the debug information of a file already loaded.
The segment specifier must be included in quotation marks.
Debugging C Programs
C79000-G7076-C520-01
2-59
Organon XDB Command Set
/TASK[=<tname>]
The segment information is assigned to the specified task <tname>. The
taskname must be included in quotation marks. If the task name is omitted,
the current task of the debugger is used.
Note: the debugger searches for a file named tname.BD which contains the
corresponding debug information. This file can be generated using the
PE32BND converter which is part of the XDB distribution. The PE32 file
(output of the Borland TLINK) is converted to a bound file using the syntax:
pe32bnd pe32file
Single tasks can be loaded from the PC file system with the /TASK="<task>"
command of the LOAD command or using the Load requester.
All host versions of XDB386 accept the load command given on the
command line:
LOAD /TASK="c:\rmos\test\test1.386" of test1
LOAD /TASK="a:test2.386" of test2
The second way to load a task is the download method. The following
commands imply that the task resides on floppy disk or on hard disk in the
target:
LOAD /BINARY /TASK="c:\rmos\test\test1.386" of test1
LOAD /BINARY /TASK="a:test2.386" of test2
If the task was loaded successfully, the debugger returns a task-id.
attach that task to the debugger, enter
To
set task /attach /set /id=<task-id>
This command is available via the button „set_task“.
Now the task is started on the target and the CS:EIP is at the entry point.
2-60
Debugging C Programs
C79000-G7076-C520-01
Organon XDB Command Set
Examples
LOAD
LOAD
LOAD
LOAD
/ARGUMENTS = "-f machine.dat" of "simulate.bd"
/TASK="c:\rmos\test\test1.386" of test1
/BINARY /TASK="a:test2.386" of test2
/SEGMENT = "3F8,4D" of "simulate.bd"
References
DELETE DEBUG
SET DEBUG
SET OPTION
SHOW DEBUG
SHOW SEGMENT
Debugging C Programs
C79000-G7076-C520-01
2-61
Organon XDB Command Set
2.44 MESSAGE
Syntax
MESSAGE <string>
Description
A new window is created which displays the message <string>.
This command is especially useful in batch files.
Examples
MESSAGE loading
MESSAGE "loading file, please wait ..."
2-62
Debugging C Programs
C79000-G7076-C520-01
Organon XDB Command Set
2.45 NEXT
Syntax
NEXT [<count>]
Description
NEXT continues the execution of the program. If XDB is in HLL mode, the
next <count> source lines are executed. If a subroutine call occurs, it is
executed, but the line counter is not affected.
On assembler language level, the next <count> instructions are executed.
Subroutines are called, but counted as one instruction.
<count>
If <count> runs to zero, the program is stopped. The default value for
<count> is 1. Note that <count> is not an expression but a number.
Examples
NEXT
NEXT 10
References
RUN
STEP
Debugging C Programs
C79000-G7076-C520-01
2-63
Organon XDB Command Set
2.46 PAGE
Syntax
PAGE [/<window>] <window-direction>
Description
This command is used to scroll in the specified window <window> or in the
current active window.
/<window>
The following values are allowed for <window>:
ASSEMBLER
SOURCE
The active window is the assembler window if the current language is set to
assembler. Otherwise the active window is the source window.
<window-direction>
<window-direction> may have the following values:
<expression>
assembler window only
UP <pages>
DOWN <pages>
TOP
BOTTOM
LEFT <cols>
RIGHT <cols>
NULL
source window only
source window only
source window only
<expression> is allowed for the assembler window only. The disassembly is
set to the address given by <expression>.
UP and DOWN scroll up/down the specified number of pages.
TOP and BOTTOM scroll to the first/last line.
2-64
Debugging C Programs
C79000-G7076-C520-01
Organon XDB Command Set
LEFT, RIGHT and NULL are allowed for the source window only (In this case
the qualifier /SOURCE is not allowed). The window is scrolled to column 0 or
to the specified number of columns into the specified direction.
Examples
PAGE
PAGE
PAGE
PAGE
PAGE
PAGE
PAGE
TOP
DOWN
/ASSEMBLER 0x12400
interface
LEFT 5
RIGHT 10
NULL
References
LINE
Debugging C Programs
C79000-G7076-C520-01
2-65
Organon XDB Command Set
2.47 PRINT
Syntax
PRINT "mask" [, <expression>,...]
Description
PRINT formats the results of the optional listed expressions according to the
format specifications in the string "mask". The output is shown in the
command window and is written to an optional opened protocol file. No
output takes place until the newline symbol "\n" is encountered in "mask".
Subsequent calls of PRINT may be used to build up one line of output. In this
case no other command may be interspersed, because the already stored
output would be lost.
The interpretation of the "mask" string follows the conventions defined by the
ANSI C standard of the library function printf(). Some restrictions to the ANSI
definitions for formatting requests are made:
• the '#' flag is not supported
• the sequence "%n" is ignored, no expression argument should
be given
Examples
PRINT "Current array settings\n"
PRINT "input=%04d \t"
PRINT "result: %f \"%s\"\n", outfl*10.0,sval
Reference
EVALUATE
2-66
Debugging C Programs
C79000-G7076-C520-01
Organon XDB Command Set
2.48 REMOTE
Syntax
REMOTE
Description
The remote window is displayed, and the input and output is directed directly
to the low level debugger on the target.
A simple terminal emulation supporting backspacing, tabs, and newlines is
done.
Typing <ctrl-L>, the remote window is closed and you get back to the
command mode. <ctrl-L> is the default escape sequence. The escape
sequence can be changed using the command SET ESCAPE.
For further information about the low level debugger see in System Software
for M7-300 and 400, Installation and Operation, User Manual.
Example
REMOTE
References
DISPLAY REMOTE
ERASE REMOTE
SET ESCAPE
SET INTERFACE
SHOW ESCAPE
Debugging C Programs
C79000-G7076-C520-01
2-67
Organon XDB Command Set
2.49 RUN
Syntax
RUN
RUN
RUN
RUN
RUN
UNTIL
UNTIL
UNTIL
UNTIL
<expression>
BLOCKEND
PROCEND
CALLS
Description
RUN
The execution of the program is done up to a break- or watchpoint, or up to
the end of the program.
RUN UNTIL <expression>
The execution of the program is done up to a break- or watchpoint, or until
the program reaches the location denoted by <expression>.
RUN UNTIL BLOCKEND
The execution of the program is done up to a break- or watchpoint, or up to
the end of the actual block.
The option UNTIL BLOCKEND is not allowed in the assembler mode. If no
debug information is available, an error message is issued.
RUN UNTIL BLOCKEND cannot work if the function uses non-local jumps in
the corresponding code part, like the function longjmp() in the programming
language C.
RUN UNTIL PROCEND
The execution of the program is done up to a break- or watchpoint, or up to
the end of the function. The option UNTIL PROCEND is not allowed in the
assembler mode. If no debug information is available, an error message is
issued.
2-68
Debugging C Programs
C79000-G7076-C520-01
Organon XDB Command Set
RUN UNTIL PROCEND cannot work if the function uses non-local jumps in
the corresponding code part, like the function longjmp() in the programming
language C.
RUN UNTIL CALLS
This stops execution after returning from the current procedure.
This is also true for own assembler subroutines which effect the execution of
the program in a similar way.
Examples
RUN UNTIL PRINT\@LINE 10
RUN UNTIL callback
RUN UNTIL PROCEND
References
NEXT
STEP
Debugging C Programs
C79000-G7076-C520-01
2-69
Organon XDB Command Set
2.50 SCAN
Syntax
SCAN [/HEADER = "<header>"] "<string>", <address> [<address> ...]
Description
This command is used to read values from the command window and to
store the read values into the memory of the target program. <string> is a
control string following the rules of the C function scanf(). The addresses
following the format string are C-style memory addresses (viz. &<name>).
/HEADER="<header>"
You are prompted for input with the string <header> in the command
window. If no header is given, the string "SCAN>" is used.
Examples
SCAN "%c", &ch
SCAN /HEADER="Set i and j to:" "%d %d", &i, &j
SCAN /HEADER = "a=" "%s", @a
2-70
Debugging C Programs
C79000-G7076-C520-01
Organon XDB Command Set
2.51 SEARCH
Syntax
SEARCH "<regexp>"
Description
In the source file of the active module, a character sequence which matches
the regular expression <regexp> is searched. The environment of the
matched text appears in the source window. If no text is found, the source
window remains unchanged.
<regexp> may contain the wildcard characters '?' for “any character“ and '*'
for “any string of characters“.
Examples
SEARCH "*output"
SEARCH "main"
SEARCH "put??out"
Debugging C Programs
C79000-G7076-C520-01
2-71
Organon XDB Command Set
2.52 SET Commands
Syntax
SET <set_modes>
The following <set_modes> are available:
BREAKPOINT
DEBUG
DESCRIPTOR
DIRECTORY
ESCAPE
EVALUATE
INTERFACE
2-72
LANGUAGE
LOGFILE
MODULE
OPTION
PROTFILE
REGISTER
SCOPE
SCROLL
TASK
TRACEPOINT
VALUE
WATCHPOINT
Debugging C Programs
C79000-G7076-C520-01
Organon XDB Command Set
2.53 SET BREAKPOINT
Syntax
SET BREAKPOINT AT <expression>
[WHEN <expression>]
[SKIP <count>]
[CONTINUE]
[SYMBOL <bid>]
[HARD <number>]
[THEN <actions> END]
Description
AT <expression>
A breakpoint is set at the address specified by <expression>. This can be:
• a line number in a source module denoted as “module\@LINE
xx“ or “@LINE xx“
• a global name of a procedure
• an address
WHEN <expression>
If a WHEN clause is used, the expression is evaluated after the stop of the
program at the breakpoint. If the result is FALSE (zero), the execution of the
program continues. In this case an optional SKIP count remains unchanged.
SKIP <count>
If a SKIP-count is specified, the execution of the program stops first if this
breakpoint is reached for the (count+1)-th time (and the WHEN clause is
true).
Debugging C Programs
C79000-G7076-C520-01
2-73
Organon XDB Command Set
CONTINUE
The CONTINUE qualifier forces XDB to continue execution after processing
the <action>-list. The debugger variable @ERROR is checked. If it has a
non-zero value, the loop is stopped and the next command is executed.
SYMBOL <bid>
The SYMBOL qualifier directs XDB to store the ID number of the breakpoint
into the debugger variable <bid>. This variable can be used in expressions or
to enable, disable, show, or delete this breakpoint.
HARD <number>
The HARD qualifier forces the hardware interface to select the hardware
specific breakpoint specified by <number>. If this breakpoint is not available,
an error message is issued.
With this option the i80386 debug registers can be used directly if they are
not set. Each of the four debug registers can serve as a trace-, watch- or
breakpoint.
XDB issues a warning message if the requested breakpoint cannot be
executed in real time. This is true if a WHEN clause is used.
THEN <actions> END
<actions> is an optional command list, enclosed by the keywords THEN and
END. It is executed if the program stops at this breakpoint. If more than one
action is specified, they must be separated by a delimiter (;).
2-74
Debugging C Programs
C79000-G7076-C520-01
Organon XDB Command Set
Examples
SET BREAKPOINT AT calculate\@LINE 10
SET BREAKPOINT AT rundown
SET BREAKPOINT AT server\hidden
SET BREAKPOINT AT txtofil WHEN outcount > 10
SET BREAKPOINT AT @LINE17 WHEN loop > end+5
EVALUATE temp1
EVALUATE erg
END
THEN
SET BREAKPOINT AT toggle SKIP 20
SET BREAKPOINT AT checkpoint CONTINUE
THEN
EVAL counter
END
SET BREAKPOINT AT fun2 SYMBOL DBID
References
DELETE BREAKPOINT
DISABLE BREAKPOINT
ENABLE BREAKPOINT
SHOW BREAKPOINT
Debugging C Programs
C79000-G7076-C520-01
2-75
Organon XDB Command Set
2.54 SET DEBUG
Syntax
SET DEBUG <debug-id>
Description
Select between multiple debug information trees.
If more than one image was loaded by the debugger, the corresponding
debug information is stored in separate so-called debug trees which are
addressed by a unique number called <debug-id>.
The debugger selects the right debug tree after every program halt
automatically, according to the current location of the application.
With SET DEBUG this selection can be changed, so that the symbols and
types of all other regions of the program can be accessed. After the next
execution of a command as STEP, NEXT or RUN, the debugger switches to
the right <debug-id> automatically.
This allows concurrent debugging of independently linked modules which
decreases the size of the images and allows a finer granularity of application
modules.
The actual <debug-id> is shown enclosed in square brackets ("[]") at the left
field of the baseline of the main window.
Example
SET DEBUG 3
2-76
Debugging C Programs
C79000-G7076-C520-01
Organon XDB Command Set
References
DELETE DEBUG
LOAD /DEBUG
SHOW DEBUG
SHOW SCOPE
Debugging C Programs
C79000-G7076-C520-01
2-77
Organon XDB Command Set
2.55 SET DESCRIPTOR
Syntax
SET DESCRIPTOR
SET DESCRIPTOR
SET DESCRIPTOR
<address>
SET DESCRIPTOR
SET DESCRIPTOR
[/LENGTH = <length>] /GDT <GDT-index> <address>
[/LENGTH = <length>] /IDT <IDT-index> <address>
[/LENGTH = <length>] /LDT [ = <GDT-LDTsel> ] <LDT-index>
[/LENGTH = <length>] /MEMORY <address> <address>
[/LENGTH = <length>] /SELECTOR <selector-value> <address>
Description
This command copies a piece of memory, starting at the address <address>,
formatted as INTEL segment descriptor. The location of the descriptor can
be specified in several ways:
/GDT <GDT-index>
The given expression <GDT-index> is used as index into the GDT of the
target system. The GDTR register is used to get the base address of the
GDT and to check whether the index is inside the current GDT-limit.
/IDT <IDT-index>
The given expression <IDT-index> is used as index into the IDT of the target
system. The IDTR register is used to get the base address of the IDT and to
check whether the index is inside the current IDT-limit.
/LDT[=<GDT-LDTsel>] <LDT-index>
The given expression <LDT-index> is used as index into the LDT of the
target system. The LDTR register is used to get the base address of the LDT
and to check whether the index is inside the current LDT-limit. If the optional
expression <GDT-LDTsel> is specified, this value is used as index into the
GDT to obtain an LDT-descriptor. The value is checked against the current
GDT-limit, and the selected descriptor must be an LDT-descriptor.
/MEMORY <address>
The given expression <address> yields the memory location where the
descriptor is written.
2-78
Debugging C Programs
C79000-G7076-C520-01
Organon XDB Command Set
/SELECTOR <selector-value>
The expression <selector-value> is used as index into the GDT or LDT,
according to the TI-bit of the selector.
/LENGTH = <length>
If this option is specified, <length> descriptors are copied. The default value
is 1.
Examples
SET DESCRIPTOR /GDT 5 0x3000
SET DESCRIPTOR /MEMORY 0x1000 /GDT 5 @address
SET DESCRIPTOR /SELECTOR cs 0x3000
Reference
SHOW DESCRIPTOR
Debugging C Programs
C79000-G7076-C520-01
2-79
Organon XDB Command Set
2.56 SET DIRECTORY
Syntax
SET DIRECTORY "<directory>"
SET DIRECTORY @<var>
Description
The name <directory> (or the contents of the debugger variable @<var>) is
added to the list of search paths for source files. These are used if a source
file cannot be found under the path name stored within the debug information
of the program.
Up to 30 alternative search directories are possible. By setting the
environment variable XDBMAXSRCDIRS to a value >30 this limit can be
increased.
Example
SET DIRECTORY "c:\usr\src\local"
References
DELETE DIRECTORY
SHOW DIRECTORY
SHOW DEBUG
Notes
Disk drive specifications in front of a directory name are accepted.
2-80
Debugging C Programs
C79000-G7076-C520-01
Organon XDB Command Set
2.57 SET ESCAPE
Syntax
SET ESCAPE "<esc_sequence>"
SET ESCAPE @<var>
Description
SET ESCAPE "<esc_sequence>"
The escape sequence to finish the transparent mode is defined. All inputs
from the keyboard are given to the remote system. The input of
<esc_sequence> terminates this state.
SET ESCAPE @<var>
As above, but the contents of the debugger variable @<var> is taken as the
new escape sequence.
The default sequence is '^L' ("ctrl-L"). Control characters are denoted as
"^char". The control characters ^C and ^S must not be used.
Examples
SET ESCAPE "^A"
SET ESCAPE "^Xc"
References
REMOTE
SHOW ESCAPE
Debugging C Programs
C79000-G7076-C520-01
2-81
Organon XDB Command Set
2.58 SET EVALUATE
Syntax
SET EVALUATE [<format>] [<size>] [/ADDRESS] [/LEVEL[=<nr>]]
[/WINDOW[=<nr>]] <expr>
Description
The mentioned <expression> is stored in an internal list. After every STEP,
NEXT or RUN command, all expressions from this list are evaluated, and the
results are written to the command window.
If local variables are monitored, they are evaluated only if they are valid at
the current point of the program.
As a default, scalar values are in decimal and all pointers are in hexadecimal
notation.
If a pointer has the value 0, the string “(NIL)“ is printed. In case of function
pointers, the name of the procedure which is referenced by the pointer is
printed.
format
The option <format> may be one of the following:
/ASCII [:<length>]
/BINARY
2-82
/DEC
/HEX
/OCTAL
Debugging C Programs
C79000-G7076-C520-01
Organon XDB Command Set
/BINARY
/DEC
/HEX
/OCTAL
Values are shown in binary, decimal, hexadecimal, or octal notation if you
use the /BINARY, /DEC, /HEX, or /OCTAL qualifier.
/ASCII[:<length>]
The qualifier /ASCII is used to show a char pointer or a char array as a
readable string enclosed in double quotes ("). Nonprintable characters are
shown as '.' signs. By default, a string is shown up to the first 0-byte. This
can be avoided by giving a length declaration after the /ASCII qualifier
separated by ':' (/ASCII:<length>). Then up to <length> bytes are shown
where <length> is any expression.
/ADDRESS
The qualifier /ADDRESS shows the address where the result of the
expression is stored. If the expression refers to a register, the register name
is printed. Note that this option is rather meaningless when applied to
expressions like "42" or "i+1" which do not have a memory address.
/LEVEL=<nr>
If the expression to be evaluated, <expr>, denotes a structure containing
sub-structures, the /LEVEL qualifier limits the depth of the evaluation to the
number <nr>. If the depth number is omitted, the complete substructure is
taken. This is also the case if the option /LEVEL is omitted.
/WINDOW [=<nr>]
<nr> denotes the ID number of the evaluation window. Using an ID number
not in use at the moment creates a new window. If an evaluation window with
the ID <nr> exists already, this window now evaluates <expr> instead of its
old expression. If no window number is given, a new window is created.
Debugging C Programs
C79000-G7076-C520-01
2-83
Organon XDB Command Set
<size>
The type of memory access is defined by the qualifier <size>. Possible
values are:
/BYTE
/WORD
/LONG
The amount of memory read from the target must be a multiple of the
selected size. The default is /BYTE. The <size> option can be used with any
<format> qualifier. It is ignored when /ASCII is used which forces byte
access.
Examples
SET EVALUATE statusflag
SET EVALUATE iomode\write\arglen
SET EVALUATE token[type]->t_base
Notes
This is not a tracepoint which monitors the expression continuously. No special
services are requested from the target system.
References
DELETE EVALUATE
DISABLE EVALUATE
ENABLE EVALUATE
EVALUATE
SET OPTION
SET TRACEPOINT
SHOW EVALUATE
2-84
Debugging C Programs
C79000-G7076-C520-01
Organon XDB Command Set
2.59 SET INTERFACE
Syntax
SET INTERFACE "<string>"
SET INTERFACE @<var>
Description
The string <string> (or the contents of the debugger variable @<var>) is
given to the hardware interface. This enables the user to set special target
commands without using the REMOTE feature. Control characters are
denoted as "^char", or as "\n", "\t" or "\f".
For further information about the low level debugger see in System Software
for M7-300 and 400, Installation and Operation, User Manual.
Examples
SET INTERFACE "dir task \n"
SET INTERFACE "calc 1+7 \n"
References
REMOTE
Debugging C Programs
C79000-G7076-C520-01
2-85
Organon XDB Command Set
2.60 SET LANGUAGE
Syntax
SET LANGUAGE <language>
Description
The language mode is switched to the given language. The language names
must be fully qualified. This switches the scanning of expressions and the
style of output to that of the specified language.
<language>
Legal values for <language> are:
ASSEMBLER
ASM
C
PASCAL
"ASM" is shorthand for "ASSEMBLER".
Example
SET LANGUAGE pascal
Reference
SHOW LANGUAGE
Notes
SET LANGUAGE C also enables the use of C++ constructs.
2-86
Debugging C Programs
C79000-G7076-C520-01
Organon XDB Command Set
2.61 SET LOGFILE
Syntax
SET LOGFILE [/APPEND] [/OVERWRITE] "<file>"
Description
All commands given after the command SET LOGFILE are stored in the
logfile <file>. <file> can be used as a batch file for further debug sessions.
Some restrictions apply when using logfiles as batch files if XDB works in the
multitasking mode. If the file <file> already exists, this command aborts,
issuing an error message.
/APPEND
If the file <file> already exists, the commands following are written to the end
of the file without destroying the old contents.
/OVERWRITE
If the file <file> already exists, only a warning message is issued and the file
is overwritten.
Example
SET LOGFILE "reuse.bat"
References
BATCH
CLOSE LOGFILE
SET PROTFILE
SHOW LOGFILE
Debugging C Programs
C79000-G7076-C520-01
2-87
Organon XDB Command Set
2.62 SET MODULE
Syntax
SET MODULE <module_name>
SET MODULE /ALL
Description
<module_name>
The module <module_name> is loaded into the debugger and displayed in
the source window. Now all symbolic information and all line information of
this module are available. The scope is set to this module.
/ALL
MODULE/ALL activates all modules of the loaded program. The last loaded
module is displayed.
Examples
SET MODULE main
SET MODULE /ALL
References
DELETE MODULE
SET OPTION
SHOW DEBUG
SHOW MODULE
Notes
The debugger loads the necessary information automatically. A breakpoint at a
procedure inside a module can be set, even if the debug information of this module
is not loaded.
2-88
Debugging C Programs
C79000-G7076-C520-01
Organon XDB Command Set
2.63 SET OPTION
Syntax
SET
SET
SET
SET
SET
SET
SET
SET
SET
SET
SET
SET
OPTION
OPTION
OPTION
OPTION
OPTION
OPTION
OPTION
OPTION
OPTION
OPTION
OPTION
OPTION
/AUTOLOAD = [ON|OFF]
/TASK = [GLOBAL|LOCAL]
/SEGMENT = [GLOBAL|LOCAL]
/TIME = [ON|OFF]
/POINTER = [ASCII|HEX]
/ASSEMBLER = [ON|OFF]
/ASM = [ON|OFF]
/CODE = [USE16|USE32]
/EVALUATE = [BINARY|OCTAL|DEC|HEX|DEFAULT]
/<processor_type> = [ON|OFF]
/MULTITASK = [ON|OFF]
/NOWAIT = [ON|OFF]
Description
Each SET OPTION command enables the setting of one of the global
debugger flags described below.
/AUTOLOAD=[ON|OFF]
If AUTOLOAD is set to ON, XDB loads automatically any required debug
information. Otherwise the user is asked for every module to load. This
option is set to ON by default.
/TASK=[GLOBAL|LOCAL]
If TASK is set to GLOBAL, all target system tasks are assigned to one virtual
debugger task. If TASK is set to LOCAL, all tasks are monitored separately
by XDB. The default value is GLOBAL.
/SEGMENT=[GLOBAL|LOCAL]
The value GLOBAL forces XDB to attach all segments specified at initial load
or LOAD commands to the debugger’s global segment map. If LOCAL is
used, segments are attached to task. The default value is LOCAL.
/TIME=[ON|OFF]
If TIME is set to ON, XDB shows for evaluated tracepoints the current time in
the format hh:mm:ss after the actual address/line. This option is set to OFF
by default.
Debugging C Programs
C79000-G7076-C520-01
2-89
Organon XDB Command Set
/POINTER=[ASCII|HEX]
If a character pointer is referenced, the result can be displayed in
hexadecimal or in ASCII, depending on this option.
/ASSEMBLER=[ON|OFF]
/ASM=[ON|OFF]
If this option is set to ON, the assembler window shows not only the
assembler code but also the appropriate source code lines.
/CODE=[USE16|USE32]
This option determines the way the code segments are interpreted.
/EVALUATE=[BINARY|OCTAL|DEC|HEX|DEFAULT]
This option sets the default display mode for evaluations. The default for this
option is DEC.
/<processor_type>=[ON|OFF]
The selected <processor_type> forces XDB to disassemble opcode due to
the instruction set of the chosen processor. The default for all these options
is OFF. Then disassembly is done for an 80386 processor.
<processor_type> may be one of the following processors:
I80486
PENTIUM
/MULTITASK=[ON|OFF]
This option allows toggling between multitasking mode and compatible
mode. If the option is set to ON XDB works in multitasking mode. If the
option is set to OFF XDB works in compatible mode. This option is set to ON
by default.
/NOWAIT=[ON|OFF]
If this option is set to ON XDB works in the original asynchronous mode. This
is the default. If this option is set to OFF the XDB waits until a RUN, NEXT or
STEP command has been finished.
2-90
Debugging C Programs
C79000-G7076-C520-01
Organon XDB Command Set
Examples
SET
SET
SET
SET
SET
OPTION
OPTION
OPTION
OPTION
OPTION
/AUTOLOAD=ON
/PENTIUM=ON
/SEGMENT=LOCAL
/TASK=GLOBAL
/EVALUATE=HEX
References
EVALUATE
LOAD
SET EVALUATE
SHOW OPTION
SHOW SEGMENT
Debugging C Programs
C79000-G7076-C520-01
2-91
Organon XDB Command Set
2.64 SET PROTFILE
Syntax
SET
SET
SET
SET
PROTFILE
PROTFILE
PROTFILE
PROTFILE
[/APPEND] /WINDOW = <window> "<file>"
[/OVERWRITE] /WINDOW = <window> "<file>"
[/APPEND] /ALL "<file>"
[/OVERWRITE] /ALL "<file>"
Description
"<file>"
Switch on the protocol mechanism for a set of windows. The output of the
window[s] is copied to this file.
/WINDOW=<window>
<window> specifies which window output is to be directed to the protocol file.
The following values are allowed for <window>:
ASSEMBLER
COMMAND
ERROR
EVALUATE
REGISTER
SOURCE
TRACEPOINT
All selected inputs to the system and all outputs of the system are recorded
in the file <file>. The outputs of the system are recorded as comments. The
source of the output is shown with a parenthesed shorthand of the window
name after the comment character. Every window can be tied together to
one protocol file, but several protocol files can receive any combination of
window outputs.
/ALL
If /ALL is used, all in- and outputs are recorded just in the ALL protocol file,
even if other protocol files are opened.
/APPEND
With this option, the output is appended to the selected file, instead of
overwriting it.
2-92
Debugging C Programs
C79000-G7076-C520-01
Organon XDB Command Set
/OVERWRITE
With this option, no warning is issued if a protocol file exists already.
Examples
SET PROTFILE /WINDOW=ASSEMBLER "bericht.prt"
SET PROFFILE /ALL "\log\session.prt"
References
CLOSE PROTFILE
SHOW PROTFILE
Debugging C Programs
C79000-G7076-C520-01
2-93
Organon XDB Command Set
2.65 SET REGISTER
Syntax
SET REGISTER [/SIZE = <size>] <register> = <expr>
Description
<register> = <expr>
The specified hardware register <register> is filled with the value of the
expression <expr>.
/SIZE = <size>
The optional qualifier /SIZE defines the number of bytes which are changed
in the register.
The following values are allowed for <size>:
Value
Description
BYTE
WORD
LONG
1 byte is written
2 bytes are written
4 bytes are written
By default, the whole register is set. The result of <expr> is converted
according to the type and size of the register.
2-94
Register
Legal Sizes
AH
AL
AX
BH
BL
BP
BX
CH
CL
BYTE
BYTE
WORD
BYTE
BYTE
WORD
WORD
BYTE
BYTE
Debugging C Programs
C79000-G7076-C520-01
Organon XDB Command Set
Register
Legal Sizes
CR0
CR2
CR3
CR4
CS
CX
DH
DI
DL
DS
DX
EAX
EBP
EBX
ECX
EDI
EDX
EFL
EIP
ES
ESI
ESP
FS
GDTR
GS
IDTR
LDTR
SI
SP
SS
TR
TR3 4)
TR4 4)
TR5 4)
LONG
LONG
LONG
LONG 3)
WORD
WORD
BYTE
WORD
BYTE
WORD
WORD
BYTE, WORD, LONG
BYTE, WORD, LONG
BYTE, WORD, LONG
BYTE, WORD, LONG
BYTE, WORD, LONG
BYTE, WORD, LONG
LONG
BYTE, WORD, LONG
BYTE
BYTE, WORD, LONG
BYTE, WORD, LONG
WORD
(no /SIZE allowed) 1)
WORD
(no /SIZE allowed) 1)
WORD
WORD
WORD
WORD
WORD
LONG
LONG
LONG
Debugging C Programs
C79000-G7076-C520-01
2-95
Organon XDB Command Set
Register
TR6
TR7
1)
3)
2)
2)
read-only (only for SHOW REGISTER.
only if SET OPTION /PENTIUM=on
Legal Sizes
LONG
LONG
2)
4)
only if SET OPTION /PENTIUM=off
only if SET OPTION /I80486=on (and /PENTIUM=off)
Examples
The following examples are valid for language = ASSEMBLER.
SET
SET
SET
SET
REGISTER EAX = $0000001f
REGISTER /SIZE = WORD ESI=$0017
REGISTER AL = $45
REGISTER DI = $0786
References
DISPLAY REGISTER
SHOW REGISTER
2-96
Debugging C Programs
C79000-G7076-C520-01
Organon XDB Command Set
2.66 SET SCOPE
Syntax
SET
SET
SET
SET
SET
SCOPE
SCOPE
SCOPE
SCOPE
SCOPE
/DOWN[ = <levels>]
/UP[ = <levels>]
/CURRENT
<expression>
@@
Description
Set the scope of the debugger. The term scope means the current visibility of
symbols and types. The source window and the assembler window are
updated to show the corresponding source lines and machine statements
respectively.
The location fields of the program are enclosed in brackets ("[]") to signal that
the address shown is not the current program address.
/DOWN[=<levels>]
With this qualifier, the scope can be moved forward along the current call
stack to show the dynamic call structure of the program. The value of
<levels> defaults to 1.
/UP[=<levels>]
With this qualifier, the scope can be moved backwards along the current call
stack to show the dynamic call structure of the program. The value of
<levels> defaults to 1.
If you set the scope to a procedure not using /UP or /DOWN, its local stack
and register variables cannot be evaluated because they are not
addressable.
Debugging C Programs
C79000-G7076-C520-01
2-97
Organon XDB Command Set
<expression>
The scope can be set to a static position in your program. Allowed
<expressions> are:
<module>\<procedure> <procedure>
/CURRENT,
@@
The scope is set to the location where the program currently halts.
Examples
SET
SET
SET
SET
SET
SCOPE
SCOPE
SCOPE
SCOPE
SCOPE
/UP=2
/DOWN
main\function7
procedure
/CURRENT
References
SHOW SCOPE
SHOW CALLS
Notes
The qualifiers /UP and /DOWN can work correctly only if the list of nested
procedure calls contains only procedures with normal function prologue/epilogue
sequences. These sequences maintain a linked list on the user stack which is used
by XDB to walk up and down. If some procedures do not place themselves into this
list, or do not execute their prologue codes, they are not visible to the debugger.
The latter case happens if a breakpoint is set on a procedure name and the
debugger stops there, and the command SHOW CALLS is used immediately. In this
case the last procedure is missing in the list of nested procedures.
2-98
Debugging C Programs
C79000-G7076-C520-01
Organon XDB Command Set
2.67 SET SCROLL
Syntax
SET SCROLL <mode> [PAGE|CONTINUE]
Description
<mode>
The scroll mode of the command window is set. In the current version,
<mode> can only be EVALUATE.
PAGE
If this qualifier is selected, the output of an EVALUATE command to the
command window stops when it is completely filled. Then the debugger asks
whether to continue or not.
CONTINUE
If this qualifier is selected, the output scrolls without automatic stop. This
mode is the default.
Example
SET SCROLL EVALUATE PAGE
Reference
EVALUATE
Debugging C Programs
C79000-G7076-C520-01
2-99
Organon XDB Command Set
2.68 SET TASK
Syntax
SET
SET
SET
SET
SET
SET
TASK
TASK
TASK
TASK
TASK
TASK
/ATTACH [ /ID=<task_id> ]
/DETACH [ /ID=<task_id> ]
/STEP
/SET [ /ID=<task_id> ]
/DEBUG = <debug_id> [ /ID=<task_id> ]
/KILL
Description
The purpose of this command is task manipulation. Tasks can be switched,
killed, attached and detached.
/ATTACH [ /ID=<task_id>]
With this option, a task is started on the target and attached to the debugger.
If no task is specified by /ID, the current task is attached.
/DETACH [ /ID=<task_id>]
With this option, a task can be detached from the debugger. If no task is
specified by /ID, the current task is detached.
The Organon XDB attempts to exit and then delete the current task with the
command set task/detach as well as enabling assigned memory and
resources.
/STEP
This option modifies the state of the currently monitored task. This allows to
unlock tasks which run into an unpredictable state. The task state is modified
to a normal halted state. The current location of the application is not
changed.
/SET [ /ID=<task_id>]
With this option, the current task is set to the task specified by <task_id>.
2-100
Debugging C Programs
C79000-G7076-C520-01
Organon XDB Command Set
/DEBUG=<debug_id> [ /ID=<task_id>]
With this option, the debug information specified by <debug_id> is assigned
to a task. If no task is specified by /ID, the current task is used.
/KILL
Sends a FREETASK command with the current RMOS task ID to the target,
deletes the task and frees the memory on the target. This option works only if
the task is in state DORMANT (RMOS) / INIT (XDB).
Examples
SET TASK /ATTACH /ID=4
SET TASK /DETACH
SET TASK /SET /ID=1
References
SHOW TASK
Debugging C Programs
C79000-G7076-C520-01
2-101
Organon XDB Command Set
2.69 SET TRACEPOINT
Syntax
SET TRACEPOINT AT <expression> [HARD <number>]
Description
AT <expression>
The result of <expression> is monitored by a tracepoint. When the value of
<expression> is changed, it is displayed in the appropriate window, and the
program continues execution.
HARD <number>
This qualifier forces the hardware interface to select the internal tracepoint
specified by <number>. If this tracepoint is not available, an error message is
issued.
With this option the i80386 debug registers can be used directly if they are
not set. Each of the four debug registers can serve as a trace-, watch- or
breakpoint.
If there is no debug register left or the expression can not be controlled by a
single debug register, the tracepoint is simulated by XDB. In this case XDB
will perform single steps through the program, which causes a very slow
execution of your application task. Therefore XDB issues a warning message
(CAUTION !! : trace- or watchpoint not maskable must be simulated)
which has to be confirmed by the user. The expression is computed and the
result is stored in an internal buffer as a reference value to compare with.
Examples
SET TRACEPOINT AT main\buffercount
SET TRACEPOINT AT globptr HARD 3
References
2-102
Debugging C Programs
C79000-G7076-C520-01
Organon XDB Command Set
DELETE TRACEPOINT
DISABLE TRACEPOINT
ENABLE TRACEPOINT
SET EVALUATE
SET WATCHPOINT
Debugging C Programs
C79000-G7076-C520-01
2-103
Organon XDB Command Set
2.70 SET VALUE
Syntax
SET VALUE [/SIZE = <size>] [/REPEAT = <number>] address = <expression>
SET VALUE [/SIZE = <size>] [/REPEAT = <number>] address = <list>
Description
<address>=<expression>
The value of <expression> is evaluated and written to the address given by
expression <address>. If there is no /SIZE parameter given, the written data
width is equal to the width of the object referenced by <address>. If there is a
/SIZE parameter given, the result is converted unsigned to the size which is
given by <size>, and written. If structured data types are used, only complete
member identifications are allowed.
If <address> is @name, the debugger variable @name is set to the value of
<expression>. Debugger variables inherit the type of the assigned result.
<address>=<list>
<list> is a list of expressions separated by commas. As above, the
expressions are evaluated, converted to the size given by /SIZE, and written
into the memory, starting at address <address>. The amount of memory
accessed is the number of expressions in the list times the length determined
by the option /SIZE. If no /SIZE is given, the written data width is equal to the
width of the object referenced by <address> times the number of
expressions in the list.
/SIZE=<size>
This optional parameter defines the number of bytes to be written.
The following values are allowed for <size>:
2-104
Value
Description
BYTE
WORD
LONG
1 byte is written
2 bytes are written
4 bytes are written
Debugging C Programs
C79000-G7076-C520-01
Organon XDB Command Set
Value
Description
FLOAT
EXTEND
DOUBLE
NEAR16
NEAR32
FAR16
FAR32
CONSTANT <number>
a floating point number is written
an extended number is written
a double number is written
a near 16 pointer is written
a near 32 pointer is written
a far 16 pointer is written
a far 32 pointer is written
number of bytes specified by
<number> are written
/REPEAT=<number>
If this option is specified, the value of <expression2> is written not only into
the address denoted by <expression1> but also to the following <number>
pieces of memory. If, e.g., <number> equals 3, the value of <expression2> is
written four times altogether.
There are internal predefined debugger variables and macro functions. Their
names must not be used to define new XDB variables. If these names are
used for macro definition the predefined function is overwritten and is
available again after deleting the user-defined macro.
Debugging C Programs
C79000-G7076-C520-01
2-105
Organon XDB Command Set
The following internal variables are predefined:
Variable
Meaning
Remark
@BWID
@CS
@CURRLINE
@EFL
@EIP
@ERROR
@ERRORTEXT
@INSTANCE
@LEVEL
@MODULE
@NEST
@PC
@PROCEDURE
@PROCESS
@SOURCEFILE
@SOURCELINE
@STACK
last ID of Break- or Watchpoint
code selector
current line
flags
instruction pointer
last error message number
last error message
incarnation of the actual process
active scope level
active (where the PC is) module
nesting level
actual PC
active procedure
actual process number
current file
source line
0 = "CURRENT"
32 ="WIND"
64 ="TOP"
last reason of program stop
read-only
read-only
read-only
read-only
read-only
writable
read-only
read-only
read-only
read-only
read-only
read-only
read-only
read-only
read-only
read-only
read-only
@STOPREASON
read-only
The following macro functions are predefined (The macro functions offer the
functionality of the C Runtime library function with the same name.):
2-106
Function
Arguments
@ACOS
@ASIN
@ATAN
@ATAN2
@COS
@EXEC
double
double
double
double, double
double
char *
Debugging C Programs
C79000-G7076-C520-01
Organon XDB Command Set
Function
Arguments
@EXP
@FABS
@GETCHAR
@GETS
@ISALNUM
@ISALPHA
@ISASCII
@ISCNTRL
@ISDIGIT
@ISLOWER
@ISPRINT
@ISPUNCT
@ISSPACE
@ISUPPER
@ISXDIGIT
@LOG
@LOG10
@OPRINTF
@POW
@PRINTF
@PUTCHAR
@PUTS
@REG
@SCANF
@SIN
@SQRT
@STRCAT
@STRCMP
@STRCPY
@STRLEN
@STRNCAT
@STRNCMP
@STRNCPY
@TAN
double
double
void
char *
int
int
int
int
int
int
int
int
int
int
int
double
double
char *, ...
double, double
char *, ...
char
char *
register name 1)
char *, ...
double
double
char *, char *
char *, char *
char *, char *
char *
char *, char *, int
char *, char *, int
char *, char *, int
double
Debugging C Programs
C79000-G7076-C520-01
2-107
Organon XDB Command Set
1)
Function
Arguments
@TOASCII
@TOLOWER
@TOUPPER
int
int
int
Valid register names see SET REGISTER
Examples
SET VALUE loop = 10
SET VALUE angle = -1.271e-13
References
EVALUATE
SET REGISTER
2-108
Debugging C Programs
C79000-G7076-C520-01
Organon XDB Command Set
2.71 SET WATCHPOINT
Syntax
SET WATCHPOINT [/LENGTH = <bytes>]
[/ACCESS = [FETCH|READ|WRITE|ALL]]
AT <expression>
[SKIP <count>]
[SYMBOL <dbid>]
[HARD <number>]
[CONTINUE]
[THEN <actions> END]
Description
If the location of <expression> is accessed in a way specified by /ACCESS
and /LENGTH, and the SKIP counter decrements to zero, the program stops.
The default value for <count> is 1, for /LENGTH the size of the result of
<expression>, and for /ACCESS it is WRITE.
If there is no debug register left or the expression can not be controlled by a
single debug register the watchpoint is simulated by XDB. This slows down
the speed dramatically, so that XDB issues a warning message
(CAUTION !! : trace- or watchpoint not maskable must be simulated)
which must be confirmed by the user. Under simulation, only WRITE is
possible as /ACCESS value. Respectively WRITE is possible only if XDB
detects an access, because XDB compares against a reference value.
SKIP <count>
The SKIP qualifier allows to specify a value which delays the stop of
execution until this counter <count> decrements to zero.
CONTINUE
This qualifier lets the program continue after the detection of a watched
condition and after execution of the optional action list. This will not take
place if the debugger variable @ERROR has a non-zero value.
Debugging C Programs
C79000-G7076-C520-01
2-109
Organon XDB Command Set
SYMBOL <dbid>
The SYMBOL qualifier forces XDB to place the ID number of this watchpoint
into the debugger variable <dbid>.
HARD <dbid>
The HARD qualifier forces the hardware interface to select the internal
watchpoint specified by <number>. If this watchpoint is not available, an error
message is issued.
With this option the i80386 debug registers can be used directly if they are
not set. Each of the four debug registers can serve as a trace-, watch- or
breakpoint.
THEN <actions> END
<actions> is an optional command list enclosed between THEN and END.
These commands are executed at every stop at this watchpoint.
/ACCESS=[FETCH|READ|WRITE|ALL]
With the /ACCESS qualifier, the type of memory access can be specified.
Type
Remark
FETCH
READ
WRITE
ALL
code fetch
data read
data write
any
/LENGTH=<bytes>
With this qualifier, the size of the monitored memory region can be specified.
This overrides the default which is the size of the result of <expression>.
For restrictions introduced by the low level hardware interface, refer to the
command SET TRACEPOINT.
2-110
Debugging C Programs
C79000-G7076-C520-01
Organon XDB Command Set
Examples
SET WATCHPOINT AT array[10]
SET WATCHPOINT AT badloc HARD 1
SET WATCHPOINT /ACCESS=WRITE AT deadzone
SET WATCHPOINT /ACCESS=READ AT box1 CONTINUE
THEN
PRINT "fetch mailbox %5d" box1
END
References
DELETE WATCHPOINT
DISABLE WATCHPOINT
ENABLE WATCHPOINT
SET TRACEPOINT
Notes
XDB issues a warning message if the requested watchpoint cannot be executed in
real time.
Debugging C Programs
C79000-G7076-C520-01
2-111
Organon XDB Command Set
2.72 SHOW Commands
Syntax
SHOW <show_modes>
The following <show_modes> are available:
ACTIVE
BREAKPOINT
BUTTON
CALLS
DBVAR
DEBUG
DECLARATOR
DESCRIPTOR
DIRECTORY
ESCAPE
EVALUATE
2-112
INFO
KEY
LANGUAGE
LEVEL
LOGFILE
MACRO
MEMORY
MODULE
OPTION
PROTFILE
REGISTER
SEGMENT
SCOPE
SOURCE
STATUS
SYMBOL
TASK
TRACEPOINT
TYPE
VERSION
WATCHPOINT
Debugging C Programs
C79000-G7076-C520-01
Organon XDB Command Set
2.73 SHOW ACTIVE
Syntax
SHOW
SHOW
SHOW
SHOW
ACTIVE
ACTIVE
ACTIVE
ACTIVE
<level> ["<regexp>"]
GLOBAL ["<regexp>"]
MODULE ["<regexp>"]
CURRENT ["<regexp>"]
Description
<level>
All current active (visible) variables of the debugged program with static level
greater than or equal to <level> are displayed. A procedure has a higher
scope level than a module. <level> = 0 displays all currently active variables.
GLOBAL
MODULE
CURRENT
The symbolic values GLOBAL, MODULE and CURRENT respond to the
scope levels, program global, module global and the current scope of the
program.
<regexp>
If the regular expression <regexp> is specified, only the symbols whose
names match the regular expression <regexp> are displayed.
<regexp> may contain the wildcard characters '?' for “any character“ and '*'
for “any string of characters“.
Examples
SHOW ACTIVE 0
SHOW ACTIVE CURRENT "*ptr*"
SHOW ACTIVE MODULE
References
SHOW LEVEL
SHOW SCOPE
Debugging C Programs
C79000-G7076-C520-01
2-113
Organon XDB Command Set
2.74 SHOW BREAKPOINT
Syntax
SHOW BREAKPOINT AT <expression>
SHOW BREAKPOINT /ID = <halt-id>
SHOW BREAKPOINT /ALL
Description
The status and the count-, expression- and action-parameters for the
breakpoints and their ID numbers are displayed.
The status can be ENABLE, DISABLE, or CURRENT. The status CURRENT
means that the last program stop is caused by this haltpoint.
AT <expression>
The breakpoint at the address denoted by <expression> is displayed.
/ID=<halt-id>
The breakpoint with the ID number <halt-id> is displayed.
/ALL
All existing breakpoints are shown.
Examples
SHOW BREAKPOINT /ID=13
SHOW BREAKPOINT AT @LINE 170
SHOW BREAKPOINT /ALL
References
SET BREAKPOINT
2-114
Debugging C Programs
C79000-G7076-C520-01
Organon XDB Command Set
2.75 SHOW BUTTON
Syntax
SHOW BUTTON <name>
SHOW BUTTON /ALL
Description
This command shows the current mappings of the user-defined button
<name>, or of all currently defined buttons, if /ALL was specified.
Example
SHOW BUTTON restart
References
DEFINE BUTTON
DELETE BUTTON
DEFINE MACRO
Debugging C Programs
C79000-G7076-C520-01
2-115
Organon XDB Command Set
2.76 SHOW CALLS
Syntax
SHOW CALLS [ /ARGUMENTS ] [/LEVEL = <number> ]
Description
A list of all current active functions is displayed.
The output is written to the command window. The first column contains the
address where the procedure was called from. The second one contains the
symbolic name of the address. The module name and the source line the
address in the first column belongs to is shown at the end of the line.
The procedure which matches the current scope setting of the debugger is
marked with
<<< scope
at the end of the line.
/ARGUMENTS
If this option is used, the function arguments are displayed, too. Note that
there are restrictions, because if parameters are stored in registers, they are
hidden by later calls. There are also restrictions if the top level function has
not passed its prologue code which moves the parameters from the stack
into their registers.
/LEVEL=<number>
With /LEVEL only the first <number> of nested calls are displayed.
2-116
Debugging C Programs
C79000-G7076-C520-01
Organon XDB Command Set
Examples
SHOW CALLS
SHOW CALLS/ARGUMENTS
SHOW CALLS/LEVEL=3/ARGUMENTS
Reference
SET SCOPE
Debugging C Programs
C79000-G7076-C520-01
2-117
Organon XDB Command Set
2.77 SHOW DBVAR
Syntax
SHOW DBVAR <regexpr>
Description
All debugger variables which match the regular expression <regexpr> are
printed to the command window. <regexpr> may contain wildcard characters
as '*' or '?'. The regular expression may be enclosed in ““ to protect them
from the keyword scanner.
Examples
SHOW DBVAR "s*"
SHOW DBVAR *
Notes
The @-character is not a part of the variable names and must not be used in the
regular expression.
2-118
Debugging C Programs
C79000-G7076-C520-01
Organon XDB Command Set
2.78 SHOW DEBUG
Syntax
SHOW DEBUG [ /ID [=<debug-id>] ["<module>"] ]
Description
/ID[=<debug-id>]
With the optional /ID parameter a special debug tree can be selected. If the
<debug-id> value is omitted, all available debug IDs with their modules are
displayed. The current ID is enclosed in square brackets.
"<module>"
All or the selected modules are displayed in the command window. They are
marked with “[loaded]“ if their debug information is read in. If there is no
source file found, the module is marked with “[no source]“. Modules of source
files that have a more recent modification date than the program image are
marked with “[modified]“. The optional "<module>" argument can include
wildcard characters such as '*' and '?'.
Examples
SHOW
SHOW
SHOW
SHOW
SHOW
DEBUG
DEBUG "io*"
DEBUG "data"
DEBUG/ID
DEBUG/ID=1 "*link"
References
DELETE DEBUG
LOAD /DEBUG
SET DEBUG
SET MODULE
SET DIRECTORY
Debugging C Programs
C79000-G7076-C520-01
2-119
Organon XDB Command Set
2.79 SHOW DECLARATOR
Syntax
SHOW DECLARATOR <expression>
Description
The type definition of the result of the expression <expression> is displayed.
Sub-array or member specifications are allowed.
Examples
SHOW DECLARATOR strsok.type
SHOW DECLARATOR array[0]
SHOW DECLARATOR *pointer
References
SHOW INFO
SHOW TYPE
2-120
Debugging C Programs
C79000-G7076-C520-01
Organon XDB Command Set
2.80 SHOW DESCRIPTOR
Syntax
SHOW
SHOW
SHOW
SHOW
SHOW
DESCRIPTOR
DESCRIPTOR
DESCRIPTOR
DESCRIPTOR
DESCRIPTOR
[
[
[
[
[
/REPEAT
/REPEAT
/REPEAT
/REPEAT
/REPEAT
=
=
=
=
=
<times>
<times>
<times>
<times>
<times>
]
]
]
]
]
/GDT <GDT-index>
/IDT <IDT-index>
/LDT [ = <GDT-LDTsel> ] <LDT-index>
/MEMORY <address>
/SELECTOR <selector-value>
Description
This command shows pieces of 64 bits of memory formatted as INTEL
segment descriptor. The location of the descriptor can be specified in several
ways:
/GDT <GDT-index>
The given expression <GDT-index> is used as index into the GDT of the
target system. The GDTR register is used to get the base address of the
GDT and to check whether the index is inside the current GDT-limit.
/IDT <IDT-index>
The given expression <IDT-index> is used as index into the IDT of the target
system. The IDTR register is used to get the base address of the IDT and to
check whether the index is inside the current IDT-limit.
/LDT[=<GDT-LDTsel>] <LDT-index>
The given expression <LDT-index> is used as index into the LDT of the
target system. The LDTR register is used to get the base address of the LDT
and to check whether the index is inside the current LDT-limit. If the optional
expression <GDT-LDTsel> is specified, this value is used as index into the
GDT to obtain an LDT-descriptor. The value is checked against the current
GDT-limit, and the selected descriptor must be an LDT-descriptor.
/MEMORY <address>
The given expression <address> yields the memory location where the
descriptor is read.
Debugging C Programs
C79000-G7076-C520-01
2-121
Organon XDB Command Set
/SELECTOR <selector-value>
The expression <selector-value> is used as index into the GDT or LDT,
according to the TI-bit of the selector.
/REPEAT=<times>
The expression <times> specifies how many descriptors are to be displayed.
The default value is 1.
The output shows the memory address, the table where it resides, and a
hexadecimal dump of the addressed memory.
The descriptor fields are decoded and formatted. Based on the type of the
descriptor, various fields are displayed:
Field
Description
base
limit
sel
off
dwcnt
G (granularity)
The base address of the segment
The limit of the segment
The target selector of the gate descriptor
The target offset of the gate descriptor
The argument count of the call-gate descriptor
The granularity of the segment. 1b means that the limit
value is used as byte count, 4k means that the limit value
is used as 4kb page count.
Shows the status of the present bit
The value of the privilege level
The segment attributes
P (present)
dpl
attr
2-122
Debugging C Programs
C79000-G7076-C520-01
Organon XDB Command Set
If attr is a CODE-segment, following abbreviations are used:
Symbol
Description
USE32
USE16
C
N
R
E
A
X
USE32 segment
USE16 segment
conforming segment
non-conforming segment
read-execute segment
execute-only segment
segment accessed
segment not accessed
If attr is a DATA-segment, following abbreviations are used:
Symbol
Description
D
U
W
R
A
X
expand down
expand up
writeable segment
read-only segment
segment accessed
segment not accessed
Examples
SHOW
SHOW
SHOW
SHOW
SHOW
SHOW
DESCRIPTOR/GDT 5
DESCRIPTOR/REPEAT=6 /GDT 5
DESCRIPTOR/IDT idtsel
DESCRIPTOR/MEMORY 0x1000
DESCRIPTOR/SEL cs
DESCRIPTOR/LDT=10 ldtsel
References
SET DESCRIPTOR
SHOW REGISTER
Debugging C Programs
C79000-G7076-C520-01
2-123
Organon XDB Command Set
2.81 SHOW DIRECTORY
Syntax
SHOW DIRECTORY
Description
The current list of alternative search directories for source files is shown.
Example
SHOW DIRECTORY
References
DELETE DIRECTORY
SET DIRECTORY
2-124
Debugging C Programs
C79000-G7076-C520-01
Organon XDB Command Set
2.82 SHOW ESCAPE
Syntax
SHOW ESCAPE
Description
The escape sequence to switch off the transparent mode is displayed.
Example
SHOW ESCAPE
References
REMOTE
SET ESCAPE
Debugging C Programs
C79000-G7076-C520-01
2-125
Organon XDB Command Set
2.83 SHOW EVALUATE
Syntax
SHOW EVALUATE
Description
All currently monitored expressions are displayed in the command window.
Example
SHOW EVALUATE
References
DELETE EVALUATE
DISABLE EVALUATE
ENABLE EVALUATE
SET EVALUATE
2-126
Debugging C Programs
C79000-G7076-C520-01
Organon XDB Command Set
2.84 SHOW INFO
Syntax
SHOW INFO "<regexp>"
Description
SHOW INFO searches through the internal symbol table for type names
which match the regular expression pattern "<regexp>". This pattern may
contain wildcard characters as '*' and '?'. The type tables are searched from
the current scope level upwards.
The types found are displayed in the command window with their scope
levels and full descriptions.
Examples
SHOW INFO "int"
SHOW INFO "struct *"
SHOW INFO "struct s_abc"
References
SHOW DECLARATOR
SHOW TYPE
Debugging C Programs
C79000-G7076-C520-01
2-127
Organon XDB Command Set
2.85 SHOW KEY
Syntax
SHOW KEY <key>
SHOW KEY /ALL
Description
<key>
Displays the definition of the user-defined key <key>.
/ALL
All currently defined keys are displayed.
Examples
SHOW KEY F2
SHOW KEY /ALL
References
DEFINE KEY
DELETE KEY
2-128
Debugging C Programs
C79000-G7076-C520-01
Organon XDB Command Set
2.86 SHOW LANGUAGE
Syntax
SHOW LANGUAGE
Description
Displays the current language setting of the debugger in the command
window.
Example
SHOW LANGUAGE
Reference
SET LANGUAGE
Debugging C Programs
C79000-G7076-C520-01
2-129
Organon XDB Command Set
2.87 SHOW LEVEL
Syntax
SHOW LEVEL
Description
This command shows the static nesting level of the current position. The
static nesting level defines the visibility of symbols and types. 0 stands for
global, 1 for module local, 2 and higher for procedure local.
The debugger displays information if and how this level was reached via the
SET SCOPE command: “[wind]“ means /UP or /DOWN was used, “[walk]“
means <expression> was used.
Example
SHOW LEVEL
References
SET SCOPE
SHOW ACTIVE
2-130
Debugging C Programs
C79000-G7076-C520-01
Organon XDB Command Set
2.88 SHOW LOGFILE
Syntax
SHOW LOGFILE
Description
If a logfile is open, this command shows the name and directory. Otherwise,
you are told that no logfile is used currently.
Example
SHOW LOGFILE
References
CLOSE
SET LOGFILE
Debugging C Programs
C79000-G7076-C520-01
2-131
Organon XDB Command Set
2.89 SHOW MACRO
Syntax
SHOW MACRO "<name>"
SHOW MACRO /ALL
Description
"<name>"
Displays the selected macros and their replacement texts. The <name>
argument may contain wildcard characters as '*' and '?'.
/ALL
With /ALL, all currently defined macros are shown.
Examples
SHOW MACRO /ALL
SHOW MACRO "MAC"
SHOW MACRO "*DEF"
References
DEFINE MACRO
DELETE MACRO
2-132
Debugging C Programs
C79000-G7076-C520-01
Organon XDB Command Set
2.90 SHOW MEMORY
Syntax
SHOW MEMORY [/LENGTH = <length>] [/SIZE = <size>] [/WINDOW] [/<format>]
<expression>
Description
The contents of the memory are shown in hexadecimal and ASCII notation
starting at the address specified by <expression>.
/LENGTH=<length>
The optional parameter /LENGTH defines the number of bytes to be
displayed. The default is 16 bytes.
/SIZE=<size>
The optional parameter /SIZE defines the grouping of the bits in the memory.
The size defaults to BYTE. The following values are allowed for <size>:
Size
Description
BYTE
The contents are displayed as a sequence of byte
values
The contents are displayed as a sequence of 16-bit
words
The contents are displayed as a sequence of 32-bit
long words
The contents are displayed as a sequence of 32bit
IEEE floating point variables
The contents are displayed as a sequence of 64bit
IEEE floating point variables
The contents are displayed as a sequence of 96bit
IEEE floating point variables
WORD
LONG
FLOAT
DOUBLE
EXTENDED
/WINDOW
The memory is displayed in a memory window rather than in the command
window.
Debugging C Programs
C79000-G7076-C520-01
2-133
Organon XDB Command Set
/<format>
This option defines the format of the output. Following values are allowed for
<format>: BINARY, OCTAL, DEC, HEX (which is the default).
Examples
SHOW
SHOW
SHOW
SHOW
SHOW
MEMORY
MEMORY
MEMORY
MEMORY
MEMORY
buffer
/SIZE =
/SIZE =
/SIZE =
/LENGTH
WORD action.statetab
LONG /WINDOW ivttab
DOUBLE tschebytab
= 256 area
References
EVALUATE
SET VALUE
2-134
Debugging C Programs
C79000-G7076-C520-01
Organon XDB Command Set
2.91 SHOW MODULE
Syntax
SHOW MODULE <name>
Description
The source of the module <name> is displayed in the source window. This
does not change the scope of the debugger or load any symbol or debug
information.
Example
SHOW MODULE mainloop
References
SET MODULE
SHOW DEBUG
Debugging C Programs
C79000-G7076-C520-01
2-135
Organon XDB Command Set
2.92 SHOW OPTION
Syntax
SHOW OPTION /<option>
SHOW OPTION /ALL
Description
Displays the current setting of global options.
The set of legal values for <option> depends on the configuration. See the
command SET OPTION for further details.
Examples
SHOW OPTION /ALL
SHOW OPTION /SEGMENT
Reference
SET OPTION
Notes
SHOW OPTION lists the item TIME as TRACETIME.
2-136
Debugging C Programs
C79000-G7076-C520-01
Organon XDB Command Set
2.93 SHOW PROTFILE
Syntax
SHOW PROTFILE
Description
This command tells you which protocol files are currently open (complete
with file name and path name).
Example
SHOW PROTFILE
References
SET PROTFILE
CLOSE
Debugging C Programs
C79000-G7076-C520-01
2-137
Organon XDB Command Set
2.94 SHOW REGISTER
Syntax
SHOW REGISTER <register>
Description
The value of register <register> is displayed in the command window.
General purpose registers are shown in hexadecimal and decimal notation.
Floating point registers are shown as floating point numbers. Special register
values are encoded and shown in symbolic form. The states of status bits
are shown in an abbreviated manner. Lower case letters mean that the bit is
not set, upper case letters indicate that the option is set.
For valid register names see SET REGISTER.
Examples
SHOW
SHOW
SHOW
SHOW
REGISTER
REGISTER
REGISTER
REGISTER
EAX
ES
EBP
DI
References
SET REGISTER
DISPLAY REGISTER
2-138
Debugging C Programs
C79000-G7076-C520-01
Organon XDB Command Set
2.95 SHOW SCOPE
Syntax
SHOW SCOPE
Description
Display the current scope of the debugger. If this is not the scope of the
program, this is marked via [wind] or [walk].
Example
SHOW SCOPE
References
SET SCOPE
SHOW LEVEL
Debugging C Programs
C79000-G7076-C520-01
2-139
Organon XDB Command Set
2.96 SHOW SEGMENT
Syntax
SHOW SEGMENT
Description
Displays the global segment map of the debugger.
The address ranges for logical and physical addresses and the segment
attributes are shown.
Example
SHOW SEGMENT
Reference
LOAD /GLOBAL
2-140
Debugging C Programs
C79000-G7076-C520-01
Organon XDB Command Set
2.97 SHOW SOURCE
Syntax
SHOW SOURCE
Description
The complete file name of the module currently displayed in the source
window is printed. This means you can check which source code is
displayed. This is very useful if several search directories are specified.
Example
SHOW SOURCE
References
SHOW DIRECTORY
SET DIRECTORY
Debugging C Programs
C79000-G7076-C520-01
2-141
Organon XDB Command Set
2.98 SHOW STATUS
Syntax
SHOW STATUS
Description
Displays the current task as well as all debug-IDs loaded by the debugger.
Example
SHOW STATUS
References
SET DEBUG
SHOW DEBUG
2-142
Debugging C Programs
C79000-G7076-C520-01
Organon XDB Command Set
2.99 SHOW SYMBOL
Syntax
SHOW SYMBOL <expression>
Description
The expression <expression> is evaluated, and the result is taken as the
address of a symbol. The nearest global symbol with an optional offset is
displayed.
Examples
SHOW SYMBOL ptrtab[4]
SHOW SYMBOL *funptr
References
EVALUATE /ADDRESS
Debugging C Programs
C79000-G7076-C520-01
2-143
Organon XDB Command Set
2.100 SHOW TASK
Syntax
SHOW TASK /ID[=<task-id>] ]
SHOW TASK ["<taskname>"]
Description
All or the selected tasks are displayed in the command window. Their task
names assigned by the target system, their command line arguments, and
their internal task IDs are displayed.
"<taskname>"
This optional argument can include wildcard characters such as '*' and '?'.
/ID[=<task-id>]
With the optional /ID parameter a particular task can be selected. If the
<task-id> value is omitted, all available task IDs are displayed. The current ID
is enclosed in square brackets.
Examples
SHOW
SHOW
SHOW
SHOW
SHOW
TASK
TASK "io*"
TASK "data"
TASK/ID
TASK/ID=1
Reference
SET TASK
Notes
The shown states have a different meaning than the states of RMOS tasks.
2-144
Debugging C Programs
C79000-G7076-C520-01
Organon XDB Command Set
2.101 SHOW TRACEPOINT
Syntax
SHOW TRACEPOINT AT <expression>
SHOW TRACEPOINT /ID = <halt-id>
SHOW TRACEPOINT /ALL
Description
The status and count-, expression-, and action-parameters for the
tracepoints and their ID numbers are displayed.
The status can be ENABLE or DISABLE.
AT <expression>
The tracepoint at the address denoted by <expression> is displayed.
/ID=<halt-id>
The tracepoint with the ID number <halt-id> is displayed.
/ALL
All existing tracepoints are shown.
Examples
SHOW TRACEPOINT /ID=13
SHOW TRACEPOINT /ID=@DBID
SHOW TRACEPOINT /ALL
References
DELETE TRACEPOINT
SET TRACEPOINT
Debugging C Programs
C79000-G7076-C520-01
2-145
Organon XDB Command Set
2.102 SHOW TYPE
Syntax
SHOW TYPE "<regexp>"
Description
The type definitions of all symbols whose names match the regular
expression <regexp> are displayed.
<regexp> may contain wildcard characters as '*' and '?'.
Only basic types and declarators are used to print the type. If a structured
mode like struct, union or enum is used, their members are expanded
recursively until any non-structured type is found.
Examples
SHOW TYPE "*table"
SHOW TYPE "p?io"
References
SHOW DECLARATOR
SHOW INFO
2-146
Debugging C Programs
C79000-G7076-C520-01
Organon XDB Command Set
2.103 SHOW VERSION
Syntax
SHOW VERSION
Description
This command displays the version number of your XDB version in the
command window.
Example
SHOW VERSION
Debugging C Programs
C79000-G7076-C520-01
2-147
Organon XDB Command Set
2.104 SHOW WATCHPOINT
Syntax
SHOW WATCHPOINT AT <expression>
SHOW WATCHPOINT /ID = <halt-id>
SHOW WATCHPOINT /ALL
Description
The status and count-, expression- and action-parameters for the
watchpoints and their ID numbers are displayed.
The status can be ENABLE, DISABLE or CURRENT. The status CURRENT
means that the last program stop is caused by this watchpoint.
AT <expression>
The watchpoint at the address denoted by <expression> is displayed.
/ID=<halt-id>
The watchpoint with the ID number <halt-id> is displayed.
/ALL
All existing watchpoints are shown.
Examples
SHOW WATCHPOINT /ID=13
SHOW WATCHPOINT /ID=@DBID
SHOW WATCHPOINT /ALL
References
DELETE WATCHPOINT
SET WATCHPOINT
2-148
Debugging C Programs
C79000-G7076-C520-01
Organon XDB Command Set
2.105 SPAWN
Syntax
SPAWN <command> [<arguments>...]
Description
Executes the specified command and passes the optional arguments to it.
Reserved words must be enclosed in double quotes '"'. Arguments with nonalphanumeric characters except '+' and '-' must be enclosed in double
quotes, too. If the argument <command> or <arguments> consists of a
macro name or a debugger variable not being protected by double quotes,
the macro is expanded, or the value of the debugger variable is used.
For executing DOS- or Windows programs the extension „.com“ or „.exe“ has
to be specified. Built-In commands of the COMMAND.COM (dir, copy)
require a special syntax. For the DIR command it is:
SPAWN COMMAND.COM /K DIR
For further details on DOS command processor enter help command on a
DOS prompt.
Example
SPAWN
notepad.exe "d:\\tmp\\notes.txt"
Debugging C Programs
C79000-G7076-C520-01
2-149
Organon XDB Command Set
2.106 STEP
Syntax
STEP [<count>]
STEP /RETURN
STEP /INTO
Description
The next code line of the loaded program is executed. If you are debugging
in assembler level, the next opcode is executed. If a subroutine is called, the
execution of the program stops at the first command of the subroutine.
<count>
With the optional <count> argument, more than 1 line/instruction can be
stepped. The default value for <count> is 1.
/RETURN
Using /RETURN, the actual value on the stack top is interpreted as return
address. At this address a temporary breakpoint is set. There is no check
done whether this address is valid or not. Then the execution is continued.
You should use /RETURN only if the program execution has stopped at the
first command of a subroutine, and the program stack is unchanged.
/INTO
If the step leads to a part of the program the debugger has no debug
information about (e.g. a jump to a system routine), the execution runs
through this part by performing a NEXT. If the option /INTO is specified, XDB
also performs single-steps inside such code.
2-150
Debugging C Programs
C79000-G7076-C520-01
Organon XDB Command Set
Examples
STEP 8
STEP /RETURN
STEP /INTO
References
NEXT
RUN
Debugging C Programs
C79000-G7076-C520-01
2-151
Organon XDB Command Set
2.107 WHILE
Syntax
WHILE <expression> THEN <commandlist> END
Description
As long as the result of <expression> has a value different from 0, the
<commandlist> is executed.
Example
WHILE
crashvalue != 0x1FF
THEN
STEP
END
References
BREAK
CONTINUE
GOTO
2-152
Debugging C Programs
C79000-G7076-C520-01
Organon XDB Error Messages
Debugging C Programs
C79000-G7076-C520-01
3
3-1
Organon XDB Error Messages
3 Error Messages
The following table lists the error messages of Organon XDB. The error message
you get represents the letters of the columns CLASS + CODE. Note that the code of
the messages is sorted in alphabetical order.
CODE
CLASS TEXT
DESCRIPTION
D-D-DIAR
E
address out of sync
The shown address lies between
two opcodes. The task walks
through garbage.
H-H-HWAS
E
hardware breakpoint
already set
The real hardware break point is
set already.
H-H-HWNB
E
too many hardware
breakpoints
The internal table for real
hardware breakpoints overflows.
H-H-HWUB
E
unknown breakpoint
at
The program halts at a
breakpoint which is not found in
the internal tables of the
debugger. Anyone has written
the opcode of the breakpoint into
the target memory.
L-B-ADRR
E
unary & not for
register-variables
The address operator is not
applicable to variables stored in
registers.
L-B-APGNO
E
no line in ASMbuffer, use PAGE
<addr>
The lines up are not in the
assembler buffer; an address is
needed for new disassembly.
L-B-AWND
E
no code displayed
There is no code displayed.
Therefore you cannot move up
or down.
3-2
Debugging C Programs
C79000-G7076-C520-01
Organon XDB Error Messages
CODE
CLASS TEXT
DESCRIPTION
L-B-AWPG
E
no PAGE in
assembler window
The PAGE command is not
allowed in the assembler
window.
L-B-BDBG
E
bad debug
information for
This symbol contains corrupt
debug data.
L-B-BDMU
E
debug info already
loaded
The debug information is loaded
already.
L-B-BEVEX
E
evaluation
The entered expression was not
expression not found found in the internal tables.
L-B-BEVID
E
evaluation ID not
found
This evaluation ID was not found
in the internal tables.
L-B-BID
E
bad id number
IDs must be positive numbers.
L-B-BPNA
E
specified halt not
found, no action
done
The specified break-, watch- or
tracepoint can not be found; the
commands DELETE, ENABLE
or DISABLE are impossible.
L-B-BPOE
E
another breakpoint at Another breakpoint at this
this address already address is already enabled.
enabled
L-B-BPSA
E
breakpoint not
identified by address
More than one breakpoint at the
specified address.
L-B-BPU
W
breakpoint already
on this location
This source location is already
monitored by a breakpoint. It is
set only once.
L-B-BRTP
E
bad range type
It is not allowed to prefix the
shown type with a range
definition.
Debugging C Programs
C79000-G7076-C520-01
3-3
Organon XDB Error Messages
CODE
CLASS TEXT
DESCRIPTION
L-B-BWN
E
invalid window
This command is not allowed in
this window.
L-B-COMT
E
unary ~(bitwise not)
not allowed for
The bitwise not operator is not
allowed for this type.
L-B-CSOP
E
not allowed implicit
cast
The necessary cast of the
operands for this operator is not
allowed for their types.
L-B-CSTW
W
can't cast
The first type cannot be cast to
the second one.
L-B-CSTY
E
can't cast
The first type cannot be cast to
the second one.
L-B-CUMT
E
not current module
The program currently resides in
another module. Use the
command SET MODULE first.
L-B-DBDC
E
create debug-image
descriptor
The set-up of the descriptor for
the shown debug-image failed.
L-B-DBFM
E
bad debug format
The debug information of this file
is corrupt.
L-B-DBID
E
no such debug-id
available
The debugger does not know
the requested debug-id.
L-B-DBND
E
may not delete
debug-id
This debug-id must not be
deleted.
L-B-DBNE
E
undefined debugger- The shown debugger variable is
variable
not defined.
L-B-DBNM
E
can't build debugimage name
3-4
The shown file name cannot be
converted to a debug-image
name.
Debugging C Programs
C79000-G7076-C520-01
Organon XDB Error Messages
CODE
CLASS TEXT
DESCRIPTION
L-B-DBRD
E
debug info error at
An error occurred during reading
and interpreting the debug
information. Possible errors are
corrupt file systems or disk
overflow during compilation.
L-B-DBRO
E
readonly debugger
variable
Try to assign a value to a readonly debugger variable.
L-B-DBSY
E
bad debug symbol
The debug information of a
symbol in this file is corrupt. You
can go on with your debug
session, but the information of
this symbol is lost.
L-B-DBTP
E
no printable type
The type of the shown debugger
variable cannot be converted
into a string word.
L-B-DBVU
E
undefined debugger
variable, get ID
The debugger variable used in
an expression /ID=@.. is not
defined.
L-B-DBVUN
E
undefined debugger
variable
There is no debugger variable
defined with the issued name.
L-B-DBWR
E
wrong debug info
Wrong debug info is used or no
debug info is loaded.
L-B-DID
E
invalid debug-id#
The shown debug-id# is invalid.
Only numbers greater or equal
to zero are allowed.
L-B-DITG
E
different tag names
The tag name of the symbolitem is different from that of the
type information.
Debugging C Programs
C79000-G7076-C520-01
3-5
Organon XDB Error Messages
CODE
CLASS TEXT
DESCRIPTION
L-B-DIVZ
E
division by zero
The current evaluated
expression contains a division by
zero.
L-B-DRNF
E
directory not found
The specified directory was not
found.
L-B-DVRD
E
readonly variable
This debugger variable is
predefined. The user cannot set
the value of a predefined
debugger variable.
L-B-ERANS
E
can't erase
At least one of the two windows
ASSEMBLER without must be displayed.
SOURCE
L-B-ERSNA
E
can't erase SOURCE At least one of the two windows
without ASSEMBLER must be displayed.
L-B-EVIX
E
invalid index-type
The shown value is not allowed
as an array-index.
L-B-EVMX
E
evaluation string too
long
The string for evaluation window
is too long.
L-B-EVRI
E
invalid range
selection
These two values do not form a
valid range. The start value
exceeds the end value.
L-B-FXCV
E
unknown type in
'cast'-expression
The shown tag is not found at
the current scope level.
L-B-HIID
E
no history id
This history-id is not in the
history-pool.
L-B-HIST
E
no history string
No command in the history
string matches this string.
3-6
Debugging C Programs
C79000-G7076-C520-01
Organon XDB Error Messages
CODE
CLASS TEXT
DESCRIPTION
L-B-HXNM
E
can't build hex-file
name
The shown file name cannot be
converted to a hex-file name.
L-B-ILLOP
E
invalid operator for
evaluation
This operator is not a valid
identifier for the command
EVALUATE.
L-B-ILLP
E
illegal pointer
sub/add
These pointers cannot be added
or subtracted because they point
to different types.
L-B-ILTG
E
illegal tag reference
The tag name of the forward
reference is illegal.
L-B-LDHX
E
can't open hex-file
The file with the shown name
cannot be opened.
L-B-LDIS
E
invalid segment
number
A segment number consists of
decimal numbers 0-9 only.
L-B-LDMB
E
missing debug-image The command LOAD needs a
file
debug-image file to load
segments.
L-B-LDNS
E
invalid segment
number
L-B-LDNT
E
for task DEBUG- and The option TASK is not allowed
SEGMENT-option
without the options DEBUG and
needed
SEGMENT.
L-B-LDSA
E
invalid segment
loadaddress
The address must be a decimal
or hexadecimal (which is
prefixed with a '$') number.
L-B-LDSF
E
invalid segment flag
The segment flag can be built up
by the letters A,P,R,W and C.
Debugging C Programs
C79000-G7076-C520-01
A segment number must be in
the range [0..max].
3-7
Organon XDB Error Messages
CODE
CLASS TEXT
DESCRIPTION
L-B-LDSL
E
invalid segment
length
The length must be a decimal or
hexadecimal (which is prefixed
with a '$') number.
L-B-LDSP
E
invalid CPU-space
The CPU-space qualifier can
have the values UD,
UP,UX,SP,SD,SX,XX and CP
L-B-LDSS
E
i/o error
A disk-error occured during
loading an image from the host
system to the target.
L-B-LDTG
E
missing /TASK or
/GLOBAL qualifier
An attempt to download
segments is made without a task
or global specification. The
global-task qualifier is set to ON,
but XDB has currently no task
under control.
L-B-LDTN
E
missing task name
for load
There is no task name specified,
and the TASK option is not set to
global.
L-B-LDUS
E
segment already
used
The shown segment is already
used during the command
LOAD.
L-B-LMAL
E
out of memory,
stopped at
There is not enough memory to
load the debug information of all
modules. The load process
stopped at the issued name, but
does not include this module.
L-B-LNCU
E
no current line
The program stops at an invalid
source line.
3-8
Debugging C Programs
C79000-G7076-C520-01
Organon XDB Error Messages
CODE
CLASS TEXT
DESCRIPTION
L-B-LOGOP
E
can't open logfile
The mentioned file cannot be
opened. Check its name and
your access privileges.
L-B-MBID
E
no such member
The structure/union does not
contain this member.
L-B-MBRK
E
too many breakpoints No more breakpoints available.
L-B-MCUR
E
current module
This module is the current
location of the program.
L-B-MLIN
E
multiple lines for this
address, used line:
There are more than one lines
associated with the evaluated
address.
L-B-MMPU
E
too many memory
pushes
An internal buffer overflows.
Your entered expression is too
complex.
L-B-MNLD
E
module not loaded
The debug information of the
requested module is not loaded
into the debugger.
L-B-MODZ
E
modulo by zero
The current evaluated
expression contains a modulo
operation by zero.
L-B-MOVE
E
Bad move coordinate The given X/Y-position is a bad
position for a window.
L-B-N2PT
E
no pointer left and
right for
This operator does not allow
operands of type pointer on both
sides.
L-B-NADB
E
no active debug
tables
The program halts at an address
where no debug information is
available.
Debugging C Programs
C79000-G7076-C520-01
3-9
Organon XDB Error Messages
CODE
CLASS TEXT
DESCRIPTION
L-B-NADE
E
no addressible
expression
The expression cannot be used
as an address.
L-B-NADR
E
expression not
addressible
The expression cannot be
referenced with a pointer.
L-B-NARR
E
no array type for
This operator does not allow
operands of type array.
L-B-NBEA
E
no physical address
for end of block
The logical end-address of the
current local block cannot be
converted to a physical address.
L-B-NBLK
E
no valid block
The program is not inside a
debugged block or function.
L-B-NCON
E
string constant not
allowed
String constants are not
addressible.
L-B-NCTK
E
no current task
There is no task attached to the
debugger.
L-B-NDIX
E
cannot address as
subarray
The equivalence between
pointers and arrays is only
possible for the first-index stage.
L-B-NEGT
E
unary - not allowed
for
The unary - operator is not
allowed for this type.
L-B-NFLT
E
no float/double type
for
This operator does not allow
operands of type float or double.
L-B-NFNC
E
no procedure type for This operator does not allow
operands of type procedure.
L-B-NIDX
E
no index allowed
3-10
The expression is not of type
array or pointer. An index
(offset) specification is not
allowed.
Debugging C Programs
C79000-G7076-C520-01
Organon XDB Error Messages
CODE
CLASS TEXT
DESCRIPTION
L-B-NIND
E
no indirection
allowed
The expression is usable for
dereferencing or indexing.
L-B-NLNO
E
no code line, use
The given line number does not
point to a real code location. Use
the shown alternatives.
L-B-NMAIN
E
MAIN-symbol not
found for
The language specific entry
point cannot be found for the
current language ore one the
other possible debugger
languages.
L-B-NMB
E
not a struct/union
member for
The term following the “memberof“ operator is not of type
member-of anything.
L-B-NMOF
E
no offset address
The left-side expression is not
suitable to enter using an offset
(no structure/array).
L-B-NOBD
E
boundfile not found
No bound file found for this
debug-id.
L-B-NOEV
E
not a enum-member
The shown string is not a
member of the given
enumeration constant.
L-B-NOEX
E
missing expression
An expression node is required.
Check your input.
L-B-NOHXNM
E
missing filename of
hex-record
The file name of the hex-record
has not been specified.
L-B-NOLV
E
no lvalue
The entered expression is not
usable to form an address.
L-B-NOMV
E
MOVE not allowed
This version of XDB does not
allow the movement of windows.
Debugging C Programs
C79000-G7076-C520-01
3-11
Organon XDB Error Messages
CODE
CLASS TEXT
DESCRIPTION
L-B-NOP
E
no binary operator
The operator is not usable for an
expression with 2 operands.
L-B-NOSP
E
no SPAWN
command
This version of XDB does not
support the command SPAWN.
L-B-NOTG
E
no target type
This type is not a structure/union
or enum.
L-B-NOTK
E
no task to reset
There is no task known for the
debugger.
L-B-NOTT
E
unary ! not allowed
for
The unary !-operator is not
allowed for this type.
L-B-NOTY
E
command not yet
implemented
This command is not usable in
this release. Check the release
notes of further updates.
L-B-NPEA
E
no physical address
for end of procedure
The logical end-address of a
procedure cannot be converted
to a physical address.
L-B-NPRC
E
no valid procedure
XDB is currently not inside a
debugged function.
L-B-NPTR
E
no pointer type for
This operator does not allow
operands of type pointer.
L-B-NSGA
E
no segment list
There is no segment list
available.
L-B-NSMO
E
no source module
displayed
The source window does not
contain a source module. Use
the command SHOW or SET
MODULE first.
L-B-NSNF
E
segment name not
found
The given segment name was
not found in the segment list.
3-12
Debugging C Programs
C79000-G7076-C520-01
Organon XDB Error Messages
CODE
CLASS TEXT
DESCRIPTION
L-B-NSTC
E
no struct/union
referenced by
L-B-NSUE
E
no struct/enum/union This operator does not allow
types for
structured types.
L-B-NTKS
E
no segments for task The shown task contains no
physical segments.
L-B-NTP
E
no type information
The operands have no type
information.
L-B-NTSK
E
no task for PC=
None of the assigned address
spaces of the task matches the
given PC value.
L-B-NUSP
E
no struct/union
pointer
The expression left of '->' is not
a structure or union pointer.
L-B-OBNM
E
module not found
The shown module name is not
found in the internal list of
loaded modules.
L-B-OJRD
E
object-format-error
The shown object file is corrupt
and cannot be read in by the
debugger correctly.
L-B-ONEP
E
procedure in
epilogue
The end of the procedure is
reached already.
L-B-OPBD
E
can't open
The mentioned boundfile cannot
be opened. This file contains the
symbol and debug information.
L-B-OPOJ
E
can't open object file
The shown object file cannot be
opened.
L-B-OVFL
W
near pointer overflow The given near pointer with its
offset exceeds a 16 bit value.
Debugging C Programs
C79000-G7076-C520-01
The left side of the expression is
neither a structure nor a union.
3-13
Organon XDB Error Messages
CODE
CLASS TEXT
DESCRIPTION
L-B-PDIR
E
illegal PAGEdirection
The direction word after the
PAGE command is not allowed
in HLL-mode.
L-B-PRFM
E
bad format
specification
The shown format string is not
valid.
L-B-PRMA
E
missing argument
expression
The PRINT command is called
with less argument expressions
than required in the given format
string.
L-B-PRTEX
W
protfile already exists The protocol file exists already.
Confirm overwriting.
L-B-PRTOP
E
can't open protfile
The mentioned file cannot be
opened. Check its name and
your access privileges.
L-B-PSUB
E
illegal pointer
subtraction
The two pointers cannot be
subtracted because they point to
different types.
L-B-RGGP
E
no CPU register
This register is not a general
purpose CPU register.
L-B-RGNV
E
register not valid
This register is not accessible
now.
L-B-RGSE
E
can't set value of
This register cannot be modified
by the debugger.
L-B-RGSH
E
can't show value of
This register cannot be shown
by the debugger.
L-B-RGSZ
E
illegal register size
The mentioned register cannot
be entered with this size
parameter.
3-14
Debugging C Programs
C79000-G7076-C520-01
Organon XDB Error Messages
CODE
CLASS TEXT
DESCRIPTION
L-B-RLSZ
E
size of expression
exceeds buffer limit
The result of an expression is
too big. It is probably a very big
structure in an expression.
L-B-RLVO
E
value of VOID ?
A value of a void type
expression is requested.
L-B-RMAP
E
register not
accessible
The symbol is located in a
register. The value of this
register is currently saved at an
unknown position at the stack.
L-B-RNOV
W
range-selection
overflow
The selected range of index
values exceeds the number of
elements of this array.
L-B-RSNE
E
too deep nested
stack
The runtime stack is nested too
deeply. The internal buffer for
tracking the stack-frame is filled
completely.
L-B-SCCM
E
no current module
There is no module currently
used.
L-B-SCCP
E
no current procedure There is no procedure currently
used.
L-B-SCID
E
no valid identifier
This expression is not a valid
identifier for the command SET
SCOPE.
L-B-SCLN
E
line number too high
The given line number is outside
the module.
L-B-SCNE
E
scope stack deeply
nested
The dynamic stack of local
symbol tables overflows. There
are currently too many active
procedures.
Debugging C Programs
C79000-G7076-C520-01
3-15
Organon XDB Error Messages
CODE
CLASS TEXT
DESCRIPTION
L-B-SCNL
E
no current line
The program is not at a correct
source line.
L-B-SCNM
E
no such module
This module is not found in the
debug tables.
L-B-SCNP
E
no procedure
The mentioned procedure name
is not in the given module.
L-B-SCNR
E
no global scope
The debugger is not located at
any debug information.
L-B-SGNF
E
segment not found
The given address is not
included in the segment list.
L-B-SHAL
E
level too high
The requested scope level is
higher than the current level of
the program.
L-B-SHMA
E
expression not
addressible
The result of the expression in
not located in memory.
L-B-SHMO
E
no such module
The issued module name cannot
be found in the debug tables.
L-B-SHMR
E
expression evaluated The result of the expression is
to register
located in a register.
L-B-SMBO
W
already at bottom
The source window already
displays the last lines of this
module.
L-B-SMBT
W
can't go down
The source window cannot be
moved down so many lines. The
debugger goes to the last line.
L-B-SMLE
W
already at left border The source window already
displays the first column.
3-16
Debugging C Programs
C79000-G7076-C520-01
Organon XDB Error Messages
CODE
CLASS TEXT
DESCRIPTION
L-B-SMLN
W
can't go to
The source window cannot be
moved to that line. The
debugger goes to the last line.
L-B-SMTO
W
already at top
The source window already
displays the first lines of this
module.
L-B-SMTP
W
can't go up
The source window cannot be
moved up so many lines. The
debugger goes to line 1.
L-B-SRNF
E
string not found
The shown pattern was not
found in the current source file.
L-B-STFR
E
Corrupt stack-frame
at
An illegal return-address is
fetched during a walk through
the dynamic procedure link on
the stack.
L-B-STOP
E
unrecognized option
This option is no valid argument
for the command SET OPTION.
L-B-STSB
E
on top of stack
The symbolic scope is already
on top of stack.
L-B-STSC
E
not on active stack
The symbolic scope is not at any
of the currently active
procedures. Use the command
SET SCOPE/CURRENT to get
back on the active frame, and
then you can use /UP and
/DOWN.
L-B-STSE
E
move scope not
implemented
This command is currently not
usable.
Debugging C Programs
C79000-G7076-C520-01
3-17
Organon XDB Error Messages
CODE
CLASS TEXT
DESCRIPTION
L-B-STSM
E
procedure not in
current module
The given procedure is not in the
current module.
L-B-STSR
E
relative scope
changes not allowed
in assembler
The relative changes of scope
with /UP and /DOWN are not
allowed in language assembler.
L-B-STST
W
on bottom of stack
The symbolic scope has
reached the lower end of the
stack frame.
L-B-STSZ
E
illegal size
The qualifier of the size option is
illegal.
L-B-STTR
W
Unable to track callframes, stop unwind
The current frame cannot be
unwinded. The loop is stopped,
thus not all procedures are
currently visible on stack.
L-B-SVCO
E
set value of a
constant expression
only in assembler
Set value of a constant
expression is possible in
language assembler only.
L-B-SYBA
W
address not resolved The address lies outside of any
known memory region.
L-B-SYMB
E
symbol not found
The symbol is not found in the
requested scope. Possibly the
name is wrong or the path name
specification is insufficient.
L-B-SYNA
E
symbol not
addressible
The symbol is not reachable at
this state of the debugger scope
view.
3-18
Debugging C Programs
C79000-G7076-C520-01
Organon XDB Error Messages
CODE
CLASS TEXT
DESCRIPTION
L-B-SYTY
W
no type information
for, 'int' assumed
The issued symbol references to
an unknown type. This is a
problem of the debug
information writer in the
compiler. The debugger
assumes an integer type for this
symbol.
L-B-TID
E
invalid task-id#
The shown task-id# is invalid.
Only numbers greater or equal
to zero are allowed.
L-B-TKCP
E
capture task failed
An attempt to get the shown task
under control of the debugger
failed again.
L-B-TKEC
E
unmonitored
exception
The shown exception is detected
by the hardware interface but
the debugger does not control it.
L-B-TKEN
E
invalid exception
code
The shown exception code
issued by the hardware interface
is illegal. Check your monitor.
L-B-TKER
E
task
This task cannot be continued
because it is in error state.
Terminate this task and restart it.
L-B-TKID
E
no such task-id
available
The requested task-id is not
known by the debugger.
L-B-TKIF
E
INFO about task
needed
Neither a task name nor
arguments exists.
L-B-TKIN
E
invalid command
The requested command is not
allowed for this task.
Debugging C Programs
C79000-G7076-C520-01
3-19
Organon XDB Error Messages
CODE
CLASS TEXT
DESCRIPTION
L-B-TXNR
E
no running task
There is no monitored running
task; thus no active stack frame
can be shown.
L-B-TYFX
E
cannot fixup
typename
The shown type name is
referenced, but its definition is
not found in any debug table.
L-B-TYMK
E
can't construct this
type
This type cannot be generated
internally by the debugger.
L-B-UDTY
E
undefined type
The shown type is referenced
but not defined.
L-B-UPLNM
E
can't build upload-file The shown file name cannot be
name
converted to an upload-file
name.
L-B-UPLOP
E
can't open file
The mentioned file cannot be
opened. Check its name and
your access privileges.
L-B-VART
E
variable return offset
The return address offset is
variable and there is no prologue
information about this function
available.
L-B-ZSTY
E
zero sized type
The shown type occupies 0
bytes of memory.
M-D-BAOP
E
can't open BATCH
file
This file cannot be read. Check
its name and your permissions.
M-D-FMIOE
E
Disk-i/o error no-#
The disk-i/o system interface
detects an error.
M-D-FMIOW
E
Disk-i/o warning no-# The disk-i/o system interface
detects a warning.
3-20
Debugging C Programs
C79000-G7076-C520-01
Organon XDB Error Messages
CODE
CLASS TEXT
DESCRIPTION
M-D-IONE
E
too deeply nested
input
Your input sources (BATCH-file,
MACROS) are nested too
deeply.
M-H-HEAM
E
ambiguous topic
name
The input string matches more
than one help topic. Supply
more characters.
M-H-HEFM
E
HELP-file format
error
The help file is corrupt. Check
your disk and restore it.
M-H-HEIN
E
can't setup HELP
The help feature cannot be
started. Check the correctness
of your help file.
M-H-HEOP
E
can't open HELP file
The help file cannot be opened.
Check your installation or disk.
M-H-HEUN
E
unknown topic
This topic is not found in the
help tables.
M-I-HICM
E
illegal history
command
This command is not allowed in
HISTORY mode. Consult your
manual.
M-I-HIDL
E
delete history /ID=
The deletion of the history
member with <id> failed.
M-I-HIID
E
no command word
The entered string is not a
command word.
M-I-HIOP
E
can't open help file
The help-test database cannot
be opened.
M-M-CLAC
E
read/write-access
denied
The shown device cannot be
used for read- and write-i/o.
M-M-CLOK
W
Target i/o redirected
to
The target in-/output is
redirected to the shown device.
Debugging C Programs
C79000-G7076-C520-01
3-21
Organon XDB Error Messages
CODE
CLASS TEXT
DESCRIPTION
M-M-MABE
E
error in creating
debug file name
The input file name cannot be
modified to the name of the
debug file. Check path name
and length of file name.
M-M-MACV
E
preprocessing debug The preprocessor for the input
info failed
file failed. Check your
permissions and disk quota.
M-M-MAIT
W
target not initialized
The target initialization is not
possible.
M-M-MALO
E
error in initialization
The internal set-up of the
debugger fails.
M-M-MASU
E
error in setup
The basic set-up of the
debugger with the configuration
file failed.
M-M-MINF
E
too many input files
The debugger was started with
too many input images.
M-M-MSDI
E
too many source
directories
The limit of search directories for
source directories is exceeded.
M-M-NCTK
E
no attached task
The debugger has no current
attached task.
M-M-PWAP
E
absolute path
needed in spite of
The call of XDB needs an
absolute pathname.
M-M-PWCF
E
create password file
The password file cannot be
opened for writing. Check the
permissions.
M-M-PWDL
E
missing security key
...
The security mechanism is
corrupted.
3-22
Debugging C Programs
C79000-G7076-C520-01
Organon XDB Error Messages
CODE
CLASS TEXT
DESCRIPTION
M-M-PWHI
E
get host identification The id of the host system XDB
currently runs on cannot be
read.
M-M-PWIL
E
too long input
The input line was too long.
M-M-PWKY
E
make key path
The path to the XDB license file
cannot be made.
M-M-PWLF
E
create lock file
The lock file cannot be opened
for writing. Check the
permissions.
M-M-PWLK
E
make lock path
The path to the lock directory
cannot be made.
M-M-PWNP
W
path not found
The path to XDB was not found.
M-M-PWOL
E
open lock directory
The lock directory was not
found.
M-M-PWWF
E
write to password file Write error on password file.
Check disk quota.
M-M-SMVN
W
file-version not
available, '0'
assumed
The shown file is not accessible
with the original version number.
M-M-TCLI
E
can't redirect XDB
and CHILD output
Only one of them can be
redirected to another in/outdevice.
M-M-TLAC
E
read/write-access
denied
The shown device cannot be
used for read- and write-i/o.
M-M-TLOK
W
Debugger i/o
redirected to
The in-/output of XDB is
Debugging C Programs
C79000-G7076-C520-01
redirected to the shown device.
3-23
Organon XDB Error Messages
CODE
CLASS TEXT
DESCRIPTION
U-E-AGREG
E
CPU register
expected
The second parameter of an
indirect addressing mode has to
be a register.
U-E-AILL
E
illegal expression
The input string does not form a
legal assembler expression.
U-E-AIREG
E
index-register
required
A register is required which is
suitable for an indexed
addressing mode.
U-E-AMISS
E
missing
Supply it.
U-E-ARPAR
E
missing ')'
A ')' is missing. Supply it.
U-E-CID
E
identifier required
A C-Identifier is necessary at this
point of the expression.
U-E-CMA
E
',' expected, not
The ',' is missing between two
expressions in an argument list.
U-E-CNUN
E
no unary
The shown string does not form
a unary expression.
U-E-CRBR
E
']' expected
The closing ']' is missing after an
array index.
U-E-CRPAR
E
missing ')'
The closing ')' is missing after an
expression.
U-E-EP
E
wrong identifier path
name
An identifier can be prefixed by a
path name which selects an
other scope as the default. The
path name consists of identifiers,
level numbers and ' ' characters
only.
3-24
Debugging C Programs
C79000-G7076-C520-01
Organon XDB Error Messages
CODE
CLASS TEXT
DESCRIPTION
U-E-EXPR
E
missing expression,
not
An expression was expected
during reading of an argument
list.
U-E-FCOM
E
COMMON block
member expected
An identifier containing a
common block member name is
required.
U-E-FNUN
E
no unary
The shown string does not form
a unary expression.
U-E-FOLWORD
E
invalid command
The entered word is not allowed.
U-E-FOPER
E
unknown F77
operator
This string does not match any
F77 operator.
U-E-FRPAR
E
')' expected
The closing ')' after a FORTRAN
expression is missing.
U-E-LNR
E
line number expected A number constant for an
@LINE expression is needed.
U-E-LNV
E
@LINE or @LEVEL
expected
The expression allows a line
number or level number only.
U-E-LV
E
level number
expected
A number constant used as level
is requested.
U-E-NCMA
E
missing argument
separator
The ',' is missing between two
expressions of an argument list.
U-E-OPTL
E
operator name too
long
The name of the given operator
exceeds 7 characters.
U-E-PID
E
identifier expected
This is not an identifier name.
U-E-PNUN
E
no unary
The shown string does not form
a unary expression.
Debugging C Programs
C79000-G7076-C520-01
3-25
Organon XDB Error Messages
CODE
CLASS TEXT
DESCRIPTION
U-E-PRBR
E
']' expected
The closing ']' is missing after an
array index.
U-E-PRPAR
E
')' expected
The closing ')' after a PASCAL
expression is missing.
U-E-REGI
E
invalid register
This name is no CPU general
purpose register of the target
processor.
U-E-TLP
E
too many path
prefixes
The path specification of an
identifier contains more than the
allowed specifications of module,
procedure and level.
U-E-XID
E
identifier required
A C-Identifier is necessary at this
point of the expression.
U-E-XNUN
E
no unary
The shown string does not form
a unary expression.
U-E-XRBR
E
')' expected
The closing ')' is missing after an
array index.
U-E-XRPAR
E
missing ')'
The closing ')' is missing after an
expression.
U-L-CHRDEL
E
char-const delimiter
missing
A character constant has to be
enclosed in single quotes.
U-L-EOI
E
unexpected End-ofInput on
The end-of-input condition was
set by the mentioned input
source. Check the source, e.g. a
truncated BATCH-file or a
corrupt MACRO-body definition.
3-26
Debugging C Programs
C79000-G7076-C520-01
Organon XDB Error Messages
CODE
CLASS TEXT
DESCRIPTION
U-L-ICHAR
E
invalid number-prefix The prefix of a numeric-constant
is not the regular prefix for
OCTAL (0) or HEXADECIMAL
(0x,$) numbers.
U-L-IDTOL
E
identifier too long
An identifier name longer than
79 characters was entered.
U-L-NONASC
E
non-ASCII char
A value larger than 7 bits was
read from the input. Only values
between 0 and 127 are allowed
(ASCII-character set). Possibly
an unmonitored function/control
key or a mouse button was
pressed.
U-L-NTOL
E
number too long
A numberic-string longer than 79
characters was entered.
U-L-STRNT
E
unterminated stringconstant
The delimiter character '"' is
missing. Supply one.
U-L-STRTL
E
string-constant too
long
A string constant longer than 79
characters was entered.
U-L-UPBOF
F
input-overflow
An overflow of the internal inputbuffer occurs during scanning
the actual input line.
U-M-MAAI
E
Wrong parameter
number
The shown number is not in the
range of the called argument
parameter list.
U-M-MADF
E
Macro already
defined
The issued macro name is used
already.
U-M-MANA
E
Too many arguments The issued macro is called with
passed
an improper count of arguments.
Debugging C Programs
C79000-G7076-C520-01
3-27
Organon XDB Error Messages
CODE
CLASS TEXT
DESCRIPTION
U-M-MANF
E
Macro not defined
The issued macro is not defined.
There is no deletion possible.
U-M-MARD
W
Macro redefined
This macro is redefined. The old
definition is lost.
U-M-NIMA
E
Not an immediate
addressing mode
The shown expression does not
form an immediate addressing
mode.
U-M-SPC
E
illegal CPU-space
qualifier
The shown name does not
specify any legal addressing
space of the processor.
U-M-SPTK
E
illegal SPAWN
argument
The given string is not allowed
as argument to SPAWN; enclose
it in double quotes.
U-M-SPTL
E
too long argument list The maximal size of an
argument list for SPAWN is
exceeded.
U-P-AMBK
E
Ambiguous keyword
The shown string is too short.
This string matches to more than
one keyword. Supply more
characters.
U-P-CUGOTO
E
bad label name
This is not a correct label
specifier. An alphanumeric name
is needed.
U-P-EXIT
E
misplaced EXIT
The EXIT call is allowed on
WINDOW-input level only.
U-P-FLAB
E
not in BATCH-File
Labels are allowed in BATCHinput mode only.
U-P-IFNEX
E
missing expression
The boolean expression is
missing.
3-28
Debugging C Programs
C79000-G7076-C520-01
Organon XDB Error Messages
CODE
CLASS TEXT
DESCRIPTION
U-P-IFRET
E
dangling END-if
End-of-input is reached inside
the IF-body. Check the input.
U-P-IFTHE
E
THEN expected
The keyword THEN is necessary
at this point of input.
U-P-IFTHP
E
END expected
The keyword END is necessary
to terminate the action list of a
true/false node in an IF
construct.
U-P-ILLEX
E
illegal expression
The entered string does not form
an expression in the current
input language.
U-P-ILLRW
E
illegal keyword
The entered word is no keyword.
U-P-ILLTK
E
illegal keyword
This keyword is not allowed
here. Look at your manual for
the correct syntax.
U-P-INLAB
E
label already defined A label can be defined only
once.
U-P-MLAB
E
too many labels
Too many labels are defined.
Reduce your input.
U-P-NHIST
E
no history
The command HISTORY is
allowed on WINDOW-level only.
U-P-NOFILE
E
missing BATCH-file
name
The name of the batchfile is
missing.
U-P-NREG
E
not a register-name
This is not a name of any of the
target CPU registers.
U-P-NSTR
E
no BATCH-file name
The entered string is not a string
constant.
Debugging C Programs
C79000-G7076-C520-01
3-29
Organon XDB Error Messages
CODE
CLASS TEXT
DESCRIPTION
U-P-SELIL
E
not a language name This is not an identifier for an
XDB language name.
U-P-TNRET
E
missing END
The END keyword is necessary
to terminate the optional action
list of the BREAKPOINT or
WATCHPOINT command.
U-P-UEOC
E
unexpected EOF by
The last read word signals
improper command completion.
Review your input.
U-P-UFLAB
E
unbalanced labels
The BATCH-File contains
undefined label references.
U-P-UNID
E
not a label
This is neither a LABEL nor a
keyword.
U-P-WHNEX
E
missing WHENexpression
The WHEN expression is
missing.
U-P-WHRET
E
bad WHILE construct A WHILE construct terminates
incorrectly.
U-P-WHTHE
E
THEN missing
The THEN keyword must
precede any action list in a
WHILE loop.
U-X-STOL
E
string constant too
long
The shown quoted string is too
long for the internal buffer of the
debugger.
U-X-XAML
E
missing '(' after
keyword ADDR
The ADDR-modifier needs
parantheses '(' and ')'.
U-X-XIMC
E
illegal mode
conversion
A mode-conversion is not
possible here.
3-30
Debugging C Programs
C79000-G7076-C520-01
Organon XDB Error Messages
CODE
CLASS TEXT
DESCRIPTION
U-X-XIMO
E
illegal mode name
The shown name is not a mode
name for type conversions.
U-X-XNDL
E
missing ''' after
number constant
A numeric constant with prefix
must be enclosed in single
quotes.
U-X-XNLP
E
no '(' allowed
The left parenthesis is not
allowed here.
W-I-EOF
E
unexpected EOF in
The source file does not contain
as many lines as expected.
W-I-EXMX
E
reached maximum of The limit of 61 expression for
monitored
monitoring expression is
expressions 61
reached
W-I-IEMR
W
end of module
reached
The end of the module and all its
includes are reached.
W-I-IGDS
E
get include file
The include file for the given line
is not found.
W-I-INLF
E
line not found
The given line number is not
found in the file.
W-I-ISDS
E
yet no source line
read
Until now, the debugger has not
read line information of the given
file.
W-I-MOMD
W
source module
The shown source module has a
modification time which is newer
than the debugged image.
W-I-NOMAC
E
unknown macro
An unknown macro name was
entered in the emulator window.
Debugging C Programs
C79000-G7076-C520-01
3-31
Organon XDB Error Messages
CODE
CLASS TEXT
DESCRIPTION
W-I-WENASC
E
non-ASCII char
A value larger than 7 bits was
read from the input to the
emulator window. Only values
between 0 and 127 are allowed
(ASCII-character set). Possibly
an unmonitored function/control
key or a mouse-button was
pressed.
W-I-WENESC
E
wrong escape
sequence
The read string is no valid
escape sequence in the
emulator window.
W-I-WETOL
E
macro identifier too
long
A macro identifier name longer
than 79 characters was entered
in the emulator window.
W-I-WILM
E
negative line number Line numbers must be greater or
equal to zero.
W-I-WINA
E
no ASSEMBLER
window displayed
The assembler window is not
displayed at the moment.
W-I-WINE
E
no EVALUATION
window displayed
The evaluation window is not
displayed at the moment.
W-I-WINH
E
no HISTORY window The history window is not
displayed
displayed at the moment.
W-I-WINI
E
no terminal
associated
There is no terminal associated
with the job.
W-I-WINR
E
unresizable window
This window has fixed geometry.
No resize is allowed.
W-I-WINT
E
no TRACE window
displayed
The trace window is not
displayed on the screen.
3-32
Debugging C Programs
C79000-G7076-C520-01
Organon XDB Error Messages
CODE
CLASS TEXT
DESCRIPTION
W-I-WIRE
E
can't move
The requested positions would
move the window border to
invalid positions.
W-I-WIRS
E
not enough lines for
REGISTERS
The register window cannot be
displayed because the screen is
occupied by other windows. Use
the RESIZE command.
W-I-WISF
E
can't open source file The source file which name is
stored in the debug information,
cannot be opened. Check your
permission and the path name.
Use the -D option to add
alternative path names.
W-I-WISL
E
can't access line
The line cannot be read from the
source file.
W-I-WISM
E
can't set scrollmode
for
The scroll mode (continue/page)
is not selectable for all windows.
Look at the manual for a list of
allowed windows.
W-I-WISU
E
window setup
The basic window setup failed.
Look at your configuration files.
W-I-WRLR
E
resize left/right only
This window border can be
moved left or right only.
W-I-WRUD
E
resize up/down only
This window border can be
moved up or down only.
W-W-HIID
E
illegal history-id
The shown number is an illegal
id-number.
W-W-WAED
E
editor:
The command line editor has
encountered an error.
Debugging C Programs
C79000-G7076-C520-01
3-33
Organon XDB Error Messages
3-34
Debugging C Programs
C79000-G7076-C520-01