1
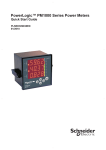
1
User’s Manual for Star Chart Plot Program
Prepared by Toshimi Taki
March 26, 2008
1. Introduction
“Star Chart Plot Program” is designed for making star charts to be printed on paper. It was used to
make “Taki’s Star Atlas”, “Taki’s 8.5 Magnitude Star Atlas” and “Atlas of Double Stars”. The
program and the example data file for Atlas of Double Stars are available in my homepage,
http://www.asahi-net.or.jp/~zs3t-tk/. This manual shows instruction to use “Star Chart Plot
Program”.
2. Features
The program has the following features.
User can define:
Paper size.
Chart scale
Right ascension/declination grid plot
Stars and their labels
Diameter scale of star symbols
Deep sky objects and their labels
Constellation border plot
Ecliptic line plot
Galactic equator plot
The chart is editable manually.
The labels can be adjusted manually.
Projection method is modified Mercator projection only.
3. Overview of Program
“Star Chart Plot Program” requires MS-PowerPoint and MS-Excel. The input data is prepared in
MS-Excel file. The macros in MS-PowerPoint read the Excel file and plot Right
Ascension/Declination grid, stars, deep sky objects, etc on slides. Users need to combine all the
plotted objects in the slides and edit the objects to complete the chart.
4. Input Data File
The Excel input data file consists of seven (7) worksheets.
2
“setting”
This worksheet defines basic setting of the chart (size of paper, chart scale, chart center) and right
ascension/declination grid. Right ascension and declination should be expressed in degree.
“star”
This worksheet defines data of stars (position, magnitude, type and name). Right ascension and
declination should be expressed in degree. Multiple stars are marked with “x” in column H.
Variable stars are marked with “v” in column J. The star data should be sorted with magnitude in
ascending order.
It also defines scale of plotted diameter of stars. Explanation of star diameter scale is shown in the
figure below. User can adjust the parameters of the plot diameter-magnitude scaling. This feature
is very useful to express realistic brightness.
Sine Curve
The diameter of a star on the chart is defined as follows.
Diameter
dia0
dia0: diameter for 0-magnitude star
dia1: diameter for m1-magnitude star
dia1
mp: star magnitude at maximum star diameter
mv: star magnitude at minimum star diameter
mp
0
m1
mv
Magnitude
“deep_sky”
This worksheet defines data of deep sky objects (position, size, position angle (PA) of major axis,
and type). Right ascension and declination should be expressed in degree. The size of deep sky
objects should be expressed in arc minute.
“constellation”
This worksheet defines data of constellation border. Right ascension and declination of segments
of constellation borders should be expressed in degree.
“ecliptic”
This worksheet defines ecliptic line. Right ascension and declination of segments of ecliptic line
and tick marks should be expressed in degree.
“galactic”
This worksheet defines data of galactic plane. Right ascension and declination of segments of
3
galactic line should be expressed in degree.
“galactic_tick”
This worksheet defines data of tick marks for galactic plane. The data should be expressed in
degree.
A sample data file which was used for “Atlas of Double Stars” is provided and yellow cells in the
worksheets should be filled out by users. The file name of the input data file should be “data.xls” and
the file should be stored in c: drive (c:¥data.xls).
5. Macros in MS-PowerPoint Files
Two files are provided, one (star_chart_template.ppt) is for charts which do not include the south
pole and another file (star_chart_template_southpole.ppt) is for charts which include the south pole.
Both files contain the following Macros.
“a_grid”
Plot right ascension/declination grid.
“b_star”
Plot stars.
“c_star_name”
Plot star labels.
“d_deep_sky”
Plot deep sky objects.
“e_deep_sky_name”
Plot labels of deep sky objects.
“f_constellation”
Plot constellation borders.
“g_ecliptic”
Plot ecliptic line.
“h_galactic”
Plot galactic plane.
6. Instruction
(1) Prepare data file
Modify the sample data file and save the file as “data.xls” in C:¥.
4
(2) PowerPoint file
Open PowerPoint template file
If you use the other paper size than A-4, change paper size.
Insert a new slide. Run macro “a_grid”. Delete the grid lines outside of the frame.
Combine all objects in a group.
Insert a new slide. Run macro “b_star”. Delete the frame. Combine all objects in a group.
Insert a new slide. Run macro “c_star_name”. Delete the frame.
Insert a new slide. Run macro “d_deep_sky”. Delete the objects outside of the frame.
Delete the frame. Combine all objects in a group.
Insert a new slide. Run macro “e_deep_sky_name”. Delete the frame.
Insert a new slide. Run macro “f_constellation”. Delete the line segments outside of the
frame. Delete the frame. Combine all objects in a group.
Insert a new slide. Run macro “g_ecliptic”. Delete the line segments outside of the frame.
Delete the frame. Combine all objects in a group.
Insert a new slide. Run macro “h_galactic”. Delete the line segments outside of the frame.
Delete the frame. Combine all objects in a group.
Insert a new slide. Copy the above objects and paste them in the new slide. Adjust the
position of the labels of stars and deep sky objects. Add other information such as grid
labels and title.
Save the file.