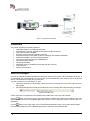
1
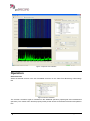
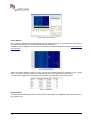
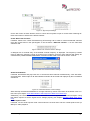
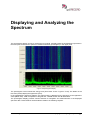
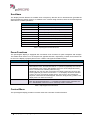
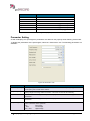
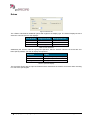
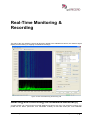
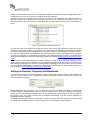
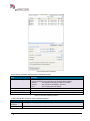
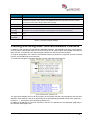
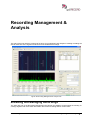
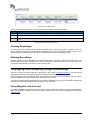
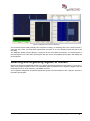
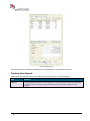
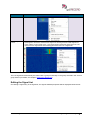
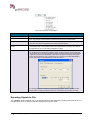
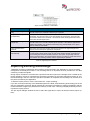
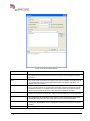
Figure 36 List of Recordings The recording state is signaled by color coded icons in the State column of the table: Color Recording State Green The recording is completed and can be opened for analysis. Yellow The recording process is currently running. The actual recording cannot yet be opened or used. Red An error has been detected in this recording. An error description will be displayed in the Information column. Table 14: Recording State Color Code Opening Recordings The first step when working with recordings will usually be to choose and open a recording. To do so, double click the respective row in the table or select the item Open recording on the table context menu. The recording is opened and its spectrogram is displayed in the offline spectrogram view. Deleting Recordings Existing recordings can be deleted by choosing the item Delete recording on the table context menu. Deleting multiple recordings simultaneously is also possible by selecting multiple rows in the table and choosing the item Delete X recordings on the context menu. Displaying and Analyzing Single Recordings After the recording has been opened as described in the chapter Opening Recordings, its spectrogram will be displayed in the offline spectrogram view above the recordings table. Since the spectrum data has already been calculated and stored on the server while recording, the spectrogram display will be instantaneous even with very long recordings. The initial recording display will display the full recording bandwidth (in the upper screenshot 16 MHz) and a maximum of 10s time segments from the beginning of recording. Using Magnifier and Overview For faster navigation in long recordings, the spectrogram provides two tools, i.e. Overview and Magnifier, which are opened as separate tool windows via the context menu of the offline spectrogram (see chapter Context Menu). 26 Recording Management & Analysis User Manual go2RECORD