1
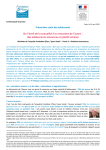
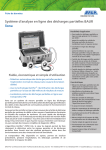
Supplementary field manual, with recording forms, to be
used in conjunction with the lichen-based index guide for
determining nitrogen air quality
This field manual includes:
•
Two field recording forms (Site summary and lichen
recording forms) that can be downloaded from http://
www.apis.ac.uk/guide-using-lichen-based-index-assessnitrogen-air-quality
•
Lichen recording form to be used in the field to score
the presence or absence of lichens on branches and
trunks. It lists the nine N-sensitive and eight N-tolerant
lichen taxa.
•
Worked example of the lichen recording form which
illustrates how a recording sheet should look if completed
according to instructions described in the guide. Separate
forms for recording trunks and branches are included.
•
Site summary form, which records site information and
a summary of the LIS and NAQI scores.
•
Worked example, that can be used to summarise the
recorded data on sensitive and tolerant lichens and
record important site specific information e.g. grid ref/,
altitude, overall impression of site vegetation health).
•
Short background synopsis of the research study by Jason
Lewis in collaboration with CEH, The Natural History
Museum and the University of Nottingham (http:etheses.
nottingham.ac.uk/3573) that identified, tested and
developed the N air quality index based on epiphytic lichens
growing on trunks and branches of oak and birch trees.
•
Lewis (2012) identified two functional groups: lichens that
are sensitive (N-sensitive) to increasing concentrations of
atmospheric N and those that are tolerant (N-tolerant).
Indicator lichens were selected from leafy, bushy and crustose
lichen taxa growing on trunks and branches of oak and birch
trees (see Figure 1) across Britain at sites where concentrations
of atmospheric nitrogen were routinely measured or
measured during one year of the study. Commonly occurring
lichen species were recorded and evaluated for their response
to different forms of atmospheric nitrogen, namely reduced
N, dry deposited ammonia gas and oxides of nitrogen. This
presence and absence data was used to select lichen taxa that
were tolerant of, or sensitive to increasing concentrations of
atmospheric nitrogen.
In the context of drawing up a lichen based index that reflects
the concentration range of N pollutants present in the local
atmosphere indicator lichens needed to be not only tolerant
or sensitive but also widely distributed and most importantly,
easily identifiable, i.e. a sensitive lichen should not be
readily confused with a tolerant lichen. On the basis of such
characteristics the list of potential indicator lichens was reduced
down to eight N tolerant and nine N sensitive indicators.
Identification of lichens
Indicator lichens can be classified into 3 distinct types: bushy
or fruticose lichens that are only attached to the substrate at
the base; leafy or foliose lichens that are loosely attached by
rootlet like structures called rhizines and crustose or granular
lichens that resemble a skin that you cannot remove from
the bark (Figures 1and 2).
FAQs (Frequently asked questions) – which might arise
during the field survey.
The fold-out hard copy Lichen Guide can be purchased from
the FSC (http://www.field-studies-council.org/publications/
pubs/guide-to-using-a-lichen-based-index-to-nitrogen-airquality.aspx) and a low resolution pdf can be downloaded
from the APIS website (http://www.apis.ac.uk/guide-usinglichen-based-index-assess-nitrogen-air-quality).
Indicator lichens
Bushy lichen
Leafy lichen
(green)
Bushy
lichen
Lichens as indicators of nitrogen air quality
How and why were the indicator epiphytic
species and their host substrate selected?
Leafy lichen
(brown)
Epiphytic lichens growing throughout Europe have been
shown to be good indicators of nitrogen air quality (Davies
et al 2007, van Herk, 1999, Pinho et al. 2011, Wolseley et
al. 2006, 2010, Seed at al. 2013).
Crustose
lichen
5cm
Figure 1. Branch showing the three different types of
lichen (leafy, bushy and crustose).
1
Indicator lichens used in this guide fall into three
growth forms:
Chemical tests can be used to help confirm
lichen identification
Lichens may contain a great variety of chemical compounds,
mainly produced by the fungal partner to protect the algal
photobiont from adverse conditions caused by high sunlight,
UV or drought. These compounds may be highly coloured
as in the bright yellow N-tolerant species of Xanthoria or
detected using a simple spot test that produces a distinct
colour reaction in some species. If you are unsure of the
identity of a species a spot test using household bleach may
help. Follow the instructions provided in the guide and make
sure that the colour response is correct. Remember that
negative reactions are as informative as positive ones.
1. Bushy lichen
Attached to the
bark at the base
Branched and shrub-like, attached to the bark at the base.
Branches rounded in section or strap-like with a distinct
upper and lower surface.
2. Leafy lichen
What the index tells us about pollution levels at
a site
Information on gaseous N concentrations was collected
at the 29 sites where the lichen species composition was
evaluated by Lewis, 2012. The lichen composition was
correlated with a range of gaseous pollutant concentrations.
Attached to
the bark from
the lower
surface
The Field Manual is designed to provide a LIS index as an
indicator of nitrogen air quality in a given location. It has
been correlated with mean gaseous ammonia (NH3) and
nitrogen dioxide (NO2) concentration data. A description
of N sources can be found on the APIS (air pollution
information system) website http://www.apis.ac.uk/
overview/pollutants/overview sources.htm
Leaf-like lobes closely or loosely attached to the bark from
the lower surface.
3. Crustose or granular lichen
What it doesn’t tell us
It was not possible to evaluate wet N deposition (i.e. N in
precipitation, cloud or dew) effects by the methods used
by Lewis (2012). The indicator species and guide were
developed from dry deposition, gaseous atmospheric
concentrations alone. Likewise the index does not
discriminate between oxides of N and ammonia as both are
often present. However, because concentrations of N oxides
are less spatially variable except close to local sources their
concentrations can be readily obtained from the APIS ‘Search
by location’ tool (http://www.apis.ac.uk/search-by-location).
Closely attached to
the bark and cannot
be removed without
cutting the bark
Figure 2. Schematic diagram of the three different
types of lichen.
Visible features of indicator lichens that can be used in
their identification:
Why would I want to know about concentrations
of gaseous N pollutants at a site?
Familiarise yourself with the terms in the glossary, referring
to features found in lichens, such as the thallus or the body
of the lichen, vegetative propagules, soredia and isidia
produced as a mechanism for distributing the photobiont
(alga) and fungus together. Fruiting bodies produce the
spores of the fungus. The species in this guide may produce
cup-shaped (see Xanthoria) or elongated (see Graphis and
Arthonia) fruiting bodies. If you have fruiting bodies on
your specimen, check that the species and fruiting body
match their description and photograph. A brief glossary
is provided in the guide and a fuller glossary is available on
the web at http://www.nhm.ac.uk/nature-online/life/plantsfungi/lichen-id-guide/glossary.dsml
Conducting the lichen survey following the protocol outlined
in the guide and expanded on in this manual will enable you
to evaluate the risk from N pollution damage to sensitive
vegetation growing at a site. APIS also provides habitatpollutant records that provide more information on impacts
(http://www.apis.ac.uk/search-pollutant-impacts).
Together this field manual and guide describe how surveying
species/genera of epiphytic lichens growing on oak and birch
can be used to estimate gaseous N concentrations in their
immediate locality.
2
How to survey in the vicinity of a N pollution
source (intensive animal husbandry units i.e.
poultry, pig, dairy)
The survey
What type of sites can be surveyed?
The selection of sampling method depends on your
objectives. If you want to establish the concentration
gradient away from source to your point of interest you can
use the transect approach. Alternatively you may want to
establish the N concentration at different points around the
point source.
The survey can be carried out in a wide variety of urban and
rural locations with sufficient trees (five or more) within a
reasonably confined area (approx 50 m2).
Why are surveys confined to oak and birch trees?
Oak and birch trees were chosen for the development of
the N index, as they both have rather acid (low pH c. 3-4)
bark compared to tree species such as ash and sycamore
which have a higher bark pH with lime trees in between.
Bark pH changes in response to atmospheric nitrogen
deposition and this affects the lichen communities colonising
the bark. In most cases atmospheric nitrogen causes an
increase in bark pH and trees with a higher bark pH are
more likely to support nitrogen-tolerant species of lichen.
Trees with a low bark pH tend to support nitrogen-sensitive
lichen species and this index measures the change from a
nitrogen sensitive to a nitrogen tolerant lichen community, if
there is a change in N pollution. This means that surveying
trees that naturally have a higher bark pH is likely to produce
different results from those with a low bark pH.
If using the transect approach it is important to1. Establish the prevailing wind direction. The transect
should be sited downwind of the point source, with an
upwind background site. The distance and location of
this background site will be influenced by the proximity
of other point sources.
2. Identify accessible trees and work out the distances
from the pollutant point source prior to sampling.
3. Have a greater frequency of sampling locations closer
to the point source, as the ammonia concentration
decreases exponentially with distance from the N
source. Ammonia concentrations can be measured at
background levels within c. 250-350 metres from the
source.
Do I get different results with trunks compared
with branches: when and why?
A useful link is The Simple Calculation of Atmospheric
Impact Limits (SCAIL) model http://www.scail.ceh.ac.uk/
which provides a suite of screening tools for assessing the
impact from agricultural and combustion sources on seminatural areas.
Epiphytic lichens tend to be slow-growing and long-lived
so that lichens growing on older trunks may have become
established under different atmospheric conditions to
those on younger branch bark. Lichens on branches are
recent colonisers and thus reflect the present atmospheric
conditions. In areas where atmospheric conditions have
changed recently the observed lichen species on trunks
and branches may be different. Where local atmospheric N
concentrations have increased, the LIS score may be lower
on the branches than on the trunks where the LIS score may
be higher due to the survival of N-sensitive species.
Tree density and shade
In areas formerly affected by SO2 (sulphur dioxide) older
trunks may continue to have a reduced number of lichens
due to the legacy effect. Branches on these trees however,
may have grown under a different chemical environment,
less influenced by sulphur and are likely to support a
different lichen community (Wolseley et al. 2006).
When sampling on branches, the three zones are designed
to accommodate substrates of different ages. The zones
are designated by distance from the growing tip with zone
1 closest to the trunk. You may also find it easier to sample
from zone 1 (the older section) first where lichens are older,
larger and easier to identify.
3
•
Lichens grow best in sunny exposed conditions. In
highly shaded conditions they tend to be replaced by
algae and bryophytes. Preferably the site you want to
evaluate should have several exposed standard trees of
the same species, with at least some branches that you
can reach (Figure 2).
•
Avoid sampling damaged trees or trees covered in ivy
as both factors alter the bark conditions and also the
lichen communities.
•
When sampling on branches where possible choose
the exposed sunny side of the tree and avoid shaded
branches. Choose accessible branches from the same
tree species if not accessible from the same tree where
you sampled the trunk.
•
How many trees should be sampled? A minimum of
5 trees is recommended but surveying 10 trees would
be preferable. Sampling more trees reduces the impact
of unrepresentative results. Three trees is the absolute
minimum needed, but results for birch and oak e.g.3 birch
and 2 oak, can be combined without affecting the LIS.
How to record indicator lichens on trunks
•
Familiarise yourself with the nitrogen indicator (sensitive
and tolerant) lichens, and their characteristic features,
illustrated in this guide.
•
Locate a 50 x 10 cm area on each of the three aspects
of the tree between 1.0 and 1.5 m above ground level.
•
Restrict your recording to lichens listed in the guide and
included in the downloadable recording forms. Ignore
all other lichen species that may be present.
•
Fill in the recording form, adding a 1 (present) against
each N-sensitive and N-tolerant taxa growing between
1 m and 1.5 m above ground level on each of the three
aspects (E, S & W) within the 50 x 10 cm area (Figure 4).
Figure 5. Three sampling zones along a branch.
Glossary
A glossary of useful terms can be found at http://www.nhm.
ac.uk/nature-online/life/plants-fungi/lichen-id-guide/glossary.
dsml
Site Summary and Lichen recording forms
with completed examples
Instructions for filling in the Site Summary and
Lichen recording forms
Figure 3. Tree selection and sampling height.
Figure 4. Selection of three aspects, east, south, west
but not north.
How to record indicator lichens on branches
•
Go to the site you want to evaluate for gaseous N
concentrations. Check first it is not on limestone
http://maps.bgs.ac.uk/soilportal/wmsviewer.html
•
Identify five or more oak (Quercus petraea, Q. robur),
birch (Betula pendula, B. pubescens) trees or a mixture
of the two species in a similar situation, not densely
planted, shaded, not ivy-covered or damaged.
•
Select five trunks each single-stemmed and >40 cm girth
•
Complete site information on Lichen recording forms
(Form 1 trunks; Form 2 branches)
•
Familiarise yourself with the nitrogen indicator (sensitive
and tolerant) lichens, and their characteristic features,
illustrated in this the guide.
•
For trunks-record presence or absence of lichens in wide
strips (10 x 50 cm) between 1.0 and 1.5 m from the
ground, in each of three aspects, East, South and West.
•
Locate the zones along the selected branch.
•
•
Restrict your recording to lichens listed in the guide and
included in the downloadable recording forms. Ignore
all other lichen species that may be present.
For branches- If available select 3-5 accessible branches
and record zone 1 (100-150 cm back from the tip),
zone 2 (50-100 cm), and zone 3 (0-50 cm).
•
Record the presence of each species (not abundance) on
Lichen recording form (Form 1).
•
Transfer data from the lichen recording form to the Site
summary form (Form 3).
•
You can upload your site summary results to the APIS
website by completing the online form at http://www.
apis.ac.uk/guide-using-lichen-based-index-assessnitrogen-air-quality/upload-results. We will be mapping
all completed results to gain a picture of lichen and
nitrogen interactions across the UK. You can be part of
this story by uploading your results too.
•
Fill in the recording form, adding a 1 (present) for
N-sensitive and N-tolerant taxa growing in each of the
three zones (Figure 5). Once you have identified at least
one N-sensitive or N-tolerant.
There is only a requirement to find one N-sensitive and
one N-tolerant lichen species for each zone. The presence/
absence of all the listed lichens does not need to be
recorded. Even though you have identified a N-sensitive
lichen it is necessary to ensure that there are no N-tolerant
lichens present.
4
Suggested methods for marking a 10 x 50 frame
on the tree trunks
•
Large map pins could be used. Caution when using
these in case of injury.
•
A double string with 3 sliding frames between the two
strings. The double string 0.5 m apart would be long
enough to use on a range of tree trunks (Figure 6).
Figure 6. Stringed frame for identifying the three
10 x 50 cm aspects.
•
a plastic ‘quadrat’ could be made using thick plastic and
duct tape.
Form 1. Lichen recording form (Trunks)
>ŽĐĂƚŝŽŶ
dƌƵŶŬ
ĂƐƉĞĐƚƐ
EͲƐĞŶƐŝƚŝǀĞ
dƌĞĞϭ
t
dƌĞĞϭ
^
dƌĞĞϭ
dƌĞĞϮ
t
dƌĞĞϮ
^
dƌĞĞϮ
dƌĞĞϯ
t
dƌĞĞϯ
^
dƌĞĞϯ
dƌĞĞϰ
t
dƌĞĞϰ
^
dƌĞĞϰ
dƌĞĞϱ
t
dƌĞĞϱ
^
dƌĞĞϱ
ƌLJŽƌŝĂĨƵƐĐĞƐĐĞŶƐ
ǀĞƌŶŝĂƉƌƵŶĂƐƚƌŝ
'ƌĂƉŚŝƐƐƉĞĐŝĞƐ
,LJƉŽŐLJŵŶŝĂƐƉĞĐŝĞƐ
KĐŚƌŽůĞĐŚŝĂĂŶĚƌŽŐLJŶĂ
WĂƌŵĞůŝĂƐƉĞĐŝĞƐ
WƐĞƵĚĞǀĞƌŶŝĂĨƵƌĨƵƌĂĐĞĂ
^ƉŚĂĞƌŽƉŚŽƌƵƐŐůŽďŽƐƵƐ
hƐŶĞĂƐƉĞĐŝĞƐ
dŽƚĂů
EͲƐĞŶƐŝƚǀĞĐŽƵŶƚƉĞƌĂƐƉĞĐƚ
EͲƚŽůĞƌĂŶƚ
ƌŵĂŶĚŝŶĞĂƉƵŶĐƚĂƚĂ
ƌƚŚŽŶŝĂƌĂĚŝĂƚĂ
ĂŶĚĞůĂƌŝĞůůĂƌĞĨůĞdžĂ
>ĞĐŝĚĞůůĂĞůĂĞŽĐŚƌŽŵĂ
WŚLJƐĐŝĂĂĚƐĐĞŶĚĞŶƐͬƚĞŶĞůůĂ
WƵŶĐƚĞůŝĂƐƵďƌƵĚĞĐƚĂ
yĂŶƚŚŽƌŝĂƉĂƌŝĞŶƚŝŶĂ
yĂŶƚŚŽƌŝĂƉŽůLJĐĂƌƉĂͬƵĐƌĂŝŶŝĐĂ
dŽƚĂů
EͲƐĞŶƐŝƚǀĞĐŽƵŶƚƉĞƌĂƐƉĞĐƚ
5
Form 2. Lichen recording form (Branches)
>ŽĐĂƚŝŽŶ͗
ƌĂŶĐŚĞƐ
njŽŶĞƐ
EͲƐĞŶƐŝƚŝǀĞ
ƌĂŶĐŚϭ ƌĂŶĐŚϭ ƌĂŶĐŚϭ ƌĂŶĐŚϮ ƌĂŶĐŚϮ ƌĂŶĐŚϮ ƌĂŶĐŚϯ ƌĂŶĐŚϯ ƌĂŶĐŚϯ ƌĂŶĐŚϰ ƌĂŶĐŚϰ ƌĂŶĐŚϰ ƌĂŶĐŚϱ ƌĂŶĐŚϱ ƌĂŶĐŚϱ
ϭ
Ϯ
ϯ
ϭ
Ϯ
ϯ
ϭ
Ϯ
ϯ
ϭ
Ϯ
ϯ
ϭ
Ϯ
ϯ
ƌLJŽƌŝĂĨƵƐĐĞƐĐĞŶƐ
ǀĞƌŶŝĂƉƌƵŶĂƐƚƌŝ
'ƌĂƉŚŝƐƐƉĞĐŝĞƐ
,LJƉŽŐLJŵŶŝĂƐƉĞĐŝĞƐ
KĐŚƌŽůĞĐŚŝĂĂŶĚƌŽŐLJŶĂ
WĂƌŵĞůŝĂƐƉĞĐŝĞƐ
WƐĞƵĚĞǀĞƌŶŝĂĨƵƌĨƵƌĂĐĞĂ
^ƉŚĂĞƌŽƉŚŽƌƵƐŐůŽďŽƐƵƐ
hƐŶĞĂƐƉĞĐŝĞƐ
dŽƚĂů
EͲƐĞŶƐŝƚǀĞĐŽƵŶƚƉĞƌďƌĂŶĐŚ
EͲƚŽůĞƌĂŶƚ
ƌŵĂŶĚŝŶĞĂƉƵŶĐƚĂƚĂ
ƌƚŚŽŶŝĂƌĂĚŝĂƚĂ
ĂŶĚĞůĂƌŝĞůůĂƌĞĨůĞdžĂ
>ĞĐŝĚĞůůĂĞůĂĞŽĐŚƌŽŵĂ
WŚLJƐĐŝĂĂĚƐĐĞŶĚĞŶƐͬƚĞŶĞůůĂ
WƵŶĐƚĞůŝĂƐƵďƌƵĚĞĐƚĂ
yĂŶƚŚŽƌŝĂƉĂƌŝĞŶƚŝŶĂ
yĂŶƚŚŽƌŝĂƉŽůLJĐĂƌƉĂͬƵĐƌĂŝŶŝĐĂ
dŽƚĂů
EͲƐĞŶƐŝƚǀĞĐŽƵŶƚƉĞƌďƌĂŶĐŚ
6
Examples of completed Forms 1 &2
>ŽĐĂƚŝŽŶ
dƌƵŶŬ
ĂƐƉĞĐƚƐ
EͲƐĞŶƐŝƚŝǀĞ
dƌĞĞϭ
t
dƌĞĞϭ
^
dƌĞĞϭ
ƌLJŽƌŝĂĨƵƐĐĞƐĐĞŶƐ
dƌĞĞϮ
t
dƌĞĞϮ
^
dƌĞĞϮ
dƌĞĞϯ
t
dƌĞĞϯ
^
dƌĞĞϯ
dƌĞĞϰ
t
dƌĞĞϰ
^
dƌĞĞϰ
dƌĞĞϱ
t
dƌĞĞϱ
^
dƌĞĞϱ
ϭ
ǀĞƌŶŝĂƉƌƵŶĂƐƚƌŝ
ϭ
ϭ
ϭ
ϭ
'ƌĂƉŚŝƐƐƉĞĐŝĞƐ
,LJƉŽŐLJŵŶŝĂƐƉĞĐŝĞƐ
ϭ
KĐŚƌŽůĞĐŚŝĂĂŶĚƌŽŐLJŶĂ
WĂƌŵĞůŝĂƐƉĞĐŝĞƐ
ϭ
ϭ
ϭ
WƐĞƵĚĞǀĞƌŶŝĂĨƵƌĨƵƌĂĐĞĂ
ϭ
ϭ
ϭ
ϭ
ϭ
ϭ
ϭ
ϭ
^ƉŚĂĞƌŽƉŚŽƌƵƐŐůŽďŽƐƵƐ
hƐŶĞĂƐƉĞĐŝĞƐ
EͲƐĞŶƐŝƚǀĞĐŽƵŶƚƉĞƌĂƐƉĞĐƚ
ϭ
ϭ
Ϭ
ϭ
ϭ
ϭ
ϭ
ϭ
ϭ
Ϭ
Ϭ
Ϭ
ϭ
Ϭ
ϭ
Ϭ
ϭ
dŽƚĂů
ϵ
EͲƚŽůĞƌĂŶƚ
ƌŵĂŶĚŝŶĞĂƉƵŶĐƚĂƚĂ
ƌƚŚŽŶŝĂƌĂĚŝĂƚĂ
ĂŶĚĞůĂƌŝĞůůĂƌĞĨůĞdžĂ
ϭ
>ĞĐŝĚĞůůĂĞůĂĞŽĐŚƌŽŵĂ
WŚLJƐĐŝĂĂĚƐĐĞŶĚĞŶƐͬƚĞŶĞůůĂ
ϭ
ϭ
ϭ
ϭ
ϭ
ϭ
WƵŶĐƚĞůŝĂƐƵďƌƵĚĞĐƚĂ
yĂŶƚŚŽƌŝĂƉĂƌŝĞŶƚŝŶĂ
ϭ
ϭ
yĂŶƚŚŽƌŝĂƉŽůLJĐĂƌƉĂͬƵĐƌĂŝŶŝĐĂ
EͲƐĞŶƐŝƚǀĞĐŽƵŶƚƉĞƌĂƐƉĞĐƚ
>ŽĐĂƚŝŽŶ͗
ƌĂŶĐŚĞƐ
njŽŶĞƐ
EͲƐĞŶƐŝƚŝǀĞ
ϭ
Ϭ
Ϭ
Ϭ
ϭ
Ϭ
Ϭ
ϭ
ϭ
ϭ
ϭ
Ϭ
Ϭ
Ϭ
Ϭ
ϭ
dŽƚĂů
ϲ
ƌĂŶĐŚϭ ƌĂŶĐŚϭ ƌĂŶĐŚϭ ƌĂŶĐŚϮ ƌĂŶĐŚϮ ƌĂŶĐŚϮ ƌĂŶĐŚϯ ƌĂŶĐŚϯ ƌĂŶĐŚϯ ƌĂŶĐŚϰ ƌĂŶĐŚϰ ƌĂŶĐŚϰ ƌĂŶĐŚϱ ƌĂŶĐŚϱ ƌĂŶĐŚϱ
ϭ
Ϯ
ϯ
ϭ
Ϯ
ϯ
ϭ
Ϯ
ϯ
ϭ
Ϯ
ϯ
ϭ
Ϯ
ϯ
ƌLJŽƌŝĂĨƵƐĐĞƐĐĞŶƐ
ϭ
ǀĞƌŶŝĂƉƌƵŶĂƐƚƌŝ
ϭ
ϭ
ϭ
ϭ
ϭ
ϭ
ϭ
ϭ
ϭ
ϭ
ϭ
ϭ
ϭ
ϭ
ϭ
'ƌĂƉŚŝƐƐƉĞĐŝĞƐ
,LJƉŽŐLJŵŶŝĂƐƉĞĐŝĞƐ
KĐŚƌŽůĞĐŚŝĂĂŶĚƌŽŐLJŶĂ
WĂƌŵĞůŝĂƐƉĞĐŝĞƐ
ϭ
ϭ
WƐĞƵĚĞǀĞƌŶŝĂĨƵƌĨƵƌĂĐĞĂ
^ƉŚĂĞƌŽƉŚŽƌƵƐŐůŽďŽƐƵƐ
hƐŶĞĂƐƉĞĐŝĞƐ
EͲƐĞŶƐŝƚǀĞĐŽƵŶƚƉĞƌďƌĂŶĐŚ
ϭ
ϭ
Ϭ
ϭ
ϭ
ϭ
ϭ
ϭ
Ϭ
Ϭ
ϭ
Ϭ
ϭ
Ϭ
ϭ
ϭ
dŽƚĂů
ϭϬ
EͲƚŽůĞƌĂŶƚ
ƌŵĂŶĚŝŶĞĂƉƵŶĐƚĂƚĂ
ϭ
ƌƚŚŽŶŝĂƌĂĚŝĂƚĂ
ĂŶĚĞůĂƌŝĞůůĂƌĞĨůĞdžĂ
>ĞĐŝĚĞůůĂĞůĂĞŽĐŚƌŽŵĂ
WŚLJƐĐŝĂĂĚƐĐĞŶĚĞŶƐͬƚĞŶĞůůĂ
ϭ
WƵŶĐƚĞůŝĂƐƵďƌƵĚĞĐƚĂ
yĂŶƚŚŽƌŝĂƉĂƌŝĞŶƚŝŶĂ
ϭ
yĂŶƚŚŽƌŝĂƉŽůLJĐĂƌƉĂͬƵĐƌĂŝŶŝĐĂ
EͲƐĞŶƐŝƚǀĞĐŽƵŶƚƉĞƌďƌĂŶĐŚ
ϭ
Ϭ
Ϭ
Ϭ
Ϭ
ϭ
Ϭ
Ϭ
7
Ϭ
Ϭ
ϭ
Ϭ
Ϭ
Ϭ
Ϭ
ϭ
dŽƚĂů
ϯ
Form 3. Blank Site Summary form
>ŽĐĂƚŝŽŶ
'ƌŝĚƌĞĨĞƌĞŶĐĞͬ'W^
ŝ͘Ğ͘EdϮϰϱϲϳϴ
ĞůĞƚĞĂƐŶĞĐĞƐĂƌLJ
dƌĞĞƚLJƉĞƚƌƵŶŬ
ŽĂŬ
dƌĞĞƚLJƉĞďƌĂŶĐŚ
ŽĂŬ
ŽƵŶƚƐŽĨĂƐƉĞĐƚƐ
dƌƵŶŬƐ
ǁŝƚŚEͲƐĞŶƐŝƚŝǀĞ
ůŝĐŚĞŶƐ
ŝƌYƵĂůŝƚLJ
ůƚŝƚƵĚĞŵ
EŽŽĨƚƌƵŶŬƐƐƵƌǀĞLJĞĚ
EŽŽĨďƌĂŶĐŚĞƐƐƵƌǀĞLJĞĚ
ďŝƌĐŚ
ďŝƌĐŚ
EŽ͘ŽĨƚƌƵŶŬƐ
ƐƵƌǀĞLJĞĚ
ǀĞƌĂŐĞƐĐŽƌĞƉĞƌƚƌƵŶŬ
ŝ͘Ğ͘ŽƵŶƚͬŶŽ͘KĨƚƌĞĞƐ
>/^;EͲƐĞŶƐŝƚǀĞĂǀĞƌĂŐĞ
ƐĐŽƌĞŵŝŶƵƐEͲƚŽůĞƌĂŶƚ
ĂǀĞƌĂŐĞƐĐŽƌĞ
dƌƵŶŬƐ
ŽƵŶƚƐŽĨĂƐƉĞĐƚƐ
ǁŝƚŚEͲƚŽůĞƌĂŶƚ
ůŝĐŚĞŶƐ
EŽ͘ŽĨƚƌƵŶŬƐ
ƐƵƌǀĞLJĞĚ
ǀĞƌĂŐĞƐĐŽƌĞƉĞƌƚƌƵŶŬ
ŝ͘Ğ͘ŽƵŶƚͬŶŽ͘ŽĨƚƌĞĞƐ
EY/ǀĂůƵĞ͘džƚƌĂĐƚĨƌŽŵ
ĨŝŐƵƌĞϰ
ƌĂŶĐŚĞƐ
ŽƵŶƚƐŽĨnjŽŶĞƐ
ǁŝƚŚEͲƐĞŶƐŝƚŝǀĞ
ůŝĐŚĞŶƐ
EŽ͘ŽĨďƌĂŶĐŚĞƐ
ƐƵƌǀĞLJĞĚ
ǀĞƌĂŐĞƐĐŽƌĞƉĞƌďƌĂŶĐŚ
>/^;EͲƐĞŶƐŝƚǀĞĂǀĞƌĂŐĞ
ƐĐŽƌĞŵŝŶƵƐEͲƚŽůĞƌĂŶƚ
ĂǀĞƌĂŐĞƐĐŽƌĞ
ƌĂŶĐŚĞƐ
ŽƵŶƚƐŽĨnjŽŶĞǁŝƚŚ
EͲƚŽůĞƌĂŶƚůŝĐŚĞŶƐ
EŽ͘ŽĨďƌĂŶĐŚĞƐ
ƐƵƌǀĞLJĞĚ
ǀĞƌĂŐĞƐĐŽƌĞƉĞƌďƌĂŶĐŚ
EY/ǀĂůƵĞ͘džƚƌĂĐƚĨƌŽŵ
ĨŝŐƵƌĞϰ
You can upload your results to the APIS website by
completing the online recording form at http://www.apis.
ac.uk/guide-using-lichen-based-index-assess-nitrogen-airquality/upload-results
We will be mapping all completed results to gain a picture of
the lichen and nitrogen interactions across the UK. You can
be part of this story by uploading your results here.
Worked example of Site Summary form (Form 3)
>ŽĐĂƚŝŽŶ
'ƌŝĚƌĞĨĞƌĞŶĐĞͬ'W^
ŝ͘Ğ͘EdϮϰϱϲϳϴ
ĞůĞƚĞĂƐŶĞĐĞƐĂƌLJ
dƌĞĞƚLJƉĞƚƌƵŶŬ
ŽĂŬ
dƌĞĞƚLJƉĞďƌĂŶĐŚ
ŽĂŬ
ŽƵŶƚƐŽĨĂƐƉĞĐƚƐ
dƌƵŶŬƐ
ǁŝƚŚEͲƐĞŶƐŝƚŝǀĞ
ůŝĐŚĞŶƐ
dƌƵŶŬƐ
ŽƵŶƚƐŽĨĂƐƉĞĐƚƐ
ǁŝƚŚEͲƚŽůĞƌĂŶƚ
ůŝĐŚĞŶƐ
ŝƌYƵĂůŝƚLJ
ůƚŝƚƵĚĞŵ
EŽŽĨƚƌƵŶŬƐƐƵƌǀĞLJĞĚ
EŽŽĨďƌĂŶĐŚĞƐƐƵƌǀĞLJĞĚ
ďŝƌĐŚ
ďŝƌĐŚ
ϵ
EŽ͘ŽĨƚƌƵŶŬƐ
ƐƵƌǀĞLJĞĚ
ϱ
ǀĞƌĂŐĞƐĐŽƌĞƉĞƌƚƌƵŶŬ
ŝ͘Ğ͘ŽƵŶƚͬŶŽ͘KĨƚƌĞĞƐ
ϵͬϱсϭ͘ϴ
>/^;EͲƐĞŶƐŝƚǀĞĂǀĞƌĂŐĞ
ƐĐŽƌĞŵŝŶƵƐEͲƚŽůĞƌĂŶƚ
ĂǀĞƌĂŐĞƐĐŽƌĞ
ϭ͘ϴͲϭ͘ϮсϬ͘ϲ
ϲ
EŽ͘ŽĨƚƌƵŶŬƐ
ƐƵƌǀĞLJĞĚ
ϱ
ǀĞƌĂŐĞƐĐŽƌĞƉĞƌƚƌƵŶŬ
ŝ͘Ğ͘ŽƵŶƚͬŶŽ͘ŽĨƚƌĞĞƐ
ϲͬϱсϭ͘Ϯ
EY/ǀĂůƵĞ͘džƚƌĂĐƚĨƌŽŵ
ĨŝŐƵƌĞϰ
ϭ͘Ϭϱ
ƌĂŶĐŚĞƐ
ŽƵŶƚƐŽĨnjŽŶĞƐ
ǁŝƚŚEͲƐĞŶƐŝƚŝǀĞ
ůŝĐŚĞŶƐ
ϭϬ
EŽ͘ŽĨďƌĂŶĐŚĞƐ
ƐƵƌǀĞLJĞĚ
ϱ
ǀĞƌĂŐĞƐĐŽƌĞƉĞƌďƌĂŶĐŚ
ϭϬͬϱсϮ
>/^;EͲƐĞŶƐŝƚǀĞĂǀĞƌĂŐĞ
ƐĐŽƌĞŵŝŶƵƐEͲƚŽůĞƌĂŶƚ
ĂǀĞƌĂŐĞƐĐŽƌĞ
ϮͲϬ͘ϲсϭ͘ϰ
ƌĂŶĐŚĞƐ
ŽƵŶƚƐŽĨnjŽŶĞǁŝƚŚ
EͲƚŽůĞƌĂŶƚůŝĐŚĞŶƐ
ϯ
EŽ͘ŽĨďƌĂŶĐŚĞƐ
ƐƵƌǀĞLJĞĚ
ϱ
ǀĞƌĂŐĞƐĐŽƌĞƉĞƌďƌĂŶĐŚ
ϯͬϱсϬ͘ϲ
EY/ǀĂůƵĞ͘džƚƌĂĐƚĨƌŽŵ
ĨŝŐƵƌĞϰ
Ϭ͘ϳϴ
8
ƚZŝƐŬ
ƚƌŝƐŬ
N-tolerant
0
0
0
1
0
0
1
1
1
1
0
0
0
0
1
6
Lichen indicator score (LIS) = (Average N-sensitive) – (Average N-tolerant)
1.2
0.6
ToThe
estimate
theindicator
LIS on branches,
Figure 3 for N-sensitive and N-tolerant species on the three
lichen
scorerepeat
(LIS) the
andprocess
the Nasairin quality
zones on five sampled branches.
Interpreting your LIS in
terms of exposure to
gaseous Nitrogen
Compounds
Sites that are designated as clean
have an NAQI between 0 and 0.5,
at risk NAQI > 0.5-0.85,
N polluted NAQI 0.86-1.25,
3.0
Lichen indicator Score (LIS)
The fitted lines are derived
from mean values taken from
the UK wide survey.
The LIS NAQI relationship for
branches should be read from
the broken line and for trunks
from the solid line.
Figure 4.
Relationship between the Lichen Indicator Score (LIS)
and N Air Quality Index (NAQI)
2.0
N polluted
Very N polluted
1.0
Branch
0
Trunk
-1.0
Clean
At risk
-2.0
-3.0
0
0.5
1.0
1.5
2.0
N Air Quality Index (NAQI)
very N polluted NAQI > 1.25.
Calculating your lichen indicator score (LIS) for
trunks and branches
measured NH3 concentration data and modelled NO2
concentration data. It was mathematically derived to be the
best fit for the UK NH3 and NO2 data. NO2 concentrations
show much less local spatial variation than NH3
concentrations. Thus if you derive the site NAQI and use the
site grid reference to look up the NO2 concentration in APIS
(Air Pollution Information System) you can calculate the NH3
The LIS is based on the difference between the presence
of N-tolerant and N-sensitive lichens on three aspects of
the trunk or zones of the branch. Populate Forms 1 & 2
(worked examples of trunks and branches on page 7) by
allocating a score of 1 (presence) for one or more of the
listed N-sensitive species. Allocate a score of 0 if N- sensitive
species are absent.
•
•
References
Count the number of aspects on all 5 trees that support
tolerant species. i.e. a maximum value of 15 could be
obtained if each of the 5 trees supported a tolerant
species on each of the three aspects.
concentration by substituting values in the above equation.
Davies, L., Bates, J. W., Bell, J. N. B., James, P. W. & Purvis, W.
O. (2007). Diversity and sensitivity of epiphytes to oxides of
nitrogen in London. - Environmental Pollution 146(2): 299-310.
Count the number of aspects on all 5 trees that support
sensitive species i.e. a maximum value of 15 could be
obtained if each of the 5 trees supported a tolerant
species on each of the three aspects.
•
Divide the count by the number of trees recorded
to obtain an average value for both N-sensitive and
N-tolerant lichens.
•
Subtract the average for N-tolerant from the average for
N-sensitive to obtain a lichen indicator score (LIS).
•
Don’t forget to upload your Site Summary results to
APIS: http://www.apis.ac.uk/guide-using-lichen-basedindex-assess-nitrogen-air-quality/upload-results
Lewis, J.E.J. (2012). Biomonitoring for atmospheric nitrogen
pollution using epiphytic lichens and bryophytes. PhD Thesis
(http://etheses.nottingham.ac.uk/3573/)
Pinho, P., T. Dias, C. Cruz, Y. Sim Tang, M. A. Sutton, M.A. Martins-Loução, C. Máguas & C. Branquinho (2011).
Using lichen functional diversity to assess the effects of
atmospheric ammonia in Mediterranean woodlands. Journal of Applied Ecology 48(5): 1107-1116.
Seed, L., Wolseley, P.A., Gosling, L., Davies, L. & Power, S.
(2013). Modelling relationships between lichen bioindicators,
air quality and climate on a national scale: results from the
UK OPAL Air Survey. Environmental Pollution In press.
The NAQI = 2 [NH3]^0.5 + [NO2]^0.5 using µmol,m3
Wolseley, P., James, P. W., Theobald, M. R. & Sutton, M. A.
2006). Detecting changes in epiphytic lichen communities
This equation has been derived using modelled and
9
at sites affected by atmospheric ammonia from agricultural
sources. - Lichenologist 38(2): 161-176.
Yes. Calculation of the site specific index does not require
the presence of all 8 + 9 taxa from the tolerant and sensitive
functional groups. Realistically it is more likely that you will
only find some or even none of the listed species.
Wolseley, P., M. Sutton, I. D. Leith & N. van Dijk (2010):
Epiphytic lichens as indicators of ammonia concentrations
across the UK. - In: T. H. Nash, III, L. Geiser, B. McCune, D.
Triebel, A. M. F. Tomescu and W. B. Sanders: Biology
of Lichens ― Symbiosis, Ecology, Environmental
Monitoring, Systematics and Cyber Applications. Bibliotheca
Lichenologica No. 105. J. Cramer in der Gebrüder
Borntraeger Verlagsbuchhandlung, Stuttgart. 256 pages,
pp.75-85.
Can a survey still be undertaken if there are not
five suitable trees at the selected site?
Yes, but a smaller number can influence your NAQI score
and increase level of uncertainty with odd results.
Is it necessary to survey both trunks and
branches?
Frequently asked questions
No. Both will give an individual NAQI score but if possible it
would be better to survey both, as the lichen present on the
trunks may differ from those on the branches.
van Herk, CM (1999).Mapping of ammonia pollution with
epiphytic lichens in the Netherlands. - Lichenologist 31(1): 9-20.
Will the lichens be the same on trunks and
branches?
Can I conduct a survey if no oak or birch trees are
present at the site?
Not necessarily. Branch lichens are probably more recently
colonised and the lichens present provide a more up to date
indication of the N pollution climate.
No, the relationship between LIS and NAQI was derived from
epiphytic lichens growing on these tree species and has not
been tested beyond these host substrates. In addition, only
birch or oak that exceed 1.5 m tall (are of sufficient age /
size to support lichens), do not support ivy, are healthy and
not too densely planted are suitable. WHY? because these
factors also influence which lichen species grow on the
substrate.
Can other lichen species be used apart from the
ones listed in the Field Guide?
No. The research to calculate the NAQI established that
these were the most appropriate indicator species to use.
Can a survey be conducted if none of the listed
lichen species or taxa are present?
How far apart can the individual trees be at
a location not obviously impacted by a point
source?
No. The research to calculate the NAQI establish that these
were the most appropriate indicator species to use.
If the location is not close to a N point source then the trees
could be up to 50 m apart.
Is it necessary to identify to species level?
How far apart can the individual trees be at a
location impacted by a point source?
Only for some species but for example, Parmelia species do
not need to be identified to species as both Parmelia sulcata
and P. saxatilis are considered to be N-sensitive, so it is
sufficient to identify that it is one of the Parmelia’s.
If using a transect approach, the trees growing at each
sampling location must be adjacent to each other (growing
in a clump of trees). For sampling locations close to the N
source the sample trees should be in close proximity due to
ammonia concentrations decreasing exponentially from N
source.
Is it correct that only one N-sensitive or one
N-tolerant species needs to be present to give a
score of 1?
Yes.
Can a mix of oak and birch be used to make up
the five trunks or branches surveyed?
If there are several of the lichen species on a
trunk or branch the score will still be 1?
Yes. The objective of the survey is to determine the presence
or absence of N-sensitive and N-tolerant species and to
calculate a LIS. This can be achieved using a combination of
oak and birch trunks and branches.
Yes. The maximum score is 3 when an indicator is present on
3 aspects of the trunk or 3 zones of the branch.
Fallen branches should not be used for the
survey?
Can I conduct a survey if only a few of the
indicator species are present?
10