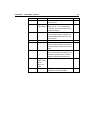
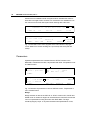
1
Antec Industrieweg 12 2382 NV Zoeterwoude The Netherlands DECADE II Electrochemical Detector User manual 171.0011, Edition 12, 2015 T +31 71 5813333 | F +31 71 5813334 | [email protected] | www.myantec.com Copyright ©2015, Antec, The Netherlands. Contents of this publication may not be reproduced in any form or by any means (including electronic storage and retrieval or translation into a foreign language) without prior agreement and written consent from the copyright of the owner. The information contained in this document is subject to change without notice. ROXY, ALEXYS, DECADE, DECADE II, INTRO, Flexcell, ReactorCell, SenCell, VT-03, µ-PrepCell, SynthesisCell, ISAAC, HyREF are trademarks of Antec. Whatman™ (word and device) and Whatrnan™ (word only) are trademarks of Whatman lnternational Ltd. SOLVENT IFD™ and AQUEOUS IFD™ are trademarks of Arbor Technologies, Inc. Clarity®, DataApex® are trademarks of DataApex Ltd. Microsoft® and Windows™ are trademarks of Microsoft Corporation. Excel is a registered trademark of the Microsoft Corporation. The software and the information provided herein is believed to be reliable. Antec shall not be liable for errors contained herein or for incidental or consequential damages in connection with the furnishing, performance, or use of software or this manual. All use of the software shall be entirely at the user’s own risk. Chapter 1 DECADE II electrochemical detector 3 Declaration of conformity We Antec Leyden B.V., Zoeterwoude, The Netherlands, declare that the product DECADE II™ Electrochemical Detector type 171 to which this declaration relates, is in conformity with the following directives: Safety (2006/42/EC) Safety requirements for laboratory equipment IEC61010-1:2001 2nd ed. (Class I, Installation cat. II, Pollution degree 2) Particular requirements for laboratory equipment for the heating of materials IEC61010-2-010:2003 2nd ed. Immunity (2004/108/EC) Electromagnetic immunity EN61326-1:2006 EN61000-4-2, EN61000-4-3, ENV50204, EN61000-4-4, EN61000-4-5, EN61000-4-6, EN61000-4-8, EN61000-4-11 Emissions (2004/108/EC) Electromagnetic emission EN61326-1:2006 EN55011 (Class B), EN61000-3-2, EN61000-3-3 Attention Only use manufacturer-supplied cable(s) to connect with other devices. Part numbers 250.0122 (RS232 cable), 250.0130 (I/O cable) and 250.0128 (output cable). Thoroughly connect shielding to common. Manufacturer will not accept any liability for damage, direct or indirect, caused by connecting this instrument to devices which do not meet relevant safety standards. June 25, 2015 4 DECADE II user manual, ed. 11 Intended use For research purposes only. While clinical applications may be shown, this instrument is not tested by the manufacturer to comply with the In Vitro Diagnostics Directive. WEEE directive All equipment of Antec Leyden which are subjected to the WEEE directive shipped after August 13, 2005 are compliant with the WEEE marking requirements. Such products are labelled with the “crossed out wheelie”, depicted on the left site. The symbol on the product indicates that the product must not be disposed as unsorted municipality waste. Collection & recycling information Please ship the instrument back to the manufacturer (Antec Leyden, the Netherlands) at the end-of-life time of the product. The manufacturer will take care of the proper disposal and recycling of the instrument at its facilities. Shipping address for the end-of-life products: Antec Leyden Industrieweg 12 2382NV Zoeterwoude The Netherlands In case of questions, or if further information is required about the collection & recycling procedure, please contact your local distributor. ROHS directive The DECADE II is ROHS compliant and in conformity with Directive 2002/95/EC Restricted use of Hazardous Substances in electrical and electronic Equipment (ROHS). Antec Leyden is an ISO 9001:2008 certified company. Chapter 1 DECADE II electrochemical detector Symbols The following symbol are used on the rear panel and oven compartment of the DECADE II: Consult the manual for further safety instructions Frame or chassis ground terminal The following pictograms are used in the DECADE II manual: Caution Caution, risk of electric shock or other electrical hazard (high voltage) 5 6 DECADE II user manual, ed. 11 Safety practices The following safety practices are intended to insure safe operation of the equipment. Electrical hazards The removal of protective panels on the instrument can result in exposure to potentially dangerous voltages. Therefore, disconnect the instrument from all power sources before disassembly. Untrained personnel should not open the instrument. Replace blown fuses with fuses of proper type and rating as stipulated on the rear panel and specified in the installation section of this manual. The fuse holder is integrated in the mains connector. Ensure that the instrument is never put in operation with fuses of a different type. This could cause fire. USE ONLY WITH 250 V FUSES EMPLOYER UNIQUEMENT AVEC DES FUSIBLES DE 250V Connect the detector to a grounded AC power source, line voltage 100 – 240 VAC. The instrument should be connected to a protective earth via a ground Chapter 1 DECADE II electrochemical detector 7 socket. The power source should exhibit minimal power transients and fluctuations. Replace faulty or frayed power cords. Place the detector on a flat and smooth surface. Do not block the fan located at the bottom of the detector. Blocking the fan will impair the cooling capability of the power supply. General precautions Perform periodic leak checks on LC tubing and connections. Do not close or block the drain. Do not allow flammable and/or toxic solvents to accumulate. Follow a regulated, approved waste disposal program. Never dispose of such products through the municipal sewage system. This instrument has a lithium battery inside. Replacement of the battery should be performed by qualified service personnel. Dispose the battery according to chemical waste only. LC equipments should be used by trained laboratory personnel only. Use proper eye and skin protection when working with solvents. Additional safety requirements or protection may be necessary depending on the chemicals used in combination with this equipment. Make sure that you understand the hazards associated with the chemicals used and take appropriate measures with regards to safety and protection. Use of this product outside the scope of this guide may present a hazard and can lead to personal injury Spare parts and service availability Manufacturer provides operational spare parts of the instrument and current accessories for a period of five years after shipment of the final production run of the instrument. Spare parts will be available after this five years period on an ‘as available’ basis. Manufacturer provides a variety of services to support her customers after warranty expiration. Repair service can be provided on a time and material basis. Contact your local supplier for servicing. Technical support and training can be provided by qualified chemists on both contractual or as-needed basis. 8 DECADE II user manual, ed. 11 Table of contents Declaration of conformity 3 Intended use 4 WEEE directive 4 ROHS directive 4 Symbols 5 Safety practices 6 Spare parts and service availability 7 DECADE II electrochemical detector 11 Installation guide 13 Unpacking 13 Installation 13 Maintenance 17 DECADE II controller 19 Introduction 19 Overview of DECADE II screens 20 Parameters 24 ALEXYS® DECADE II driver 30 Detection and parameters 33 Introduction 33 Internal organisation 33 Dual flow cell control 33 Serial mode detection 34 Parallel mode detection 34 Navigation in dual cell menu 35 Parameters 36 Range 36 Offset 37 Polarity 38 Filter 38 Noise suppression: ADF™ 39 Introduction 39 Frequency 39 Frequency of signal and noise 40 Chapter 1 DECADE II electrochemical detector Low pass noise filters 42 Amplitude response plot 43 Applying ADF in chromatography 45 Events and time files 49 Introduction 49 Step by step example 49 Output events 51 Pulsed amperometric detection 55 Introduction 55 Pulse vs. DC 56 Pulse settings 57 Optimisation of wave forms 57 Output frequency 59 Peak width and integrator frequency 59 Working electrode material 60 References 62 Optimisation of working potential 63 Introduction 63 Electrochemical reactions 63 Hydrodynamic and scanning voltammogram 64 Optimisation using a voltammogram 65 Construction of a hydrodynamic voltammogram 68 Construction of a scanning voltammogram 68 Using scan mode in ALEXYS data system 70 Specifications DECADE II 73 General specifications 73 DC mode 73 PULSE mode 74 SCAN mode 74 Events 74 Rear panel I/O connections 74 Physical specifications 74 Flow cells 74 Error messages 75 Rear panel 77 Connectors A, B and C 77 9 10 DECADE II user manual, ed. 11 RS232C 77 Troubleshooting guide 79 No detector response 79 High cell current 79 Noisy baseline 79 Decreased sensitivity (low S/N ratio) 80 Base line oscillations 80 Saturation of output 80 Dummy cell 81 External dummy cell 81 Internal dummy cell 82 Detector accessories 83 Index 84 Chapter 1 DECADE II electrochemical detector C H A P T E R 11 1 DECADE II electrochemical detector Congratulations on your purchase of the DECADE II. This detector enables you to perform all applications using electrochemical detection. The DECADE II includes a highly stable Faraday-shielded oven compartment accommodating column and flow cell. This flow cell has surprised researchers for its unsurpassed S/N ratio and therefore you now possess the best possible combination for extremely sensitive EC analyses. The DECADE II covers the DC, pulse and scan mode. Important parameters in the DC and pulse mode can be changed on a time base by user-defined commands, which enables maximum control to fully automate the detection. In addition, crucial parameters can be controlled by either relays or TTL. 12 DECADE II user manual, ed. 11 CHAPTER 2 Installation guide C H A P T E R 13 2 Installation guide Unpacking Inspect the transport box for possible damage as it arrives. Immediately inform the transport company in case of damage, otherwise she may not accept any responsibility. Keep the transport box as it is designed for optimum protection during transport and it may be needed again. Carefully unpack the system and inspect it for completeness and for possible damage. Contact your supplier in case of damage or if not all marked items on the checklist are included. Prior to shipment, your detector has been thoroughly inspected and tested to meet the highest possible demands. The results of all tests are included. Installation To unpack the DECADE II, lift it from its box by both hands (Fig. 1). Never lift the DECADE II at its front door, but at its sides. Fig. 1. Lift instructions DECADE II. Install the detector in an area which meets the environmental conditions listed below: 14 DECADE II user manual, ed. 11 Table I. Environmental conditions Parameter Storage temperature Storage humidity Operating temperature Operating humidity Requirement -40 – 50 oC (-104 – 122 oF) 0 – 90%, non-condensing 4 – 40 oC (39 – 104 oF) 20 – 80%, non-condensing Place the detector on a flat and smooth surface. Do not block the fan located at the bottom of the detector (Fig. 2.). Blocking the fan will impair the cooling capability of the power supply. Fig. 2. Location of power supply fan DECADE II. Inspect the detector for possible damage and make sure that all marked (and ordered) items on the checklist are included. Switch ON the DECADE II by the mains switch on the rear panel. Ensure that the power (on/off) switch and power cord are always accessible. HPLC connections Use proper eye and skin protection when working with solvents. The manufacturer will not accept any liability for damage, direct or indirect, caused by connecting this instrument to devices that do not meet the relevant safety standards. The pump connected to the system should be specifically designed for use in High Performance Liquid Chromatography and capable of delivering flow rates typically in the range between 1 μL/min up to 10 mL/min. Please carefully follow the next steps for a successful installation and start-up. 1. The installation of the flow cell and column is shown in Fig. 3. 2. If a manual injector is applied with position sensor, the sensor cable must be connected to ‘C’ on the rear panel to enable INJECT/LOAD functions. 3. If an electrically actuated valve is mounted, connect the ‘digital input/output cable’ to ‘B’ on the rear panel to enable INJECT/LOAD functions. CHAPTER 2 Installation guide 15 Fig. 3. Installation of the DECADE II. 4. Prior to connection of the HPLC system to the detector all metal parts should preferably be passivated with 15% nitric acid during 20 min. Make sure that all parts that are not acid-resistant such as: nylon inlet filters, column and flow cell are not connected during this step. The acid is flushed through the pump, the pump tubing, the dampener, the injector (in load and inject position) and to waste. 5. After flushing with nitric acid, the system must be thoroughly flushed with demi water. Make sure that no traces of nitric acid are left in the tubing or pulse dampener (check with pH paper). Flush the system with HPLC buffer. If an ISAAC™ reference electrode is used, make sure that the buffer contains 2 mmole/l chloride (KCl or NaCl) ions. 6. Before connecting a new column read the manufacturer’s instructions. Our experience is that thorough pre-conditioning of a column is always required. Only a pre-conditioned column is electrochemically clean. If not, the background current may be unacceptably high and substantial fouling of the working electrode occurs. For reversed phase columns flushing with 50% methanol in water for 3 days at a low flow rate is highly recommended. Before switching to mobile phase, flushing with water (10 column volumes) is recommended to prevent precipitation of buffer salts. 16 DECADE II user manual, ed. 11 7. Passage of air bubbles through the flow cell will lead to unacceptable noise levels and ‘spikes’. Therefore, the use of an in-line degasser is strongly recommended. In our experience, a one-time degassing step of the HPLC buffer is almost never sufficient. 8. If the DECADE II is used for reductive ECD (at a negative working potential) additional steps should be taken to remove oxygen from the mobile phase. These include degassing with Helium and the use of stainless steel tubing (impermeable for oxygen). 9. Consult your flow cell manual for installation of the flow cell. Connect the flow cell to the corresponding cell connector in the oven compartment. All cell connectors are marked with a label for identification. In case of a DECADE II SCC connect the flow cell to the cell connector on the left side marked “Cell 1”. The cell connector inside the oven compartment is ESD sensitive. Make sure that the flow cell is OFF when removing or connecting the cell cable. Never switch ON the flow cell when: - the cell cable is not correctly connected - the cell is only partly (or not at all) filled with buffer - the outside of the flow cell is wet, particularly the part between the auxiliary and working electrode connection because substantial damage to the working electrode or electronics may occur. 10. Before switching ON the flow cell, make sure that the buffer contains sufficient electrolyte (buffer ions). A stable baseline will never be obtained if the cell is switched ON with only water or another nonconducting mobile phase. Also be sure that no air bubbles are trapped in the flow cell. 11. The outlet tubing from the flow cell should lead to a reservoir that is at a higher level than the flow cell. This ensures a minute back pressure which prevents air-bubble entrapment. The outlet tubing should be under the liquid level, to avoid electrical noise induced by ‘dripping’ of mobile phase. 12. Set the cell potential (see page 63 for optimisation of the potential), switch ON the flow cell (see page 19) and allow the system to stabilise for approximately 30 min. A ‘good’ stabilisation curve shows a mono-exponential decline without jumps and/or spikes. 13. Connect the data system to the output (see page 30). Your system is now ready for use. CHAPTER 2 Installation guide 17 The DECADE II has been developed for continuous operation. For maximum stability it is advised to leave the system ON continuously. If preferred, the flow cell may be switched OFF at night. Maintenance Perform periodic leak checks on LC tubing and connections and check if the drain on the bottom of the oven compartment is not blocked or closed. Do not allow flammable and/or toxic solvents to accumulate. Follow a regulated, approved waste disposal program. Empty and clean waste container regularly. Never dispose of such products through the municipal sewage system. This instrument has a lithium battery inside. Replacement of the battery should be performed by qualified service personnel. Dispose the battery according to chemical waste only. Replace blown fuses with fuses of proper type and rating as stipulated on the rear panel and specified in the installation section of this manual. The fuse holder is integrated in the mains connector. Ensure that the instrument is never put in operation with fuses of a different type. This could cause fire. USE ONLY WITH 250 V FUSES EMPLOYER UNIQUEMENT AVEC DES FUSIBLES DE 250V Do not use any organic solvents to clean the exterior of the detector. Use a cloth wetted with water only to clean the detector. Remove any dust on the protective screens that cover the fans in the oven compartment. 18 DECADE II user manual, ed. 11 CHAPTER 3 DECADE II controller C H A P T E R 19 3 DECADE II controller Introduction The DECADE II has been designed for maximum functionality and ease of use. The control of ECD parameters is such that without reading this chapter, it should be possible to operate the detector. This chapter is intended as a reference guide in case questions arise during operation. The information shown in the numerous screens is presented in alphabetical order. For each item an explanation is given, together with the item’s nature and the screen(s) of appearance. The nature of an item can be: 1. Control: parameters with a cursor box (‘’) can be attained via cursor buttons and changed by the ‘value’ button. 2. Status: without a cursor box a parameter reflects the current status. 3. Functions: parameters in CAPITALS are commands accessible via function buttons F1 - F5. 4. The 'Enter' button is only used to accept changes in cell potential. In the top right corner of each screen the name of the present screen is displayed. If available, the bottom left function button displays a previous screen, and the bottom right one the next screen. Fig. 4. DECADE II keyboard. The cursor is on ‘Range’ which allows changes using the value buttons ‘+’ and ‘-’. The ‘Enter’ button is only used to confirm changes in potential (Ec). 20 DECADE II user manual, ed. 11 Overview of DECADE II screens V o u t = + 0 . 0 5 7 V R a n g e = F i l t 5 0 n A = . 0 0 2 H z I c = + 2 3 . 4 5 n A E c = + 0 . 5 0 V C o m p = o f f D C 1 25 R E M O T E 2 5 > 3 0 ° C P R E V P C A n t e c D E C A D E - I I C O N F I G R a n g e = E c F i 5 0 n A t D C i o n S C A N D C 1 3 = + 1 0 % V o u t P O L A R = + S E T U P = + 0 . 0 5 7 V t 5 0 n A = . 0 0 2 H z P R E V E V E N T S I c = + 2 3 . 4 5 n A E c = + 0 . 5 0 V C o m p = o f f C E L L = O N M A R K N E X T D C 1 5 S T A T 2 5 > 3 0 ° C 2 1 1 . 2 0 A Z E R O N E X T if ID > 1 1 D I c = + 2 3 . 4 5 n A 4 P I c = + 1 . 5 0 m A 2 P I c = + 1 2 0 . 6 n A 5 S I c = + 6 . 7 9 n A 3 D I c = + 2 . 6 6 5 n A C o m p = o f f P R E V V o u t = + 0 . 0 5 7 V F i = 1 l e S T A T 91 2 5 > 3 0 ° C M A R K A Z E R O I N J = L E V E N T S 7 T e m p = 3 0 ° C S E T U P C y c l e s = 8 9 9 P R E V V o u t R U N = + 0 . 0 5 7 V R a n g e = F i l t 1 0 n A = . 0 0 2 H z I c = l t 1 1 2 2 8 > 3 0 ° C = 1 = . 0 0 2 H z P R E V Fig. 5. DC mode. A D D w a i i d = 0 0 0 0 1 E c = + 0 . 8 0 V O u t p = 0 1 1 0 D E L t i n g A Z E R O 3 3 5 0 n A R U N 13 C y c S T A R T R a n g e = F i = + 2 3 . 4 5 n A E c = + 0 . 8 0 V Q U I T T i m e N E X T O f f s = + 1 0 % P R O G 8 A z e r o = N O T O f f s S C R O L L 2 . 0 0 D I A G = . 0 0 2 H z R a n g e = l P U L S E O f f s P R E V F i M A I N 1 2 w o r k s t a t M a x C o m p = 2 . 5 µ A = + 0 . 5 0 V # l L e y d e n L C - E C 4 9 = + 1 0 % E N D C Y C L E CHAPTER 3 DECADE II controller 21 V o u t = + 0 . 0 5 7 V I c = + 2 3 . 4 5 n A P U L S E 1 46 5 0 n A E 1 = + 0 . 5 0 V R E M O T E R a n g e = F i l 2 5 > 3 0 ° C C o m p = o f f = . 0 0 2 H z t P R E V P C F i l D I A G P U L S E 1 15 M a x C o m p = 2 . 5 m A S E T U P 1 = + 1 0 % O f f s = . 0 0 2 H z t N E X T P R E V t 1 = 2 0 0 m s t 2 = 1 0 0 m s t s = 1 0 0 m s t = 3 0 0 m s F i 5 µ A t = t = . 0 0 2 H z P U L S E 1 17 S T A T 5 0 0 m s 3 0 > 3 1 ° C 2 1 1 . 3 7 N E X T A Z E R O M A R K C E L L = O N P R E V l C o m p = o f f = + 0 . 1 0 V E 1 N E X T E V E N T S = + 2 3 . 4 5 µ A I c = + 0 . 0 5 7 V R a n g e = S E T U P 2 1 0 0 m s t 3 = P O L A R = + P R E V P U L S E 1 16 E 3 = - 0 . 3 0 V E 2 = + 0 . 5 0 V E 1 = + 0 . 1 0 V V o u t 2 . 0 0 i o n S C A N P U L S E 5 µ A R a n g e = w o r k s t a t L C - E C D C C O N F I G M A I N 1 2 L e y d e n A n t e c D E C A D E - I I if ID > 1 1 D I c = + 2 3 . 4 5 n A 4 P I c = + 1 . 5 0 m A 2 P I c = + 1 2 0 . 6 n A 5 S I c = + 6 . 7 9 n A E V E N T S 18 = + 0 . 0 5 7 V V o u t T e m p = 6 l e C y c l e s = l = + 0 . 0 5 7 V I c C y c T i m e = R a n g e = F i l t P R E V = 1 S T A R T Q U I T 1 1 2 E 1 = + 0 . 5 0 V 2 8 > 3 0 ° C = . 0 0 2 H z A D D Fig. 6. PULSE mode. w a i i d = 0 0 0 0 1 E 1 = + 0 . 5 0 V O u t p = 0 1 1 0 D E L t i n g A Z E R O 3 3 5 0 n A R U N 20 = + 2 3 . 4 5 n A O f f s = + 1 0 % 1 0 n A = . 0 0 2 H z t N E X T R U N R a n g e = F i S E T U P 3 0 ° C = 9 9 P R E V V o u t I N J = L A Z E R O M A R K P R E V F i 2 5 > 3 0 ° C C o m p = o f f I c = + 2 . 6 6 5 n A 3 D S T A T 91 P R O G 19 A z e r o = N O T O f f s S C R O L L 4 9 = + 1 0 % E N D C Y C L E 22 DECADE II user manual, ed. 11 V o u t = + 0 . 0 5 7 V R a n g e = 5 0 n A I c = + 2 3 . 4 5 n A E c = + 1 2 0 1 m V C o m p = o f f S C A N 1 45 R E M O T E 2 5 > 3 0 ° C P R E V P C A n t e c D E C A D E - I I C O N F I G L e y d e n L C - E C D C M A I N 1 2 w o r k s t a t P U L S E E 1 O f f s E 2 5 0 µ A = + 1 . 2 0 V / S C A N 1 22 s S E T U P C y c = c o n t P R E V C E L L = O F F = + 0 . 0 5 7 V R a n g e = O f f s D I A G S p d = 5 0 m V = + 1 0 % V o u t 2 . 0 0 S C A N = + 0 . 2 0 V R a n g e = i o n I c 5 0 µ A = + 1 0 % P R E V N E X T = + 2 3 . 4 5 µ A S C A N 1 23 C y c = c o n t E 1 = + 0 . 2 0 V 3 0 > 3 0 ° C E 2 = + 1 . 2 0 V S T A R T C E L L = O N S T A T N E X T if ID > 1 Fig. 7. SCAN mode 1 D I c = + 2 3 . 4 5 n A 4 P I c = + 1 . 5 0 m A 2 P I c = + 1 2 0 . 6 n A 5 S I c = + 6 . 7 9 n A 3 D I c = + 2 . 6 6 5 n A C o m p = o f f P R E V M A R K A n t e c D E C A D E - I I C O N F I G V o u t = 1 V F S V a l v e = p r e s e n t P R E V E N S L A V E D C = 2 0 = 3 0 ° C m a s t e r = C O N F I G 35 y e s Fig. 8. CONFIG screens. A z e r o = n o M a r k y e s P R E V = D A s t a r t = n o E N S L A V E 88 I N J = L M A I N 1 2 w o r k s t a t P U L S E T e m p 2 5 > 3 0 ° C A Z E R O L e y d e n L C - E C C o n t r a s t I D 1 S T A T 91 S C A N i o n 2 . 0 0 D I A G CHAPTER 3 DECADE II controller A n t e c D E C A D E - I I C O N F I G D C 23 L e y d e n L C - E C M A I N 1 2 w o r k s t a t P U L S E i o n S C A N 2 . 0 0 D I A G D I A G 26 P R E V N O I S E K E Y B D I S P L F W D I S P 28 P R E V B o o t v e r s i o n F i r m w a r e v e r s i o n C h e c k s u m = 1 . 2 1 = 1 . 7 2 = 2 1 0 8 2 3 9 6 F W 68 P R E V K E Y B 29 - F 1 - K E Y P R E S S E D P R E V P l e a s e s t a b i t P R E V Fig. 9. DIAG screens. l i m e i z i n g w a i c e l l r e m a i n i n g t c u r r e n t 0 5 : 0 0 N O I S E 1 43 24 DECADE II user manual, ed. 11 Parameters Explanation: Type S is status, F is function and C is control. Parameter 28 > 30μC ADD EVENTS AZERO Azero Boot CELL=ON/ OFF Checksum Comp screen dc stat pulse stat scan stat run prog Description Displays the actual (left value) and the pre-set oven temperature (right value). Adds the active data line to the time file . Confirmation is asked for if an existing time is overwritten. As time 0.00 always exists, changing this time results in an overwrite warning (see page 39). dc setup, Enters EVENTS (‘EVENTS SETUP’ pulse setup2 screen) for editing and running a time file. dc stat, run, Sets the output voltage to 0 V, or to the pulse stat, offset voltage (see page 30). Control scan stat Comp = off changes to Comp = on. If cell current exceeds the max. compensation a message “cell current exceeds max. compensation” appears. In that case max. compensation will be applied, which may not be the 0 Volt level but higher. prog Controls auto zero, which can be programmed in a time file (see page 39). Toggles between ‘set’ and ‘not’. system Displays boot firmware version dc stat, Toggles between cell ‘ON’ and ‘OFF’. pulse stat, Confirmation is required “Switch cell on scan setup, (off)?”. Switching on resets the clock to scan stat 0.00. Pulse mode: pulsation occurs as long as the cell is on, irrespective which screen is selected. Scan mode: potential E1 is applied. system Displays checksum dc stat, Toggles between ‘ON’ and ‘OFF’, pulse stat releases auto zero offset. Switches ON if AZERO is pressed. Affects auto zero Type S F F F S F S C CHAPTER 3 DECADE II controller Parameter screen CONFIG Contrast Cyc main config run Cyc scan setup Cycles events setup DEL prog DIAG DISPL E1, E2, E3 main test pulse setup2 Ec prog (dc only), events setup (dc only), dc setup Ec run (dc only), scan stat (during 25 Description compensation only, not the % offset! Enters config screen Sets the contrast of display Displays the cycle counter. If a time file has to be executed more than once (‘Cycles’>1), this is the number of times a time file has been started (see page 39). RESET (external) or QUIT sets Cy to 1 and returns to EVENTS SETUP screen. Controls the nature of the cycle: half, full and continuous. ‘Half’ means that the cell potential runs from E1 to E2 and stops at E2 (/| ). ‘Full’ means that the cell potential runs from E1 to E2, and back to E1, and then stops (/\). ‘Cont’ means that the cell potential runs from E1 to E2 and back to E1 continuously (/\/\/\/\……..). Pressing “STOP” or finishing the cycle, sets the potential to E1. Controls the number of times a time file has to be repeated. This number can be 1 - 999 or continuous. Deletes the current data line from the time file . Deleting time 00.00, results in deleting the complete time file . Confirmation is required. Enters Diag screen Enters DISP screen for display test. Controls the cell potential settings of the pulse. Controls the cell potential is 10 mV steps between +2.00 and –2.00 V or +2.50 and -2.50V for the DECADE II MD. Can only be set or changed after confirmation with the ‘enter’ button. Controls the cell potential in a time file (without confirmation). Reflects the set cell potential. Displays the actual cell potential in the scan mode. Type F C S C C F F F C c S 26 DECADE II user manual, ed. 11 Parameter EndCycle Events File Filt Filt Firmware Hold resume HOLD=0,1 Ic Id INJ=I/L screen scanning) prog Description Type Enters a screen to set EndCycleTime. F Controls duration of a time file (max. 999.99 min). When this time is reached the execution of the time file stops. If programmed, the next run is started. Cannot be smaller than smallest time in time file +0.01 min. Is therefore never smaller than 0.01 min. Enter events menu F dc setup, pulse setupup2 events setup Selected time file number. In the DC mode file numbers 1 - 5 are available, in the pulse mode file numbers 6 - 9 can be selected. The time files remain stored in RAM, also after switching off the DECADE II. Time files can be uploaded via RS232. dc setup, dc Filter settings: 0.5 to 0.001 Hz cut off stat, prog frequency, in 1, 2, 5 steps. run Reflects the actual filter setting. system Displays firmware version run, scan Toggle, holds or resumes execution of stat time file or scan. run, scan Holds or continues execution of time stat file or scan. Toggles between 1 and 0. Pressing hold again continues time file or scan were it has been hold. stat (dc, Displays the true, non-compensated pulse, scan), cell current, unaffected by auto zero or events offset. setup, run, noise prog Board identifier for multi cell purpose. Indicates for which boards time file settings apply. Binary coded. dc stat, Displays or switches the position of the pulse stat injection valve, toggles between inject (I) and load (L). If a manual injector with position sensor is applied, it echoes the position of the injector. If an C C S S F F S C F/S CHAPTER 3 DECADE II controller Parameter screen KEYB test MARK dc stat, pulse stat dc setup, pulse setup1 several screens test MaxComp Next NOISE Offs Offs Outp POLAR PREV QUIT Range dc setup, dc stat, prog, pulse setup1, pulse stat, scan setup, scan stat run 27 Description electrically actuated injector is used (optional) it is possible to switch the injector with this function button. Enters ‘KEYB’ screen, for keyboard test. Press 2x F1 to leave. Triggers a marker signal on output. Type Maximum cell current that can be compensated for using auto zero. Enter next screen S F F F Enters NOISE screen for performance F test. Percentage offset, can be set between C -50 and +50%. Displays percentage offset during execution of a time file . prog Control of four output functions in EVENTS. Is open/high if ‘0’, is closed/low if ‘1’. AUX1: 0001, AUX2: 0010, relay 1: 0100, relay 2: 1000. Combinations are possible. dc setup, Inverts output polarity, toggle between pulse setup2 + and -. Requires confirmation. several Return to previous screen screens run Aborts the time file and returns to the ‘EVENTS SETUP’ screen. The cycle counter (‘Cy’) is reset to 1. Outputs Aux 1 and 2, and Relays 1 and 2 are reset (status: 0000). dc setup, dc Range setting, varying from 10 pA to stat, prog, 200 µA full scale, in 1, 2 and 5 steps. pulse In the pulse and scan mode 10 nA to setup1, 200 µA full scale can be used. pulse stat, scan setup, S C F F F C 28 DECADE II user manual, ed. 11 Parameter RUN S SCROLL SPD START STOP t t1, t2, t3 Temp Temp Time screen Description scan stat events setup Enters RUN screen. System waits (“waiting”) for the ‘START’ input trigger (external or keyboard) to start a run. scan setup Scan speed, can be set from 1 - 50 mV/s in 1, 2, 5 steps. prog Scrolls through a time file . scan stat Scan speed, can be set from 1 - 50 mV/s in 1, 2, 5 steps. run, scan In DC and pulse mode: toggle between stat STOP and START execution of a time file . Starts a scan in scan mode. run, scan Scan mode: STOP aborts scan and stat resets cell potential to E1. DC and pulse mode: toggle between STOP and START to control execution of a time file . Pressing ‘STOP’ aborts this run, cycle counter (Cy) is reset to 1. STOP also deactivates the outputs Aux 1 and 2, and Relays 1 and 2 (status: 0000) and sets the electric valve to load (if present). pulse Displays the total duration of one pulse setup2, (t1 + t2 + t3). pulse stat pulse setup2 Duration of potential step E1, E2, or E3. Time can be set between 0 (t2, t3) or 100 (t1) and 2000 ms in 10 ms increments. config Controls the temperature of the oven. Range: off, 15 - 45μC, selectable in 1μC steps. The oven is stable from 5 μC above ambient oven temperature. events setup Controls the temperature of the oven, is stored with time file. Temperature of active time file temperature overrules other temperature setting after selecting START. prog Controls the time to execute a data line in a time file , can be set with 0.01 min resolution. Maximum time is 999.99 min. The time to stop the execution of Type F C F C F F S C C C C CHAPTER 3 DECADE II controller Parameter Toven ts Tsensor Valve Valve Vout Vout screen Description a time file must be programmed by EndCycleTime. dc setup, Controls the temperature of the oven. pulse setup1 Range: off, 15 - 45μC, selectable in 1μC steps. The oven is stable from 5 μC above ambient. pulse setup2 Controls the duration of the sampling time in the pulse mode. The time can be set between 20 and 100 ms in 20 ms increments. system Displays active temperature sensor prog Controls the electrically actuated injector, during execution of a time file. Forces this valve to load (‘LD’) or inject (‘INJ’). config User confirmation whether a manual valve is connected to phone jack C on rear panel. If present: INJ=I or INJ=L appears in DC/Pulse Status screen stat (dc, Displays output signal. pulse, scan), events setup, run, noise config Controls max output signal (1 or 10 V full scale) for all sensor boards. 29 Type C C S C S S C 30 DECADE II user manual, ed. 11 ALEXYS® DECADE II driver Full control and data acquisition is supported in ALEXYS data system. Important difference with stand-alone operation is that timed events are not executed from time files, but from the events page in ALEXYS software. DECADE II time files are not supported in ALEXYS data system. Use events page instead. Fig. 10. DECADE II driver in ALEXYS data system. Parameters in blue against white background are actual settings. New parameters on the left side (Method data) can be set by clicking the Set button. CHAPTER 3 DECADE II controller A unique feature of ALEXYS data system is the scanning voltammetry module. From the DECADE II device driver window all parameters are set. The so called “scan shell” is opened and the scan is started. 31 32 DECADE II user manual, ed. 11 CHAPTER 4 Detection and parameters C H A P T E R 33 4 Detection and parameters Introduction One of the characteristics of electrochemical detection is its tremendous dynamic range. In amperometric detection peak heights may vary from micro-amperes down to the pico-ampere range. The DECADE II covers such a wide range from 200 µA down to 10 pA full scale, without being limited by electronic noise. For this reason the DECADE II is equipped with a 24 bit ADC and 20 bit DAC for analogue data output. Internal organisation At the working electrode (WE) in the electrochemical flow cell the electron transfer takes place due to an oxidation or reduction reaction. The resulting electrical current is amplified by the current-potential (I/E) converter (Fig. 11). Fig. 11. DECADE II signal processing from electrochemical flow cell to output. The signal from the I/E converter can be compensated with auto zero or offset, and is digitised using a 24 bits ADC. In the CPU the signal is processed, for example noise filtering, or more complex data processing in PAD. Finally after the 20 bits DAC the signal is set to a 1 or 10 V full scale analogue output. Dual flow cell control The DECADE II electronics are located on 2 different PCB's (printed circuit boards). The control board and the sensor board. The control board is dedicated to communication with PC (RS232) and keyboard & display. It has a processor with a so called 'event handler' that takes care of all user 34 DECADE II user manual, ed. 11 commands and hardware interrupts. The sensor board is fully dedicated to data acquisition and flow cell control. By using this architecture it is possible to extend the functionality of the DECADE II to more than one flow cell by simply adding a sensor board. The control board and other hardware is prepared for more than one sensor board. Typically, a two flow cell configuration can be used in serial or parallel mode detection. Serial mode detection In serial mode one LC system is used, with 2 flow cells in series. For data acquisition 2 data channels are applied with the same time base. Serial mode detection is especially suitable for OX-RED or RED-OX applications, examples are analysis of vitamin K and nitro-tyrosine, using micro HPLC. The first flow cell is a reactor™ cell that converts the analyte of interest in a detectable substance. The second flow cell is a VT-03 cell which is used for detection. Note that it is necessary to work with micro HPLC because the conversion rate of the reactor cell is too small when using standard HPLC. Fig. 12. Typical configuration for serial mode detection. Cell 1 is a reactor cell, cell 2 is a VT-03 cell for detection. Channel 1 and 2 use the same time base of system 1. Parallel mode detection In parallel mode 2 HPLC systems are used with 2 flow cells. In fact, the DECADE II is operated as if 2 independent detectors are in one housing. CHAPTER 4 Detection and parameters 35 Fig. 13. Typical configuration for parallel mode detection. Two independent HPLC systems with dual channel support from OR 100, DECADE II and ALEXYS data system. Fig. 14. DECADE II with 2 columns and 2 VT-03 flow cells for parallel detection. Navigation in dual cell menu All menus for a dual flow cell system are similar to a single cell system with 2 exceptions. First, in the top right corner a number is visible which indicates the active cell in display. Toggle with the “+” and “-“ buttons between sensor boards. If the board number does not change it means that the second sensor board is not installed or not properly recognized. Second, a new 36 DECADE II user manual, ed. 11 status screen is available in dual cell systems which indicates the status of both cells in a single screen. However, for convenience it is advisable to use PC control from ALEXYS data system when working with 2 flow cells. A n t e c D E C A D E - C O N F I G I I L e y d e n L C - E C D C M A I N 1 w o r k s t a t P U L S E S C A N 1 D I c = + 2 3 . 4 5 n A 4 P I c = + 1 . 5 0 m A 2 P I c = + 1 2 0 . 6 n A 5 S I c = + 6 . 7 9 n A 3 D I c = + 2 . 6 6 5 n A P R E V C E L L = O N i o n 3 . 2 x x D I A G S T A T 1 2 5 > 3 0 ° C 91 C o m p = O F F M A R K A Z E R O I N J = L Fig. 15. DECADE II main menu (top)with active cell indicator in top right corner. Multi-STAT screen showing cell 1 (DC mode) and cell 2 (PULSE mode). Parameters Operational parameters are controlled from the SETUP screens in the DECADE II. Parameters are filter, cell potential and offset. Temperature is set in CONFIG menu. T e m p = V a l v e = 3 0 ° C C o n t r a s t = p r e s e n t o u t = I D 1 m a s t e r = 2 0 C O N F I G 35 1 V F S y e s P R E V R a n g e = 5 0 n A E c = + 0 . 5 0 V # F i l t = . 0 0 2 H z P R E V M a x C o m p = 2 . 5 µ A O f f s = + 1 0 % P O L A R = + E V E N T S DC 1 3 S E T U P N E X T Fig. 16. Selection of parameters in the ‘DC SETUP’ screen. Temperature is set in CONFIG menu. Range Range selection is done in the ‘SETUP’ or ‘STAT’ screen in DC, PULSE and SCAN mode. A number of ranges can be selected; the maximum current that can be compensated for using auto zero and offset differs. The high sensitivity ranges (10 pA - 5 nA) have the best noise specifications. In fact, CHAPTER 4 Detection and parameters 37 there is a trade off between best noise specification at sensitive ranges, and maximum compensation at the less sensitive ranges. This is an inevitable consequence of the tremendous dynamic range that is covered by electrochemical detection. Table II. DC ranges and maximum compensation. Range FS 200 µA 100 µA 50 µA 20 µA 10 µA 5 µA 2 µA 1 µA 500 nA 200 nA 100 nA 50 nA Max comp 2.5 mA 2.5 mA 2.5 mA 2.5 mA 2.5 mA 2.5 mA 25 µA 25 µA 25 µA 25 µA 25 µA 2.5 µA Range FS 20 nA 10 nA 5 nA 2 nA 1 nA 500 pA 200 pA 100 pA 50 pA 20 pA 10 pA Max comp 2.5 µA 2.5 µA 250 nA 250 nA 250/25 nA* 250/25 nA* 250/25 nA* 25 nA 25 nA 25 nA 25 nA * From firmware > 3.00 the noise level in ranges 200, 500 pA and 1 nA has been improved considerably by selecting a different amplifier setting. As a consequence max. compensation is changed to 25 nA for these ranges. In the PULSE and SCAN mode, current is much higher than in DC mode. Therefore it is not possible to select pA ranges. Table III. PAD ranges and maximum compensation. Range FS 200 µA 100 µA 50 µA 20 µA 10 µA 5 µA 2 µA 1 µA Offset Max comp 2.5 mA 2.5 mA 2.5 mA 2.5 mA 2.5 mA 2.5 mA 25 µA 25 µA Range FS 500 nA 200 nA 100 nA 50 nA 20 nA 10 nA Max comp 25 µA 25 µA 25 µA 2.5 µA 2.5 µA 2.5 µA 38 DECADE II user manual, ed. 11 A maximum offset of +50% and - 50% in 5% steps can be set. For example, 20% is a 200 mV offset when the maximum output is 1.0 Volt (2 V at max. 10.0 V). Polarity The polarity of the output can be inversed. Oxidative and reductive analyses generate opposite currents. For data acquisition, traditionally chromatographic peaks have a positive amplitude. Therefore selection of polarity is useful. Filter High frequency noise is efficiently removed and chromatographic peaks can be detected with better signal to noise ratio. Fig. 17. Signal to noise ration is improved using a filter (A vs. B). CHAPTER 5 Noise suppression: ADF™ C H A P T E R 39 5 Noise suppression: ADF™ Introduction Besides for its tremendous linear dynamic range and selectivity, electrochemical detection is well-known for its very low limits of detection. To further improve these detection limits the Antec Leyden engineers have developed ADF (Advanced Digital Filter) and the DECADE II has been equipped with it as a standard. The improvement factor in signal-to-noise (S/N) ratio depends on the frequency relation of signal and baseline noise. S/N improvements from a factor 5 up to more than 100 have been obtained. To understand how a digital filter works, first the importance of frequencies in chromatographic analysis will be explained. Then we will look at peak width, filter settings, cut off frequency, amplitude response plots and finally at a few chromatograms before and after applying ADF. Frequency A scientific definition of frequency is “the number of completed alterations per unit time”. It has two dimensions: count and time. Frequency is usually expressed in Hz, which is counts per second. The counts themselves can run in a regular, evenly spaced manner, as with sine waves whose curve shapes do not change. Alternatively, the counts can run in an irregular manner within the specified unit of time. If the latter happens, frequencies would vary if broken down into t smaller units of time. In the example of Fig. 18 a signal is shown with a frequency of 12 alterations in 5 minutes. To express its frequency in a more scientific way a full period is precisely determined and expressed in Hertz (or s-1). It is a sine wave with a frequency of 0.04 Hz (Fig. 19). 40 DECADE II user manual, ed. 11 400000 300000 200000 100000 0 -100000 0.0 0.5 1.0 1.5 2.0 2.5 3.0 3.5 4.0 4.5 5.0 -200000 -300000 -400000 Fig. 18. Example of a signal with regular evenly spaced alterations: a sine. 400000 300000 200000 100000 0 -100000 4.0 4.1 4.2 4.3 4.4 4.5 4.6 4.7 -200000 -300000 4.8 4.9 5.0 t (min) 4.15 4.56 -400000 Fig. 19. Sine of Fig. 18. A full period is 0.41 min (25 s) which corresponds to a frequency of 1/25 = 0.04 Hz. Frequency of signal and noise Also a chromatographic peak can be expressed in terms of frequencies. The way to determine this frequency is the same. The duration of the full peak is measured and expressed in Hz. 540000 3.8 440000 4.05 340000 240000 140000 40000 3.0 3.2 3.4 3.6 3.8 4.0 4.2 4.4 4.6 4.8 5.0 Fig. 20. Frequency tells how often something happens: 1 peak in about 0.25 min (15 s), f = 1/15 = 0.07 Hz. Noise suppression: ADF™ 41 This is further illustrated by an overlay of the same chromatographic peak with a sine of 0.07 Hz (Fig. 21). 540000 440000 340000 240000 140000 40000 3.0 3.2 3.4 3.6 3.8 4.0 4.2 4.4 4.6 4.8 5.0 Fig. 21. Overlay of a chromatographic peak with 0.07 Hz sine. Typically in chromatography narrow peaks are in front of a chromatogram while peaks with longer retention times get wider. As a consequence frequencies are not constant but vary between 0.1 – 0.01 Hz, which corresponds to 10 – 100 s peak width. ADF 698000 598000 10 s 0.10 Hz 40 s 0.025 Hz 498000 398000 h CHAPTER 5 298000 198000 98000 -2000 1.0 2.0 3.0 4.0 5.0 6.0 7.0 8.0 min Fig. 22. Typical chromatogram with peak widths between 10 – 100 s.. Noise in chromatography can come from different sources. Pump pulsations are typically shown as a very regular noise pattern, while electronic noise has a more random character. This is illustrated in Fig. 23 where a noise trace is shown with an overlay of a 10 and 0.4 Hz sine. DECADE II user manual, ed. 11 20 sine f = 10 Hz 15 10 sine f = 0.4 Hz I (pA) 42 5 0 -5 30 31 32 33 34 35 36 37 38 39 40 t (s) Fig. 23. Typical random noise in chromatography (lower trace). Both frequencies (0.4 and 10 Hz) can be recognised amongst others. Looking closely to the lower noise trace both frequencies (and others) can be recognised. This is typical for noise in chromatography: a collection of more or less random frequencies. Low pass noise filters The way noise filters work is by suppressing certain frequencies in the acquired signal. Typically low pass filters allow chromatographic peaks (low frequency) to pass, while high(er) frequency noise is attenuated. No matter how advanced, it is impossible to use a low pass filter successfully if there is no difference in frequency of signal and noise. Analogue filters are made of hardware, from capacitors, resistors and amplifiers (opamps). Digital filters are mathematical routines to process an acquired signal. Traditionally, in many detectors for chromatography an analogue low-pass filter is applied (rise time filter). A ‘passive’ RC filter consists of resistors and capacitors. An active higher order filter can be considered as a number of these RC filters in series. In a 4th order filter the signal coming from the first filter is filtered again in a second, third and fourth filter. During these steps, loss of signal occurs simply because of all the resistors that are applied. Operational amplifiers, which are ‘active’ components, are applied in each stage to restore the signal to its original value. With the availability of powerful processors, digital signal processing has become an excellent alternative for hardware filters. In its most simple form a running average filter takes the average of n data points to create a new data point. For example in a 5-points running average filter output data point y[80] is calculated from measured data points x[80] – x[84] as: CHAPTER 5 Noise suppression: ADF™ 43 Each input data point has the same weighting factor of 1/5. In more advanced digital signal processing a more complicated equation is used to calculate the output data point y[n]: In contrast to the previous equation, each data point has a different weighting factor a. Sum of these weighting factors a0…n will always be 1. Characteristic of noise filters is that processing the signal will result in a delay. This is inevitable, as the mathematics of digital signal processing requires a number of previous data points to process a new data point. The filter characteristic in DSP is often named after the scientist who ‘invented’ the mathematics behind the signal processing routine. Well-known names in this field are Bessel, Chebychev, Savitsky, Golay, Hamming and many others. Amplitude response plot There are several ways to describe the filter characteristics. An amplitude response plot gives important information on filter behaviour. Suppose our signal of interest has a frequency between 0 - 1 Hz, and all higher frequencies are noise. An ideal filter is shown in Fig. 24 where signal frequencies between 0 – 1 Hz completely pass while frequencies of higher than 1 Hz are completely blocked. 1.2 Amplitude pass 1 0.8 0.6 0.4 0.2 filte r block 0 0 1 3 2 Freq uency (Hz) 4 5 Fig. 24. Amplitude response plot of an ideal low pass filter with a cut-off frequency of 1 Hz. In practise filters behave a bit different from the ideal situation. Amplitude response plot shows a more gradual attenuation profile at higher frequency. DECADE II user manual, ed. 11 This cut off frequency is where the output signal amplitude is 70% of the input signal, also known as 3 dB point. 1.2 Amplitude 44 1 0.8 0.6 0.4 B 0.2 A C 0 0 1 3 2 Freq uency (Hz) 4 5 Fig. 25. An amplitude response plot of a low pass filter with a cut-off frequency of 1 Hz. It is a 2 (A), 4 (B) and 8 (C) pole Bessel filter. In Fig. 25 it is shown that the number of poles is important, a filter behaves more ideal with increasing number of poles. In a hardware filter the number of poles is the number of filter circuits that are placed in series. Fig. 26. Analogue 6 pole Bessel filter. A digital filter does not have poles, but it is characterised by the number of input data points used to calculate a new output data point. For example a 9point digital filter (Savitzky-Golay) is given as: Y[1] = -0.090909091 0.168831169 0.255411255 0.168831169 -0.090909091 X[1] X[3] X[5] X[7] X[9] + + + + 0.060606061 0.233766234 0.233766234 0.060606061 X[2] X[4] X[6] X[8] + + + + Note that the sum of coefficients is exactly 1. Y[n] is the output data point, X[n] are input data points. Generally spoken, the performance of a digital filter CHAPTER 5 Noise suppression: ADF™ 45 improves with more input data points, but also more processor capacity is required for the large number of calculations. Applying ADF in chromatography If noise frequencies in LC-EC differ from the frequency of the signal, noise can be suppressed. Using the right filter setting (cut-off frequency) will specifically attenuate noise and improve the signal-to-noise (S/N) ratio. No matter how ‘advanced’ a filter is, it is only possible to apply low pass filtering if noise frequencies are higher than the frequency of the signal. 400000 300000 200000 100000 0 0 0 5 10 15 0 5 10 15 0 5 10 15 5 6 7 8 9 10 5 6 7 8 9 10 5 6 7 8 9 10 400000 300000 200000 100000 0 0 400000 300000 200000 100000 0 0 Fig. 27. From top to bottom filter setting of 0.5, 0.02 and 0.002 Hz. Narrow peaks in front of the chromatogram are deformed at 0.005 Hz, whereas wider peaks show hardly any deformation (see peak at t~ 13 min). Attenuation of noise is shown in the close up on the right. 46 DECADE II user manual, ed. 11 Prerequisite for a ‘good’ noise filter for data acquisition in liquid chromatography is that it improves the S/N ratio without significant distortion of the signal of interest. This is particularly difficult if the frequency of the signal is close to the frequency of the noise. The DECADE II has a number of filter settings to optimise for best possible signal-to-noise ratio. The width of the peaks of interest is important because wider peaks allow stronger filter settings simply because of the lower frequency of such peaks. Advised filter setting to start further optimisation is given as: Filter setting = 1 / [2 * (peak width)] So at a 10 s peak width a 0.05 Hz filter setting is advised. If peaks are 50 s a 0.01 Hz filter is advised to start with. Note that if a chromatogram has interesting peaks of 10 s as well as 50 s, it may not be possible to work with one filter setting. In that case it is advisable to switch to a stronger filter setting for the second half of the chromatogram using a timed event. To optimise for the best S/N ratio, use the lowest acceptable cut-off frequency. After optimisation, do not change the cut-off frequency setting during analysis of a calibration sequence. Use the same settings for analysis of samples and calibration standards. Fig. 28. Analysis of 20 pmole/L 5 hydroxytryptophan, 5-HIAA and 5HT using ADF for improving detection limits. The S/N improvement depends on the composition of the frequency spectrum. Improvement up to a factor 100 may be obtained compared to an CHAPTER 5 Noise suppression: ADF™ 47 unfiltered signal. As high frequency noise is suppressed, remaining noise components will be in the same frequency range as chromatographic peaks. As suppressing noise will always result in (some) suppression of signal it is advised to switch the DECADE II to the highest acceptable sensitivity. 48 DECADE II user manual, ed. 11 CHAPTER 6 Events and time files C H A P T E R 49 6 Events and time files Introduction Running an Events table (time file) enables a time-based, automated and full parametric control of electrochemical detection (ECD). This is particularly useful when during a run or between runs settings have to be changed such as the sensitivity, auto zero or control of external equipment (i.e. trigger to start integration software etc.). A time file contains a series of data lines (maximum of 50) in which the settings of the DECADE II can be changed with 0.01 min (0.6 s) time resolution. T i m e = R a n g e = F i l t 1 1 2 3 3 5 0 n A = . 0 0 2 H z P R E V i d = 0 0 0 0 1 E c = + 0 . 8 0 V O u t p = 0 1 1 0 A D D D E L P R O G A z e r o = N O T O f f s S C R O L L 4 9 = + 1 0 % E N D C Y C L E Fig. 29. Programming a time file using the 'PROG' screen. The time file is made using the ‘PROG’ screen. Programmable parameters comprise cell potential, range, auto zero, offset, filter, board id, electrically actuated injector (if present) and the DECADE II output contacts to control the status of external equipment. Table IV. A time file used for offset programming at 5.00 min. time range filt valve 00.00 00.02 05.00 05.02 14.96 14.98 15.00 1 nA 0.5 Hz load 1 nA 0.5 Hz load 1 nA 0.5 Hz load 1 nA 0.5 Hz load 1 nA 0.5 Hz load 1 nA 0.5 Hz load EndCycleTime (end of run) auto zero not set not set not set output offset E cell 0000 0000 0000 0000 0000 0000 00% 00% -30% -30% 00% 00% 0.80 V 0.80 V 0.80 V 0.80 V 0.80 V 0.80 V id 00001 00001 00001 00001 00001 00001 Step by step example In this step-by-step guide the example from Table IV will be programmed. The data acquisition software controls the detector, and the autosampler. There is no external valve connected to the ‘C’ or ‘B’ on the rear panel of the detector. For some reason, a user wants to give an –30% offset after t=5.00 min. 8 50 DECADE II user manual, ed. 11 1. 2. Go from MAIN, DC SETUP to DC STAT screen to see if the cell is ON or not. Set the cell to the desired status and return to DC SETUP. From the DC SETUP screen select 'EVENTS'. In the EVENTS SETUP screen, select file number 'File = 1', actual cell potential 'Ec = 0.80 V', and the number of cycles 'Cycles = 1'. Vout and Ic show the actual cell current and output signal. In DC mode file nr. 1..5 is available, in PULSE mode file 6..9. V o u t = + 0 . 0 5 7 V F i = 1 l e E V E N T S T e m p = 3 0 ° C 7 S E T U P C y c l e s = 8 9 9 P R E V 3. R U N N E X T Press PROG to enter the PROG screen. Before programming, first the contents of file 1 is checked to make sure that the file is not already in use. Press SCROLL to see the contents of the file. If the file is still relevant and contains timed events, another file can be selected in the EVENTS SETUP screen. If the file contains data that are no longer used, the contents of the file can be erased. Scroll to Time = 0.00 min and press DEL. Answer 'Yes' to the question: 36 D e l e t e t i m e f i l e Y E S 4. T i m e F i l t P R E V 6. N O Programming the time file is done by entering all parameters for Time = 0.00 and pressing ADD. This is repeated for each time line in Table IV. = R a n g e = 5. ? 1 1 2 3 3 5 0 n A = . 0 0 2 H z A D D i d = 0 0 0 0 1 E c = + 0 . 8 0 V O u t p = 0 1 1 0 D E L P R O G A z e r o = N O T O f f s S C R O L L 4 9 = + 1 0 % E N D C Y C L E If a time already exists, a message appears "Overwrite time x.xx ?". Confirm this and continue programming by entering the new time with its corresponding settings. Note that in the example at Time = 14.96 min the % offset is set to 00% to prepare for the next run. An auto zero event is programmed 0.02 min later at Time = 14.98 min. After entering all events, press PREV (or ENDCYCLE) to enter the EndCycle screen. Program the EndCycleTime. This time is always 0.01 min higher than the last programmed events. 8 CHAPTER 6 Events and time files T i m e = 51 1 1 2 3 4 E n d C y c l e T i m e P R E V 7. 12 S C R O L L To start the time file , select RUN from the EVENTS SETUP screen. The RUN screen appears and the system is waiting for a start command. This can be a keyboard command, or an external trigger (line 13 from connector A on the rear panel). V o u t = + 0 . 0 5 7 V F i = 1 l e E V E N T S T e m p = 3 0 ° C 7 S E T U P C y c l e s = 8 9 9 P R E V V o u t = + 0 . 0 5 7 V R a n g e = F i l t R U N 1 0 n A = . 0 0 2 H z I c E c = + 0 . 8 0 V C y c 2 8 > 3 0 ° C F i l t = 1 S T A R T = + 0 . 0 5 7 V R a n g e = = + 2 3 . 4 5 n A O f f s = + 1 0 % Q U I T V o u t N E X T 1 0 n A = . 0 0 2 H z Q U I T H O L D I c R U N w a i t 13 i n g A Z E R O = + 2 3 . 4 5 n A R U N O f f s = + 1 0 % E c = + 0 . 8 0 V 0 1 1 0 C y c 2 8 > 3 0 ° C 2 1 2 . 3 3 = 1 S T O P A Z E R O Output events Connector A and B on the rear panel enable control of (or by) external equipment. Together with time files this supplies a powerful tool for development of automated methods. Inject marker A manual valve with position sensor can be connected to ‘C’ on the rear panel of the DECADE II which enables the inject marker on connector B. The contact is high when the valve is in ‘load’ position, and low in the ‘inject’ position. It can be used to start the integration software when injection is done. Overload Activated when a overload occurs, see also page 75 for details. 14 52 DECADE II user manual, ed. 11 Auto zero Enables external activation of the auto zero command. This function is active only when the ‘I-cell’ is displayed. To pos I, L Forces the electrically actuated injector to position L (load) or I (inject). Cell on, off Switches on (off) the flow cell. This input command can be used for example to switch on and stabilise the flow cell early in the morning by means of a timer. Table V. I/O contacts connector A. No. 1,2,3 Name Relay 1 I/O Out 4,5,6 Relay 2 Out 7 8 9 10 Cell on Reset Overload AUX1 In In Out Out 11 AUX2 Out 12 13 14 Cell off Start Auto zero In In In 15 Common Function Contact between 1 (common) and 2 (default) or 3. Activated by time file Outp 0100 Contact between 4 (common) and 5 (default) or 6. Activated by time file Outp 1000 Trigger to switch on cell Resets a running time file Active when overload occurs (‘out of range’) Free programmable TTL output Activated by time file Outp 0001 Free programmable TTL output Activated by time file Outp 0010 Trigger to switch off cell Starts a time file Auto zero command, always accessible when ‘Icell’ is in display Ground Outputs 7, 8,12,13 and 14 are level triggered. When active, output status 9, 10 and 11 is low (default is high). CHAPTER 6 Events and time files 53 Table VI. I/O contacts connector B. No. Name 1-3 4 5 6 7 8 - 11 12 13 Common Free TTL input Mark Status I Status L Common Free TTL output Inject marker 14 15 To I To L I/O Function Ground In In In In Out Out Out Out Baseline spike of 10% FS, duration: 0.1 s Status read of electric valve, pos B (inject) Status read of electric valve, pos A (load) Ground In combination with manual valve connected to connector C, high: ‘load’, low: ‘inject’. Forces electric injector to “inject” Forces electric injector to “load” Outputs 4 – 7, 12, 14 and 15 are level triggered. Level triggered TTL input: contacts require a minimum TTL-low pulse duration of 100 ms. If multiple activations are required the next pulse should be given after 100 ms TTL high. When the input is kept low, only one activation will occur. TTL output: default = high (5 Volt) The manufacturer will not accept any liability for damage, direct or indirect, caused by connecting this instrument to devices that do not meet the relevant safety standards 54 DECADE II user manual, ed. 11 CHAPTER 7 Pulsed amperometric detection C H A P T E R 55 7 Pulsed amperometric detection Introduction Several advanced features are implemented in the DECADE II. One of these features is the so-called pulse mode. In pulsed amperometric detection (PAD) the working electrode (WE) is regenerated at a frequency of 0.5 - 3 Hz by the application of a series of potential changes. This is particularly useful for certain applications where the working electrode is rapidly fouled due to adsorption of insoluble reaction products. A well-known application area of PAD is the analysis of carbohydrates (Fig. 30) [1]. Fig. 30. Pulsed amperometric detection of 100 nmol/l (2 pmol) carbohydrates. Peaks are: sucrose (1), galactose (2), glucose (3), -lactose (4) and maltose (5). 56 DECADE II user manual, ed. 11 Pulse vs. DC The pulse mode is quite different from the DC mode: 1. The output signal is sampled during a fraction of the total pulse cycle. During the sampling time (ts) the signal generated at the WE is collected and this value is sent to the detector output. This implies that the output is refreshed each pulse cycle. In other words, the frequency of data output is determined by the pulse duration. 2. When the frequency of the data acquisition system (integrator) is higher than the pulse frequency a typical stepwise pattern may appear in the chromatogram. This is normal and only visible after considerable magnification of the chromatogram. 3. The background or cell current is usually considerably higher (100 1000 nA) than in the DC mode. Therefore, only nano- and microampere ranges are available in the pulse mode. 4. After prolonged use of the flow cell with a gold working electrode (WE) in the pulse mode, the gold oxide which is generated at the WE, precipitates on the auxiliary electrode (AUX). This gold oxide coating may electrically isolate the AUX and result in an increase of the noise. Cleaning the AUX electrode with metal wool is a way to remove this coating. Be careful NOT to touch the working electrode with metal wool. 5. Reference electrodes of the Ag/AgCl type are less suitable for carbohydrate analysis. Due to silveroxide formation they require regular (monthly) maintenance. Hy-REF reference electrodes are maintenance free under these conditions and are therefore particularly suited. 6. If a mobile phase is used with a high pH (pH>10, carbohydrate analysis), the standard Vespel rotors from the injection valve should be replaced by Tefzel rotors which are pH resistant. 7. For carbohydrate analysis, only CO2-free sodium hydroxide should be used since carbonate anions may disturb the ion exchange chromatography. The CO2-free sodium hydroxide is available from several suppliers as a 50% solution (19.2 mol/l). NaOH pellets are not recommended because of their high CO2 content. 8. The accuracy of certain pH-electrodes is poor at high pH. For applications at high pH it is sometimes better to calculate the pH from the OH- concentration. 9. Organic modifiers (acetonitrile) strongly attenuate the signal of most carbohydrates in PAD and are therefore not recommended. Some of these aspects will be discussed in detail. CHAPTER 7 Pulsed amperometric detection 57 Pulse settings In PAD of carbohydrates the working potential is applied as a series of 3 potentials. During time interval t1 the detection potential is applied. The data collection occurs within t1, during time interval ts (sampling time). The time difference t1 - ts is the stabilisation time. Fig. 31. Potential steps in pulsed amperometric detection. A part of t1 is used for detection (ts). The metal oxide layer that is formed during t2, is removed during t3, resulting in a renewal of the electrode surface. During the next time interval (t2) a monolayer of metal oxide is formed at the working electrode due to the high positive potential. This monolayer is electrochemically removed from the electrode surface during time interval t3, by applying a negative potential. Optimisation of wave forms LaCourse and Johnson [2-4] have published several papers on optimisation of wave forms in PAD. Several considerations are important for the choice of the pulse duration. Optimisation is depending on the working electrode material, the sample constituents and the required detection frequency. The impression may arise that the number of variables, 3 potential steps and 4 time settings, may lead to a time-consuming optimisation procedure. In practice, the pulse mode is more straightforward. The potential for the cleaning steps, E2 and E3, are determined by the WE material. At alkaline pH gold oxide is already formed at E2 > +200 mV (vs. Ag/AgCl). At a higher potential the formation of a metal oxide layer is 58 DECADE II user manual, ed. 11 accelerated and a shorter time setting may be chosen. In practise an E2 value of +750 mV during 200 ms (t2) gives good results. The choice of t3 is depending on the potential E3 and the t2 and E2 setting. It is essential that the duration of t3 and the magnitude of E3 is such that a complete removal of the metal oxide is achieved. Reductive dissolution already occurs at E3 < 0 mV, but a more negative voltage speeds up this process. An E3 value of -800 mV during 200 ms (Table VII), or -300 mV during 360 ms [4] can be used. The measuring potential is compound dependent, usually literature data can be used as a starting point for further optimisation. A sampling time ts can be chosen between 20 and 100 ms in 20 ms steps. These are multiples of the 50 Hz, to prevent noise due to oscillations of the AC power supply. Until a certain limit, increasing ts will result in an increase of signal. A limiting factor is the accumulation of adsorbed species at the working electrode that attenuate the signal. Another consideration, not only for ts but for all time settings, is that increasing the time will decrease the detection frequency. Before sampling a stabilisation time is applied, set by the duration of t1. In practice the stabilisation time determines the level of the background current. When, for example, t1 = 100 ms and ts = 100 ms, there is no stabilisation of the current before sampling (t1 - ts = 0 ms). Depending on the potential setting of E2 and E3, a large positive or negative background current (micro amperes) may be detected which is seriously limiting the detection. In practice, often a 100 - 400 ms stabilisation time is used. Fig. 32. A magnified view of a chromatogram obtained with PAD. The integrator frequency is 5 times higher than the detector output frequency resulting in a typical stepwise signal. CHAPTER 7 Pulsed amperometric detection 59 Output frequency An important difference between the DC and the pulse mode is the frequency of the output signal on the output. In the DC mode the signal has a 10 Hz frequency, in the pulse mode the frequency is determined by the duration of the pulse. Once every cycle, the ts signal is sent to the output. This can be visualised by magnification of a peak in the chromatogram (Fig. 32). A stepwise pattern in the chromatogram is only seen on an (analog) chart recorder, or on an integrator that has a higher sampling frequency than the output frequency of the detector. In fact, when this pattern is seen this means that the integrator has an unnecessarily high sampling frequency. This leads to large data files, but certainly not to a better chromatogram. Peak width and integrator frequency There are two important considerations with respect to integrator frequencies applied in HPLC. If the frequency is too low, data will be lost and artefacts may be introduced. If the frequency is too high, large data files are generated which take up an unnecessary large amount of disk space. As a rule of thumb, the sampling frequency of the integrator is set such that a chromatographic peak is build up of at least 10 data points. For a peak width of 10s this means that a sampling frequency of 1 Hz should be sufficient. Fig. 33. A detailed part of a chromatogram acquired at different integrator frequencies. The integrator frequency is (A) 5x, (B) 2.5x, (C) 1.2x, (D) 0.6x and (E) 0.3x the frequency of the pulse. In case of PAD the duration of the pulse should also be taken in account. When the frequency of the pulse is 2 Hz, it makes no sense to acquire data on an integrator with a significantly higher frequency. This would result in acquisition of multiple data points containing the same output value (Fig. 33A 60 DECADE II user manual, ed. 11 and B). Matching the frequencies keeps the peak shape unchanged (Fig. 33C). Decreasing the integrator frequency to less than half the pulse frequency, changes the peak shape (Fig. 33E). When the peak width is too small there are two options: either less data points are collected for such a peak, or the pulse and integrator frequency are both increased. In the latter case the pulse duration is decreased which will change other detection parameters as well. In practise, the pulse frequency almost never interferes with the HPLC analysis. Working electrode material Gold and platinum are used as working electrodes for PAD. Glassy carbon appears to be unsuitable due to the high electric capacitance of this material. Furthermore, resurfacing of the noble metal working electrode is based upon formation and removal of a (metal-) oxide layer. This is impossible with glassy carbon. The change in cell current during the pulse mode is illustrated in Fig. 34. When the potential is changed, a large charging current is detected (Fig. 34, peak 1, 3 and 5), followed by a stabilisation of the current (Fig. 34, part 2, 4 and 6). The output signal is sampled during a fraction of part 2, depending on the pulse settings. The response of the glassy carbon material is considerably different from the noble metals. The capacitance of the electrode material is very high, such that the charging current is not stabilised before start of the next potential step. This pattern makes detection impossible. Examples of carbohydrate analyses are given in Fig. 30. Typical PAD pulse settings are given in Table VII and Table VIII, these settings may be used as starting point for further optimisation. Carbohydrates are oxidised at a pH of 12 or higher, which puts specific demands on the HPLC system used (see above). Table VII. Potential settings for PAD of carbohydrates at a gold working electrode. t (ms) E (mV) s 1 2 3 100 400 +150 200 +750 200 -800 Table VIII. Potential settings for PAD of glycols, alcohols, aldehydes at a platinum working electrode. t (ms) E (mV) s 1 2 3 20 300 +200 100 +1300 100 -100 CHAPTER 7 Pulsed amperometric detection 61 Fig. 34. Change in cell current during PAD. The cell current of the noble metals gold (Au) and platinum (Pt) is stabilised faster than the cell current of glassy carbon (GC), due to a much lower capacitance of the noble metals. For Pt and GC the negative peaks run far off-scale, however the profile is similar to the mirror image of the positive peaks. 62 DECADE II user manual, ed. 11 Table IX. LC-EC conditions for PAD of carbohydrates. detector flow rate mobile phase sample temperature flow cell REF I-cell DECADE II 1.0 ml/min 200 mM NaOH disaccharides 100 nmol/l, 20 l injection 30 oC VT-03 flow cell with 3.0 mm gold working electrode mounted with 50 µm spacer Hy-REF ca. 435 nA References 1. D.C. Johnson, D. Dobberpuhl, R. Roberts and P. Vandeberg, Review. Pulsed amperometric detection of carbohydrates, amines and sulphur species in ion chromatography - the current state of research, J. Chromatogr. 640 (1993) 79-96 2. D.C. Johnson en W.R. LaCourse, LC with pulsed ECD at gold and platinum electrodes, Anal. Chem., 62 (1990) 589A-597A 3. W.R. LaCourse en D.C. Johnson, Optimization of waveforms for pulsed amperometric detection of carbohydrates following separation by LC, Carbohydrate Research, 215 (1991) 159-178 4. W.R. LaCourse en D.C. Johnson, Optimization of waveforms for pulsed amperometric detection of carbohydrates based on pulsed voltammetry, Anal. Chem. 65 (1993) 50-55 CHAPTER 8 Optimisation of working potential C H A P T E R 63 8 Optimisation of working potential Introduction A current - voltage (I/E) relationship, or voltammogram, characterises an analyte. It gives information on the optimum working potential, which can be used to improve detection sensitivity and selectivity. There are several ways to obtain a voltammogram. A hydrodynamic voltammogram is obtained in the DC mode by running several chromatograms at different working potentials. Both peak height and background current are plotted against the working potential. A scanning voltammogram is obtained in the so-called scan mode of the DECADE II: the voltage runs between two pre-set values and the current is measured. Optimisation of the working potential and the construction of a voltammogram is described. Electrochemical reactions In electrochemical detection (ECD) a reaction of the analyte at an electrode surface is monitored. This distinguishes ECD from most other detection techniques where detection is based on the physical properties of an analyte (i.e. mass spectrometry: molecular mass, absorbance detection: molar absorptivity). For electrochemically active compounds, the potential between reference electrode (REF) and working electrode (WE) determines the reactivity of the analyte at the WE. The potential difference supplies the energy level needed to initiate or enhance the electrochemical reaction. Different analytes may have different oxidation or reduction potentials, which determines the selectivity of ECD. Fig. 35. Oxidation/reduction reaction of norepinephrine. An example of an electrochemical reaction is shown in Fig. 35, norepinephrine is converted into a quinone by oxidation at the WE. Two electrons are transferred at the WE resulting in an electrical current that is amplified by the controller. 64 DECADE II user manual, ed. 11 Hydrodynamic and scanning voltammogram A hydrodynamic voltammogram is constructed when the pure analyte is not available and separation over an analytical column is required. Furthermore, under real chromatographic conditions reliable information about the S/N ratio is obtained In case of metal working electrodes it is also advisable to use a hydrodynamic voltammogram. On the metal working electrode an oxide layer is formed which affects the electrochemical reaction and makes the interpretation of a scanning voltammogram difficult. Fig. 36. Hydrodynamic voltammogram of norepinephrine (A) at a glassy carbon working electrode, and the current of the baseline (B). At E1 the electrochemical signal becomes diffusion limited. An alternative for the chromatographic construction of an I/E relationship is the application of scanning voltammetry. The working potential runs between two pre-set values and the current is measured while the analyte is continuously flushed through the flow cell. As peak heights are used, the signal in Fig. 36, line A is only due to the analyte. The signal in Fig. 37, line A is the sum of the analyte signal and the background signal. Subtracting both lines in Fig. 37 results in a similar I/E relationship as in Fig. 36, line A. It takes only a few minutes to construct a scanning voltammogram. This is an advantage, especially when a number of analytes have to be characterised. However, as the scan is obtained in flow injection analysis (FIA, without analytical column), it is a prerequisite to have the pure analyte dissolved in buffer. Any contamination may lead to artifacts. A blank scan of the buffer should be used to distinguish between solvent peaks and analyte peaks. CHAPTER 8 Optimisation of working potential 65 As can be seen in both Fig. 36 and Fig. 37, when the working potential is increased the electrochemical reaction is enhanced hence the signal increases. At a certain potential the I/E curve flattens. All analyte molecules that reach the working electrode are converted at such a high rate that the analyte supply becomes the limiting factor. At the working electrode surface a stagnant double layer exists, where molecular transport takes place by diffusion only. Therefore, the current at (and beyond) this potential is called the diffusion limited current. Fig. 37. Scanning voltammetry of 1.0 mol/l norepinephrine (A) at a glassy carbon working electrode, at a scan speed of 10 mV/s. Scan (B) is the blank solvent. With respect to sensitivity, a high working potential is important. However, at higher working potentials, more analytes are detectable. So, as to selectivity, a low working potential will be favourable. Working at a potential on the slope of the I/E curve will result in less reproducibility. Not only a small fluctuation in the applied potential, but any change in the system may result in a large difference in current. In practice the choice of the working potential is a compromise between sensitivity, selectivity and reproducibility. In the example of Fig. 36 a working potential (E1) of 0.8 V is chosen. Optimisation using a voltammogram Sometimes, when interfering peaks appear in the chromatogram, it is possible to optimise the method with regard to selectivity. If the interfering compound has a higher oxidation potential, a working potential is chosen that gives the best selectivity, i.e. the largest difference in peak height. In the example of Fig. 38 the selectivity for compound X is improved considerably by decreasing the potential to E2 or E1. Obviously, if compound Y is the 66 DECADE II user manual, ed. 11 compound of interest, optimisation of selectivity in this way is not possible and the chromatography has to be optimised. Electrochemical detection differs from most other LC detection methods in that a reaction takes place in the detection cell. Due to reaction kinetics an increased temperature speeds up the oxidation/reduction reaction. However, this not only holds for the analyte but also for the background current and possible interferences. An elevated temperature will therefore not automatically lead to a better detection. A constant temperature is of paramount importance for a stable baseline and reproducible detection conditions. Fig. 38. Selectivity in LC-EC of compound X and Y is optimised by choosing the working potential with the largest difference in peak height. Electrochemical reactions are pH sensitive (Fig. 39). For norepinephrine the I/E curve is shifted to a lower potential at higher pH. When the working potential is high (E2), and the signal is diffusion limited, an increase in pH will result only in a small increase of the peak height. When the working potential is lower (E1), and the signal is not diffusion limited, the signal will strongly increase at higher pH. In both cases the background current increases at a higher pH. CHAPTER 8 Optimisation of working potential 67 Fig. 39. At a higher pH the I/E curve of norepinephrine is shifted to the left. Reaction kinetics predict that electrochemical detection is mass flow dependent. When the LC flow is stopped in LC-EC, the analyte will be oxidised completely and the signal decreases rapidly. This means that the flow rate not only affects temporal peak width and analysis time but also peak height. Also the background signal is sensitive towards fluctuations in the flow rate. Therefore, it is important to use a pulse-free solvent delivery system. Fig. 40. Construction of a hydrodynamic voltammogram for norepinephrine. Chromatograms are obtained at cell potentials ranging from 1.0 V (back) to 0.4 V (front), with 100 mV steps. 68 DECADE II user manual, ed. 11 Construction of a hydrodynamic voltammogram Before a hydrodynamic voltammogram can be obtained, the chromatographic conditions should be optimised. Then the following steps are taken: 1. A solution of the analyte at a concentration between 1 - 100 mol/l, is prepared in mobile phase. 2. The electrochemical detector is stabilised in the DC mode at a high potential. After stabilisation the background current is read from the display of the detector (I-cell) and the noise is measured. 3. The run is started by injecting the compound. When at the high working potential no signal is obtained, it may be concluded that the compound is not electrochemically active. In such a case derivatisation of the compound may be an option. 4. If a peak is measured, the working potential is decreased by 50 or 100 mV and step 2 to 4 is repeated until the lowest potential setting (Fig. 40). 5. The peak heights and the background currents are plotted against the working potential (Fig. 36). The working potential which gives the best sensitivity is obtained by plotting the signal-to-noise ratio against the working potential. Construction of a scanning voltammogram The scan mode is programmed in the ‘SCAN SETUP’ screen of the DECADE II. Depending on the data acquisition software that is used and the experimental set-up, a full, half or continuous scan cycle can be chosen. E 1 = + 0 . 2 0 V R a n g e = O f f s P R E V 5 0 µ A = + 1 0 % E 2 = + 1 . 2 0 V S P D = 5 0 m V / S C A N s S E T U P C y c = c o n t T e m p = 3 0 ° C C E L L = O F F N E X T Fig. 41. Programming the scan mode in the 'SCAN SETUP' screen. In the example of Fig. 37 and Fig. 42 a ‘half’ scan is used, sweeping the potential from 0.2 V to 1.2 V. A full scan would include the reverse scan, i.e. from 0.2 V to 1.2 V and back to 0.2 V. In the continuous mode the voltage is swept up and down between both potentials. 22 CHAPTER 8 Optimisation of working potential 69 Fig. 42. The scanning voltammograms of 2,4-dimethylphenol (DMP), phenol (P), 2-chlorophenol (2-CP) and 4-nitrophenol (NP). The following procedure is used to obtain the voltammograms in Fig. 37 and Fig. 42: 1. The column is removed from the LC system. The voltammogram is recorded in the flow injection analysis (FIA) mode. 2. The pure compound is dissolved in (preferably) the HPLC buffer at a concentration of ca. 10-100 mol/l. When the analyte is already in solution, it should be diluted in HPLC buffer until the desired concentration. 3. An injection loop of 100 l is installed and the LC flow rate is set at 40 l/min. The analyte plug will than be detected during approximately 2.5 minutes. The flow rate is lowered if more scanning time is needed. 4. An initial run is started in the DC mode at a high potential to estimate the required start and stop time of the scan after sample injection (Fig. 43). In the scan mode, the scan is obtained at the flat top of an analyte plug. The analyte delivery should be constant. Fluctuations result in unreliable results. 70 DECADE II user manual, ed. 11 Fig. 43. Chromatogram of the analyte plug obtained in the DC mode. Scanning takes place on top of the broad peak between 0.5 and 2.5 min after injection in FIA mode. 5. The sampling frequency of the integrator is set at 1 Hz. This is the same frequency as the voltage steps during the scan. If a higher sampling frequency is chosen a typical stepwise pattern may appear. 6. In the ‘SCAN SETUP’ screen an upper and a lower potential is chosen. The cycle is set at half. The range is set at 5 µA. A scan speed of 10 mV/s is selected. 7. The analyte is injected and the scan is started by pressing the ‘START’ in the ‘SCAN STAT’ screen of the DECADE II at the time the analyte plug enters the flow cell (see 4). 8. A background scan is obtained by scanning the HPLC buffer. For reliable results it is recommended to repeat each scan three times. Using scan mode in ALEXYS data system The ALEXYS data system offers a convenient interface to construct a scanning voltammogram. Open the DECADE II device driver and click on ‘Scan Shell’. This opens the actual scan window and half or full scans can be acquired. Continuous scanning is done by recording multiple full scans after each other. CHAPTER 8 Optimisation of working potential 71 72 DECADE II user manual, ed. 11 CHAPTER 9 Specifications DECADE II C H A P T E R 73 9 Specifications DECADE II General specifications Power Operating modes Potential range Output Offset Event marker Auto zero RS232C Injector sensor Oven Diagnostics Service mode Config mode Firmware Environmental Second flow cell 110-240 VAC, 50/60 Hz, 260 VA, autosensing DC, PAD and Scan between +2.00 and - 2.00 V in 10 mV increments or +2.50 and - 2.50 V in 10 mV increments (DECADE II MD: p/n 171.0035MD and 171.0038MD) between +1 and - 1 V or between +10 and -10 V (20 bit D/A converter) between +50% and - 50% of max. output voltage, 5% steps pulse of 10% of max. output triggered by keyboard, rear panel TTL input , or RS232C control Full parametric instrument control, data acquisition at 1, 2, 5 and 10 Hz Starts system clock at injection height 37 cm, from 7°C above ambient to 45°C, accuracy 0.5°C, stability 0.1°C; accommodates column and flow cell(s) LCD screen, keyboard and noise (internal dummy cell) system settings & calibration parameters menu for system customisation and optimisation upgradeable via PC (RS232) operating temperature: 4 – 40 deg C, rel. humidity: 20 to 80% non-condensing Acquisition and control of second flow cell (option) DC mode Ranges Filter (cut off) Noise 10 pA – 200 µA in 1, 2, 5 steps 0.5 – 0.01 Hz in 1, 2, 5 steps better than 2 pA with a dummy cell (load of 300 M and 0.5 F) with filter off, Ec +800mV and temperature of 30 oC. 74 DECADE II user manual, ed. 11 PULSE mode Range Filter (cut off) Pulse times Sample times 10 nA – 200 µA in 1, 2, 5 steps 0.5 – 0.01 Hz in 1, 2, 5 steps t1: 100 - 2000 ms; t2: 0 - 2000 ms; t3: 0 - 2000 ms in 10 ms steps 20 ms - (t1 - 60 ms), with 20 ms increments SCAN mode Range Scan rate Cycle 10 nA - 200 A in 1, 2, 5 steps 1 - 50 mV/s in 1, 2, 5 steps half, full or continuous Events DC mode (5 files) and pulse mode (4 files), end cycle time, number of cycles and oven temperature. Time-based control of 50 time points as to range, filter, output contacts (2 TTL, 2 relays), auto zero, offset, valve position (if present), and E-cell. Rear panel I/O connections Mains, Output, 2 Connectors 15 pins (A, B), manual valve (C), RS232C connector Physical specifications Dimensions Weight 44 (D) x 22 (W) x 44 (H) cm = 17.3” (D) x 8.7” (W) x 17.3” (H) 14 kg without flow cell and column Flow cells Confined wall-jet design, working volume determined by spacer thickness and WE diameter Spacers 25, 50 or 120 µm, stackable WE diameters 0.7 - 3 mm (2 mm standard) Cell volume 11 nl minimum WE electrodes Glassy carbon, gold, platinum, silver and copper Reference electrodes salt-bridge Ag/AgCl; in-situ Ag/AgCl (ISAAC); HyREF™ Auxiliary electrode stainless steel Wetted materials PCTFE, FEP, 316-SS, Viton, Silver, Silver chloride and WE Max. pressure 40 psi / 2.8 bar CHAPTER 10 Error messages C H A P T E R 75 1 0 Error messages Table X. Error messages. Error 01 02 03 04 05 06 07 08 09 10 11 12 13 14 15 Message Incompatible boot version Control board error Sensor board x error (x = board number) Firmware program error Record error Incompatible FW version Incompatible FW Control board FW erase failed Sensor board x Upload checksum error. Checksum error. Temperature sensor 1 error. Disconnect flow cell x Control board SRAM error. Sensor board x SRAM error . Please contact your local supplier if one of the above errors occur. Furthermore the following messages can be displayed on the LCD screen during a measurement: Table XI. Messages. Message 01 Out of range 02 PAD overload Advice Output is either above +1.0V or below –1.0V. Pressing AZERO may give an adequate read-out again. If the message remains after pressing AZERO, the autozero function is unable to compensate the background cell current. Advice: use a less sensitive range in the SETUP menu. Charging current in pulse mode out of range. Pressing AZERO may give an adequate read-out again. If not, it is advisable to change the pulse settings (increase t1) or use a less sensitive range. 76 DECADE II user manual, ed. 11 CHAPTER 11 Rear panel C H A P T E R 77 1 1 Rear panel Connectors A, B and C For detailed information on the I/O contacts see page 52. Fig. 44. DECADE II rear panel. RS232C The RS232 interface provides full parametric control from a PC. Programmable parameters comprise cell potential, range, auto zero, offset, filter, electrical injector and control of DECADE II output contacts for control of external equipment. During operation a remote screen is shown and the keyboard is locked. Keeping the PREV button (F1) pressed for 4 seconds disconnects from RS232 control and returns to MAIN. V o u t = + 0 . 0 5 7 V R a n g e = F i l t P R E V 5 0 n A = . 0 0 2 H z I c = + 2 3 . 4 5 n A E c = + 0 . 5 0 V C o m p = o f f 2 5 > 3 0 ° C D C 1 R E M O T E 25 78 DECADE II user manual, ed. 11 The manufacturer will not accept any liability for damage, direct or indirect, caused by connecting this instrument to devices that do not meet the relevant safety standards. CHAPTER 12 Troubleshooting guide C H A P T E R 79 1 2 Troubleshooting guide No detector response Possible cause No power Power switch off Faulty fuse Divergent mains voltage Cell disconnected, or switched off Output disconnected Fouled WE Remedy Check line voltage setting, plug in power cord Turn this switch ON (at the rear panel) Replace fuse Check line voltage, see page 13 Check connection Check connection Clean WE High cell current Possible cause Contaminated buffer High WE potential Salt bridge in REF not saturated Retained peaks from previous runs Column is ‘bleeding’ High amount of Fe++ in buffer Remedy Replace buffer, do not recycle the buffer Optimise potential, if possible: use smaller WE diameter Refill with wetted KCl crystals Wait for elution of these (very) broad peaks Replace column Add EDTA to buffer, rinse metal parts with 15% HNO3 Noisy baseline Possible cause Salt bridge in REF not saturated Air bubble in REF or in cell Slow temperature fluctuations Fouled WE Leaking REF or cell Remedy Refill with saturated KCl, add wetted KCl crystals Remove air bubble, continuously degas the mobile phase Isolate detector cell, set oven temperature Clean WE Tighten connections with care 80 DECADE II user manual, ed. 11 Decreased sensitivity (low S/N ratio) Possible cause Fouled WE by dirty samples Cell potential too low Contaminated buffer (high Icell) Remedy Clean WE, if possible: dilute samples Optimise potential Replace buffer, do not recycle the buffer Base line oscillations Possible cause Malfunctioning pump (regular pattern) Over-tightened cell bolts Air bubbles in cell or REF Temperature oscillations Contaminated buffer (high Icell) Fouled WE Fe++ in buffer Remedy Check pump (seals, valves) Adjust cell bolts, check pump pressure Maintenance REF Set oven temperature Replace buffer, do not recycle the buffer Clean WE Add EDTA, passivate metal parts with HNO3 Saturation of output Possible cause Damaged REF Damaged WE Cell incorrectly connected Cell potential too high Remedy Check with spare REF, replace if necessary Replace cell block Check connections (REF: black, WE: red, AUX: blue) Optimise cell potential CHAPTER 13 Dummy cell C H A P T E R 81 1 3 Dummy cell External dummy cell A successful dummy cell test confirms that the controller, including the cell cable, functions properly. If the result of the noise measurement with the dummy cell is within specs, the controller is excluded in a trouble shooting procedure. The dummy consists of a resistor (R) of 300 M and a capacitor (C) of 0.47 F in parallel. The current is measured over the resistor according to Ohm’s law (V = I x R), hence with a working potential of 800 mV the current drawn will be about 2.67 nA. Slight differences as to this (ideal) value are due to the tolerance of the resistor (± 1%). The capacitor functions as a ‘noise generator’ and in fact resembles the capacitance of a well-functioning VT-03 flow cell in an ideal HPLC set-up. The noise generated via the dummy should be less than 2 pA if the filter of the controller is set to off, provided that the dummy is within the fully closed Faraday shield at the same position as the flow cell (see Table XII for settings). With a 1 second risetime the noise should be better than 1 pA. Table XII. Dummy cell test settings. Parameter Cell potential Cell current Oven Filter Range Setting 800 mV 2.67+/- 0.05 nA (read-out) 30 °C, stable off (or as specified) 100 pA/V The results of the dummy test must be comparable with the test sheet supplied with your controller. If not, please consult your supplier. 82 DECADE II user manual, ed. 11 Internal dummy cell From the MAIN screen DIAG can be selected to enter the DIAG screen, followed by selecting NOISE. This activates a timer in the NOISE screen, and after 5 min stabilisation auto zero is activated and the dummy cell test is ready. Noise of the internal dummy cell can be measured at the output. As with the external dummy cell the noise should be better than 2 pA. Detector settings in the NOISE screen are the same as in Table XII, with exception of the oven temperature. Temperature is switched off. P l e a s e s t a b i t l i m e i z i n g w a i t c e l l r e m a i n i n g N O I S E 43 c u r r e n t 0 5 : 0 0 P R E V In the NOISE screen, the cell current is shown and the output voltage. N O I S E V o u t P R E V = + 0 . 0 0 7 V I c = + 2 . 6 6 7 n A 27 CHAPTER 14 Detector accessories C H A P T E R 83 1 4 Detector accessories The electrochemical detector is shipped together with a number of parts. The listing in Table below may not be complete, see check list of delivery for complete listing. Table XIII. Accessories electrochemical detector. Part number 250.0040 250.0107 250.0113 250.0122 250.0130 250.0128 250.0116 250.0118 250.0126 Component External dummy flow cell Column clamp 12 mm Fuse 2.5 AT 250 V RS232 cable External I/O cable Output cable Mains cable (Europe) Mains cable (USA) Cell cable D connector For these and other DECADE II parts or flow cells contact your local supplier. 84 DECADE II user manual, ed. 11 Index Index 85 ADF, 39 Amplitude response, 43 Auto zero, I/O contact, 52 AUX1, I/O contact, 52 AUX2, I/O contact, 52 buttons DECADE II keyboard, 19 capacitance WE, 61 carbohydrates chromatogram, 55 pulse settings, 60 Cell off, I/O contact, 52 Cell on (off), I/O contact, 52 cell on, I/O contact, 52 cleaning of detector, 17 Common, I/O contact, 52, 53 compensation, 36 cut off frequency, 44 DC mode specifications, 73 degassing mobile phase, 15 digital filter, 42 DSP, 43 dual flow cell control, 33 dual flow cell navigation, 35 dummy cell external, 81 internal, 82 dummy cell test, 81 E1, control, 25 E2, control, 25 electrochemical reaction, 63 error messages, 75 EVENTS example, 49 filter, 26, 38, 42 frequency, 39 fuses replacement of, 5, 17 I/E converter, 33 I/E relationship, 63 I/O contacts rear panel, 77 specifications, 52 86 DECADE II user manual, ed. 11 Inject marker, I/O contact, 53 inject marker, trigger, 51 installation DECADE II, 13 integrator connection of trigger, 51 pulse mode frequency, 59 keyboard DECADE II, 19 maintenance cleaning of detector, 17 detector, 17 Mark, I/O contact, 53 maximum compensation, 36 messages, 75 noise, 15, 16, 56, 58, 68, 73, 79 noise filters, 42 offset, 37 output frequency, 59 pulse mode, 59 Overload, I/O contact, 51, 52 passivation with nitric acid, 15 polarity, 38 potential optimisation, 63 pulse mode characteristics, 56 literature references, 62 optimisation, 57 output frequency, 59 potential settings, 57 specifications, 74 working electrode, 60 pulsed amperometric detection, 55 range, 36 Relay 1, I/O contact, 52 Relay 2, I/O contact, 52 Reset, I/O contact, 52 rotor Tefzel, 56 rotor Vespel, 56 RS232C, 77 S/N ratio, 68, 80 safety practices, 5 Index 87 scan mode example, 68 scanning voltammogram, 64 specifications, 74 service, 6 spare parts, 6 specifications DECADE II, 73 Start, I/O contact, 52 Status I, I/O contact, 53 Status L, I/O contact, 53 t1, control, 28 Tefzel rotor, 56 timefile, 49 example, 49 To I, I/O contact, 53 To L, I/O contact, 53 to pos. I (L), I/O contact, 52 troubleshooting, 79 ts, 56 valve installation, 14 Vespel rotor, 56 voltammogram construction, 64, 68 introduction, 63 working electrode material, 60