1
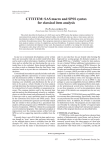
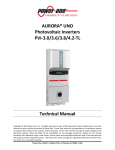
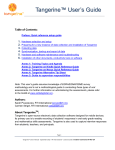
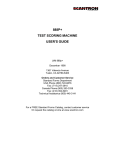
ASSIST
Automated Test Scoring Service
User’s Manual
Prepared by:
Assessment & Testing
Warren Hall, 438
510/885-3661
510/885-4242 FAX
Reprinted May 15, 2002
1
TABLE OF CONTENTS
ASSIST OVERVIEW ....................................................................................................... 3
Instructions For Completing The Answer Sheet .............................................................. 4
Sample Answer Sheet ............................................................................... 5
Instruction For Coding The Answer Key Sheet................................................................ 6
Sample Key Sheet ..................................................................................... 8
Test Score Analysis......................................................................................................... 9
Student Responses .............................................................................................. 9
Score Distribution ................................................................................................. 9
Sample Student Responses .................................................................... 10
Sample Score Distribution........................................................................ 11
Summary Statistics ............................................................................................. 12
Student Score Roster............................................................................... 12
Descriptive Item Analysis ......................................................................... 12
Discriminative Item Analysis .................................................................... 12
Sample Summary Statistics ..................................................................... 14
Sample Descriptive Item Analysis............................................................ 15
Sample Discriminative Item Analysis ....................................................... 16
Authorization for Pick-Up of Test Results...................................................................... 17
2
ASSIST OVERVIEW
ASSIST is a computerized system for scoring multiple-choice examinations with
these specifications:
!
exam may have a maximum of 160 items
!
items may have a maximum of five answer choices
!
exam can be subdivided into a maximum of six subtests
!
raw scores can be weighted and corrected for guessing
ASSIST generates:
!
individual student responses to each question
!
score distribution including raw score, frequency, cumulative
frequency, percentile rank, percent score, and standard score;
summary statistics including mean, median, variance, standard
deviation, etc.
!
alphabetized student score roster that includes number of items
right, wrong, and omitted, percent score, standard score and raw
score
!
descriptive item analysis (optional) that includes the number and
percent of students responding to each answer alternative
!
discriminative item analysis (optional) that includes
high/middle/low group comparison, individual item indices and
statistics, point biserial correlation, and right/wrong group means
Using ASSIST is easy:
!
Complete the authorization form and submit to Assessment &
Testing.
!
Students mark their answers on NCS Trans-Optic 05-7338-23
answer sheets. You may obtain them from your department or
have students purchase them at the Pioneer Bookstore.
!
Before beginning the test, read instructions for completing the
answer sheet. Most students are familiar with these answer
sheets, but please be certain that everyone understands how to
mark them accurately.
!
Prepare a scoring key, indicating the scoring options you prefer.
!
Bring scoring key and answer sheets to Assessment & Testing.
!
Within 24 hours, Assessment & Testing will call indicating that your
test results are ready to pick-up. You must arrange to have your
exams picked up in person (See Page 17). Test results cannot be
returned via fax, phone, e-mail, inter-campus or regular mail.
3
Instructions For Completing The Answer Sheet
Successful and accurate computerized test scoring depends on properly
completed answer sheets. Your students must:
!
Read “Important Directions for Marking Answers” on page 2 of the
answer sheet.
!
Use only a No. 2 pencil.
!
Make marks very dark so that the letter underneath mark cannot be
seen.
!
Erase unintended marks completely.
The following information must be completed on the student’s answer sheet:
Your Last Name, FI, MI
Students must enter their name in blocks at the top of this
section then blacken the circle correspondent to each letter.
Social Security Number Students must enter their social security or student ID
number.
Sex/Class Level
Optional
Instructor/Course/
Section/Date
Students must complete this information (located on upperright corner of answer sheet.
Answers
Students mark their responses to questions 1-100 on page 1
of the answer sheet and questions 101-160 on page 2.
See page 5 for a completed sample answer sheet.
4
Sample Answer Sheet
5
Instruction For Coding The Answer Key Sheet
A blank answer sheet is used to make the answer key sheet (use only a No. 2
pencil). The following information must be completed in the sections indicated:
Your Last Name
Boxes 1-4 Write and bubble abbreviated department name.
Boxes 5-14 Write and bubble instructor name.
Social Security
Number
Write and bubble 999999999.
ABC
In boxes A and B, write and bubble the two-digit course section
number (e.g. 01).
Number of
Questions
Write and bubble the number of the last test item to be scored,
even if that does not represent the total number of items. Leave
blank items not to be scored. ASSIST will not score items that have
two or more correct answers.
Code No.
Write and bubble the four-digit course number (e.g. 3003).
Complete the Instructor, Course, Section, and Date blanks located in the upper-right
corner.
Optional features of ASSIST can be marked on the answer key sheet as follows:
Form
For multiple versions of an examination, you may assign a form
letter designation of A-J and mark it here. Each version will need a
separate answer key sheet.
Item Analysis
Blank You will receive simple statistics that include a score
distribution, summary statistics, and student score roster.
Formula Score
1
You will receive a basic descriptive item analysis, in addition
to the above statistics.
2
You will receive an extensive discriminative item analysis, in
addition to both of the above statistical options.
Blank Student’s score will equal the number of correct responses.
or 1
2-5
It may sometimes be appropriate to subtract a fraction of the
number wrong from the number right as a correction for
6
guessing. The correction factor depends on the number of
alternative choices for the test items and assumes that all
items have the same number of alternatives. This option is
invoked for the total test score by bubbling the number of
alternative choices per item.
Correction for guessing can be a complicated matter and is difficult to explain to
students. Users unfamiliar with this procedure are urged to consult Assessment
& Testing before using this option.
Weighting
It is possible to “weight” or assign more than one point to the test
items.
Blank
or 1 Assigns 1 point to each item.
2 Assigns 2 points to each item.
3 Assigns 3 points to each item.
4 Assigns 4 points to each item.
Part Scores
On side 2 of the key sheet, you may organize the total test into
subtests and get scores for each one, as well as for the total test.
The subtest items must be contiguous, with the maximum of 99
items in any subtest; up to six subtests may be defined. Mark the
number of items in the first subtest in “Part 1", the number it items
in the second subtest in “Part 2", etc.
Additionally, each subtest may have a distinct scoring formula
and item weight. These options are marked in the grid below the
“Part Score” areas.
Marking Answers In the item response area of side 1, mark the correct answers to
test items 1-100; mark the correct answers to items 101-160 on
Side 2. Items that are not to be scored or that have more than
one correct answer must be left blank.
Upon completing the answer key sheet, place it on top of the student answer sheets.
Please be certain that the key and answer sheets are organized with side 1 facing front
and the notched edges in the lower right corner. Bring key and answer sheet packet to
Assessment & Testing, Warren Hall, 438 for scoring.
See Page 8 for a completed answer key sheet.
7
Sample Key Sheet
8
Test Score Analysis
Student Responses ASSIST provides a listing of the answer key sheet and an
alphabetical listing of each student’s responses, showing the
response used to score each item. This listing is important in
insuring that items were scored correctly since the student
markings on the answer sheet can be compared to the
response record.
This listing begins with the answer key sheet; the first line says Key
Record, followed by the department, instructor, and course
number/section. The second line contains the correct answers
(coded 1=a, 2=b, 3=c, 4=d, 5=e) for items 1-80; the third line lists
correct answers for items 81-160. Items that are not to be scored
are blank.
Following the answer key sheet listing is a record of each student’s
responses. The first line contains the student’s name and social
security number. The second and third lines contain the student’s
responses, as interpreted by the scanner. Items left blank by the
student are blank on the listing; a multiple response is
indicated by an asterisk *.
See Page 10 for a sample of the print-out listing key and student
responses.
Score Distribution
This section presents a frequency distribution and summary
statistics for the total test and for each subtest if part scores have
been requested.
Raw Score
number correct (adjusted by weighting/scoring
formula if used)
Frequency
number of students obtaining that raw score
Cumulative
Frequency
number of students obtaining that raw score or
lower
Percentile Rank
percent correct corresponding to that raw
score
Standard Score
a linear transformation of that raw score to a
distribution with a mean of 50 and a standard
deviation of 10. This scale is useful if you wish
to combine two or more tests that are unequal
in difficulty. Consult Assessment & Testing for
a fuller explanation before using this
procedure.
See Page 11 for a sample of a score distribution print-out.
9
Sample Student Responses
PROGRAM NUMBER 108
BATCH ID: 900 RUN NUMBER: 1
KEY RECORD ENGL JONES
141 1234143324213441
3003
OPTIONS 1:
01
STUDENT
000-00-0008
14111234142*24213341
STUDENT A 000-00-0001
1414123414 324213411
STUDENT B 000-00-0002
1414133414
STUDENT C
000-00-0003
14241234143334223442
STUDENT D 000-00-0004
14141234143324213441
STUDENT E 000-00-0005
13141233143324113442
STUDENT F
- 14341 34243324213331
STUDENT G 000-00-0007
34121231143334213432
10
Sample Score Distribution
11
Summary Statistics The following summary statistics are provided in the section after
the raw score distribution:
Student Score Roster
An alphabetical roster providing the student’s name, social security
number, sex and class level, number of right, wrong, and omitted
answers, percent score, standard score and raw score adjusted for
weighting and scoring formula (if used).
See Page 14 for a sample of the Summary Satistics - Score
Roster.
Descriptive Item Analysis
This item analysis option is only generated if the Item Analysis
area of the key sheet is marked with a 1 (or 2).
For each item, the number “NO.” and percent “%” of students
responding to or omitting each answer alternative are given. The
correct alternative is marked with an asterisk *. Items left blank on
the answer key sheet are marked “Question not graded by the
request of the instructor.”
See Page 15 for a sample of the Descriptive Item Analysis.
Discriminative Item
This item analysis option is only generated if the Item Analysis
area of the key sheet is marked with a 2. This option is useful for
evaluating individual test items in greater detail than is possible
with the descriptive item analysis. Instructors who need an
overview of the use of these statistics may contact Assessment &
Testing.
The discriminative item analysis consists of two categories of
information for each item:
High/Middle/Low Group Comparison
Students are separated into the following three groups:
Upper
Middle
Low
top 27% of the score distribution
middle 46% of the score distribution
bottom 27% of the score distribution
12
Item Statistics/Indices
Index of Difficulty - This is the percentage of the total group that
has responded incorrectly to the item (including omissions).
Index of Discrimination - This is the difference between the percent
of correct responses in the upper group and the percent of correct
responses in the lower group.
Maximum Discrimination - This is the sum of the percent in the
upper and lower groups marking the item correctly. (If this sum is
greater than 100, it is subtracted from 200.) This index indicates
the maximum Index of Discrimination possible for the item, given
the obtained response distribution. This maximum would be
attained if the entire percentage of correct responses came from
the upper group, with none coming from the lower.
Discriminating Efficiency - This is a ratio, calculated by dividing the
Index of Discrimination by the Maximum Discrimination. This ratio
thus obtained indicates how well the item actually did discriminate,
as compared to how well it possibly could have discriminated.
Point Biserial Correlation -This is a correlation between examinees’
performance on the item (right or wrong) and total test score. The
value calculated by the Student T-test for Point Biserial Correlation
can be used to determine if the Point Biserial Correlation obtained
is statistically significant. To make this determination, compare the
value given by the t-test with the value given for N-2 degrees of
freedom in a table of t-distribution values, where N=the number of
examinees.
Right/Wrong Group Means - Examinees are categorized into those
correctly answering the item and those incorrectly answering the
item. The mean total score for the two groups is given.
See Page 16 for a sample of the Discriminative Item Analysis.
13
Sample Summary Statistics
14
Sample Descriptive Item Analysis
15
Sample Discriminative Item Analysis
16
ASSIST
Automated Test Scoring Service
Authorization for Pick-Up of Test Results
If you intend to use ASSIST during the current academic year, you must complete
and forward this form to Assessment & Testing either before or when you bring
your first test for scoring.
To ensure the security of your test and the confidentiality of your students’ scores, your
results should be picked up either by you or an authorized individual listed below. It is
extremely important that this form includes your signature and the signature(s) of all
other authorized individuals, including the department secretary.
I authorize the following individuals to pick-up my test results from Assessment
& Testing:
NAME (Print)
SIGNATURE
POSITION
_____________________ _____________________ _____________________
_____________________ _____________________ _____________________
_____________________ _____________________ _____________________
_____________________ _____________________ _____________________
Instructor Name (Print)
Instructor Signature
Department
This authorization will remain in effect until June 30 of the current academic year. If
you wish to delete an authorized individual from this list, please inform Assessment &
Testing in writing.
Return to:
Assessment & Testing
California State University, Hayward
Warren Hall - Room 438
17