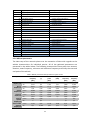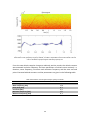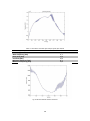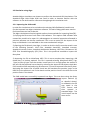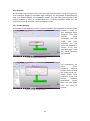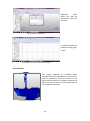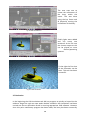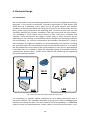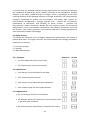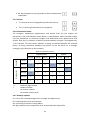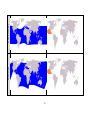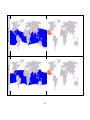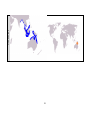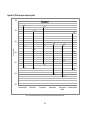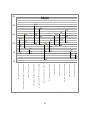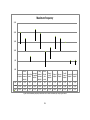
1
EPS - PROJECT TITLE: The Autonomous Acoustic Buoy STUDENTS: Andrea Johnson, Fèlix Hill, Ion Huştiuc, Maciej Ditrych & Samantha van den Berg SUPERVISORS: Michel André, Joan Vicent Castell & Mike van der Schaar DATE: 09/06/2010 TITLE: The Autonomous Acoustic Buoy FAMILY NAME: Ditrych, FIRST NAME: Maciej HOME UNIVERSITY: Technical University of Lodz SPECIALITY: Biotechnology FAMILY NAME: Hill FIRST NAME: Fèlix HOME UNIVERSITY: Technical University of Catalonia (EPSEVG) SPECIALITY: Industrial technical engineer / electronics FAMILY NAME: Huştiuc FIRST NAME: Ion HOME UNIVERSITY: “Gh. Asachi” Technical University of Iasi SPECIALITY: Environmental monitoring systems FAMILY NAME: Johnson FIRST NAME: Andrea HOME UNIVERSITY: Nottingham Trent University SPECIALITY: Computer Aided Product Design FAMILY NAME: van den Berg FIRST NAME: Samantha HOME UNIVERSITY: The Hague University SPECIALITY: Marketing Commercial 2 Abstract The Autonomous Acoustic Buoy (AAB) has been designed and manufactured by Laboratori d’Aplicacions Bioacústiques (LAB) with the assistance of Universitat Politècnica de Catalunya (UPC) over the past two years. This is due to the need to measure and control the correlation between human activity and presence of marine mammals in the marine environment. The buoy is used for recording sound patterns in the underwater environment, specifically referring to the physiological and neurophysiologic processes by which sounds are produced, received and processed [42]. Furthermore the AAB has an important role in monitoring and identifying the communication between marine mammals. This paper presents the further advancements and improvements of the design and functionality of the AAB as well as a concise introduction into the buoy capabilities and a brief overview of the history, purpose and organisation of the LAB. With regards to the improvements made this article gives details of elaborate research undertaken into dolphin whistles analysis and a well structured marketing plan. The mechanical and electrical features concerning the safe operating conditions of the buoy offshore are also presented within this report. Key words: Autonomous, Acoustic data, Buoy, CAD, dolphin whistles, marketing, microcontroller, product introduction, sensors, simulations, watchdog. 3 Content 1. Introduction............................................................................................................................... 9 2. Dolphin whistle Analysis.......................................................................................................... 11 2.1 Introduction....................................................................................................................... 11 2.1.1 The way in which dolphins produce sounds ............................................................... 12 2.1.2 Types of sounds .......................................................................................................... 13 2.1.3 Whistles ...................................................................................................................... 14 2.1.4 Clicks ........................................................................................................................... 15 2.1.5 Burst Pulse Sounds ..................................................................................................... 15 2.2 Dolphin whistle research ................................................................................................... 16 2.2.1 Dolphins taken into consideration.............................................................................. 16 2.2.2 Whistle parameters .................................................................................................... 17 2.2.3 Geographic location research..................................................................................... 20 2.2.4 Sources used in the research section .......................................................................... 20 2.3 Whistle classification ......................................................................................................... 22 2.3.1 Procedure ................................................................................................................... 23 2.3.2 Results ........................................................................................................................ 24 2.3.3 Classification............................................................................................................... 27 2.4 Conclusions........................................................................................................................ 27 3. CAD Simulation ........................................................................................................................ 30 3.0 Aim .................................................................................................................................... 30 3.1 Research ............................................................................................................................ 30 3.1.1 Environment ............................................................................................................... 30 3.1.2 Consequences ............................................................................................................. 30 3.1.3 Simulations ................................................................................................................. 30 3.1.4 Software ..................................................................................................................... 30 3.2 Chosen Solution................................................................................................................. 33 3.2.1 Limitations .................................................................................................................. 33 3.2.2 Solution to Limitations ............................................................................................... 33 3.3 Further Research ............................................................................................................... 34 3.3.1 Formulae .................................................................................................................... 34 4 3.4 Theoretical calculations .................................................................................................... 35 3.4.1 Submerged volume ..................................................................................................... 36 3.5 Simulation using Algor....................................................................................................... 39 3.6 3D simulations ..................................................................................................................... 47 3.7 Evaluation .............................................................................................................................. 48 3.7.1 Further Work .............................................................................................................. 49 4. Electronic Design ..................................................................................................................... 50 4.1 Introduction........................................................................................................................... 50 4.2 Watchdog Functions ......................................................................................................... 51 4.3 Connection between watchdog function, its hardware and its software......................... 51 4.3.1 Physical conditions ..................................................................................................... 51 4.3.2 Levels of danger.......................................................................................................... 52 4.3.3 Software conditions .................................................................................................... 52 4.4.1 Full hardware buoy system overview ......................................................................... 53 4.4.2 Watchdog Schematic.................................................................................................. 54 4.4.2.1 Communication between watchdog and Hercules main board .............................. 54 4.4.2.2 Temperature and humidity sensor .......................................................................... 56 4.4.2.3 Analogical temperature sensors.............................................................................. 56 4.4.2.4 Power....................................................................................................................... 57 4.4.2.5 Power sensing.......................................................................................................... 57 4.4.2.6 Accelerometer ......................................................................................................... 58 4.4.2.7 LAN activity.............................................................................................................. 59 4.4.2.8 Programming Port ................................................................................................... 60 4.4.2.9 Hercules power control ........................................................................................... 60 4.4.2.10 Battery charger ..................................................................................................... 60 4.4.3 Expansion Ports .......................................................................................................... 60 4.4.3.1 Radio transmitter and amplifier .............................................................................. 61 4.4.3.2 Current sensing........................................................................................................ 61 4.4.3.3 Battery Control ........................................................................................................ 62 4.5 System integration ............................................................................................................ 62 4.6 Communication between Watchdog and Hercules main board ....................................... 63 4.7 Software Design ................................................................................................................ 63 4.8 Software Structure ............................................................................................................ 65 5 4.9 “Live signal” ....................................................................................................................... 67 4.10 SHT73 temperature and humidity sensor ....................................................................... 67 4.11 Communication between microcontroller and SHT73 ................................................... 68 4.11.1 Start up Sensor ......................................................................................................... 68 4.11.2 Sending a Command to initiate a transmission ....................................................... 68 4.11.3 Measurement of RH and T ....................................................................................... 68 4.11.4 Humidity compensation ........................................................................................... 69 4.11.5 Temperature compensation of Humidity Signal....................................................... 69 4.11.6 Dew point computation ............................................................................................ 69 4.12 Power sensing ................................................................................................................. 69 4.12.1 Analogical to Digital Conversion .............................................................................. 70 4.13 Behaviour detection of the buoy .................................................................................... 70 4.13.1 SPI communication port ........................................................................................... 71 4.13.2 SPI bus interface ....................................................................................................... 71 4.14 Serial communication...................................................................................................... 72 4.15 Hardware simulation and obtained results..................................................................... 73 4.15.1 Software simulation of the hardware step using Proteus environment .................. 74 4.15.2 Software Errors ........................................................................................................ 76 4.16 Versatility ........................................................................................................................ 77 4.17 Conclusions and further goals ......................................................................................... 77 5. Marketing plan ........................................................................................................................ 79 5.1 Goal and Aim of this project.............................................................................................. 79 5.2 Introduction....................................................................................................................... 79 5.2.1 Noise pollution............................................................................................................ 79 5.3 Internal analysis ................................................................................................................ 80 5.3.1 Organisation ............................................................................................................... 80 5.3.2 Employees of the lab .................................................................................................. 81 5.3.3 Objectives and mission ............................................................................................... 82 5.3.4 Target group............................................................................................................... 82 5.3.5 Marketing mix ............................................................................................................ 82 5.3.6 Financial situation ...................................................................................................... 84 5.4 External analysis ................................................................................................................ 84 5.4.1 Economic .................................................................................................................... 84 6 5.4.3 Political-juridical ......................................................................................................... 88 5.4.4 Customer analysis....................................................................................................... 88 5.5 SWOT-analysis ................................................................................................................... 92 5.5.1 Strengths ........................................................................................................ 92 5.5.2 Weaknesses ................................................................................................................ 92 5.5.3 Opportunities.............................................................................................................. 92 5.5.4 Threats........................................................................................................................ 93 5.6 Confrontation matrix......................................................................................................... 93 5.6.1 Strategic option 1 ....................................................................................................... 93 5.6.2 Strategic option 2 ....................................................................................................... 94 5.6.3 Strategic option 3 ....................................................................................................... 95 5.7 Chosen strategy ................................................................................................................. 95 5.7.1 General letter ............................................................................................................. 96 5.7.2 Letter Maersk ............................................................................................................. 97 5.7.3 Presentation ............................................................................................................... 98 6. Conclusion ............................................................................................................................... 99 7. References ............................................................................................................................. 100 Books and publications: ........................................................................................................ 100 Datasheets and userguides: .................................................................................................. 101 Web pages: ............................................................................................................................ 101 8. Appendix ............................................................................................................................... 104 Appendix 1: Geographic location table ............................................................................. 104 Appendix 2: Whistle parameter comparison graphs ....................................................... 114 Appendix 3: Autodesk Algor Buoy data................................................................................. 125 Appendix 4: MES RIKS Analysis report .................................................................................. 126 Appendix 5: Interrupt control registers ................................................................................ 140 Appendix 6: SPI control registers .......................................................................................... 140 Appendix 7: USART control registers ................................................................................... 140 Appendix 8: A/D control registers ......................................................................................... 141 Appendix 9: List of commands and status register description of the SHT73 ...................... 142 Appendix 10: Conversion coefficients used in humidity and temperature computation formulas ................................................................................................................................ 143 Appendix 11: Accelerometer control registers and timing requirements ........................... 143 Appendix 12: Software block diagram ................................................................................. 146 7 Appendix 13: Detail port description of the full hardware buoy system .................................. 149 Appendix 14: Watchdog Board ................................................................................................ 152 Appendix 15: List of components.............................................................................................. 156 Appendix 16: Schematic ........................................................................................................... 158 Appendix 17: Organization chart.............................................................................................. 159 Appendix 18: Contact information companies ..................................................................... 160 8 1. Introduction Over four and a half months, Universitat Politècnica de Catalunya (UPC) in collaboration with Laboratori d’Aplicacions Bioacústiques (LAB) has organised the third edition of European Project Semester 2010 (EPS). The purpose of this course is to provide a project by the collaborative work of international students. This is carried out in a multicultural environment at the same time bringing students into contact with real tasks performed in professional situations [43]. The company, for which the Autonomous Acoustic Buoy (AAB) project is carried out, is the LAB (see Fig. 1). Established in 1997, the LAB is a multi-disciplinary research group of scientists who are searching for a solution to the increasing acoustic degradation of the marine habitat in the Mediterranean Sea and the North Atlantic. The Laboratory of Applied Bioacoustics was created at the proposal of Michel André with a grant from the Spanish Ministry of Science and Technology and the institutional support from the City of Vilanova i la Geltrú and the Ports Directorate of the Catalan Government. With the cooperation of the UPC and the Centre Tecnològic de Vilanova I La Geltrú (CTVG), the LAB has created the AAB to record sounds in the marine environment without introducing noise pollution from active sources such as sonar [39]. These recordings can then be studied and analysed. As an additional activity, the LAB is also involved in the organisation and teaching of different courses, such as: Master on Marine Technologies and Acoustic Sensing or Cetacean Bio-sonar and Communication. Fig. 1 LAB logo The Autonomous Acoustic Buoy (AAB) is a system used for acoustic monitoring different types of sounds in the underwater environment. It has been designed in the shape of a miniature ship in order that it can easily be transported and used in both offshore and onshore environments. The shape of the buoy is crucial as it is not self propelling and is very heavy, this aerodynamic shape allows it to efficiently be towed to its location by another vessel. In addition the AAB has its own computing platform used to record the desired sounds by selecting them with a programmable high pass filter. This filter has been designed to select whistles after first comparing process of sounds with references and was designed by 2009 EPS students. The AAB gives users the option to both record and listen in real time [3], to natural (e.g. cetaceans) and artificial sounds(e.g. from shipping) at different locations. The main purpose of using the AAB is to study the effects produced by ocean noise on cetaceans. Manmade noise is the result of different anthropogenic activities, such as the following: Marine navigation; Offshore natural resources exploration and extraction; 9 Civil engineering activities; Military activities; Windmill parks; [5,6,7] As well as being an impediment in communication processes between cetaceans and marine environment such as displacement process or food sources, noise can also produce serious injury to marine mammals. Traumas associated with noise pollution can result in an either lethal or sublethal impact. In the case of sublethal impact on the cetaceans hearing aid refers to: Stress; Disorientation; Internal bleeding; [8,9] Recovery time can vary between a few hours and a few weeks depending on the individual and the severity of damage. However, repetitive exposures to sound sources without allowing adequate recovery periods can be fatal [9]. Also in the knowledge and understanding of the acoustic sounds made by marine mammals the LAB can help to avoid whale and ship collisions thus preventing serious injury or death of the mammals concerned. Our project has been broken down into four subsections dictated by the knowledge and enthusiasms of the students within the group. Electronics - Ion Huştiuc & Fèlix Hill The electronic section of the AAB project will design and implement a watchdog that will monitor both the physical and software condition of the Hercules board. This is the core of the Autonomous Acoustic Buoy operating both the power supply module and the watchdog itself. Marketing - Samantha van den Berg The marketing section is responsible for designing a plan to enter the AAB on the global market. Bioacoustic Analysis - Maciej Ditrych The Bioacoustic analysis section will examine and classify different sounds produced by dolphins, these sounds are formally known as whistles. CAD Simulation – Andrea Johnson The Buoy will be simulated in a variety of situations in order to test its behaviour in the marine environment. In conjunction with research and analysis done by both the Laboratory of Bioacoustics Application sand EPS students the AAB can provide the key to a sustainable solution for the protection of cetaceans against human activities in the marine environment. 10 2. Dolphin whistle Analysis 2.1 Introduction Traditionally dolphin’s recognition techniques are based on the photographic identification of various obstacles or other groups of dolphins. As well as these photographic methods they also use sound identification enabling them to recognize objects for example group size or bottom structure. Dolphins are capable of making a wide range of sounds by using their nasal air sacs which are located close to the blowhole. In general dolphins are able to produce three types of sounds: clicks, burstpulsed sounds and finally whistles. Dolphins communicate with each other using whistles and burst-pulsed sounds however the exact nature and extent of this communication ability is not yet known. It is also believed that some dolphin species can identify themselves using a signature whistle. Clicks are used for echolocation and primarily occur in short series called click trains. The rate of clicks increases as the dolphin is approaching an object of interest. Dolphin echolocation clicks are one of the loudest sounds that are produced by marine mammals. In recent years noise pollution has become a serious issue affecting marine mammals. Anthropogenic sounds (man-made noise) can inhibit a cetacean’s ability to navigate, find food, rest and locate others (for protection or mating) among a number of other essential activities. Man-made noise arises from a variety of sources such as oil drilling, sonar testing, explosives and seismic surveys; however the majority of man-made sound in the ocean is produced by shipping. A research group named Laboratori d'Aplicacions Bioacústiques (LAB) with assistance of Universitat Politècnica de Catalunya (UPC) examines the sounds in seas and oceans. They also investigate the effects of manmade noise on cetaceans. During the European Project Semester (EPS) previously recorded whistle patterns will be analysed and classified. It is possible to distinguish one species from another on the basis of its specific whistle characteristics and variables. In order to do this precise research on the already examined whistles will be done using the aid of scientific papers. Once this is completed appropriate software can be utilised to set the parameters and begin the process of classifying whistles. The Autonomous Acoustic Buoy records information on the sound patterns produced by cetaceans. In addition to this the LAB has a database of a wide collection of recordings of the noise produced by marine animals. One such sound that features in this collection is that of whistles; these are a specific type of sound which is produced for the most part by dolphins. In order to further understand the communication processes and behaviours of marine creatures such as dolphins these whistles need to first be analysed and secondly classified to the particular species which produced them. 11 2.1.1 The way in which dolphins produce sounds There are more than forty species of dolphins on our planet. They can be found worldwide in the shallower seas for the most part in close proximity to continental shelves. It is a common belief that Dolphins are one of the most intelligent animals in the world and in addition they have got very friendly appearance. This in turn makes them very popular among humans. Although sounds produced by Dolphins primarily originate underwater they are also able to produce sounds in the air. Dolphins produce sounds in air by releasing air from their blowholes. In this way sound patterns are controlled by dolphins grate muscles, by changing the shape of these they can alter the sound patterns produced. Sounds, which are produced underwater, are generated inside the dolphin’s head underneath the blowhole without air escaping from the blowhole itself. Two hypotheses can be found about the production of these under water sounds: The first such hypothesis and the most popular is called the nasal sac theory. This hypothesis states that sounds are produced in three pairs of air sacks located under the blowhole. When dolphins breathe in, their blowholes are closed and air returns from the lungs into the channel leading to the blowhole and into one or more of the air sacs. The air is inflated into the sacs, then it is forced out of the air sac and over the nasal plug (which is located just at the opening of each air sac) resulting in sound production. Fig. 2 Air sack location www.dosits.org/images/dosits/dolphin2222.gif The second hypothesis states that, when the sound is produced by some small knobs or fatty tissues beneath the blowhole, the air sacs focus that sounds. This tissue functions similarly to our lips which are able to flap together when air is pushed past them. In this way a pulse is created and is transmitted out into the water. Scientists are not able to confirm either of these hypotheses because no one has ever seen a dolphin’s head whilst it is in the process of producing sounds. Medical 12 equipment is in existence that is capable of carrying out such an examination however it is too difficult to be used with dolphins. Moreover, it can be simply detrimental to their health. Perhaps one day in the near future new technology will become available that will allow such scientific research to be carried out. As for the sound reception, scientists currently believe that specialized fatty tissues in the jaw region serve as the primary route able to pick up sound to the middle and inner ears. This is known as the pan bone theory. Fig. 3 Drawing of general delphinid sound reception cross-section from the left-hand side. Inset: 90° counter-clock wise rotation cross-section of tympano-periotic bone bulla[11] 2.1.2 Types of sounds Dolphins produce many types of sounds, both when they are underwater and above the water surface. The three that are most well-known are whistles, clicks, and burst pulse sounds. The graphical relation between the frequency and the time of those sounds are commonly presented by using spectrograms. Figure 4 below shows the frequency ranges and durations of different underwater sounds. 13 Fig. 4 Example of spectrograms of whistles, clicks or other sounds, which were recorded underwater 2.1.3 Whistles Dolphins produce many different types of whistles. One whistle which dolphins use most There are many types of whistles produced by dolphins, but generally their frequency is in range from 4 kHz to 20 kHz and their duration is not longer than 1,4 s. Whistles are subdivided into 21 categories, based on the contour structure and shape obtained from spectrograms. It is believed that dolphins use whistles mainly for communication with each other [12], more rarely it is thought that whistles are used for the expression of emotions or feelings in the same way as burst pulse sounds. Dolphins produce individual signature whistles, these are unique and therefore enable them to identify individuals. Dolphins have also an excellent ability to mimic and copy the signature whistles of other individuals. Calves are still developing their signature whistles up to six months after being born. Fig. 5 Examples of different types whistle spectrograms( www.sarasotadolphin.org ) Whistles consist of harmonics and steps, which make each whistle different. For analysis of whistles, very important are the following parameters: number o steps, 14 number of harmonics, number of breaks, initial frequency and the final frequency, maximum and the minimum frequency as well as mean frequency. The Fig. 6 shows an example of a whistle with all of the mentioned features presented. Fig. 6 Example of a whistle with all of its features included (based on Emily T. Griffith, 2009) 2.1.4 Clicks Clicks are used exclusively for echolocation; this is dolphin’s significant ability to identify objects by the means of using sound. Dolphins are also able to detect obstacles by creating sound patterns and then receiving them back. In addition dolphins are also able to receive information about an objects structure through the use of echolocation techniques. Clicks are produced in click-trains which are rapid sequences of sounds. The range of frequency of clicks is very high in comparison to whistles, it is from 0,2 kHz even up to 150 kHz [13]. Dolphins use lower frequency clicks only for detection of objects that are further away as low frequency sounds are able to travel further. Lower frequency clicks don’t contain detailed information; this can help to explain why dolphins increase the frequency of click’s as they move closer to an object. 2.1.5 Burst Pulse Sounds Barks, mews, chirps and pops, these are the group of sounds categorised as Burst pulsed sounds. The reason why dolphins use them is not known for sure, but it is believed that they produce such sounds under emotional duress i.e. when they are angry, frustrated, frightened or upset. These sounds are mainly directed towards other dolphins, humans or inanimate objects. 15 2.2 Dolphin whistle research In order to perform the analysis and classification of the recordings provided by LAB, a complete research on dolphin whistles was first carried out. This was completed using scientific reports and publications available online as well as sound parameters (in particular time and frequency characteristics) of different whistles that were extracted and gathered along with the geographic location maps. Because dolphins (even ones of the same species) in different locations produce sounds of various parameters, the research part has been divided into two main categories. These categories are that of whistles produced by Pacific region dolphin and whistles produced by Atlantic region dolphins. The Pacific region section contains whistle information about species from the northern part of Australia to the Eastern Coast of North America in the Pacific Ocean. In contrast the Atlantic region section contains information about dolphins living in the Atlantic together with the Mediterranean Sea. In addition to this research into potential software for the analysis of dolphin whistles was carried out however no appropriate program was found. As a result whistles were further analysed in Matlab software and on this software and its functions was performed. 2.2.1 Dolphins taken into consideration There are not many sources containing information about dolphin whistles. However the Bottlenose dolphin and Common dolphin, especially Short-beaked common dolphin, were the species for which it was the easiest to find information. Due to the difficulties faced in obtaining information only 13 species from a total of 37 were taken into consideration for further research. Table 1 Dolphins included in the research Species taken into reasearch 1 Cephalorhyncus commersonii Commerson's Dolphin 2 Cephalorhyncus eutropia Chilean Dolphin 3 Cephalorhyncus heavisidii Heaviside's Dolphin 4 Cephalorhyncus hectori Hector's Dolphin 5 Delphinus capensis Long-beaked Common Dolphin 6 Delphinus delphis Short-beaked Common Dolphin 7 Delphinus tropicalis Arabian Common Dolphin 8 Feresa attenuata Pygmy Killer Whale 9 Globicephala macrorhyncus Short-finned Pilot Whale 10 Globicephala melas Long-finned Pilot Whale 11 Grampus griseus Risso's Dolphin 12 Lagenodelphis hosei Fraser's Dolphin 13 Lagenorhynchus acutus Atlantic White-sided Dolphin 14 Lagenorhynchus albirostris White-beaked Dolphin 15 Lagenorhynchus Australis Peale's Dolphin 16 16 Lagenorhynchus cruciger Hourglass Dolphin 17 Lagenorhynchus obliquidens Pacific White-sided Dolphin 18 Lagenorhynchus obscurus Dusky Dolphin 19 Lissodelphis borealis Northern Right Whale Dolphin 20 Lissodelphis peronii Southern Right Whale Dolphin 21 Orcaella brevirostris Irrawaddy Dolphin 22 Orcaella heinsohni Australian Snubfin Dolphin 23 Orcinus orca Orca(Killer Whale) 24 Peponocephala Elektra Melon-headed Whale 25 Pseudorca crassidens False Killer Whale 26 Sotalia fluviatilis Tucuxi 27 Sousa chinensis Pacific Humpback Dolphin 28 Sousa plumbea Indian Humpback Dolphin 29 Sousa teuszii Atlantic Humpback Dolphin 30 Stenella attenuata Pantropical Spotted Dolphin 31 Stenella clymene Clymene Dolphin 32 Stenella coeruleoalba Striped Dolphin 33 Stenella frontalis Atlantic Spotted Dolphin 34 Stenella longirostris Spinner Dolphin 35 Steno bredanensis Rough-toothed Dolphin 36 Tursiops aduncus Indian Ocean Bottlenose Dolphin 37 Tursiops truncatus Common Bottlenose Dolphin 2.2.2 Whistle parameters The Next step of the research phase was the extraction of data with regards to the whistle characteristics for individual species. All of the gathered parameters are presented in the tables below. The following characteristics were taken into account: duration, mean frequency, minimum and maximum frequency and finally the start and end point of the whistle. Specie name Bottlenose dolphin [14] Risso's dolphin[14] Striped dolphin[14] Common dolpin[14] Atlantic spotted dolphin[15] Short-beaked common dolphin[13] mean SD mean SD mean SD mean SD mean SD mean SD Table 2 Whistle parameter table for Atlantic region section mean duration start end point min frequency [s] point [kHz] frequency [kHz] [kHz] [kHz] 9,485 0,71 8,886 8,612 6,421 2,337 0,4 3,157 3,47 1,684 10,877 0,65 11,75 11,877 8,287 2,35 0,36 3,929 3,522 2,027 10,906 0,73 9,994 11,819 7,868 2,116 0,35 4,039 3,797 1,843 10,475 0,47 10,912 11,919 8,527 1,827 0,29 3,526 2,9 1,942 10,9 0,44 7,1 2 0,3 1,5 11,91 2,17 0,62 0,349 11,96 3,41 17 12,08 3,21 9,61 2,19 max frequency [kHz] 12,719 3,949 14,652 3,27 15,163 3,611 13,149 2,696 14,5 2,5 14,53 3,13 Table 3Whistle parameter table for pacific region section Duration Start End point Minimum [s] point [kHz] frequency [kHz] [kHz] Bottlenose dolphin[16] Value 1,4 11,2 9 7,4 SD 0,7 4,6 3,7 2,2 Short-beaked common Value 0,8 9,8 11,4 7,4 dolphin[16] SD 0,4 3,9 3,9 2,3 False killer whale[16] Value 0,4 5,2 5,8 4,7 SD 0,2 2,2 1,5 1,2 Pantropical spotted Value 0,9 9,5 15,3 8,2 dolphin[16] SD 0,4 2,9 5,2 1,7 Long-beaked common Value 0,7 10,1 14,1 7,7 dolphin[16] SD 0,4 3,9 4,5 2,2 Short-finned pilot Value 0,4 4,4 5,5 3,6 whale[16] SD 0,3 3,1 4,3 2,3 Rough-tooth Value 0,6 6,8 8,5 6,3 dolphin[16] SD 0,4 2,9 3,1 2,5 Striped dolphin[16] Value 0,8 10,2 12 8,1 SD 0,3 3,7 2,8 1,6 Spinner dolphin[16] Value 0,6 10,4 12,4 9,1 SD 0,4 3,4 3,6 2,5 Pacific Fraser's Value 0,46 11,9 13,9 11 dolphin[17] SD 0,7 2,9 3,5 2,3 Irrawaddy dolphin[18] Value 0,2 4,5 4,1 3,2 SD 0,02 2,6 2,1 1,2 Value 0,3 4,3 3 3,1 SD 0,01 1,7 1,3 1,4 Specie name Maximum Frequency [kHz] 17,2 3,1 13,6 3,4 6,1 1,5 18,7 3 15,5 4,2 6,1 4,2 9,1 3 14,8 3,5 13,7 3,5 14,9 0,23 4,2 1,1 4,2 1,4 In order to find and extract specific features of whistles produced by a particular specie, it is reasonable to present the above parameters in a graphical way in order to compare them. It is not always easy to extract some characteristic features from obtained data. Moreover, if there will be a sufficient amount of whistle samples that will be taken to analysis, it will be possible to use the following graphs for the classification process. All of the comparison graphs of whistle parameters are included in [Appendix 1]. 18 18,00 16,00 14,00 Frequency [kHz] Start point 15,80 14,00 13,70 13,90 13,80 12,40 12,00 11,90 11,20 10,00 9,80 8,00 6,60 6,00 9,50 7,40 5,90 6,60 5,20 10,10 7,50 6,20 4,40 4,00 3,00 2,00 14,80 9,70 10,20 10,40 6,80 6,50 9,00 7,10 7,00 6,00 4,50 4,30 3,90 2,60 1,90 1,30 Irrwaddy dolphin Irrwaddy dolphin Pacific Fraser's dolphin Spinner dolphin Striped dolphin Rough-tooth dolphin Short-finned pilot whale Long-beaked common dolphin Pantropical spotted dolphin False killer whale Bottlenose dolphin Short-beaked common dolphin 0,00 Fig. 7 Whistle start point values with their SD values considered of Pacific region section Duration 1,20 1,11 1,08 1,01 1,00 0,97 0,76 0,73 0,71 0,74 0,65 0,60 0,62 0,47 0,40 0,44 0,38 0,31 0,29 0,27 0,20 0,18 0,14 Short-beaked dolphin Atlantic spotted dolphin Common dolpin Striped dolphin Risso's dolphin 0,00 Bottlenose dolphin Time [s] 0,80 Fig. 8 Whistle duration values with their SD values considered of Atlantic region section 19 2.2.3 Geographic location research Another useful tool for further analysis was the geographic location table, this contains information about the abundance of a given specie. This research is important as the LAB’s patterns of dolphin whistles are recorded in a variety of oceans and seas. It is also reasonable to compare those locations with the areas from which come whistles that were taken into consideration in the previously presented tables. Because dolphins of the same species, living in two distinct places are producing whistles of different parameters, such comparison was prepared in [appendix 2]. An example of this is presented in the following figures (fig.9. and fig.10) showing the geographic location of Bottlenose dolphins and the research area in which the data was collected by researchers. Fig. 9 Bottlenose dolphin abundance marked in blue color. Fig. 10 Whistles of bottlenose dolphins taken into account were recorded in the tropical Pacific Ocean (marked above in orange) 2.2.4 Sources used in the research section Many sources were used in the research phase, such as: LAB, SeaWatch Foundation, University of Bangor, Groupe de Recherche sur les Cétacés, Scripps Institution of Oceanography, University of California at San Diego and many others. Documents in which the parameters of whistles were found are presented in the tables below. 20 Table 4 Reference table for the Atlantic region section Specie name Bottlenos e dolphin Risso's dolphin Striped dolphin Common dolpin Atlantic spotted dolphin Shortbeaked common dolphin Specie name Bottlenos e dolphin Shortbeaked common dolphin False killer whale Pantropic al spotted dolphin Reference link Author Title Year http://ieeexplore.iee e.org/stamp/stamp.js p?arnumber=047869 82 http://ieeexplore.iee e.org/stamp/stamp.js p?arnumber=047869 83 http://ieeexplore.iee e.org/stamp/stamp.js p?arnumber=047869 84 http://ieeexplore.iee e.org/stamp/stamp.js p?arnumber=047869 85 http://oceanwidescie nce.org/PDF/JASA%2 0Lammers%20et%20 al%20%282003%29.p df http://www.seawatc hfoundation.org.uk/d ocs/Griffiths2009_SB CDwhistle%20repert oire.pdf Alexandre Gannler, Sandra Fuchs, Odlle Gannler, Julle N. Oswald Pelagic Delphinids of the Mediterranean sea have different whistles 2008 Alexandre Gannler, Sandra Fuchs, Odlle Gannler, Julle N. Oswald Pelagic Delphinids of the Mediterranean sea have different whistles 2008 Alexandre Gannler, Sandra Fuchs, Odlle Gannler, Julle N. Oswald Pelagic Delphinids of the Mediterranean sea have different whistles 2008 Alexandre Gannler, Sandra Fuchs, Odlle Gannler, Julle N. Oswald Pelagic Delphinids of the Mediterranean sea have different whistles 2008 Lammers MO Au WWL and Herzing DL. The broadband social acoustic signaling behavior of spinner and spotted dolphins 2002 Emily T. Griffiths The repertoire analysis of the short-beaked common dolphin, Delphinus delphis, from the Celtic Deep and the Eastern Tropical Pacific Ocean 2009 Table 5 Reference table to the Atlantic region section Reference link Author http://swfsc.noaa.go v/uploadedFiles/Divis ions/PRD/Programs/ Coastal_Marine_Ma mmal/Oswald.pdf http://swfsc.noaa.go v/uploadedFiles/Divis ions/PRD/Programs/ Coastal_Marine_Ma mmal/Oswald.pdf http://swfsc.noaa.go v/uploadedFiles/Divis ions/PRD/Programs/ Coastal_Marine_Ma mmal/Oswald.pdf http://swfsc.noaa.go v/uploadedFiles/Divis ions/PRD/Programs/ Coastal_Marine_Ma mmal/Oswald.pdf Title Year Julie N. Oswald, Jay Barlow, Thomas F. Norris Acoustic identification of nine delphinid species in the Eastern Tropical Pacific Ocean 2003 Julie N. Oswald, Jay Barlow, Thomas F. Norris Acoustic identification of nine delphinid species in the Eastern Tropical Pacific Ocean 2003 Julie N. Oswald, Jay Barlow, Thomas F. Norris Acoustic identification of nine delphinid species in the Eastern Tropical Pacific Ocean 2003 Julie N. Oswald, Jay Barlow, Thomas F. Norris Acoustic identification of nine delphinid species in the Eastern Tropical Pacific Ocean 2003 21 Longbeaked common dolphin Shortfinned pilot whale Roughtooth dolphin Striped dolphin Spinner dolphin Pacific Fraser's dolphin Irrwaddy dolphin http://swfsc.noaa.go v/uploadedFiles/Divis ions/PRD/Programs/ Coastal_Marine_Ma mmal/Oswald.pdf http://swfsc.noaa.go v/uploadedFiles/Divis ions/PRD/Programs/ Coastal_Marine_Ma mmal/Oswald.pdf http://swfsc.noaa.go v/uploadedFiles/Divis ions/PRD/Programs/ Coastal_Marine_Ma mmal/Oswald.pdf http://swfsc.noaa.go v/uploadedFiles/Divis ions/PRD/Programs/ Coastal_Marine_Ma mmal/Oswald.pdf http://swfsc.noaa.go v/uploadedFiles/Divis ions/PRD/Programs/ Coastal_Marine_Ma mmal/Oswald.pdf http://swfsc.noaa.go v/uploadedFiles/Divis ions/PRD/Programs/ Coastal_Marine_Ma mmal/Oswald%20et %20al%202007%20Fr asers.vocals_Bioacou st2.pdf http://lib.ioa.ac.cn/Sci enceDB/JASA/jasa20 00/pdfs/vol_108/iss_ 4/1938_1.pdf Julie N. Oswald, Jay Barlow, Thomas F. Norris Acoustic identification of nine delphinid species in the Eastern Tropical Pacific Ocean 2003 Julie N. Oswald, Jay Barlow, Thomas F. Norris Acoustic identification of nine delphinid species in the Eastern Tropical Pacific Ocean 2003 Julie N. Oswald, Jay Barlow, Thomas F. Norris Acoustic identification of nine delphinid species in the Eastern Tropical Pacific Ocean 2003 Julie N. Oswald, Jay Barlow, Thomas F. Norris Acoustic identification of nine delphinid species in the Eastern Tropical Pacific Ocean 2003 Julie N. Oswald, Jay Barlow, Thomas F. Norris Acoustic identification of nine delphinid species in the Eastern Tropical Pacific Ocean 2003 J.N. OSWALD, S. RANKIN AND J. BARLOW First description of whistles of Pacific Fraser's dolphins, Lagenodelphis Hosei 2007 Sofie M. Van Parijs, Guido J. Parra and Peter J. Corkeron Sounds produced by Australian Irrawaddy dolphins Orcaella brevirostris 2000 2.3 Whistle classification The second section of the bioacoustic analysis was the computer analysis of dolphin whistles. At first it was assumed that sounds would be analysed in an already existing software that was available online. Unfortunately, no such program was found and a new code was created in Matlab 7.10.0 (R2010a) for recognition and extraction of whistles. The task of this code was to extract from whistle samples the parameters as presented in the research section, i.e. duration, mean frequency, minimum and maximum frequency, start and the end point. In comparing those parameters with the previously prepared tables, it was possible to classify the whistle to the individual specie which potentially produced it. 22 2.3.1 Procedure Whistles selected for the analysis were chosen from the LAB’s recording collection, this consists of a variety of underwater sound samples from the Ligurian Sea. Not all of the recordings contained whistle patterns; they also contained sonar patterns or other noise most likely caused by shipping. The first step was to choose and extract whistles which had quite a strong signal from LAB’s recordings, in order to carry further analysis out efficiently. For this purpose Adobe Audition software was used, this returned whistle samples in a wav file that could be directly analysed in Matlab. Secondly a spectrogram was created to show the graphical relation between time and frequency of the whistle. This was created using matlab software. The Spectrogram command extracted directly from the wav file variables such as: time, frequency and power spectral density (PSD). The last parameter simply indicates how strong the signal is in a given range of frequency, or time. The spectrogram also shows an image of the wave pattern, in this case whistle pattern, from which all parameters can be more or less accurately read. Next the whistle was extracted from all of the other sounds that were present in the sample. In order to obtain a clear, extracted whistle, frequency was limited from 4 kHz to 20 kHz, which is the frequency range of whistles. In this range the highest local maxima of PSD values in each time domain were extracted corresponding to the frequency of the whistle returning as plot of the frequency in time domain, what was the whistle. The final step was to estimate and fit the whistle contour so as to receive the values of frequency and time to be used for further classification. This classification process was based on the comparison of the received parameters of the extracted whistles and their comparison with the values in the parameter tables[19]. Fig.11. shows a spectrogram of sound sample, the red contour represents the whistle. The more intensive the color is the stronger the value of the (PSD). In this case the whistle signal is very strong and the whistle is not destructed by other sounds. Fig. 11 Whistle spectogram 23 Fig. 12 shows the whistle after extraction. Values of the frequency corresponding to the highest local maximum value of the PSD was extracted and plotted in time segments. Such extracted whistle still have to many brakes and has to be fitted to produce a continuous line representing the whistle contour. Fig. 12 Whistle extraction Finally, the Fig. 13 represents the estimated and fitted contour of extracted whistle. Fig. 13 Whistle estimated contour 2.3.2 Results From a total of ten whistles analysed only two were of adequate quality in order to perform whistle extraction. This is because nearly all samples contained unwanted sounds or simply noise in the frequency range of the whistle. Such noise makes it impossible to carry out the extraction of the whistle and as a result the extracted pattern is that of the noise (Fig.14). Another fact that influences the analysis could be the strength whistle signal which in itself was relatively low. 24 Fig. 14 Figure at the top is an example of a sample, which cannot be analysed. Because of too many sound waves in the frequency range of a whistle, it makes it impossible to extract the whistle. The red color in the bottom of spectrogram indicates frequency ran From the two whistle samples that gave relatively positive results the whistle contour was extracted and also frequency and time parameters of whistle were received, i.e. duration, mean frequency, minimum and maximum frequency and the start and end point. Extracted whistle contours and the parameters are given in the following table. Table 6 Parameters received after analysis of the first whistle parameter value 1,0 11,9 8,4 9,0 14,7 8,4 Duration [s] Mean frequency [kHz] Start point [kHz] End Point [kHz] Minimum frequency [kHz] Maximum frequency [kHz] 25 Fig. 15 First extracted whistle contour Table 7. Parameters received after analysis of the first whistle parameter Duration [s] Mean frequency [kHz] Start point [kHz] End Point [kHz] Minimum frequency [kHz] Maximum frequency [kHz] value 0,6 9,2 10,9 10,4 8,2 10,9 Fig. 16 Second whistle contour extracted 26 2.3.3 Classification Analysed samples were recorded on the Ligurian Sea, this falls into the Atlantic region section of the research part. Using the table and the graphs previously prepared two of the extracted whistles were classified. The first whistle was classified to a possible three species i.e.: Striped dolphin, Risso’s dolphin and the short-beaked common dolphin. All of the parameters fit within the specified ranges presented in the graphs, which suggests that this whistle was produced by one of those three species. 2.4 Conclusions Dolphins produce sounds mainly for communication between individuals as well as for echolocation, amazing ability to detect objects underwater. Besides they also use sounds to express their emotions i.e. when they are stressed, frightened, angry. By analyzing those sounds we can learn not only about their behaviours, but also how man-made sounds are affecting their life. All of those sounds vary in ranges of frequency and the way, that are produced. Whistles mainly have frequency ranges from 4 kHz to 20 kHz and their duration is close to 1 s, whereas clicks are sounds of much high frequency, sometimes reaching values greater than 100 kHz and they consists of sequences, called click trains. Burst sound pulses are the sounds generally regarded as cries, barks, grunts and they are audible for humans. It is quite easy to distinguish those sounds from each other; however it is difficult when a given sound has to be classified to potential specie that could produce it. In the research section of the bioacoustic part of the project, all the necessary information was efficiently collected, in order to carry out further classification in an effective way. From a total of thirty seven species, thirteen species were taken into consideration and included in the analysis. The research section was divided into two categories (Pacific and Atlantic region), this was necessary because dolphins of the same specie living in different, distinct areas produce different whistles. Six of the the most important parameters were extracted and gathered in the relevant parameter tables. These parameters are: duration, mean frequency, minimum and maximum frequency, start and end point. Another useful tool for further classification was the geographic location tables containing information about the areas of abundance of given specie. All six species included in the Atlantic region section seem to produce very similar whistles. However, in comparison with other species, bottlenose dolphins have got the longest duration values and the lowest values of frequencies, i.e. mean frequency, minimum frequency, start and end point. Mean value of the maximum frequency is also very low, but its standard deviation is relatively high, this makes the range of the 27 maximum frequency quite wide. Also Atlantic spotted dolphins and Common dolphins tend to have the shortest values of duration, but as for frequency parameters, they are all comparable with the ranges of other species. As for the whistles produced by eleven dolphin species included in the Pacific region section, many more characteristics can be found. Irrwaddy dolphins tend to have very short values of duration and their standard deviation values are extremely small. This states that Irrwaddy dolphins’ whistles have got a fixed duration of 0,2 s for first whistle type and 0,3 s for the second. These whistles also have got very low frequencies which makes them easy to differentiate from other species. Another characteristic of such dolphins is their abundance, they live only in limited areas close to the northern part of Australia. Another dolphins, which whistles seem to be unique, are Short-finned dolphins, which behavior is more similar to whales rather than dolphins [20]. The frequencies of their whistles appear to be very low and the time of duration is also relatively low. Also whistles produced by Bottlenose dolphins have got some unique characteristics, i.e. the longest duration time. Whistle parameters of false killer whales have got very small standard deviation values, resulting in small ranges of their frequencies as well as ranges of duration. Pantropical spotted dolphins’ whistles have the highest values of the end point and maximum frequencies. Another specie with identifiable whistle characteristics is the Pacific Fraser’s, their whistles have got the highest value of minimum frequency and a very small range of maximum frequency. In conclusion, in the Atlantic region, characteristic whistles are those produced by Bottlenose dolphins. Also Common dolphins and Atlantic spotted dolphins produce quite characteristic whistles, but they are not as unique as those of Bottlenose dolphins. In Pacific region, characteristic whistles are produced by: False killer whales, Irrwaddy dolphins, Bottlenose dolphins, Shot-finned dolphins, Pantropical spotted dolphins and Pacific Fraser’s dolphins. Unfortunately, not all dolphins produce unique whistles what makes the classification process relatively hard to perform. Very often one sample of whistle is not enough to classify whistle to a specie, because the parameters extracted can be imprecise. This is why a larger amount of whistles should be analysed and then taken for further process of classification. The results of whistle computer analysis shows that it is not possible to extract whistles from all samples. From a total of ten samples it was possible to extract only two whistles, what states only 20% of samples analysed. The efficiency of the process is so low, because many whistle samples contained a lot of noise in the frequency range of the whistle. In such cases it was impossible to extract whistles from those samples, as the only pattern extracted was that of the present noise. Moreover some whistles contained many brakes what also resulted in some problems in their extraction, especially with the estimation of the whistle contour shape and structure. 28 Also the strength of the whistle signal influence its analysis. The lower the signal was, the harder the extraction was. In conclusion, for efficient analysis and classification whistle samples have to be strong, clear and they cannot contain any noise in the frequency range of the whistle. The best way is to record whistles in some areas of limited noise level, what is quite hard, because of the appearance of many man-made sounds like shipping. 29 3. CAD Simulation 3.0 Aim The aim of the CAD simulation task is to further advance the current state of the simulation project. The buoy has been drawn in CAD (Solidworks) by the 2009 EPS team however to date no simulations have been performed. The buoy will be simulated using CAD software in order to assess its behaviour within the marine environment. 3.1 Research 3.1.1 Environment The ocean environment is one of varied conditions. The buoy must be able to withstand any of these which do not fall outside ‘the norm’. This includes wind speeds, sea currents, waves and of course normal weather elements such as Sun and Rain[71,75]. The buoy’s stability should be adequate to survive full ocean storms even when the buoy will be used primarily in the near –coastal marine environment as this will increase its usability. 3.1.2 Consequences Short circuits, leakage currents and high voltage flash-over will occur if water comes into contact with the electric circuit in the buoy. This will cause the buoy to fail. The buoy may suffer permanent damage or at the very least be unable to record sound for a period of time. Therefore it is important to ensure that not only the hub is fully insulated giving the components protection from wave splashes but also that the buoy will not become overturned or submerged. 3.1.3 Simulations In order to progress with the project it is important to establish exactly what will need to be simulated and what information/facilities are required to do this. - Waterline – Exact size and mass must first be calculated Stability – in terms of theoretical formulae – requires accurate weight of components – effect of different masses on this. Angle of vanishing – Point at which the buoy can tip and still right itself – effect of mass / weight distribution. Aerodynamics – This will affect tow speed. Structural stability. Testing the buoy under stresses and strains. 3.1.4 Software Before starting the simulation an appropriate software package has to be found. Software packages will be evaluated on the basis of features, user friendliness and finally availability. 30 Table 7 Software packages evaluation Name of Software Solid works Key features • • • • • • • • • Evaluation Available Complex Geometry and Freeform Surface Creation Feature Recognition Reverse Engineering Motion Analysis Structural Validation Environmental Impact Evaluation Design for Manufacturability Fluid Flow Simulation Photorealistic Rendering.[63] Exact properties and dimensions can be defined but school does not have plug-in to do simulations. However plug-in in itself is limited as it does not have all of the required simulation capabilities to simulate the AAB. Ansys • • • Analysis of materials. Interactive GUI Integrated response of fluids, structures and materials.[64] School only has simple version which does not contain enough functionalities to carry out buoy simulation. NX • Linear and nonlinear stress, vibration, motion, dynamic response, durability, flow and thermal analysis Integrated multi-physics solvers Model preparation with multi-CAD support PLM integration with advanced simulation structure management [65] Open application and system support Developed by Siemens corp school has this software available. However it has limited functions which could prove troublesome in later more advanced simulation. Fluid dynamics are also not included. Schools version is also in Spanish which presents me with an added difficulty. CAD support. Modeling and meshing Static stress and linear dynamics Mechanical event Has more functions than other available software (including Fluid dynamics) & can be downloaded legally at no extra cost. • • • • Autodesk ® Algor® • • • • 31 • • Ansys Profession al or student with Ansys LsDyna or Ansys Autodyn • Adina • • • • • • • • Catia V5 • • • • • • • • • simulation Computational fluid dynamics (CFD) simulation Multiphysics [66] Integrated response of fluids, structures and materials. Multiple solvers, including those for structural analysis and fluid flow. Analysis of materials. Interactive GUI Simulation integration Extensive material model library[67] Stress analysis of solids (2D and 3D) Analysis of structures in statics and dynamics. Linear or nonlinear analysis including the effects of material nonlinearities, large deformations and contact conditions.[68] Linear stress analysis on parts and hybrid assemblies (solid, surface, and wireframe) Transient and harmonic dynamic analysis Contact analysis Buckling analysis Thermo-mechanical analysis Modal analysis Vehicle assembly analysis Assembly of multiple analysis models.[69] 32 Capable of performing fluid dynamic (wave) simulations. These are the preferred options but are very expensive. From watching videos on YouTube it is possible to conclude that Simulations are more complex and time consuming to perform in Adina than in Ansys. Adina is available as freeware on the internet however a version of this software was downloaded onto my laptop but failed to install correctly. Catia is very advanced and therefore expensive software. It is primarily used in the automotive industries. 3.2 Chosen Solution “Autodesk® Algor® Simulation software, part of the Autodesk® solution for Digital Prototyping, provides a range of mechanical simulation tools to help designers and engineers make decisions earlier in the design process. Support for multi-CAD environments and extensive finite element modeling tools help manufacturers study initial design intent and accurately predict product performance. Autodesk Algor Simulation allows you to validate and optimize designs before manufacturing—increasing efficiency, minimizing reliance on physical prototypes, reducing costs, and decreasing errors.” [72] CAD support—Direct, associative data exchange with most CAD software. (Including Solidworks) Modelling and meshing—Create finite element models and meshes using tools and wizards designed to improve productivity and simulation accuracy. Static stress and linear dynamics—Study structural response of designs. Mechanical event simulation—Enhance design decisions by using multi-body dynamics with support for large-scale motion, large deformation, and large strain with body-to-body contact. Computational fluid dynamics (CFD) simulation—Study thermal characteristics of designs and perform accurate, detailed fluid flow analysis. Metaphysics—Study multiple physical factors acting simultaneously by combining results from different analysis types. 3.2.1 Limitations Finding appropriate software has been extremely time consuming & a compromise has had to be made due to the timescale of the project. The chosen software is limited as it is not able to perform all of the required simulations as detailed in the simulation section. 3.2.2 Solution to Limitations Due to a lack of available software in the school S/W is not available to me that has all of the required functions to complete the simulation task. We have therefore broken down the task into several subtasks in order to find ways of carrying out each part of the task. 33 Table 8 Work process Factors to be tested Waterline – Exact size and mass must first be calculated Stability – in terms of theoretical formulae – requires accurate weight of components – effect of mass on this Angle of vanishing – Point at which the buoy can tip and still right itself – effect of mass / weight distribution Buoyancy - Buoyancy concerns the Archimedes Principle, in other words Will it Float? The buoyancy force is the upward vertical force felt by a submerged, or partially submerged body. It is equal to the weight of the fluid displaced by the submerged portion of the body. A body will sink until the buoyancy force is equal to the weight of the body. [73] Aerodynamics – This will affect tow speed Test method Tested using formulae Tested using formulae Tested using formulae. Tested using formulae. Tested using CAD software Autodesk Algor Simulation Professional 2011 Structural stability. Testing the buoy under stresses and strains. Tested using CAD software Autodesk Algor Simulation Professional 2011 3.3 Further Research 3.3.1 Formulae As the buoy closely resembles a boat in shape the following formulae’s (usually used in boat design) will be used in order to calculate the behavioural properties of the buoy. Table 9 Formulas used in calculation process Factor Waterline – Exact size and mass must first be calculated Formulae submerged volume == total displacement / density of water Stability – in terms of theoretical density of water == 62.5 lb/ft^3 fresh or 64 lb/ft^3 salt[73] Capsize Screening Formula = Beam / 34 formulae – requires accurate weight of components – this will be effected by buoy weight (Displacement / 64)1/3 (Displacement is in Pounds Beam is measured in Feet)[76] Angle of vanishing – Point at which the buoy can tip and still right itself. Screening Stability Value ( SSV ) = ( Beam 2 ) / ( BR * HD * DV 1/3 ) BR: Ballast Ratio ( Keel Weight / Total Weight ) HD: Hull Draft DV: The Displacement Volume in cubic meters. DV is entered as pounds of displacement on the webpage and converted to cubic meters by the formula: Displacement Volume in Cubic Meters = ( Weight in Pounds / 64 )*0.0283168 Buoyancy - Will it Float? Angle of Vanishing Stability approximately equals 110 + ( 400 / (SSV-10) )[77] Assuming full submersion Force of Buoyancy (FB) = Vol x gW [78] 3.4 Theoretical calculations Formulas that are commonly used in boat design are typically expressed in imperial format. In order to use these formulas accurately but also produce relevant and analysable results I will be converting metric data from the buoy into imperial to carry out the calculations before converting it back to analysable metric data. Data calculated by Autodesk Algor Software [appendix 3] and from technical drawings produced in Solidworks will be used to carry out the theoretical calculations (formulae as detailed in the research section). 35 Fig. 17 Autodesk Algor datasheet production 3.4.1 Submerged volume Submerged volume = total displacement / density of water density of water == 62.5 lb/ft^3 fresh or 64 lb/ft^3 salt 1pound = 4.44822162825N So 1519.6 Newton’s = 341.61966893638277 Pounds 341.61966893638277/64 = 5.34ft3 3.4.2 Capsize Screening Formula Capsize Screening Formula = Beam / (Displacement / 64)1/3 (Displacement is in Pounds, Beam is measured in Feet) The weight of the boat used in the calculations is taken from data produced from the autodesk algor software. This is without any extra weight used to enhance the stability of the buoy. 1200mm = 3.937007874012 ft 1519.6 Newton’s = 341.61966893638277 Pounds = 3.937007874012/(341.61966893638277/64) 1/3 = (3.937007874012/5.337807327) 1/3 = 0.7375702481/3 = 2.25 A value >2 means that the buoy may not be stable, therefore the result shown above may means that the boat may be vulnerable to capsizing. As changing the shape of the buoy is not an option, changing the weight of the buoy will now investigated in order 36 to establish how the stability of the vessel is affected by this. It is also not an option to make the buoy lighter as the structure has already been manufactured. Table 10 Effect of weight on buoy stability Weight (N) Mass (Pounds) Capsize screening 1519.6 341.6196689 2.212710744 1779.289 400 1.88976378 2001.7 450 1.679790026 2224.111 500 1.511811024 2446.522 550 1.374373658 2668.933 600 1.25984252 2891.344 650 1.162931557 3113.755 700 1.079865017 3336.166 750 1.007874016 3558.577 800 0.94488189 3780.988 850 0.889300602 4003.399 900 0.839895013 4225.811 950 0.795690012 4448.222 1000 0.755905512 Capsize screening Value 2,5 2 1,5 Capsize screening 1 0,5 Mass (N) 0 0 1000 2000 3000 4000 5000 Fig. 18 Effect of weight on buoy stability As the graph shows the more weight is placed within the buoy the more stable it will become. 3.4.3 The Angle of Vanishing Screening Stability Value ( SSV ) = ( Beam 2 ) / ( BR * HD * DV 1/3 ) BR: Ballast Ratio (Keel Weight / Total Weight ) HD: Hull Draft 37 DV: The Displacement Volume in cubic meters. Displacement Volume in Cubic Meters = (Weight in Pounds / 64 )*0.0283168) Angle of Vanishing Stability approximately equals 110 + ( 400 / (SSV-10) ) Screening stability volume =(3.9370078740122)/((25.23255569980232/341.61966893638277)*2*(341.619668936382/64 )*0.02831681/3) =15.500031/(0.073861543*2*1.626963673) =64.4920733 (SSV) Angle of vanishing stability =110 + (400/(64.49-10)) =117.3407965 This calculation will now be carried out for a range of different buoy weights. This will enable the effect of weight on the angle of vanishing stability to be analysed. Table 11 Effect of weight on angle of vanishing stability Weight Weight (N) (Pounds) Beam Sq 1519.6 341.6196 15.49997 1779.288651 400 15.49997 2001.699733 450 15.49997 2224.110814 500 15.49997 2446.521896 550 15.49997 2668.932977 600 15.49997 2891.344058 650 15.49997 3113.75514 700 15.49997 3336.166221 750 15.49997 3558.577303 800 15.49997 3780.988384 850 15.49997 4003.399465 900 15.49997 4225.810547 950 15.49997 4448.221628 1000 15.49997 BR HD DV SSV AVS 0.073862 2 1.626964 64.49182 117.3408 0.063081 2 1.905 64.49182 117.3408 0.056072 2 2.143125 64.49182 117.3408 0.050465 2 2.38125 64.49182 117.3408 0.045877 2 2.619375 64.49182 117.3408 0.042054 2 2.8575 64.49182 117.3408 0.038819 2 3.095625 64.49182 117.3408 0.036047 2 3.33375 64.49182 117.3408 0.033643 2 3.571875 64.49182 117.3408 0.031541 2 3.81 64.49182 117.3408 0.029685 2 4.048125 64.49182 117.3408 0.028036 2 4.28625 64.49182 117.3408 0.026561 2 4.524375 64.49182 117.3408 0.025233 2 4.7625 64.49182 117.3408 As the table shows the screening stability value and therefore angle of vanishing stability is not effected by a change in weight. 3.4.4 Buoyancy Assuming full submersion Force of Buoyancy (FB) = Vol x gW FB = (3.93700787401x2x1.5) x 64 lbs/ft3 FB = 755.9055 lbs = 342.87 kg Weight of Buoy (without component weight) = 341.62lbs = 154.96 kg The Force of Buoyancy is greater than the Weight of the Buoy meaning the Buoy will float. 38 3.5 Simulation using Algor Autodesk Algor simulation was chosen to perform the theoretical CAD simulations. The Autodesk Algor Help Guide 2010 was used in order to become familiar with the software. It was also used for reference throughought this simulation task. 3.5.1 Importing the CAD model In order for simulations to be carried out the existing CAD (Solidworks) model must first be imported into Algor simulation software. The online help guides were used to find instructions on how to do this. The Algor simulation online help guide outlines three methods for importing Data[79]: 1) Copying the file across from other CAD software. This requires CAD software that created the model to be open & is advantageous as material properties allocated in previous software can also be transferred. This is not an option for the import of the buoy as Solidworks is not available on the same workstation as Algor. 2) Opening the file directly into Algor. In order to do this the file must be saved in one of the following formats:- ACIS Files, Autodesk AutoCAD*, Autodesk Inventor, Autodesk Inventor Fusion, Autodesk Mechanical Desktop, IGES Files, Rhinoceros 3D, STEP Files Stereolithography (STL) Files. This is the preferred method to import the Buoy data. 3) Importing the file as Wireframe IGES. This is more complex than importing a 3D model but is a backup method. The file is opened selecting Wireframe IGES (*.igs, *.iges) as files of type. If all the entities in each part lie in a single plane the entities in the part can be imported into a sketch by selecting the Import as 2D objects check box. If the model will be analyzed using 2D elements, it must be imported into the YZ plane. Activating the Import into YZ plane check box will translate the positive X axis in the IGES file to the positive Y axis in the sketch and the positive Y axis in the IGES file to the positive Z axis in the sketch. The CAD model was successfully imported into Algor. This was done using the direct import method (2) as detailed above.) In solidworks the file was saved in the STEP format and then opened in Autodesk Algor. The initial import can be seen across. Fig. 19 Initial Buoy import 39 3.5.2 Creating a Mesh Once the existing model had been imported into Algor the next step was to create a mesh structure. This is what will be used to carry out simulations on the buoy. The initial mesh structure was Fig. 20 Initial Mesh created by first knitting the assembly together and then using the mesh function. The result is shown to the left. 3.5.3 Assigning materials The next step in the analysis is to assign the correct material types to each part of the buoy. It is important that this is done correctly as different materials will behave in different ways when placed under simulation conditions. The material used to manufacture the buoy is polyethylene, (10mm thickness for the body and 6mm for the shell.) Fig. 21 Asigning materials 40 3.5.4 Unsteady fluid Flow Analysis The first Analysis to be run on the buoy is unsteady fluid flow. This will monitor the behaviour of the buoy when it is on the water in the marine environment. The first stage in the analysis was to set the test conditions (analysis parameters) a screenshot of this can be found in fig.22 Fig. 22 Set test conditions Fig. 23.Generate fluid exterior The next step carried out was to generate the fluid exterior in order to simulate the marine environment in which the buoy was to sit. This process is illustrated in Fig. X. However this was unable to be created due to a problem with the model topology. The model was remeshed in order to attempt to correct this problem. Fig. 24 Re-Mesh 1 41 The fluid exterior was still unable to be created due to the complex model topology. Fig. 25Generate fluid exterior attempt 2 After creating a third mesh structure was created in order to troubleshoot the problem of creating the fluid. The same problem was again faced. Fig. 26 Generate fluid exterior attempt 3 Due to the complex shape of the buoy difficulties have been faced in creating a stable analysis. A great deal of time has been spent troubleshooting within the Autodesk Algor software & the same problem is still faced regarding the model topology itself. A further troubleshooting step would be to modify the Solidworks model. However this can only be done to a certain extent as the Buoy model must remain accurate in order to give useful simulation results. This simulation was put on hold in order to minimise wasted time and make efficient progress with the simulation task. 3.5.5 Static stress Analysis The first Analysis to be run on the buoy is unsteady fluid flow. This will monitor structural analysis to be carried out. 42 After setting the analysis parameters an analysis was run. This was unsuccessful as yet again the model topology was too complex to carry out the simulation. Fig. 27 Static stress attempt 1 Troubleshooting dictated that the buoy was again re meshed. The mesh structure is important as different options work with different simulation types. Fig. 28 re-meshing for static stress Analysis was run for a second and third time. On the outset these analyses appeared to have functioned correctly however. No quantifiable results were produced. Fig. 29.Failed static stress analysis. 43 3.5.6 Progress All simulations carried out to this point have been unsuccessful. Using clues given by error messages flagged in Autodesk Algor software an appropriate troubleshooting step is to greatly simplify the solidworks model. This will allow the software to be tested. However it must be remembered that a heavily simplified model will not produce accurate & therefore useful simulation results. 3.5.7 Troubleshooting As outlined in the progress section a much simplified representation of the buoy was created in order to test Autodesk Algor software. This was created using solidworks. The new model was then imported (in the same way detailed in section 3.5.1) into Autodesk Algor. Next the mesh structure was created. Fig. 30 Simplified meshed model The parameters for Static stress (nonlinear material models) were set and the analysis was run. Visible results were produced from the analysis however quantifiable values were still not given from this type of analysis. Fig. 31.Simplified meshed model 44 This simplified test shows that the software is functioning correctly and is able to carry out simulations. However it is also possible to deduce that thus far the incorrect types of calculations have been carried out in order to produce valuable results. Fig. 32 Simplified model results 3.5.8 MES RIKS Analysis MES RIKS analysis allows the weak/breaking points in the model to be identified. It also allows maximum stress levels to be ascertained regarding the physical properties of the buoy. 3.5.8.1 Operation The parameters were first set and the analysis was run. Fig. 33 Running MES RIKS analysis Settings were changed to show the buoy under a variety of stresses and strains. From this images could be exported. Fig. 34 Von mises stress analysis 45 Maximum stress levels can also be acertained from the software. Fig. 35 Maximum stress levels In addition graphs are produced using given values. Fig. 35 Graph showing von mises stress analysis 3.5.8.2 Results This image produced by Autodesk Algor software allows the weak points of the buoy to easily be identified. These are shown in the lighter coloured areas for example towards the top of the mast, front part of the buoys base & on the bottom extremity. Fig. 36 Buoy weak points 46 Table 12 Maximum stress level This table shows the maximum stress levels that can be exerted on the AAB before it reaches breaking point. This data is taken from MES RIKS analysis & gives a value of 62.05N 3.6 3D simulations At the request of the marketing section a 3D animation was created using 3D studio max software in order to provide a pictorial simulation of the Buoys behaviour. This avi File can be used in future presentations made by the LAB. The first step in the simulation was to import the buoy from solid works. Next a plane was created and positioned in order to simulate the water around the AAB. Fig. 37 Max animation1 Next the materials were assigned using the materials tool. These were chosen appropriately in order to make the simulation appear more realistic. Fig. 38 Max animation 2 47 The next step was to create the movement of the buoy within the scene. This was done using the key frame tool & physically moving the orientation of the buoy. Fig. 39 Max animation 3 Finally lights were added and the scene was rendered. An Avi file was the chosen output as this can be played on most devices/operating systems. Fig. 40 Max animation 4 To the right the first shot of the animation can be seen. This task has been successful. Fig. 41 Final animation 3.7 Evaluation In the beginning the CAD simulation task did not progress as quickly as hoped. At the midterm stage the task was two weeks behind schedule. No simulations had been carried out due to difficulties faced in sourcing appropriate CAD software. However since this point satisfactory progress has been made, the buoy has been structurally 48 tested using Algor simulation software & theoretical calculations have also helped to make further assessments about the buoy. In addition an animation has been created using 3D studio Max to be used for marketing purposes. 3.7.1 Further Work Possible future work includes doing a more detailed theoretical CAD simulation. This would be made possible by using more powerful and expensive software such as Catia which has greater analysis capabilities. However as the AAB has already been manufactured and is close to completion in other areas such further analysis can possibly be considered futile. This is the judgement call that the LAB will now have to make. 49 4. Electronic Design 4.1 Introduction Due to the needs to monitor operating parameters of electronic equipment and buoy behaviour in the marine environment, Electronic Department of AAB project (EPS 2010) built up a watchdog, which takes care of the good physical and software conditions of the Hercules board and represents the core of the Autonomous Acoustic Buoy, power supply module and the watchdog itself. For those systems that can't be constantly watched by a human, watchdog is the right choice and the best solution. The watchdog is circuit board, which consist of two main parts, hardware and software. These components will trigger a system reset or other corrective action, depending on user settings and immediate needs resulted from operating conditions and environment. For instance: temperature and humidity discrepancies, a hang of main computer, or neglects to regularly service the watchdog. The intention is to bring the system back from the nonresponsive state into normal operation one, or to inform the shore about the current state of the system and buoy in case of non-repairable and irreversible state. As is shown in Fig.42 the watchdog is going to be placed inside the „Autonomous Acoustic Buoy”, which will be offshore for monitoring and registering the marine mammals whistles. rc He ule WI-FI Wa tc hD og LAB AAB Fig. 42 Overview and Watchdog positioning in the system The watchdog is a complex device, attempting to save debug information onto a persistent medium. The recorded information is going to be used for debugging the problem that caused the fault. The most common use of a watchdog is in embedded systems, where this specialized timer is often a built-in unit of a microcontroller. In our 50 case the device has to be more sophisticated, with many features and will use the microcontroller itself as a core of the device. 4.2 Watchdog Functions Watchdog timers will trigger fail-safe control systems to move into a safety state, such as turning off the main computer, low-voltage detection, and other potentially dangerous subsystems until the fault is cleared. Limiting and saving the power consumption. Set time limits and constant values in the program, which are going to be used as a guideline conditions for stop the entire system or shut down different its components in order of importance. Protect the electronic equipment when high temperature or high humidity occurs, also in case of water infiltration due to buoy reversal. Monitor and register information as temperature, humidity and position of the buoy, which are going to be sent to the shore, where the user can compute them in terms to obtain charts, diagrams and table reports with received data. Emergency message: In case of irreversible damage, the buoy will inform the shore sending a radio message as a help request. Using the watchdog will make the Autonomous Acoustic Buoy a self-reliant system. This will save users from direct intervention as well as time and money. In relation to the text written above, the watchdog has specific features which can aid in solving any problems which it may encounter. 4.3 Connection between watchdog function, its hardware and its software 4.3.1 Physical conditions One of the main functions of the monitoring device is to supervise the temperature, humidity and impacts of the sea against the buoy. The watchdog should take decisions accordingly in terms of resetting or powering down the Hercules board. The watchdog has an integrated three axes accelerometer with which to monitor the behaviour of the buoy offshore. The operating conditions of the Hercules board in terms of temperature and humidity are monitored using the SHT73 sensor from the Sensirion Company. This sensor is halfduplex, synchronous, and has his own protocol that needs two I/O (input/output) pins of the PIC microcontroller. The acquired data is sent via the USART (Universal Synchronous Asynchronous Receiver Transmitter) port to the Hercules COM port, where gathered data is going to be stored. The stored data will be downloaded to the main computer, so that scientists and engineers can ascertain information about the conditions of the buoy. With this information, they can also monitor in real time the variations of the physical conditions. Temperature, humidity and the behaviour of the sea (accelerometer) are the main parameters supervised by the watchdog, in this way decisions can be taken in terms of buoy functionality. 51 4.3.2 Levels of danger Due to the fact that the AAB has to interpret different results with different meanings, and then has to take an appropriate decision, different levels of warning were assigned as references for the buoy: 1. The first level will be to reset the Hercules board in the event of a poor communication signal, or if the Hercules hangs up. 2. The second level of warning will be to power down the Hercules board if the operating conditions fall outside of the acceptable range. In the event of this the watchdog must wait until the conditions have returned to a satisfactory state before turning on the Hercules board. 3. The third level of warning is to be used when the buoy becomes damaged. For example in the event it becomes capsized, water penetrates inside or if the battery is nearly depleted It will send a rescue signal using a radio-transmitter. According to the levels of danger mentioned above, the AAB project team (EPS 2010) has developed a software program which will operate the microcontroller. As a consequence all the decisions of which Watchdog will take, are decided based on the software program. 4.3.3 Software conditions The main program of the Hercules board will send periodically to the watchdog a signal to inform it that communications between the buoy and the main computer are working properly. Therefore, if the main program of the Hercules board hangs up or communications fails, the watchdog will detect the absence of this periodical signal and will restart the Hercules board. For this task is going to be used one of the PIC’s timer to count a certain period and the external interrupt feature of the PIC microcontroller. If in the established period the watchdog does not get the signal from the Hercules board, and the timer overruns, the watchdog will pull-down a digital output that is connected to the reset ‘button’ of the Hercules board. In addition the, Watchdog is going to monitor the power consumption and the level of the battery, using the analogue to digital converter of the PIC microcontroller. Based on the received data, the watchdog has to decide which part of the buoy has to be shut down and also conserve the maximum amount of power that it can until the rescue team are able to change battery of the buoy. In the event of irreversible damage to the buoy (Level 3) a further watchdog feature has been added, this is the radio transmitter module which has the task of sending a rescue signal to shore. For this feature we will use two antennas. One antenna is positioned on the top of the buoy and another is placed on the bottom. The bottom antenna will be used in the event that the buoy becomes capsized. Both the top and bottom antennas will broadcast signals when the buoy is exposed to any other improper operating conditions. 52 4.4 Hardware design 4.4.1 Full hardware buoy system overview Own Battery Acces Point RF Help VIII. Power supply PIC kit 3 I. Power supply & V. Enable + Signal XII. Ethernet Buoy XIII. Programming Temperature II. Current sensing & III. Battery control & IV. Power supply Watch Dog Accelerometer Voltage Regulators IX. Reset, on/off & X. RS232 & XI. Live sensing Hercules XIV. Aplified signal VII. Power supply Amplifier Current sensing Battery control Main Battery VIII. Power supply XV. Hydrophone signal Hydrophone Fig. 43 Full buoy diagram The full hardware system of the buoy consists of a main battery that supplies power to all of its modules. The Watchdog and RF Help modules also have their own backup battery for use in the event that the main battery becomes dead or becomes so overheated that it needs to be disconnected from the system. If this were to become a reality then without individual backup batteries these two vital modules would not be able to send an essential SOS signal. The sounds of the sea are recorded by the hydrophone. This hydrophone is connected to an amplifier, and the amplifier in turn to the Hercules board. The Hercules board manages and saves all of the gathered information with the use of an access point. This Hercules board operates the buoys core functionalities, as a result of this it cannot be allowed to hang up. In order to supervise this and ensure that it does not become a reality the watchdog monitors the status of all functionalities within the AAB. This is achieved by the sending of a periodical signal that is generated by the Hercules computer. In the event that the Hercules has become inactive the watchdog will not receive this signal and as a consequence will restart the Hercules board. The Watchdog is also able to send environmental data (for example about temperature and 53 acceleration) to the Hercules board. In addition the watchdog has the capability of disconnecting the battery from the remainder of the system in the event of water penetration or that the battery becomes overheated. The current that is being consumed by the Hercules board is also supervised by the watchdog in order to detect short-circuits or other anomalies [Appendix 12]. 4.4.2 Watchdog Schematic The hardware of the watchdog is divided into a few main parts, each part is referred to as a module. These modules perform specific functions such as monitoring the environment, communication, sensing the power supply, supervising the Hercules board, to name a few. The main modules are the following: a) b) c) d) e) f) g) h) i) j) Communication between watchdog and Hercules main board Digital temperature and humidity sensor Analogical temperature sensors Power Power sensing Accelerometer LAN activity (Live sensing) Programming port Hercules power control Battery charger 4.4.2.1 Communication between watchdog and Hercules main board The communications module is based in the RS-232 standard protocol. As the TTL technology of the PIC microcontroller does not match with the RS-232 standard, we use the transceiver signal conditioner MAX232 from the MAXIM company. This device requires some external capacitors to work. 54 Fig. 44 PIC Microcontroller with the corresponding ports These external capacitors are C1, C2, C3 and C4. All four are 1µF electrolytic capacitors and this value is the recommended by the MAXIM Company in their specification sheets of such devices. Fig. 44 shows two ports, these are called IC2.t1in and IC2.r1out and are virtually connected to pins 25 and 26 of the PIC microcontroller. Virtually connected means that in the schematic they are not linked by a line to avoid what is commonly known as a: ‘spaghetti schematic’. We assume that the PIC microcontroller and the MAX-232 integrated circuit are connected by those virtual ports. In Fig. 45 we can also see PA3, the prefix PA means Pin Array, and the ‘3’ is just to identify that it is inside the schematic. For the MAX232 encapsulation we’ve chosen PDIP. This is just to avoid soldering complications and to ensure that too much time is not wasted soldering. The MAX-232 is power supplied by 5V. The capacitor C20 is a decoupling capacitor. Fig. 45 MAX-232 with the required external components 55 4.4.2.2 Temperature and humidity sensor To sense the temperature and humidity an embedded device has been chosen. This contains both features in the same physical device. This device is the SHT73, (it is represented by the part name S1). The S prefix means that it’s a sensor, and the ‘1’ is just an identifier inside the schematic. This embedded device is fully calibrated in the factory and therefore it does not require any external electronic equipment to calibrate. It has got a digital synchronous serial output and in addition is fully recommended to work with battery supplied systems as the consumption of the device is only around 28µA. Fig. 46 Humidity and temperature module This embedded device is sold by the SENSIRION company. The sensor is already soldered onto a small PCB with a pin array meaning that it can be implemented more easily; as a result the integration of this device is quite easy. With regards to the external components that we can see on Error! Reference source not found., the R1 is a 0k ohm pull-up resistor needed for the conditioning of the signal. Additionally the IC9 integrated circuit can be seen, this is a ADG3304 bidirectional logic level adapter. This is because the SHT73 sensor works at +3,3V logic level voltage and also power supply and the PIC microcontroller works at +5V of power and logic level. In order to avoid damaging the device this device is used. Virtual ports linking the IC9 voltage adapter with the PIC Microcontroller can also be viewed in this Image. 4.4.2.3 Analogical temperature sensors Although the watchdog has one digital sensor of temperature and humidity, it has three more sensors of temperature. This is used to monitor the different parts of the buoy. As humidity does not need to be monitored in all the places where the temperature is sensed, these sensors are not SHT73, they are AD22103. 56 Fig. 47 Analogical and temperature sensors module The AD22103, is a sensor developed by Analogue Devices. It is analogical in nature and contains the signal conditioning within its own chip. This device is sold in two different encapsulations: TO-92 and SOIC. The board is able to work with either of these encapsulations due to the fact that they are both able to link the sensors with the board ports. These are shown as PA10, PA11 and PA12, see Fig. 47. The sensor has an analogical output proportional to 28mV/ºC and a span of +0ºC to +100ºC. The typical consumption of the device is 0,5mA and therefore is perfect for battery powered devices such the AAB. 4.4.2.4 Power The circuit is operated using power from the battery of the Hercules main board. As this battery is 12V, and we need 3’3, 5 and 6 to supply the ICs, some current regulation needs to take place. This regulation is done using three positive linear voltage regulators, see Fig. 48. Fig. 48 Power and power sensing modules To supply the power module, there is the PA4, this is directly connected to the batteries of the Hercules board. In addition the IC5 is used, this ensures that the battery voltage is regulated to 3,3V. The 7805 is used to supply the 5V and the 7806 to supply the 6V. The 7805 and 7806 regulators can drain a maximum of 1A and the 7833 500mA, this is a few hundred more times than that which the watchdog will require. As a result they will not require heat sinking. 4.4.2.5 Power sensing The function of the power sensing module is to supervise the voltage level of the Hercules battery. The PIC Microcontroller has got a built in A/D converter, but the maximum voltage that it can sense is 5V. In order not to damage the PIC Microcontroller, we have to (see Table 14)adapt the 12V of the battery to 5. 57 Table 13 Corresponding voltages from the battery to the adapted ones Battery Voltage Adapted voltage for PIC Microcontroller 12 5 6 2,5 0 0 This table shows the ecuation (1) demonstration: (1) To physically implement this literal conversion a voltage divider has been designed. This voltage divider can be seen in the Watchdog schematicError! Reference source not ound.. Voltage is divided by the resistors R10 and R11. In equation (2) we can see the demonstration. (2) So, in the R11 the drop voltage will be the adapted one that will be connected to the sensing virtual port which in turn is connected to the PIC Microcontroller analogical channel 0. 4.4.2.6 Accelerometer The main core of the accelerometer module is the LIS3LV02DL. This is a three axes digital output linear accelerometer that also includes a sensing element and an IC interface. This interface is able to take the information from the sensing element and in addition to provide the measured acceleration signals to the external world through an I2C/SPI serial interface. Fig. 49 LIS3LV02DL package As this device (see Fig. 49) is sold in a smd package that is really difficult to solder, the UM0395 adapter board has been selected who to provide an effective solution. This is necessary as the LIS3LV02DL accelerometer is already soldered to a PCB with a pin array output that fits with the DIP standard, see Fig. 50. 58 Fig. 50 Adapted board for the accelerometer In Fig. 51 we can see the electronic connections of the accelerometer module. The accelerometer is linked to the microcontroller using the ADG3304 voltage adapter. The operation of this device is explained previously in section b). Fig. 51 Accelerometer module 4.4.2.7 LAN activity This module consists of a simple input port PA2 (see Fig. 52) which is directly connected to the PIC microcontroller. The periodical signal that comes from the Hercules board is plugged into this. The periodical signal in question is generated by a program that is used to run the Hercules, therefore, if the Hercules ceases to function correctly the signal will not be produced. After this the watchdog will notice and will consequently execute a reset signal for the Hercules board using the module ‘Hercules power control’. The input signal must be +5V voltage level Fig. 52 LAN activity module 59 4.4.2.8 Programming Port This module is used to program the memory of the code and configure bits of the PIC microcontroller. The schematic is quite a simple structure. It consists of only three data pins, PA1.mclr/vpp, PA1.pgd and PA1.pgc (see Fig.53) which are linked to the PIC microcontroller. Fig. 53 Programming port module 4.4.2.9 Hercules power control As we can see the PA9 is the port which manages the power state of the Hercules board. This port is simply connected to the power pin of this board in such a way that it emulates the function of a person touching the power button. If this pin is put up for four seconds, for example, the Hercules board will turn down. This is done in order to avoid the buoy operating in bad weather conditions and will thus help to prevent some types of internal damage. 4.4.2.10 Battery charger The battery charger module is simply a voltage source from which the current is limited by a resistor. In addition it also contains a diode to avoid reverse voltage connections (see Fig. 5). Fig. 54 Battery charger 4.4.3 Expansion Ports The Watchdog board has been developed to carry out some extra functions such as: a. Radio transmitter and amplifier 60 b. Current sensing c. Battery control These functionalities are not built into the Watchdog board however it does have the necessary ports enable them to be carried out. 4.4.3.1 Radio transmitter and amplifier The radio transmitter is needed to send an SOS signal in the case of emergencies. This signal will be emitted by the FM-RTFQ1 module which is sold by RD Solutions Company. This is a fully designed and embedded radio emitter that does not require external components and works in the 868MHz frequency range. We can see the radio transmitter in the Fig. 55 with the identification IC3. Fig. 55 Radio transmitter with the corresponding radio amplifier The radio amplifier is required in order to increase the signal from the radio transmitter. In this module, there are many more components than in the previous ones. The radio amplifier consists of the following components: IC4, C6, R6, C7, ANT1, L1, C8 and C9. The main core of this module is the IC4. This is a wideband medium power amplifier that will increase the power signal from the radio transmitter. This Silicon Monolithic Microwave Integrated Circuit (MMIC) is sold by the Semiconductor division of PHILIPS. In Fig.55 we can see the components position and its corresponding values. This position and value is recommended by the specification sheet given by PHILIPS Semiconductor with this device. In the Watchdog PCB, the corresponding ports that link the radio transmitter and radio amplifier will be the PA5 and PA6. The PA5 is the power port that will give +5V and +6V to power up the amplifier and the transmitter. PA5 port is the radio control port, this is one of the pins is that will turn on or off the radio device and the other one is used to send the rescue signal to be emitted. 4.4.3.2 Current sensing The current sensing port, Fig. 56 , has the task of receiving the proportional voltage in accordance with the current that in real time is being consumed by the main battery. 61 Fig. 56 Current sensing expansion port The current sensing module should consist of a low resistance resistor in series with the full system and the battery, in this way: (3) 4.4.3.3 Battery Control The battery control expansion port is the PA7, this. It consists of three pins. One is +5V to give the power supply to the module. Another one is the control pin, which is connected to the PIC microcontroller and is which will give the signal to disconnect the full system from the battery in the event that a problem is detected. The third pin is ground. 4.5 System integration To isolate the watchdog module from the other parts of the AAB, the decision was taken to place the Watchdog in a separate sealed box. This was important as a result of the operating conditions in which the buoy is to operate, for example water infiltration or extreme shaking. The box must be completely impenetrable in same way that a black box of an airplane is. As a result, if the Hercules is in danger, then the Watchdog will not be. The only link between the Hercules board and the watchdog is the SHT73 sensor. This will be placed in the Hercules box and linked to the watchdog via the use of cables. The sealed box of the watchdog is going to be powered up with +12 V from the battery box using and external connector and cables. Because the batteries also control the electronic circuit which have a certain range for operating conditions it was decided to place another temperature and humidity sensor inside the battery box. As a backup solution it will be taken into consideration to build the watchdogs own power system supply. In the event that the buoy power system is damaged we can switch the alignment of the watchdog from the general power supply box to the backup power system. This is a small 9V battery that is capable of providing enough power for the board to send rescue signals to the shore. For future improvements of the AAB it is suggested that solar panels are used to power the main supply system. In this way, using a proper electrical system which can convert solar energy to electricity, it will be possible to use energy stored during the day time to recharge the batteries of the buoy. Solar panels will be positioned on top of the buoy and the electrical convertors will be placed in a separate box inside it. 62 4.6 Communication between Watchdog and Hercules main board Communication between the watchdog and Hercules main board (see Fig. 57), will be made using well insulated wires. Effectively the Hercules II is an embedded CPU board in an EBX form factor that integrates the following subsystems onto a single compact board: CPU Core PC Chipset Video Sound Ethernet Analogue and digital I/O [21] As a result of the features contained within it, the Hercules II board is the core of the AAB. It represents a computer with many inputs and outputs, both digital and analogical, that allow the Buoy to register marine noise and whistles. This final feature of the Hercules board is the most important in the research process carried out by LAB. As a result the designed watchdog has to communicate with the board in terms of monitoring the operating condition of the main computer. In limiting the buoys exposure to detrimental environmental conditions the quality of acquired sound recordings can be improved. Fig. 57 Hercules II EBX In order to carry out the aforementioned task the watchdog has various peripheral devices such as different types of sensors. However, the most important function of the watchdog is to detect a “live signal” from the Hercules Board. This signal is sent from the main computer to the watchdog periodically and will trigger a software function from the watchdog. If, the periodical signal is missing for more time than the period established the user, the watchdog will detect the situation and will take an appropriate decision in terms of whether to reset or power off the computer. 4.7 Software Design The software design for the Watchdog, and namely for PIC18f4525 microcontroller will 63 be based, as most embedded systems are, on an infinite loop. As is shown [Appendix 11], the program has three different courses. A main course of the program and two interrupt routines. The interrupts are used for monitoring the external high priority events, such as the hung up of the Hercules board or an external interrupt given by the accelerometer. These types of routines will serve to avoid or treat the event which caused the damage. The main loop will run forever, and has some critical steps of which it has to follow: 1. Initializing microcontroller peripherals: Input and Output ports of the microcontroller; Universal Synchronous Asynchronous Receiver Transmitter port; Analog to Digital Converter; Activating the interrupts; Internal timers; 2. Initializing the communication with external peripherals: Accelerometer; Temperature and Humidity Sensor; Radio module; Hercules board; 3. Data acquisition; 4. Data computation; 5. Sending the computed data through EUSART to Hercules board; 6. Comparing data with reference values; 7. Depending on results of comparison operation the Watchdog has to take the following decisions: Reset the Hercules board; Shut down temporary the Hercules Board; Shut down permanently the Hercules Board; Send rescue signals to the shore; In next the figure the time evolution of the software is shown. A time of 6 seconds was obtained for an entire cycle. Each cycle is divided into three sections (see Fig. 58): 1. Initialization: at this point microcontroller is initializing its peripheral devices; 2. Data acquisition and computation: in this section core of the Watchdog receives data related to temperature, humidity, acceleration, power consumption and current sensing. Afterwards data are computed and sent to main computer through USART port. 3. Decisions: at this point computed data are compared with references and if it is necessary the Watchdog takes decision in terms of reset, power off or power on main board. 64 0.1s LIS3LV02DL ADC RS232 SHT73 PIC18F4525 Hercules Radio Module Initialisation 0s Voltage Current Temperature 0.1s Data aquisiton & computation Send Information Temperature Humidity Send Information X axis Y axis Z axis Send Information 2s 2s Reset 6s 18s Decisions Power Off Power On Enable SOS Live signal Reset??? Fig. 58 Time evolution of the software program Normally every 18 seconds the watchdog has to receive a signal from the Hercules, this is the “live signal”, if this does not happen an interrupt occurs and resets the main computer. 4.8 Software Structure The software was developed using MPLAB environment and MCC18 C compiler provided by the Microchip Company (see Fig. 59). The software structure is constituted of eleven files, eight source files and three header files (see Fig. 60). Each source file contains functions related to identifying, initializing, and controlling the microcontroller’s peripheral devices. For instance SOS.EPS.c file contains a routine which generates an SOS signal in Morse alphabet. This message is taken by the radio module, which broadcasts it. Links between source files are made with header files calling them. In this way every source file knows about the existence of other source files. 65 Fig. 59 Development software environment Inside header files, users can set up global variables used in the program (e.g. Variable.h ). Furthermore users can configure the microcontroller’s ports (e.g. PortConfiguration.h). For instance, a microcontroller’s pins can be set up as inputs or outputs modifying TRIS registers related to the each port. In addition users can modify value on the pins changing PORT or LAT registers value. AnalogToDigital.c OnOffResetHercules.c Intterupts.c StatusRegister.h Main.c Variable.h Temp&HumidCalculation.c PortConfiguration.h SOS.EPS.c RS232.c Accelerometer.c Fig. 60 Software structure 66 Because the microcontroller PIC18F4525 has to control different types of peripheral devices such as sensors, which have their own memory and their own registers, it was decided to create another header file (e.g. StatusRegister.h). This file contains information related to the desired information at the time in the internal registers of peripheral devices. 4.9 “Live signal” The PIC18F4525 device has multiple interrupt sources and an interrupt priority features that allow most interrupt sources to be assigned a high priority level or a lowpriority level. The high-priority interrupt vector is at 0008h and the low priority interrupt vector is at 0018h. High-priority interrupt events will interrupt any lowpriority interrupts that may be in progress.[datasheet] For this purpose only high priority interrupts are used, namely external interrupt and timer 0 on an overflow interrupt. These two interrupts are controlled by two SFR registers INTCON and INTCON2 [Appendixe 5]. Firstly we dedicated two pins of the microcontroller (RD3 and RB3) through which reset signals were to be sent in addition to power off/on signals. These pins are linked to the J7 utility connector from Hercules Board [Hercules]. J7 connector has a reset pin and a power on/off pin. Secondly we developed a software routine to be located in file OnOffResetHercules.c which carries out the following steps: set up external interrupt as a high priority interrupt; set up Timer0 interrupt on overflow as a high priority interrupt; in case of external interrupt the routine resets timer; in case of Timer0 interrupt the routine pulls down voltage on RB3 pin for 200ms, which means a reset signal for the Hercules Board; The periodical signal – “live signal” – is provided from main computer every 18 seconds. If the external interrupt pin RB0, doesn’t detect any modification of voltage level during 18 seconds, internal timer0 of the microcontroller overflows and triggers its interrupt. [Appendix 12] 4.10 SHT73 temperature and humidity sensor The SHT73 sensor was chosen because of its features: - Relative humidity and temperature sensors; Dew point; Fully calibrated, digital output; Excellent long-term stability; No external components required; Ultra low power consumption; Surface mountable or 4-pin fully interchangeable; Small size; Automatic power down; [25] 67 Fig. 61 Humidity and temperature Sensor SHT73 A photo of SHT73 sensor is shown in Fig.61. Depending on needs and designer opinion the choice was made between the SMD chip and a through-hole device. After much consideration the trough-hole device was chosen. The main advantage of this sensor is that in a single chip there are two traducers which can use the same resources that are provided by the microcontroller. In this case the design of watchdog is going to be more versatile and open for further development. 4.11 Communication between microcontroller and SHT73 For establishing communication between sensor and microcontroller two pins from PORTB of microcontroller are dedicated, namely RB4 and RB5, these represent DATA line and SCK line. 4.11.1 Start up Sensor To make SHT73 sensor work VDD = 3.3V power supply voltage was chosen. The slow rate during power up should not fall below 1V/ms. After power-up the sensor needs 11ms to arrive in Sleep State, therefore before that time it is prohibited to send any other command. [25] 4.11.2 Sending a Command to initiate a transmission A Transmission Start sequence has to be issued in order to begin the communication between devices. It consists of a lowering of the DATA line while SCK is high, followed by a low pulse on SCK and raising DATA again while SCK is still high [25]. The subsequent command consists of three address bits and five command bits. The SHT73 indicates the proper reception of a command by pulling the DATA pin low (ACK bit) after the falling edge of the 8th SCK clock. The DATA line is released (and goes high) after the falling edge of the 9th SCK clock. (see Hardware simulation chapter) 4.11.3 Measurement of RH and T After issuing a measurement command (‘00000101’ for relative humidity, ‘00000011’ for temperature) the controller has to wait for the measurement to complete. This takes a maximum of 320 ms for a 14bit measurement. The time varies with the speed of the internal oscillator and can be lower by up to 30%. To signal the completion of a measurement, the SHT73 pulls data line low and enters Idle Mode. The controller must wait for this Data Ready signal before restarting SCK to readout the data. Measurement data is stored until readout, therefore the controller can continue with other tasks and readout at its convenience. Two bytes of measurement data and one byte of CRC checksum (optional) will then be transmitted. The microcontroller must acknowledge each byte by pulling the DATA line low. All values are MSB first, right justified (e.g. the 5th SCK is MSB for a 12bit value, for a 8bit result the first byte is not used). Communication terminates after the acknowledge bit of the CRC data. The device automatically returns to Sleep Mode after measurement and communication are completed. [Appendix 9] The temperature sensor is very linear by design. The following formula is used to convert digital readout (SOT) to temperature value, with coefficients given in [Appendix 10]: 68 (4) 4.11.4 Humidity compensation For compensating non-linearity of the humidity sensor and for obtaining the full accuracy of the sensor it is recommended to convert the humidity readout (SORH) with the following formula with coefficients given in Table 35.[Appendix 10]. (5) 4.11.5 Temperature compensation of Humidity Signal For temperatures significantly different from 25°C (~77°F) the humidity signal requires temperature compensation. The temperature correction corresponds roughly to 0.12%RH/°C at 50%RH. Coefficients for the temperature compensation are given in Table 37. (6) 4.11.6 Dew point computation SHT73 is not measuring dew point directly. However dew point can be derived from humidity and temperature readings. Since humidity and temperature are both measured on the same monolithic chip, the SHT73 allows superb dew point measurements. For dew point (Td) calculations there are various formulas to be applied, most of them quite complicated. For the temperature range of -40 – 50°C the following approximation provides good accuracy with parameters given in table below: (7) Table 14 Parameters for dew point calculation Temperature Range Tn(◦C) m Above water, 0 - 50◦C 243.12 17.62 Above ice, -40 - 0◦C 272.62 22.46 This task is not implemented yet, however it could be a good starting point for the future development of the AAB. 4.12 Power sensing Another task that we have to face is that of power consumption monitoring. For this approach it was decided to use an Analogue-to-Digital converter module of the PIC18F4525 microcontroller. In this way we are using 2 out of a possible 13 A/D channels, one for current sensing and one for voltage sensing. In effect we are 69 monitoring two voltages because the data is easy to process. When voltage and current are known it is simply a matter of using mathematical formula in order to find out power consumption. (8) 4.12.1 Analogical to Digital Conversion There are 13 Analogical-to-Digital (A/D) converter modules within the PIC18F4525 device. This module allows the conversion of an analogical input signal to a corresponding 10-bit digital number. The module is controlled by the following registers: A/D Result High Register (ADRESH); A/D Result Low Register (ADRESL); A/D Control Register 0 (ADCON0); A/D Control Register 1 (ADCON1); A/D Control Register 2 (ADCON2); By programming in the right way these registers user can choose as many analogical inputs as he needs, which are working one at the time using an internal multiplexor [Appendix 8]. For software development we faced a small issue in terms of acquisition time. The minimum acquisition time is 2.4 µs and consists of: TACQ = Amplifier Settling Time + Holding Capacitor Charging Time + Temperature Coefficient TACQ = TAMP + TC + TCOFF TACQ = 0.2 µs + 1 µs + 1.2µs = 2.4 µs A simple applied formula gives us current and voltage: (9) (10) Where Uin and Iin are inputs of voltage and current respectively, and U and I are computed voltage and current, which are used for power consumption computation. 4.13 Behaviour detection of the buoy For monitoring the buoys behaviour offshore 3 axis digital acceleration sensors LIS3LV02DL have been used. Some of its features are listed below: 2.16 V to 3.6 V single supply operation 1.8 V compatible I/O I2C/SPI digital output interfaces Programmable 12 or 16 bit data representation Interrupt activated by motion Programmable interrupt threshold Embedded self test High shock survivability [32] 70 4.13.1 SPI communication port The SPI mode of PIC microcontroller allows 8 bits of data to be synchronously transmitted and received simultaneously. All four SPI modes are supported. To accomplish communication, typically three pins are used: Serial Data Out (SDO) – RC5/SDO Serial Data In (SDI) – RC4/SDI/SDA Serial Clock (SCK) – RC3/SCK/SCL In addition the sensor requires a chip select channel which was set up using the RC2 pin. [27] 4.13.2 SPI bus interface The LIS3LV02DL SPI is a bus slave. The SPI allows us to write, and read the registers of the device. The serial interface interacts with the outside world with the 4 wires: CS, SPC, SDI and SDO. Fig. 62 Read and Write protocol CS is the Serial Port Enable and it is controlled by the SPI master. It is low at the start of the transmission and goes back high at the end. SPC is the Serial Port Clock and it is controlled by the SPI master. It is stopped high when CS is high (no transmission). SDI and SDO are respectively the Serial Port Data Input and Output. Those lines are driven at the falling edge of SPC and should be captured at the rising edge of SPC. Both the Read Register and Write Register commands are completed in 16 clock pulses or in multiple of 8 in case of multiple byte read/write. Bit duration is the time between two falling edges of SPC. The first bit (bit 0) starts at the first falling edge of SPC after the falling edge of CS while the last bit (bit 15, bit 23, ...) starts at the last falling edge of SPC just before the rising edge of CS. bit 0: RW bit. When 0, the data DI(7:0) is written into the device. When 1, the data DO(7:0) from the device is read. In latter case, the chip will drive SDO at the start of bit 8. bit 1: MS bit. When 0, the address will remain unchanged in multiple read/write commands. When 1, the address will be auto incremented in multiple read/write commands. bit 2-7: address AD(5:0). This is the address field of the indexed register. bit 8-15: data DI(7:0) (write mode). This is the data that will be written into the device (MSb first). bit 8-15: data DO(7:0) (read mode). This is the data that will be read from the device (MSb first). In multiple read/write commands further blocks of 8 clock periods will be added. When MS bit is 0 the address used to read/write data remains the same for every 71 block. When MS bit is ‘1’ the address used to read/write data is incremented at every block. The function and the behaviour of SDI and SDO remain unchanged. [32] For a proper communication between devices some of the accelerometer registers have to be set up in terms to get the desired results [Appendix 11]. 4.14 Serial communication All data received from microcontroller’s peripheral devices is sent through the serial port of the microcontroller to the Hercules main board. The communication protocol is RS232 and is based on a three wire resource. Data sent has a set format which looks like that found in the following table: Table 15 Data transmition format T = ± xx,xx C H = xx,x % V = xx.x V I = xx.x I Xaxis = xg Yaxis = xg Zaxis = xg To enable the serial port, MSSP Enable bit, SSPEN (SSPCON1<5>), must be set. To reset or reconfigure SPI mode, clear the SSPEN bit, reinitialize the SSPCON registers and then set the SSPEN bit. This configures the SDI, SDO, SCK and SS pins as serial port pins. For the pins to behave as the serial port function, some must have their data direction bits (in the TRIS register) appropriately programmed as follows: • SDI is automatically controlled by the SPI module • SDO must have TRISC<5> bit cleared • SCK (Master mode) must have TRISC<3> bit cleared • SCK (Slave mode) must have TRISC<3> bit set • SS must have TRISA<5> bit set To set up an Asynchronous Transmission, it needs to work with the TXSTA and SPBRGH:SPBRG registers of the PIC microcontroller: Initialize the SPBRGH:SPBRG registers for the appropriate baud rate. Set or clear the BRGH and BRG16 bits, as required, to achieve the desired baud rate. Enable the asynchronous serial port by clearing bit SYNC, and setting bit SPEN. If interrupts are desired, set enable bit TXIE. 72 If 9-bit transmission is desired set transmit bit TX9. This can be used as address/data bit. Enable the transmission by setting bit, TXEN, which will also set bit, TXIF. If 9-bit transmission is selected, the ninth bit should be loaded in bit, TX9D. Load data to the TXREG register (starts transmission). If using interrupts, ensure that the GIE and PEIE bits in the INTCON register (INTCON<7:6>) are set. Also TRISC<7> and TRISC<6> bit must be set as digital outputs; [27] USART port of the microcontroller can have the function to both transmit and receive information. To receive information from any peripheral devices, in our case from the Hercules board, the port has to be set up for data reading [Appendix 7]. In this way the user which controls main computer can also control the watchdog by writing in its registers information for further actions. This task can be easily accomplished by the next team of EPS students. 4.15 Hardware simulation and obtained results Before implementing on a real PCB the designed schematic, we tested and simulated it. For the simulation process three different steps were applied: 1. Software simulation of the hardware step using Proteus environment: Fig. 63 Watchdog schematic 73 2. Hardware simulation using prototype boards and electronic devices: Fig. 64 Hardware simulation step 3. Final product simulation and testing: Fig. 65 Final product testing 4.15.1 Software simulation of the hardware step using Proteus environment To simulate the circuit which testing the temperature and humidity sensor, acceleration sensor, external interrupt feature, analogue to digital conversion, and implements serial communication between microcontroller and a computer, it is necessary to have electrical models of the following components, as shown in Fig.63: 1) 2) 3) 4) 5) 6) PIC18F4525 Microcontroller; Adjusting voltage levels circuit to facilitate 2 wires communication, MAX232; A virtual terminal which replaces the serial COM port of the computer; SHT73 temperature and humidity sensor; Accelerometer LIS3LV02DL; 5V power source; The communication is made using two lines, one is a clock line and the other one is a data line. Both wires are bidirectional, for receiving and transmitting data. The MAX232 circuit is connected in a classical design using small range capacitors. The microcontroller is the device which will start or stop the data exchange, being programmed in a certain way. Virtual terminal is a tool provided by Proteus environment which is simulating serial computer COM port. The SHT73 humidity and temperature sensor doesn’t require an SPI port as it has its own protocol that needs to be set by the programmer using the software program. For this we will need two I/O 74 pins of the microcontroller, RB4 and RB5. Operating range in terms of temperature is 40◦C and +123◦C, and in terms of humidity is 0-100% which is the operating range of the microcontroller. Because of the very low power consumption of the sensor the samples can be taken once a second not often. Also it’s not needed to take samples very often of temperature and humidity, so for less power consumption of the entire schematic can be reduced by programming the microcontroller in sleep mode. The decision is going to be taken later on how often samples should be taken corresponding to the other functions that watchdog has to make. After the software simulation and emulation almost the same result in relation to the datasheet was obtained. In the following figures the results are shown, with mention that the yellow waveform is DATA line, and the blue waveform is clock line. Also the left of the figures contain data obtained from simulation and on the right side are waveforms from the datasheet. Fig. 66 Start transmision sequence For easy understanding and implementation of the required sequences of data and clock signals for communication between the microcontroller and sensor, state machines were developed as shown in the next figure. This implements the start of the transmission sequence. 2 DATA = 1 SCK = 1 DATA = 0 SCK = 1 5 1 4 6 DATA = 1 SCK = 0 3 DATA = 0 SCK = 0 Fig. 67 State machine of start transmission sequence 75 Fig. 68 Reset connection sequence Fig. 69 Command sequence for temperature measurement: 0x03 Fig. 70 First received byte of temperature measurement The following screen shot shows an example of using a virtual terminal for the simulation of the COM port of a computer. The port is used for displaying data such as temperature and humidity. Fig. 71 Sample of temperature and humidity measurement; 4.15.2 Software Errors It needs to be mentioned that samples are taken with 14 bit resolution for temperature measurement and with 12 bits for humidity measurement. Because of data convertions and mathematical computation also because of the empirical determined coeficients of temperature and humidity compensation, the results are not very precise. The smallest error for temperature is 0.1C and for humidity is 0.5%. These rates are related to the normal range of operation for the WDT. The error goes up to 76 1,5C for temperature and 5% for humidity for operation conditions in the extreme range. Fig. 72 Error between real data and computed data A 10 bit resolution conversion of power consumption with 1 LSb error was also obtained. Acceleration obtained using a 14 bit resolution has no error besides factory errors. The reason that makes us to believe that there is no error is the fact that the interface between accelerometer and microcontroller is fully digital. 4.16 Versatility The watchdog was designed in such a way that it would be versatile. In the persuit of this goal, the printed circuit board has following features: Unused pins of the microcontroller were placed aside with a specific type of connectors; The pins can be used to connect new devices to the printed circuit; As the logical consequence of the preview feature is programmed in a certain way, the microcontroller is able to perform other functions. These functions will trigger an external device using the unused pins; To connect the peripheral devices to the printed circuit board specific sockets are used; Usually the sockets are universal and are compatible with other devices. 4.17 Conclusions and further goals Most embedded systems that include high integration peripherals have some sort of built-in Watchdog. This is also the case with the Hercules board in the Autonomous Acoustic Buoy. It has to be avoided apart from in the most cost-sensitive or benign systems. Internal units offer minimal protection from rogue code, and don’t offer any protection against external factors as optimal working condition. Runaway software may reprogram the watchdog controller and in addition many internal watchdogs will not generate a proper reset therefore any failure of the processor will make it impossible to put the hardware into a safe state. An efficient watchdog must be independent of the CPU it is trying to protect. For this reason the external watchdog was designed for the Autonomous Acoustic Buoy. The device will monitor the buoys operating conditions ensuring that weather conditions and power supply do not impede or restrict the operations of the Hercules board. 77 For the further development of the Watchdog it is recommended that the microcontroller’s facilities are utilised. The first point is to take advantage of the USART port not only for transmitting information, but also for receiving information. By receiving data, the software program which triggers the microcontroller can save information into its internal data memory, and afterwards use it to write internal registers of the device in order to modify its functionality. Secondly it is strongly suggested that the remainder of the analogue to digital channels of the microcontroller are used by the addition of analogical sensors. 78 5. Marketing plan 5.1 Goal and Aim of this project As previously mentioned the 2010 team is the third group to work with the LAB on the AAB project. Our main task is to further develop the design and functionality of the AAB. In addition it is also our task to design a marketing plan with the aim of creating a strategy with which to introduce the AAB onto the market. Last year the marketing part of the Project was started. Students of the 2009 project group have collected and maintained information about the company and its product, and in addition have also developed a leaflet. Taking this into account it is the aim of the 2010 team to further advance the design of a strategy to enter the market. 5.2 Introduction Ocean noise has always existed in both natural and biological forms. However in recent years a large increase in artificial sound pollution sources has become a threat to its balance. Cetaceans can be considered as bio-indicators of the acoustic balance in the oceans. To gain knowledge about their way of perceiving and communicating in the environment, it is important to investigate in the conservation of the marine ecosystems and the development of sustainable human activities. It is difficult to find financial support, because the effects of noise pollution on the marine environment have not yet been completely implemented in national programs. At the moment the financial support is from private sources to guarantee continuation of this research. The development of a sustainable marine environment concerns everyone. With some support we can implement solutions from science and applied research in order to bring back the important acoustic balance to the sea [39]. 5.2.1 Noise pollution Before further progress can be made, it is important to know what is meant by ocean noise. Human activities which produce underwater noise pollution are the following: - Shipping, Offshore oil/gas exploration and production, Industrial and military sonar, Experimental acoustic sources, 79 - Underwater explosives and other underwater civil engineering activities, Airborne noise from supersonic aircraft. Fig. 73 Types of noise sources The noises can cause lesions in the acoustic organs of cetaceans, which can result in displacement, avoidance reactions, collisions with ships, mass stranding and death. Noise Sources Lightning strike on water surface Seafloor volcanic eruption Sperm Whale Fin Whale Humpback Whale Bowhead Whale Blue Whale Southern Right Whale Gray Whale Shipping LFA (Low Frequency Sonar) Yachts and pleasure boats Military and industrial sonar Sound Levels 260 dB (approximately) 255 dB (approximately) 163-180 dB 160-186 dB 144-174 dB 128-189 dB 155-188 dB 172-185 dB 142-185 dB 180 dB (approximately) 240 dB 160 dB 230 dB All decibels (dB) are re 1 microPa at 1 m Source: http://www.surtass-lfaeis.com/Terms/index.htm, 05-03-2010 5.3 Internal analysis 5.3.1 Organisation The need to control sea noise that is made by human activities in order to protect the cetaceans in the marine environment has resulted in the development of the Autonomous Acoustic Buoy. The AAB records and samples acoustic signals found in the 80 marine environment and then delivers them through a wireless connection to a computer. Scientists are then able to analyse the received information. The Laboratori d’Aplicacions Bioacústiques (LAB) is an organisation which has desires to sell the technique of the AAB to other companies, in order to aid in the protection of the ocean environment. The LAB was created with a grant from the Spanish Ministry and support from the city Vilanova i la Geltrú. A group of scientists are working together to increase awareness of the acoustic degradation of the marine habitat in the Mediterranean Sea and the North Atlantic. At this moment the organisation has thirteen employees. Although the final decision should be made by the director of the LAB, Michel André, each employee has their own activities and responsibilities. Most of the activities, which are needed to provide in the objective of the company, are carried out by employees of the LAB themselves. Activities include the following; research, design, acoustic identification of marine mammals, developing of methods for processing and automatic classification of hydrophone recordings and finally engineering. 5.3.2 Employees of the lab An organization chart for the company can be found in the appendix, [Appendix 17]. Michel André - Director Josep Maria Alonso - Associated researcher Cristina Álvarez Baquerizo - Specialist of environmental law, in particular the communitarian law. She is a legal adviser for nature’s protection James L. Aroyan - Associated researcher Joan Vicent Castell - Senior scientist Eduard Degollada - Associated researcher Joaquín del Río - Acquisition of auditory evoked potentials in cetaceans John C. Goold - Associated researcher Ludwig Houégnigan - Developing processing techniques Alex Mas - Researcher Maria Morell - Researcher 81 Marta Nin i Camps - Design of scientific exhibits and research divulgation Marta Solé - Biologic, pathology, anatomy Mike van der Schaar - Acoustic identification of marine mammals Serge Zaugg - Developing methods for processing and automatic classification of hydrophone recordings The actual production of the buoy will be outsourced to two other companies. One company is located in Barcelona and the other one in Italy. These companies specialise in the production of buoys, although not only for the LAB but also for other companies. 5.3.3 Objectives and mission The objective of the company is to create a system, the AAB, which investigates the sound production and reception in animals, including man, the biological acousticallyborne information transfer and its propagation in elastic media. With this system the LAB wants to protect the cetaceans in sea, because the noises of human activities can lead to the dead of animals. The company has the desire to be the first company with a system like this. This objective leads us to the mission of the company; “Protect the environment, by providing tools to help human activities on the sea to continue, although without damaging the environment.” 5.3.4 Target group For companies it is important to decide who the target group is before introducing the product into the market. The AAB is a business orientated product, a business-tobusiness market. The target group for the AAB consists of companies with activities in the windmill industry, offshore oil and gas exploration and production, as well as navies. 5.3.5 Marketing mix 5.3.5.1 Product To get information about cetaceans living in the marine environment, a product is needed that receives sounds from underwater sources. The AAB is able to receive sounds in an underwater environment by a hydrophone. The hydrophone is an element in the AAB which will pick up acoustic energy. The hydrophone will not only receive sounds from the cetaceans, but also from other animals, natural sources like waves, rain, storm and human activities. To make sure that only the sounds of cetaceans will be saved, a filter is needed. The filtering and amplifying of the signal is done by the Programmable Filtering Circuit (PFC). After this step, the information will be sent to the Hercules Board, a computer which is installed in the AAB. This computer controls the gain and cut-off frequencies of the PFC. Beside that the Hercules Board will sample and sent the recorded signals to a computer, through a wireless internet 82 connection. After receiving the signals from the AAB, the employees of the LAB can study the information[3]. Fig. 74 Basic Block diagram of the AAB; Source: Final report AAB for the EPS, 2008-2009 The Autonomous Acoustic Buoy is a new product on the market, in other words: the product is at the orientation stage of the product life cycle. An advantage of this stage is that there aren’t many competitors on the market. Although it is important to bring the product to the next stage in the product life cycle through its disclosure to potential customers. As result of this disclosure, sales will increase and will take the product to the next stage known as growth. A promotion campaign is very effective at this stage of the cycle. Fig. 75 Product Life Cycle stages 83 At the moment the product is ready for sale, although the company is still making further improvements to the system. 5.3.5.2 Price The company have not yet decided the price. 5.3.5.3 Place The Autonomous acoustic buoy is a product that has a global coverage. This is a result of the target group on which they are focussing for example the windmill industry and navies. These are examples of organisations which are operating on a global level. 5.3.6 Financial situation The LAB doesn’t have many financial resources. At the moment they are busy with providing the system. This marketing plan has to introduce the AAB on the market in order to find customers and investors. “Sons de Mar needs your support through a donation To collaborate with Sons de Mar is to decide to actively participate in the conservation of the ocean's balance. As an individual, or from your company. It is an investment in dedicated research; it is the desire for sustainable development in the sea, now, and for the generations to come. The decision to help the sea getting back to its own environment of natural sounds, without noise pollution, is a choice everyone can make.“ 5.4 External analysis 5.4.1 Economic According to a report of PricewaterhouseCoopers LLP there is a political revolution on its way, this which will change the leading economic countries. At this moment the USA, Japan, Germany, France, United Kingdom, Italy and Canada (G7) are the leading countries. Although they will be challenged by a new group, the E7, China, Russia, India, Brazil, Mexico, Indonesia and Turkey. By approximately 2019 the average GDP (Gross Domestic Product) of the E7 will match the GDP of the G7. However by 2023 it is expected that the GDP of the E7 will have increased and would then be higher than the GDP of G7 by 30%. In 2030 the global priority list of the most important global economies will consist of: China, USA, India, Brazil, Russia, Germany, Mexico, France and United Kingdom[44]. 5.4.1.1 Europe An article on the website www.express.be, “Eurozone Forecast” by Ernst & Young states that the European economy will be weak until 2012. By this point most of the larger member states would have overcome the recession however the prospects in the short term are problematic. The GDP will increase by 1% in 2010 with a 1.6% 84 increase in 2011. This is n contrast with unemployment rates which will reach a peak of 17 million unemployed people (10,3% of the labour force). The worst part of the recession has already passed by, although it is not over yet and we won’t see a full recovery until at least 2012. The expectation is that the north of Europe (Germany, France and the Benelux) will recover faster than the south of Europe (Greece, Portugal, Spain, Ireland and Italy). The economy will only increase by 0,6% from 2010 to 2012, in comparison with 1,8% for the north of Europe. A result of this there is a gap between the north and south of Europe[45]. 5.4.1.2 America Since 2009 the economy of America is growing. This is a result of the increased export of 18% in 2009. At the fourth quarter of the year the American economy grew with a 5,9% base year on year. The GDP increased with 2,2% base year on year in the third quarter of the year. If we look at the GDP in 2009, as a complete year, it has decreased by 2,4%. This is the largest decrease since the decrease of 10,9% in 1946. The total amount of income of companies, consumers and government in American was 13.14 billion dollars in the fourth quarter of 2008. One year later this had already increased to 13.16 billion dollars. Unfortunately the expectations are that this increase will not continue. As soon as the stimulus money of the American government is out of the market, it is expected that consumer expansion will decrease[46]. In April consumers trust in the economy greatly decreased. Index figures show that consumers lost is trust for example 73.6 in March to 69.5 in April. Although analysts thought that the trust would increase instead of decrease. According to research consumers are insecure about the weak labour market and their own job certainty. Beside this consumers lost their faith in the economic policy[47]. This was not the only change in March, the consumer price index also increased. In comparison with the previous month it increased by 0,1%[48]. 5.4.1.3 Africa This year the world cup will be held in South Africa. The success of the world cup is crucial for the economy of the country. At the moment Africa is one of the world’s poorest inhabited continents. Like other countries in the world, South Africa also suffered from the worldwide recession last year. The economy decreased in 2009 by 1,8% and 900,000 jobs were lost. However the minister of Finance expects a growth in 2010 of 2.3% largely due to the world cup football. If predictions are correct the South African economy will be better in 2012. Also if we look at the figures of the years before 2008, this period saw the economy grow by 5% a year[49]. 5.4.1.4 Asia An article published in April 2010 predicted that upcoming economies in Asia would grow by 7.5% this year, a forecast from the Asian Development Bank (ADB). 85 Last year the GDP of Asia grew by 5.2%. For 2011 the ADB expects a growth of 7.3%. It is predicted that China will be the leader of these upcoming economies, with a growth in GDP of 9.6%. It is expected that china would first be followed by Azerbaijan with an increase (9.5%) and then India at (8.2%). Only the economy of Fiji will decrease this year. These positive figures are a result of the rising incomes and stimulation policies of the government. This will also result in an inflation growth of 4% in 2010. For 2011 a growth of 3.9% is expected.[50] 5.4.2 Social - cultural During internet searches about ocean noise, a lot of articles were found. Articles with the subjects such as: increasing of sea noise, stranding whales, increasing of offshore activities and so on. The following texts are a short preview of articles found: “Whale songs drowned out by human noise pollution”, is the title of an article posted on October 29, 2009 by LKBlog. The article writes about the increasing of sound pollution, and claims that this is not only confusing the mammals, but that it is also threatening the survival of these endangered animals. At one point cetaceans were able to communicate over thousands of miles and now they are losing touch with each other. This text is taken from a speech made by an expert during a conference in Rome. That same period, 100 governments were gathered in Rome for a meeting of the U.N.-backed Convention on the Conservation of Migratory Species of Wild Animals. The agenda of this meeting includes ways to increase protection for endangered species, including measures to mitigate under water noise[51]. Another article was found with the title: “Whale strandings sounding alarms in NZ & Italy”. This article was published on December 28, 2009 also by LKBlog. About 30 whales were stranded on Coromandel peninsula. Experts are studying cases like this. They believe that cetaceans are becoming beached as a direct result of an increase in sound pollution within the marine environment[52]. Human activities on oceans and seas are increasing; this results in an increase in sea noise. Take for example the offshore industry, in the last two years more offshore wells have been drilled than the rest of the decade combined. Between January 2008 and July 2009 35 on- and offshore wells were drilled, and this is only a short period[53]. Another example is seaborne transportation, in other words: shipping. “According to HELCOM, around 2000 ships are normally at sea at any time on the Baltic Sea [54].” The expectations are that this form of transportation will increase by 40% by the year 2017. 86 The last example article is about important progress in field of the legislation. Environment group IFAW posted on March 15, 2010 an article with the title: “Senator John Kerry introduces legislation to protect whales”. With this action the Senator John Kerry (D-MA) shows his commitment towards environmental conservations. The ‘International Whale Conservation and Protection Act of 2010’ addresses major threats to whales including commercial whaling, ship strikes, entanglement in fishing gear, ocean noise, and climate change and reasserts the U.S. as a leader in whale conservation. Jeff Flocken, DC Office Director of IFAW, hopes that other Senators will follow after this step. Elements of the legislation include: Promoting international efforts to conserve and protect the world’s whales throughout their range. Strengthening the whale conservation and protection efforts of relevant international organizations including the United Nations Convention on the Conservation of Migratory Species of Wild Animals, the International Whaling Commission (IWC), the Convention on International Trade in Endangered Species (CITES), and the International Maritime Organization. Ensuring that the IWC commercial whaling ban is neither lifted nor weakened and that the related illegal and lethal scientific whaling is ended. Reducing and, where possible, eliminating sources of human caused death, injury, harassment and disturbance of the world’s whales. Initiating and expanding research to improve our understanding of the world’s whales including health and reproduction, whale habitats and the impacts of human activities and other threats to whales [55]. Nowadays it is more and more important for the society that people and companies are environmentally responsible. There are legal environmental requirements and regulations for companies. Environment Companies are required to take care of their activities, to cause less harm to the environment. For example by taking care of their refuse in addition to conserving natural resources and reducing the amount of greenhouse gases expelled from their activities. An environment-friendly management system seems expensive in the short term, although it will pay off on the long term. It will improve the competitive position of companies on the market. 87 Employees With regards to employees companies have obligations. It is their job to prevent discrimination at work. Beside that the work surroundings have to be safe and healthy for employees. Voluntary action All companies have to satisfy to the minimum legal requirements, although thinking ahead can improve their position on the market. It will contribute to a better competitive position, making company activities more long lasting and also increasing the chance of economic success on the long term [56]. Justifying undertaking is crucial to build faith, trade and globalisation [57]. 5.4.3 Political-juridical Companies are having a big influence on the environment. This influence is the most important reason why they have to conform to a lot of EU environmental restrictions. Examples of restrictions are in air quality, chemical matter and waste management. The EU has setup an environment programme, consisting of six aspects to protect the environment. The six aspects are: Less pollution Suppression of climate change Maintenance of bio-diversity Respecting natural resources Minimising amount of greenhouse gases expelled Taking responsibility for the disposal of chemical matter 5.4.4 Customer analysis There are three kinds of businesses which are interesting for the LAB to focus on. Firstly the windmill industry: 5.4.4.1 Windmill industry Two European innovators worked together to create wind turbines that can float on the ocean’s surface. One of the innovators is a company from Norway, Norsk Hydro, and the other one is from Germany, Siemens [57]. Norsk Hydro Hydro is a Norwegian energy group, a major energy producer. Hydro’s 88 energy expertises are: - Comprising both energy production and trading - Is vital to us in our role as the biggest aluminium producer in Europe - It is crucial that we assess the likelihood of constancy in the regulations governing new projects The mission of Hydro is to contribute to a more viable society. This means that they lead the creation of conditions that help others develop and progress. Our mission implies certain values which govern our behaviour, both as individuals and as organization. The mission leads to the values: courage, respect, cooperation, determination and foresight. Hydro is aware of the climate change on the planet, from emissions of greenhouse gases. That is the reason why the company committed to create systems and technologies to reduce those emissions. Siemens Siemens is a German engineering company with a straight and clear mission. They want to find the best way of combining and developing their know-how and expertise, so that they can profitably channel them into outstanding value for customers. Highest performance with the highest ethics, this is in one sentence the value of the company. Although they have three other words which are important: responsible, excellent, and innovative. Responsibility is important because of the commitment to ethical and responsible actions. They want to be excellent in high performances and results, and being innovative to create sustainable value [59]. 5.4.4.2 Oil/gas industry The oil and gas industry is comprised of a few large companies which are operating worldwide. Beside these big companies there are a lot smaller companies. In other words: the oil/gas industry comprises a lot of companies. The question is, which organisations are potential customers for the LAB? Shell Shell is a global energy and petrochemical company. The aim of the company is to meet the energy needs of society, in ways that are economically, socially and environmentally viable, now and in the future. Sustainable development is integrated in the organisation of Shell. The main activity is to help meet the world’s growing energy needs, although this is a damaging activity for the environment. Shell tries to reduce impacts of their operations, including tackling greenhouse gas emissions. As a global energy company they set high standards of performance and ethical behaviours. Shell is aware of the fact that there reputation is 89 depending by how they live up to their core values: honestly, integrity and respect for people. People judge on the way the company act. The strategy of Shell is: “More upstream, profitable downstream”. They are focusing on delivery and growth, leveraging their strong portfolio[60]. BP Like shell, BP is a global energy and petrochemical company. The company wants to be recognized as a great organisation, competitively successful and a force for progress. They believe that they can make a difference in the world, by helping the world meet its growing need for heat, light and mobility. The activities are on a way that it is affordable, secure and doesn’t damage the environment. The values of the company are: progressive, responsible, innovative and performance driven. Progressive; in the way they build relationships. For the company it is not only important to build on a good relationship between employees, but also with their partners and customers. They believe in the principle of mutual advantage. Responsible; the company feels responsible for the safety and development of their employees and the communities and societies in which they operate. Innovative; they push boundaries today and create tomorrow’s breakthroughs through their people and technology. Performance driven; they deliver on their promises through continuous improvement and safe, reliable operations. The strategy of BP is separated into three fields: - Explore for, develop and produce more fossil fuel resources that the world needs. - Efficiently manufacture, process and deliver better and more advanced products. - Be a material contributor to the transition to a low-carbon future. They want to strengthen their position further by securing new access and achieving exploration success [61]. Hess Hess is a leading global independent energy company, engaged in the exploration and production of crude oil and natural gas, as well as in refining and in marketing refined petroleum products, natural gas and electricity. The vision of the company is to maximize shareholders value by enhancing financial performance and providing long-term profitable growth. They are committed to meet the highest standards of corporate citizenship by protecting the health and safety of 90 their employees, safeguarding the environment and creating a long-lasting, positive impact on the communities in which they do business. The company has operations worldwide. The countries they are operating are: the United States, United Kingdom, Norway, Denmark, Russia, Equatorial Guinea, Algeria, Libya, Gabon, Egypt, Ghana, the Joint Development Area of Malaysia and Thailand, Indonesia, Thailand, Azerbaijan, Australia, Brazil and St. Lucia. The marketing and refining objective is to maximize financial returns from existing assets. The Company operates about 1,360 Hess branded sites in 16 states along the East Coast of the United States. They continue to selectively expand our HESS EXPRESS convenience store network. The HOVENSA refinery in the United States Virgin Islands, a joint venture between a subsidiary of Hess Corporation and a subsidiary of Petroleos de Venezuela, S.A. (PDVSA), is one of the largest crude oil refineries in the world. Refined petroleum products, as well as natural gas and electricity, are marketed to customers throughout the East Coast of the United States. This integrated approach to marketing allows the Company to meet the total energy needs of our customer base while maintaining a low-cost operating base. They have a strong leadership team and a global organization, implementing a focused strategy that is positioning Hess Corporation for long-term financial performance. The values of the company are: integrity, performance, social responsibility, independent spirit and value creation [80]. Maersk Maersk group is a global company, which operates in 130 countries and has a workforce of 120,000 employees. In addition to owning one of the world’s largest shipping companies, they are involved in a wide range of activities in the energy, logistics, retail and manufacturing industries. The values form a guiding principle for behaviour, decision making and interaction, a set of fundamental shared beliefs. Constant care, take care of today, actively prepare for tomorrow. Humbleness, listen, learn, share, and give space to others. Uprightness, our word is our bond. Our Employees, the right environment for the right people. Our Name, the sum of our values: passionately striving higherc[81]. One of the business areas is oil; Maersk Oil. This branch of the company is specialized in offshore oil and gas production. The values of Maerks Oil are the same as the other branches of the company, although the objectives are not. It is Maersk Oil’s objective to identify, control and minimize emissions, discharges and wastes from exploration and production activities. Offshore oil and gas production can affect the environment 91 in various ways; for example, offshore energy requirements are normally provided by the combustion of natural gas, which results in emissions to the atmosphere. Another example is the water, produced with oil and gas, which is discharged to sea after cleaning. Because of the damaged offshore oil and gas production can cause feels the company committed to protect the environment and places high priority on environmental considerations. Through constant care – careful use of resources, optimization of operations, and handling of waste streams – minimize the environmental impact of activities. Beside that the company strives for continental improvement in the environmental performance and pollution prevention across all the activities. This involves openness, environmental awareness, and the application of environmentally-friendly technologies. 5.5 SWOT-analysis To indicate the relevance of the strengths, weaknesses, opportunities and threats is worked with marks. The higher the mark, the more important the strength, weakness, opportunity or threat is. 1 = Less than average 2 = Average 3 = More than average 5.5.1 Strengths Relevance S1: Clear objectives and a clear mission S2: Protecting the marine environment 5.5.2 Weaknesses W1: Not yet a price definition for the AAB W2: A lack of financial sources W3: Factory also produces for other companies W4: Product needs still some improvements 5.5.3 Opportunities O1: Increasing of interest in the problem O2: Because we past the worst part of the recession, there is space for other problems O3: Environmental responsibility is important for society 92 Section O4: Big companies are trying harder to be environmentally responsible 5.5.4 Threats T1: Companies aren’t obligated to protect the marine T2: It is hard to get attention from companies 5.6 Confrontation matrix The strengths, weaknesses, opportunities and threats from the last chapter are presented in the confrontation matrix below. A confrontation matrix provides insight into the possibilities to combine strengths and weaknesses with opportunities and threats. One plus (+) indicates a relative context between strength 1 and opportunity 1, for example. The blue colour indicates a strong correlation between the selected points. A strong correlation between two points can be the basis for a strategic strategy, to give direction to the company. Table 16 Confrontation matrix Weaknesses Strenghts Opportunities ++ + -- Threats O1 (3) O2 (3) O3 (2) O4 (3) T1 (1) T2 (3) S1 (2) + - - - -- + S2 (3) ++ + ++ ++ ++ + W1 (3) + + - - -- ++ W2 (3) ++ + + + + + W3 (2) + -- -- + -- -- W4 (1) + + -- ++ -- + Relatively high context Relative context No relative context No relative context at all 5.6.1 Strategic option 1 S2 + O1 or O4 = take advantage of the strength and opportunity S2: Protecting the marine environment O1: Increasing of interest in the problem O4: Big companies are trying harder to be environmentally responsible 93 A strength of the LAB is the desire to protect the marine environment. For the society it is more and more important that companies are operating in an environmentally responsible way. This is a result of the deterioration of the environment, and the predictions that it will be worse if nothing were to change. This opportunity indicates that there is a market for the AAB. From this point it is important to take advantage of the opportunity; “Big companies are trying harder to be environmentally responsible”. By offering companies a solution to be environmentally responsible with the marine environment. The first step is to make contact with potential customers. There are a lot of different marketing-communication instruments to communicate with customers. For example: public relations, advertising, direct marketing, sponsoring, fairs, in storecommunication or personal sales. Because of the lack of financial resources it is not possible to use different kinds of marketing communication instruments. Direct marketing and personal sales are two marketing tools that could be used to get the right result, without high costs. For the content of the message is it important to focus on the advantages for the company. The post brings everyday a lot of advertisement letters and flyers. This results decreased interest from receivers. However, receivers of addressed mail will read the letter or flyer more carefully. This is an important advantage of direct marketing. The LAB could send potential customers a letter, with information about the solution they offer to protect the marine environment against ocean noise. This letter should be sent including with the flyer of the AAB, also with a request to come to their company to give a short presentation about the product and what the advantages are for the company. The presentation is an example of personal sales. An important advantage of personal sales is the opportunity to customize the story to the needs of the customer, answer their question immediately and take away their uncertainties. 5.6.2 Strategic option 2 W1 + T2 = Avoid or pull back W1: Not yet a price definition for the AAB T2: It is hard to get attention from companies Nowadays it is hard to get attention from companies, especially from big companies who are operating worldwide. Without complete information it is even harder to get their attention. Before further contact with companies it is recommended to define a price for the AAB. There are two different price strategies that are recommended for the LAB: Skimming pricing and penetration pricing. Skimming pricing means that the product would be introduced on the market with a high price. As soon as the sales are decreasing, the price would be slightly reduced. Penetration pricing is the opposite. Firstly, the product 94 is introduced into the market with a low price to attract customers. Afterwards, the company will slightly raise the price. 5.6.3 Strategic option 3 W2 + O1 = Improve or transform weaknesses into strength W2: A lack of financial sources O1: Increasing of interest in the problem An increasing of interest in ocean noise can influence the position of the LAB positively. Although, the LAB doesn´t have any brand awareness at the moment. As long as the potential customer doesn´t know about the existing of the company, they will not sell anything. That is the reason why it is important to get brand awareness. Marketing is a tool that would generate awareness by potential customers. Because of the weakness, a lack of financial sources, it is not easy to create a marketing campaign. These weaknesses should be first improved or transformed into a strength. Improving the weakness into a strength would give the LAB a stronger position. There is one marketing-communication instrument that is suitable to implement strategic option 3, Public Relations (PR). With PR it is possible to generate free publicity. To create free publicity it is important to get attention from journalists from papers and trade journals. As soon as they write about the idea of the LAB and its product, it will result in brand awareness in the market. Followed by an increased interest from potential customers, what can result in demand of the AAB. 5.7 Chosen strategy After a lot of research and with help from the confrontation matrix, it is recommended to choose strategic option 1, “take advantage of the strength and opportunity”. In this chapter an example of the direct communication and the personal sales is presented. 95 5.7.1 General letter Dear Sir / Madam, I am the head of the Laboratory of Applied Bioacoustics of the Technical University of Catalonia, in Spain. Our laboratory main objective is the development of technological solutions to balance the effects of anthropogenic sound sources on the marine environment and to provide interested parties with real-time mitigation tools when faced with the necessity of detecting, identifying and localizing sound sources, in particular cetacean acoustic signals, in areas of interest. Geophysical prospection is often associated with the production of loud noise that may have a detrimental effect of near-by individual cetaceans. The challenge in this situation is to be able to monitor the presence of these animals continuously and immediately determine the actions to be undertaken. Our laboratory has developed a totally automated system that is supported by lowcost autonomous buoys that can be deployed during seismic surveys. These buoys are radio-linked to the operating vessels and transmit in real-time the position and movement of any individual cetacean around the boat. We believe this system would allow your company to sustainably develop its market. I would be very happy to introduce to you and to your technical staff the characteristics of our system and answer any question you may have. Your sincerely, 96 5.7.2 Letter Maersk Every organisation and every company is different. To respond to the needs of the potential customer, it is important to customize the content of the message. The message should match the needs of the receiver to get their attention. The letter below is an example of a letter for the company Maersk. Dear Sir / Madame, This letter is not written to blame you for your activities in the marine environment. It is also not our intention to disturb your work, in comparing to activists. However, we did write this letter to offer you a solution to reduce the damage of your activities to make sure that you can continue your businesses. Not only for the short-term but also in the future. A solution without blames, high costs or negative publication. In spite of these negative points, the solution to decrease excessive sea noise could give you advantages. Information on your website showed that you already made some efforts to purchase low-noise technology. It is a good start, unfortunately it doesn’t solve the problem completely. Like you, also the government, activists and the society are spending more and more time on the problem. Consequently, they will introduce more areas as Marine Protected Areas. Areas which are important for your activities can be turned into a protected area. By introducing the Autonomous Acoustic Buoy, our solution for this problem, you will evade this result. We would love to sum up the benefits and give you an idea of the product during a short presentation at your office. Thinking ahead will give your company opportunities, a strong position on the market in comparing to competitors and more profit from the society. These are just a few examples of benefits. If you have any questions, don´t hesitate to contact us. We will call you next week to make an appointment. Your sincerely, 97 5.7.3 Presentation Personal sales are another marketing-communication instrument, which are recommended. In this chapter an example is presented of the layout for a presentation. It is important to use the same layout for all communication methods. If you use different layouts the customer will get confused. This is the reason that the layout of the website has been used for the presentation. 98 6. Conclusion Over the course of the EPS comprehensive progress has been made in the development of the AAB. Each team member has worked to the best of their abilities in order to achieve their individual goals. This has resulted in an efficient and dynamic team working together to successfully further advance and develop the Autonomous Acoustic Buoy. The research and analysis system produced in the Dolphin Whistles Analysis section will allow the LAB team to more accurately and efficiently Identify different species of Dolphins by the sounds they produce. Both the information collected and analysis performed will allow the LAB to improve their understanding of cetaceans abilities to communicate underwater. For future work a more comprehensive analysis system could be designed. For the electronics section, an efficient watchdog system has been designed and manufactured. This will allow the Autonomous Acoustic Buoy to become a self-reliant entity saving users from the need for direct intervention and thus time and money. The Watchdog system has been tested to be efficient in operation and can therefore be deemed as a success. However possible future improvements may include upgrading it by adding additional or more accurate sensors as well as software improvements. CAD simulations carried out over the course of the project have enabled conclusions to be drawn about the overall stability of the Autonomous Acoustic Buoy. This has been carried out using both Computer software and theoretical calculations. In addition to initial requirements a computerised animation has also been produced in order to aid in the marketing presentation. In future a more detailed computer model could be simulated using software with greater processing capabilities; this would give a more accurate representation of the buoys behaviour. The Marketing section has produced a detailed Marketing plan despite having to overcome difficulties in sourcing detailed information. However due to a lack of financial resources and cooperation of interested parties it has not been possible to write an entire marketing campaign. If the LAB wish to be able to put the Buoy on the market in future they first need to sail the buoy and present to companies. This will enable them to achieve financial backing and therefore a presentation has been designed. Once financial backing has been achieved the remainder of the marketing campaign can be designed. Although further improvements have been outlined in this report these are minimal. Both the technical and analysis capabilities of the buoy have been significantly improved in addition to providing the LAB with guidance on how to enter the market. Overall the team is satisfied with the work undertaken and progress made. In addition the team have gone some way in helping the AAB to becoming the key to a sustainable solution for the protection of cetaceans against human activities in the marine environment. 99 7. References Books and publications: Electronics: [1] [2] [3] [4] [5] [6] [7] [8] [9] [10] Herbert Schildt, C The Complete Reference, by The McGraw-Hill Companies, Copyright © 2000, DOI: 10.1036/0-07-213295-7; John Catsoulis , Designing Embedded Hardware , by O'Reilly, Copyright © May 2005, ISBN: 0-596-00755-8; Daniel Benito, Ubeydullah Isik, Scott Nelson, Stefan Scharner, Kamila Wojciechiwska, Priscilla Wolf, THE AUTONOMOUS ACOUSTIC BUOY, Final Report 2009. Jack G. Ganssle, Great Watchdog, Version 1.2, updated January 2004; Diamond System Corporation, Hercules II – EBX User Manual, 2006. Stefan Scharner, Scott Nelson, Dani Benito, Priscilla Wolf, Kamila Wojciechowska, Ubeydullah Isik: The Autonomous Acoustic Buoy, 2009, pp.10-12. J. Koller, J. Koppel, P. Wolfgang, “Offshore Wind Energy, Research on environmental impacts”, Spinger. W.C. Verboom, R.A. Kastelein, “Some examples of marine mammal discomfort thresholds’ in relation to man-made noise”, 2005. W.J. Richardson, C.R. Greene, C.I. Mame, D.H. Thomson, “Marine mammals and noise”, 1995. M. Simmonds, S. Dolman, L. Weilgart, “Oceans of noise”, 2003. Biouacoustics: [11] [12] [13] [14] [15] [16] Emily T. Griffiths, The repertoire analysis of the short-beaked common dolphin, Delphinus delphis, from the Celtic Deep and the Eastern Tropical Pacific Ocean, 2009 Ramon Ferrer-i-Cancho, and Brenda McCowan, A Law of Word Meaning in Dolphin Whistle Types, 2009 Melissa Sue Soldevilla, Risso’s and Pacific White-sided Dolphins in the Southern California Bight: Using Echolocation Clicks to Study Dolphin Ecology, 2008 Alexandre Gannler, Sandra Fuchs, Odlle Gannler, Julle N. Oswald, Acoustic identification of nine delphinid species in the Eastern Tropical Pacific Ocean, 2003; Lammers MO Au WWL and Herzing DL., The broadband social acoustic signaling behavior of spinner and spotted dolphins, 2002 Julie N. Oswald, Jay Barlow, Thomas F. Norris, Acoustic identification of nine delphinid species in the Eastern Tropical Pacific Ocean, 2003 100 [17] [18] [19] [20] J.N. OSWALD, S. RANKIN AND J. BARLOW, First description of whistles of Pacific Fraser's dolphins, Lagenodelphis Hosei, 2007 Sofie M. Van Parijs, Guido J. Parra and Peter J. Corkeron, Sounds produced by Australian Irrawaddy dolphins Orcaella brevirostris, 2000 Rachel Smolker and John W. Pepper, A Law of Word Meaning in Dolphin Whistle Types, 1999 M. Scheer, B. Hofmann and I. P. Behr, Vocalization of free-ranging Shortfinned pilot whales of Tenerife: signal repertoire and characteristics, 2003 Datasheets and userguides: Electronics: [21] [22] [23] [24] [25] [26] [27] [28] [29] [30] [31] [32] HB User Manual , Diamond Systems, Mount View CA 2006 Pic Kit3 Userguide; µA78M00 SERIES POSITIVE-VOLTAGE REGULATORS SLVS059K – JUNE 1976 – REVISED FEBRUARY 2003 DATASHEET Low Voltage, 1.15 V to 5.5 V, 4-Channel, Bidirectional Logic Level Translator datasheet Datasheet SHT7x (SHT73, SHT75) Humidity and Temperature Sensor Adapter board description UM0395 Datasheet MICROCHIP PIC18F2525/2620/4525/4620 datasheet MC14504B Hex Level Shifter for TTL to CMOS or CMOS to CMOS datasheet MAXIM +5V-Powered, Multichannel RS-232 Drivers/Receivers 194323; Rev 11; 2/03 datasheet FM TRANSMITTER & RECEIVER HYBRID MODULES datasheet BGA6289 MMIC wideband medium power amplifier datasheet LIS3LV02DL MEMS inertial sensor 3-axis - ±2g/±6g digital output low voltage linear accelerometer datasheet Web pages: Electronics: [33] [34] [35] [36] [37] [38] [39] [40] [41] [42] www.microchip.com, March 2010; www.sensirion.com, March 2010; www.fairchildsemi.com April 2010; www.st.com, April 2010; www.semiconductors.philips.com, April 2010; www.rfsolutions.co.uk , April 2010; www.sonsdemar.eu , April 2010; http://en.wikipedia.org/wiki/Interrupt April 2010; http://www.sonsdemar.eu/, March 2010 http://www.lab.upc.es/, May 2010 101 [43] http://www.epsevg.upc.edu/eps/index.asp, April 2010 Marketing: [44] [45] [46] [47] [48] [49] [50] [51] [52] [53] [54] [55] [56] [57] [58] [59] [60] http://www.express.be/business/nl/economy/rusland-wordt-grootsteeconomie-van-europa-tegen-2030/120499.htm, April 2010 www.express.be/business/nl/economy/europese-economie-blijft-totmidden-2012-zwak/124752.htm, April 2010 http://www.rtl.nl/(/financien/rtlz/nieuws/)/components/financien/rtlz/ 2010/weken_2010/08/0226_1430_Economie_Amerika_groeit_bijna_6_ procent.xml, April 2010 http://www.rtl.nl/(/financien/rtlz/nieuws/)/components/financien/rtlz/ 2010/weken_2010/15/0415_1625_Consumentenvertrouwen_VS_daalt. xml, April 2010 http://www.rtl.nl/(/financien/rtlz/nieuws/)/components/financien/rtlz/ 2010/weken_2010/15/20100414.1449.Consumentenprijzen-VS-stijgenmarginaal-in-maart.xml, April 2010 http://www.zuidafrika2010.net/index.php?option=com_content&view= article&id=165:wk-voetbal-2010-helpt-zuid-afrika-uit-recessie&catid=50:economie-wk2010&Itemid=82, April 2010 http://www.z24.nl/economie/artikel_132419.z24/_Opkomende_landen _Azie_groeien_dit_jaar_7_5_procent_.html, April 2010 http://mendocoastcurrent.wordpress.com/2009/10/29/whale-songsdrowned-out-by-human-noise-pollution, April 2010 http://mendocoastcurrent.wordpress.com/2009/12/28/whalestrandings-sounding-alarms-in-nz-italy , April 2010 http://www.stuff.co.nz/business/industries/3059510/New-Zealand-setfor-an-oil-bonanza, May 2010 http://www.balticsea2020.org/index.php?option=com_content&view=a rticle&id=128&Itemid=87&lang=en, May 2010 http://www.ifaw.org/ifaw_european_union/media_center/press_releas es/3_15_2010_60875.php, May 2010 http://ec.europa.eu/youreurope/business/doing-businessresponsibly/index_nl.htm, April 2010 http://ec.europa.eu/enterprise/policies/sustainablebusiness/index_nl.htm http://www.dw-world.de/dw/article/0,,2649035,00.html, April 2010 https://www.swe.siemens.com/belux/portal/en/about/Pages/mission_s tatement.aspx, April 2010 http://www.shell.com/home/content/environment_society/environme nt/biodiversity/dir_biodiversity_000407.html, April 2010 Bioacoustics: 102 [61] [62] http://www.dolphincommunicationproject.org/main/index.php?option =com content&view=article&id=143&Itemid=176 , June 2010 www.wikipedia.com , May 2010; Cad Simulation [63] http://www.solidworks.com/sw/products/cad-software-3d-design.htm , 20/03/10 [64] http://www.ansys.com/products/default.asp, 20/03/10 [65] http://www.plm.automation.siemens.com/en_us/products/nx/simulati on/mechanical_simulation/index.shtml, 20/03/10 [66] http://usa.autodesk.com/adsk/servlet/pc/index?siteID=123112&id=137 73836, 20/03/10 [67] http://www.ansys.com/products/default.asp, 20/03/10 [68] http://www.adina.com/products.shtml, 20/03/10 [69] http://www.3ds.com/fileadmin/PRODUCTS/CATIA/OFFERS/CATIAANALYSIS/PDF/CATIA-Analysis-brochure.pdf, 20/03/10 [70] [71] [72] [73] [74] [75] [76] www.hydrology.rice.edu/ceve101/Handouts/IntroFluids.ppt 11/05/10 http://www.oceanweather.com/forecast, 04/03/10 http://usa.autodesk.com/adsk/servlet/pc/index?siteID=123112&id=137 www.hydrology.rice.edu/ceve101/Handouts/IntroFluids.ppt, 11/05/10 http://www.sailingusa.info/formula.htm Climatology of Surface and Near-bed Temperature and Salinity on the North-West European continental Shelf for 1971–2000 Barbara Berx , Sarah L. Hughes Rousmaniere, John The Annapolis Book of Seamanship Boat Selection. Chapter 1 p35 Simon & Schuster, New York, New York. [77] K. Adlard Coles' and Peter Bruce's (editors) Adlard Coles' Heavy Weather Sailing (30th edition) Stability of Yachts in large breaking waves. Chapter 2 p11-23 International marine, Camden, Maine. [78] [79] [80] [81] www.hydrology.rice.edu/ceve101/Handouts/IntroFluids.ppt 11/05/10 Autodesk Algor Help Guide 2010 http://www.hess.com/company/default.aspx http://www.maersk.com/AboutMaersk/WhoWeAre/Pages/WhoWeAre. aspx 103 8. Appendix Appendix 1: Geographic location table Table 17: Geographic location list of species abundance in the Atlantic region section and the corresponding areas of examination of a given specie Area of examination Bottlenose dolphin Geographic location 104 105 Striped dolphin Risso’s dolphin 106 Atlantic spotted Common dolphin 107 Short-beaked common dolphin Table 18: Geographic location list of species abundance in the Pacific region section and the corresponding areas of examination of a given specie Area of examination Short-beaked common dolphin Bottlenose dolphin Geographic location 108 109 Pantropical spotted dolphin False killer whale 110 Short-finned pilot whale Long-beaked common dolphin 111 Striped dolphin Rough-tooth dolphin 112 Pacific Fraser's dolphin Spinner dolphin 113 Irrwaddy dolphin Appendix 2: Whistle parameter comparison graphs 1,20 Duration 1,11 1,08 1,01 1,00 0,97 0,80 0,73 Time [s] 0,71 0,76 0,74 0,65 0,62 0,60 0,47 0,40 0,44 0,38 0,31 0,29 0,27 0,20 0,18 0,14 0,00 Bottlenose dolphin Risso's dolphin Striped dolphin Common dolpin Atlantic spotted dolphin Fig. 76 Whistle duration values with their SD values considered for Atlantic region section 114 Short-beaked dolphin 16,00 Mean frequency 14,08 14,00 13,23 12,00 13,02 11,82 10,88 10,91 10,00 Frequency [kHz] 12,90 12,30 10,48 11,91 10,90 9,74 9,49 8,53 8,79 8,65 8,90 8,00 7,15 6,00 4,00 2,00 0,00 Bottlenose dolphin Risso's dolphin Striped dolphin Common dolpin Atlantic spotted dolphin Fig. 77 Whistle mean frequency values with their SD values considered for Atlantic region section 115 Short-beaked dolphin 18,00 Start point 16,00 15,68 15,37 14,03 14,00 Frequency [kHz] 12,00 12,04 14,44 11,96 11,75 10,91 10,00 9,99 8,89 8,00 6,00 8,55 7,82 7,39 5,96 5,73 4,00 2,00 0,00 Bottlenose dolphin Risso's dolphin Striped dolphin Common dolpin Fig. 78 Whistle start point values with their SD values considered for Atlantic region section 116 Short-beaked dolphin 18,00 End point 16,00 15,62 15,40 14,82 15,29 14,00 Frequency [kHz] 12,00 12,08 11,88 11,82 11,92 12,08 9,02 8,87 10,00 8,61 8,00 8,36 8,02 6,00 5,14 4,00 2,00 0,00 Bottlenose dolphin Risso's dolphin Striped dolphin Common dolpin Fig. 79 Whistle end point values with their SD values considered for Atlantic region section 117 Short-beaked dolphin 14,00 Minimum frequency 12,00 11,80 Frequency [kHz] 8,00 10,47 10,31 10,00 9,71 8,11 9,61 8,53 8,29 8,60 7,87 7,10 6,00 6,42 6,26 7,42 6,59 6,02 5,60 4,74 4,00 2,00 0,00 Bottlenose dolphin Risso's dolphin Striped dolphin Common dolpin Atlantic spotted dolphin Fig. 80 Whistle minimum frequency values with their SD values considered for Atlantic region section 118 Short-beaked dolphin 20,00 Maximum frequency 18,77 18,00 17,92 17,66 17,00 16,67 16,00 15,85 14,65 15,16 14,50 14,00 13,15 12,72 Frequency [kHz] 14,53 12,00 11,38 12,00 11,55 11,40 10,45 10,00 8,77 8,00 6,00 4,00 2,00 0,00 Bottlenose dolphin Risso's dolphin Striped dolphin Common dolpin Atlantic spotted dolphin Fig. 81 Whistle maximum frequency values with their SD values considered for Atlantic region section 119 Short-beaked dolphin Chart Title 2,50 2,00 1,50 1,00 0,50 0,00 ShortLongPantropica Bottlenose beaked False killer beaked l spotted dolphin common whale common dolphin dolphin dolphin Shortfinned pilot whale Roughtooth dolphin Striped dolphin Spinner dolphin Pacific Fraser's dolphin Irrwaddy dolphin Irrwaddy dolphin min 0,70 0,40 0,20 0,50 0,30 0,10 0,20 0,50 0,20 0,00 0,18 0,29 mean 1,40 0,80 0,40 0,90 0,70 0,40 0,60 0,80 0,60 0,46 0,20 0,30 max 2,10 1,20 0,60 1,30 1,10 0,70 1,00 1,10 1,00 1,16 0,22 0,31 Fig. 82 Whistle duration values with their SD values considered for Pacific region section 120 18,00 Start point 16,00 15,80 14,80 14,00 14,00 13,70 13,90 13,80 12,40 12,00 11,90 11,20 10,00 9,80 10,10 9,50 8,00 7,50 7,40 6,60 6,00 6,60 5,90 9,00 6,80 6,20 10,40 10,20 9,70 7,10 7,00 6,50 6,00 5,20 4,40 4,00 4,50 3,90 4,30 3,00 2,00 2,60 1,90 1,30 Fig. 83 Whistle start point values with their SD values considered for Pacific region section 121 Irrwaddy dolphin Irrwaddy dolphin Pacific Fraser's dolphin Spinner dolphin Striped dolphin Rough-tooth dolphin Short-finned pilot whale Long-beaked common dolphin Pantropical spotted dolphin False killer whale Short-beaked common dolphin Bottlenose dolphin 0,00 25,00 End point 20,50 20,00 18,60 17,40 15,30 15,00 16,00 15,30 14,80 14,10 12,70 10,00 10,10 9,00 7,50 10,40 9,80 9,60 9,20 8,50 7,30 5,80 4,30 5,30 5,00 12,00 11,60 11,40 13,90 12,40 5,50 8,80 6,20 5,40 4,30 3,00 1,70 4,10 2,00 1,20 Fig. 84 Whistle end point values with their SD values considered for Pacific region section 122 Irrwaddy dolphin Irrwaddy dolphin Pacific Fraser's dolphin Spinner dolphin Striped dolphin Rough-tooth dolphin Short-finned pilot whale Long-beaked common dolphin Pantropical spotted dolphin False killer whale Short-beaked common dolphin Bottlenose dolphin 0,00 14,00 Minimum frequency 13,30 12,00 11,60 11,00 10,00 9,90 9,70 9,60 9,90 9,70 9,10 8,80 8,20 8,00 7,40 7,70 7,40 6,50 6,00 5,90 5,20 5,10 8,70 8,10 5,50 6,60 6,50 6,30 5,90 4,70 4,00 3,60 3,50 4,40 4,50 3,20 3,10 3,80 2,00 2,00 1,70 1,30 Fig. 85 Whistle minimum frequency values with their SD values considered for Pacific region section 123 Irrwaddy dolphin Irrwaddy dolphin Pacific Fraser's dolphin Spinner dolphin Striped dolphin Rough-tooth dolphin Short-finned pilot whale Long-beaked common dolphin Pantropical spotted dolphin False killer whale Short-beaked common dolphin Bottlenose dolphin 0,00 Maximum frequency 25,00 20,00 15,00 10,00 5,00 0,00 ShortLongPantropic Bottlenos beaked False killer beaked al spotted e dolphin common whale common dolphin dolphin dolphin Shortfinned pilot whale Roughtooth dolphin Striped dolphin Spinner dolphin Pacific Fraser's dolphin Irrwaddy dolphin Irrwaddy dolphin min 14,10 10,20 4,60 15,70 11,30 1,90 6,10 11,30 10,20 14,67 3,10 2,80 mean 17,20 13,60 6,10 18,70 15,50 6,10 9,10 14,80 13,70 14,90 4,20 4,20 max 20,30 17,00 7,60 21,70 19,70 10,30 12,10 18,30 17,20 15,13 5,30 5,60 Fig. 86 Whistle maximum frequency values with their SD values considered for Pacific region section 124 Appendix 3: Autodesk Algor Buoy data Table 19 Autodesk Algor Buoy data Model Information Volume (mm³) Center of Gravity (mm) 117850000 Mass Moment of Intertia (N*s²*mm) Xc (mm) 250.52 Yc (mm) 315.72 Zc (mm) 451.19 Weight (N) 1519.6 Mass Product of Intertia (N*s²*mm) Ixy Ixx (N*s²*mm) 145750 (N*s²*mm) Ixz Iyy (N*s²*mm) 120290 (N*s²*mm) Iyz Izz (N*s²*mm) 74677 (N*s²*mm) Part Information Part 1 < BOUY-FINAL: Counter weight > 2 < BOUY-FINAL: finalmast_Default > 3 < BOUY-FINAL: finalmast_Default > 7 < BOUY-FINAL: boje2_Default > 8 < BOUY-FINAL: boje2_Default > Volume (mm³) Weight (N) Xc (mm) Yc (mm) Ixx (N*s²*mm) Iyy (N*s²*mm) Izz (N*s²*mm) Ixy (N*s²*mm) Iyz (N*s²*mm) 5970400 76.98 252.06 -425.14 3389.1 2419.2 1993.8 -841.86 -1368.3 1541400 19.87 242.34 1443.4 6136.1 2035.8 4451.8 708.36 2801.1 7163900 92.37 248.43 1606.3 32659 7145.9 26783 3755.7 12522 13549000 174.69 258.42 228.06 2285.1 2750.7 3237.1 1049 -42.92 89628000 1155.6 249.53 255.77 101280 105940 38211 7533.5 16727 125 Appendix 4: MES RIKS Analysis report Analysis Autonomous accoustic buoy Author: Andrea Johnson Department: N/A Created Date: 31/05/2010 Model Information Analysis Type - MES Riks Analysis Units - Custom - (N, mm, s, °C, K, V, ohm, A, J) Model location - C:\Users\Andrea\Desktop\life stage 2.fem Design scenario description - Design Scenario # 3 Analysis Parameters Information Table 20: Multiphysics Information Default Nodal Temperature 0 °C Table 21 Processor Information Event Duration s Capture Rate 1 /s Analysis Type Static Postbuckling and Collapse (RIKS) Acceleration Due To Body Force 0 mm/s² X Mutiplier 0 Y Mutiplier 0 Z Mutiplier -1 Load Curve Number for Gravity Load 1 Type of Shell Pressure Loading None 126 Load Curve Number for Shell Pressure Loads Smooth Shell Pressure No Hydrostatic Pressure Control for Shell Elements None Z Coordinate Datum for Hydrostatic Pressure mm Weight Density of Fluid Causing Shell Hydrostatic Pressure N/mm³ Nodal Temperature Time-Variation Load Curve Index 1 Where On Disk Is Nodal Temperature Data Stored No thermal Data Temperature Data File None Output Results of All Time Steps No Output Results of All Time Steps With Wall Interaction No Calculate and Output Strains No Output Reaction Forces Calculated Number of time steps 1 Initial Time Step Size 1s Nonlinear Iterative Solution Method Combined Newton Maximum Number of Iterations 15 Convergence Criteria Displacement Displacement Tolerance 1e-4 Force Tolerance 1e-15 127 Line Search Convergence Tolerance 0.5 Number of Time Steps Between Iterations 1 Number of Time Steps Between Reforming Stiffness Matrix 1 Time Integration Methods Suggested for Type of Analysis Static: NLS, LS Parameter for MES Integration Method First Parameter for LS Integration Method 0.50 Second Parameter for LS Integration Method 0.25 Output interval 1 Starting Time for Event 0s Interval to save restart data. Last step only. Resume from Step 0 Resume/Extend Run No Time Step Number Extension 0 Use A Constant Time Step Size No Decrease Trigger: Rate of convergence Unknown Value Decrease Trigger: Allow for Non-monotonic convergence Yes Decrease Trigger: Compressed Elements No Decrease Trigger: High Solution Tolerance Yes Time Step Change Factor 2 128 Increase Trigger: Number of Convergent Time Steps 4 Increase Trigger: Increment to Number of Convergent Time Steps 4 Apply Rayleigh Damping No Mass-related Rayleigh Damping Coeeficient 0.05 Stiffness-related Rayleigh Damping Coefficient 0.05 Direction of Centrifugal Load Axis Between Two Points Centrifugal Load Curve Multiplier 1 mm/s² Centrifugal Rotation RPM Load Curve Number for Centrifugal Load 1 X Coordinate of First Point of Axis 0 mm Y Coordinate of First Point of Axis 0 mm Z Coordinate of First Point of Axis 0 mm X Coordinate of Second Point on Axis 0 mm Y Coordinate of Second Point on Axis 0 mm Z Coordinate of Second Point on Axis 0 mm Time Step Data In Output File No Equation Numbers Data in Output File No Element Stiffness In Output File No Global Stiffness In Output File No 129 Displacement of Nodes In Output File No Velocity of Nodes In Output File No Acceleration of Nodes In Output File No Element Input Data in Output File No Nodal Input Data in Output File No Initial Condition Input Data In Output File No Printout Blocks Output To File No Mass Representation Lumped Matrix Reform Interval Within Each Time Step 1 Maximum Stiffness Reformations Per Interval 1 Number of Time Steps Between Reforming Stiffness Matrix 1 Avoid Bandwidth Optimization No Bandwidth Optimization Method Single Body Convergence tolerance 1E-6 Maximum Number of Iterations 1000 Number of processors All Run Static Analysis Yes Table 22 Load curve information Load Curve 1 Type Time 130 Load Curve 1 Index 1 Time 0 Load Curve 1 Index 1 Multiplier 0 Load Curve 1 Index 2 Time 1 Load Curve 1 Index 2 Multiplier 1 Table 23 Part Information Part ID Part Name Element Type Material Name 1 BOUY-FINAL: Counter weight Shell Plastic- Polycarbonate (Molded) 2 BOUY-FINAL: finalmast_Default Shell Plastic- Polycarbonate (Molded) 3 BOUY-FINAL: finalmast_Default Shell Plastic- Polycarbonate (Molded) 7 BOUY-FINAL: boje2_Default Shell Plastic- Polycarbonate (Molded) 8 BOUY-FINAL: boje2_Default Shell Plastic- Polycarbonate (Molded) Element Properties used for: Table 24 BOUY-FINAL: Counter weight Element Type Shell Shell type General Material Model Isotropic 1st Integration Order Unknown Value 2nd Integration Order Unknown Value Thickness 10.1438 mm Midside Nodes Not Included 131 Element Normal X Coordinate mm Element Normal Y Coordinate mm Element Normal Z Coordinate mm Allow for overlapping elements No Table 25 BOUY-FINAL: finalmast_Default Element Type Shell Shell type General Material Model Isotropic 1st Integration Order Unknown Value 2nd Integration Order Unknown Value Thickness 9.9999 mm Midside Nodes Not Included Element Normal X Coordinate mm Element Normal Y Coordinate mm Element Normal Z Coordinate mm Allow for overlapping elements No Table 26 BOUY-FINAL: finalmast_Default Element Type Shell Shell type General Material Model Isotropic 132 1st Integration Order Unknown Value 2nd Integration Order Unknown Value Thickness 9.98655 mm Midside Nodes Not Included Element Normal X Coordinate mm Element Normal Y Coordinate mm Element Normal Z Coordinate mm Allow for overlapping elements No Table 27 BOUY-FINAL: boje2_Default Element Type Shell Shell type General Material Model Isotropic 1st Integration Order Unknown Value 2nd Integration Order Unknown Value Thickness 10 mm Midside Nodes Not Included Element Normal X Coordinate mm Element Normal Y Coordinate mm Element Normal Z Coordinate mm Allow for overlapping elements No 133 Table 28 BOUY-FINAL: boje2_Default Element Type Shell Shell type General Material Model Isotropic 1st Integration Order Unknown Value 2nd Integration Order Unknown Value Thickness 10.347 mm Midside Nodes Not Included Element Normal X Coordinate mm Element Normal Y Coordinate mm Element Normal Z Coordinate mm Allow for overlapping elements No Material Information Table 29 Plastic- Polycarbonate (Molded) -Shell Material Model Standard Material Source Autodesk Algor Material Library Material Source File C:\Program Files\Autodesk\Algor Simulation 2011\matlibs\algormat.mlb Date Last Updated 2004/09/30-16:00:00 Material Description None 134 Mass Density 1.31374002450777e-009 N·s²/mm/mm³ Modulus of Elasticity 2378.69126600378 N/mm² Poisson's Ratio .37 Shear Modulus of Elasticity 785.230118558373 N/mm² Fig. 87 Results Presentation Images ** Input initial conditions Initial conditions code . . . . . . . (ICON) = 0 EQ.0: Zero initial conditions EQ.1: Initial conditions are read EQ.2: Initial conditions are read from .PIN file EQ.3: Initial conditions are read from .INI file (but MODEX.eq.2 over-rides ICON) ** Element Part Data Element part number (Nonlinear) . . . . . . . = 1 3-D Shell Element Definition (Type 26) Number of elements . . . . . . . . . . .NPAR(2). . . = 2717 Analysis Type . . . . . . . . . . . . . .NPAR(3). . . = 2 eq.1, Linear or Material Nonlinearity Only eq.2, Total Lagrangian Formulation eq.3, Updated Lagrangian Formulation Max number of nodes for a element . . . .NPAR(7). . . = 4 135 Integration Order for Element Stiffness Matrice R direction . . . . . . . . . . . . . . . . . . . = 2 S direction . . . . . . . . . . . . . . . . . . . = 2 T direction . . . . . . . . . . . . . . . . . . . = 2 Number of Stress Output Tables . . . . .NPAR(13) . . = 0 eq.0, Output at Integration Points Number of Thickness Tables . . . . . . .NPAR(14) . . = 1 Material Model. . . . . . . . . . . . . .NPAR(15) . . = 1 eq.1, Linear Elastic Isotropic eq.2, Linear Elastic Orthotropic eq.3, Elasto-Plastic with Isotropic Hardening eq.4, Elasto-Plastic with Kinematic Hardening eq.5, Elasto-plastic with Multlinear IsotropicHardening eq.6, Elasto-plastic with Multilinear KinematicHardening eq.8, Mooney-Rivlin eq.9, Ogden eq.105, Viscoelastic Mooney-Rivlin eq.106, Viscoelastic Ogden Number of Different Sets of Material . .NPAR(16) . . = 1 Number of Material Constants per Set . .NPAR(17) . . = 0 Nodal Rotation Coordinate Guidance Vector: Number Direction Cosines 1 1.0000 0.0000 0.0000 2 0.0000 1.0000 0.0000 Material Properties Group No. 1 Mass Density . . . . . . . . . = 1.3137E-09 Young's Modulus (E) . . . . . = 2.3787E+03 Poisson's Ratio (Nu). . . . . = 3.7000E-01 Shear Shape Factor (Fs) . . . . = 1.2000E+00 Shear Modulus (G) . . . . . . . = 7.8523E+02 Element Thickness Data Node01 Node02 Node03 Node04 Set 1 1.000E+01 1.000E+01 1.000E+01 1.000E+01 ** 3-D Shell element data suppressed (use /PRELE to print) Element part number (Nonlinear) . . . . . . . = 3 136 3-D Shell Element Definition (Type 26) Number of elements . . . . . . . . . . .NPAR(2). . . = 4126 Analysis Type . . . . . . . . . . . . . .NPAR(3). . . = 2 eq.1, Linear or Material Nonlinearity Only eq.2, Total Lagrangian Formulation eq.3, Updated Lagrangian Formulation Max number of nodes for a element . . . .NPAR(7). . . = 4 Integration Order for Element Stiffness Matrice R direction . . . . . . . . . . . . . . . . . . . = 2 S direction . . . . . . . . . . . . . . . . . . . = 2 T direction . . . . . . . . . . . . . . . . . . . = 2 Number of Stress Output Tables . . . . .NPAR(13) . . = 0 eq.0, Output at Integration Points Number of Thickness Tables . . . . . . .NPAR(14) . . = 1 Material Model. . . . . . . . . . . . . .NPAR(15) . . = 1 eq.1, Linear Elastic Isotropic eq.2, Linear Elastic Orthotropic eq.3, Elasto-Plastic with Isotropic Hardening eq.4, Elasto-Plastic with Kinematic Hardening eq.5, Elasto-plastic with Multlinear IsotropicHardening eq.6, Elasto-plastic with Multilinear KinematicHardening eq.8, Mooney-Rivlin eq.9, Ogden eq.105, Viscoelastic Mooney-Rivlin eq.106, Viscoelastic Ogden Number of Different Sets of Material . .NPAR(16) . . = 1 Number of Material Constants per Set . .NPAR(17) . . = 0 Nodal Rotation Coordinate Guidance Vector: Number Direction Cosines 1 1.0000 0.0000 0.0000 2 0.0000 1.0000 0.0000 Material Properties Group No. 1 Mass Density . . . . . . . . . = 1.3137E-09 Young's Modulus (E) . . . . . = 2.3787E+03 Poisson's Ratio (Nu). . . . . = 3.7000E-01 Shear Shape Factor (Fs) . . . . = 1.2000E+00 Shear Modulus (G) . . . . . . . = 7.8523E+02 Element Thickness Data Node01 Node02 Node03 Node04 137 Set 1 9.987E+00 9.987E+00 9.987E+00 9.987E+00 ** 3-D Shell element data suppressed (use /PRELE to print) Element part number (Nonlinear) . . . . . . . = 7 3-D Shell Element Definition (Type 26) Number of elements . . . . . . . . . . .NPAR(2). . . = 6534 Analysis Type . . . . . . . . . . . . . .NPAR(3). . . = 2 eq.1, Linear or Material Nonlinearity Only eq.2, Total Lagrangian Formulation eq.3, Updated Lagrangian Formulation Max number of nodes for a element . . . .NPAR(7). . . = 4 Integration Order for Element Stiffness Matrice R direction . . . . . . . . . . . . . . . . . . . = 2 S direction . . . . . . . . . . . . . . . . . . . = 2 T direction . . . . . . . . . . . . . . . . . . . = 2 Number of Stress Output Tables . . . . .NPAR(13) . . = 0 eq.0, Output at Integration Points Number of Thickness Tables . . . . . . .NPAR(14) . . = 1 Material Model. . . . . . . . . . . . . .NPAR(15) . . = 1 eq.1, Linear Elastic Isotropic eq.2, Linear Elastic Orthotropic eq.3, Elasto-Plastic with Isotropic Hardening eq.4, Elasto-Plastic with Kinematic Hardening eq.5, Elasto-plastic with Multlinear IsotropicHardening eq.6, Elasto-plastic with Multilinear KinematicHardening eq.8, Mooney-Rivlin eq.9, Ogden eq.105, Viscoelastic Mooney-Rivlin eq.106, Viscoelastic Ogden Number of Different Sets of Material . .NPAR(16) . . = 1 Number of Material Constants per Set . .NPAR(17) . . = 0 Nodal Rotation Coordinate Guidance Vector: Number Direction Cosines 1 1.0000 0.0000 0.0000 2 0.0000 1.0000 0.0000 Material Properties Group No. 1 Mass Density . . . . . . . . . = 1.3137E-09 Young's Modulus (E) . . . . . = 2.3787E+03 138 Poisson's Ratio (Nu). . . . . = 3.7000E-01 Shear Shape Factor (Fs) . . . . = 1.2000E+00 Shear Modulus (G) . . . . . . . = 7.8523E+02 Element Thickness Data Node01 Node02 Node03 Node04 Set 1 1.035E+01 1.035E+01 1.035E+01 1.035E+01 ** 3-D Shell element data suppressed (use /PRELE to print) ** Maximum hits per equation (EQN:85801) = 403 Nonzero entries estimated in upper triangle matrix = 15924204 ** BCSLIB-EXT Sparse Solver for Models with Actuator/Pulley/Slider: ** Solution State Parameters (2) ** mTOT,maxSizeA,mUSE,mFRE(8 Bytes) == 0, 2047418, 0, 0 ** mGK(%) (doubles) == 14563683 (2% of Physical Memory) ** iSPARSE,iPACK,iCHOP,kLIN,iSTAT,iMASS == 5,0,0,1,0,0 ** maxK,kLEVEL,nrestart,kSTEP,kEXIT,iRUN == 1,1,0,0,0,0 ** n_step,n_case,nste_ext,totalT,dt0 == 0,0,0, 1.200000000000000E+02, 1.000000000000000E+00 ** Initial condition list (in node#) suppressed (use /PRINI to print) ** Time integration information suppressed (use /PRTIME to print) BCSLIB-EXT solver memory status: in-core memory requirement (MB) = 965.75 minimum memory requirement (MB) = 154.74 user specified memory (MB) = 1046.17 available physical memory (MB) = 1046.17 available virtual memory (MB) = 4699.20 memory currently allocated (MB) = 965.75 ** Input model name : C:\Users\Andrea\Desktop\life stage 2.ds_data\3\ds ** Free/total disk space : 293883.23 MB / 464475.02 MB ** Job started : 2010-05-31 16:51:19 ** Job finished : 2010-05-31 18:21:49 ** Total elapsed time : 1:30:30 (hours:minutes:seconds) 139 Appendix 5: Interrupt control registers Table 30 INTCON: INTERRUPT CONTROL REGISTER R/W - 0 GIE/GIEH Bit7 R/W - 0 PEIE/GIEL R/W - 0 TMR0IE R/W - 0 INT0IE R/W - 0 RBIE R/W - 0 TMR0IF R/W - 0 INT0IF R/W -xq RBIF Bit 0 U-0 - R/W - 1 RBIP Bit 0 R/W - 0 SSPM1 R/W - 0 SSPM0 Bit 0 Table 31 INTCON2: INTERRUPT CONTROL REGISTER 2 R/W - 1 ~RBPU Bit7 R/W - 1 INTEDG0 R/W - 1 INTEDG1 R/W - 1 INTEDG2 U-0 - R/W - 1 TMR0IP Appendix 6: SPI control registers Table 32 SSPSTAT: MSSP STATUS REGISTER (SPI MODE) R/W - 0 WCOL Bit7 R/W - 0 SSPOV R/W - 0 SSPEN R/W - 0 CKP R/W - 0 SSPM3 R/W - 0 SSPM2 Table 33 SSPCON1: MSSP CONTROL REGISTER 1 R/W - 0 SMP Bit7 R/W - 0 CKE R-0 D/~A R-0 P R-0 S R-0 R/~W R-0 UA R-0 BF Bit 0 Appendix 7: USART control registers Table 34 TXSTA: TRANSMT STATUS AND CONTROL REGISTER R/W - 0 CSRC Bit7 R/W - 0 TX9 R/W - 0 TXEN R/W - 0 SYNC R/W - 0 SENDB R/W – 0 BRGH R-1 TRMT R/W - 0 TX9D Bit 0 R- 0 OERR R/W - x RX9D Bit 0 Table 35RCSTA: RECEIVE STATUS AND CONTROL REGISTER R/W - 0 SPEN Bit7 R/W - 0 RX9 R/W - 0 SREN R/W - 0 CREN R/W – 0 ADDEN 140 R-0 FERR Appendix 8: A/D control registers PCFG3: PCFG0 AN12 AN11 AN10 AN9 AN8 AN7 AN6 AN5 AN4 AN3 AN2 AN1 AN0 Table 36 PCFG3:PCFG0: A/D PORT CONFIGURATION CONTROL BITS 0000 0001 0010 0011 0100 0101 0110 0111 1000 1001 1010 1011 1100 1101 1110 1111 A A A D D D D D D D D D D D D D A A A A D D D D D D D D D D D D A A A A A D D D D D D D D D D D A A A A A A D D D D D D D D D D A A A A A A A D D D D D D D D D A A A A A A A A D D D D D D D D A A A A A A A A A D D D D D D D A A A A A A A A A A D D D D D D A A A A A A A A A A A D D D D D A A A A A A A A A A A A D D D D A A A A A A A A A A A A A D D D A A A A A A A A A A A A A A D D A A A A A A A A A A A A A A A D Table 37 ADCON0:A/D CONTROL REGISTER 0 U-0 Bit7 U-0 - R/W - 0 CHS3 R/W - 0 CHS2 R/W - 0 CHS1 R/W - 0 CHS0 R/W - 0 GO/~DONE R/W - 0 ADON Bit 0 Table 38 ADCON1: A/D CONTROL REGISTER 1 U-0 Bit7 U-0 - R/W - 0 VCFG1 R/W - 0 VCFG0 R/W - 0 PCFG3 R/W - q PCFG2 R/W - q PCFG1 R/W - q PCFG0 Bit 0 R/W - 0 ADCS1 R/W - 0 ADCS0 Bit 0 Table 39 ADCON2:A/D CONTROL REGISTER 2 R/W - 0 ADFM Bit7 U-0 - R/W - 0 ACQT2 R/W - 0 ACQT1 R/W - 0 ACQT0 141 R/W - 0 ADCS2 R = Readable bit - n = Value at POR Legend: W = Writable bit ’1’ = Bit is set U = Unimplemented bt, read as ‚ ’0’ ’0’ = Bit is cleared x= Bit is unknown Appendix 9: List of commands and status register description of the SHT73 Table 40 SHT73: list of commands Comand Reserved Measure Temperature Measure Relative Humidity Read Status Register Write Status Register Reserved Soft reset, reset the interface, clears the status register to default values. Wait minimum 11ms before next command Code 0000x 00011 00101 00111 00110 0101x – 1110x 11110 Table 41 SHT73 Status register bits Bit 7 6 Type R 5 4 3 2 1 R/W R/W 0 R/W Description Reserved End of battery (low voltage detection) ’0’ for VDD > 2.47V ’1’ for VDD < 2.47V Reserved Reserved For testing onlu, do not use Heater No reload from OTP ’1’ = 8bitRH/12bit Temp. Resolution ’0’ = 12bit RH/ 14bit Temp. resolution 142 Default 0 X 0 0 0 0 0 `0 No default value, bit is only updated after a measurement off reload 12 bit RH 14 bit Temp. Appendix 10: Conversion coefficients used in humidity and temperature computation formulas Table 42 Temperature conversion coefficents VDD 5V 4V 3.5V 3V 2.5V d1(C) -40.1 -39.8 -39.7 -39.6 -39.4 d1(F) -40.2 -39.6 -39.5 -39.3 -38.9 SOT 14bit 12bit d2(◦C) 0.01 0.04 d2(◦F) 0.018 0.072 Table 43 Optimized humidity conversion coefficients SORH 12bit 8bit c1 -2.0468 -2.0468 c2 0.0367 0.5872 c3 -1.5955E-6 -4.0845E-4 Table 44 Temperature compensation coefficients SORH 12bit 8bit t1 0.01 0.01 t2 0.00008 0.00128 Appendix 11: Accelerometer control registers and timing requirements Table 45 SPI – serial peripheral interface timing Value Symbol Parameter tc(SPC) fc(SPC) tsu(CS) th(CS) tsu(SI) th(SI) tv(SO) th(SO) tdis(SO) SPI clock cycle SPI clock frequency CS setup time CS hold time SDI input setup time SDI input hold time SDO valid output time SDO output hold time SDO output disable time Min 125 Max 8 5 10 5 15 Unit Ns MHz ns 55 7 50 Table 46 Accelermeter control register number 1: CTRL_REG1(20h) PD1 PD1, PD0 DF1, DF0 PD0 DF1 DF0 ST Power Down Control (00: power down mode; 01,10,11: device on) Decmation Factor Control 143 Zen Yen Xen ST Zen Yen Xen (00: decimate by 512; 01: decimate by 128; 10: decimate by 32; 11: decimate by 8) Self Test Enable (0: normal mode; 1: self-test active) Z – acis enable (0: axis off; 1: axis on) Y – acis enable (0: axis off; 1: axis on) X – acis enable (0: axis off; 1: axis on) Table 47Accelerometer control register number 2: CTRL_REG2(21h) FS FS BDU BLE BOOT IEN DRDY SIM DAS BDU BLE BOOT IEN DRDY SIM DAS Full Scale selection (0: ± 2g; 1: ±6g ) Block Data Update (0: continuous update; 1:output registers not updated between MSB and LSB reading) Big/Little Endian selection (0: little endian; 1: big endian) Reboot memory content Interrupt Enable (0: data ready on RDY pad; 1: Interrupt events on RDY pad) Enable Data-Ready generation SPI Serial Interface Mode selecton (0: 4-wire interface; 1: 3-wire interface) Data Alignament Selection (0: 12 bit right justified; 1: 16 bit left justified) Table 48 Status Register : STATUS_REG (27h) ZYXOR ZYXOR ZOR YOR XOR ZYXDA ZDA YDA XDA ZOR YOR XOR ZYXDA X, Y, and Z ais Data Overrun Z axis Data Overrun Z axis Data Overrun Z axis Data Overrun X, Y and Z axis new Data Available Z axis new Data Available Y axis new Data Available X axis new Data Available ZDA YDA XDA XD1 XD0 XD9 XD8 Table 49 OUTX_L (28h) - x axis acceleration LSB XD7 XD6 XD5 XD15 XD14 XD13 XD4 XD3 XD2 Table 50 OUTX_H (29h) - x axis acceleration MSB XD12 XD11 144 XD10 Table 51 OUTY_L (2Ah) - y axis acceleration LSB YD7 YD6 YD5 YD4 YD3 YD2 YD1 YD0 YD9 YD8 Z1 Z0 Z9 Z8 Table 52 OUTY_H (2Bh) - y axis acceleration MSB YD15 YD14 YD13 YD12 YD11 YD10 Table 53 OUTZ_L (2Ch) - z axis acceleration LSB Z7 Z6 Z5 Z15 Z14 Z13 Z4 Z3 Z2 Table 54 OUTZ_H (2Dh) - z axis acceleration MSB Z12 Z11 145 Z10 Appendix 12: Software block diagram Start Setup uM I/O Ports Timer has setup an interupt An external interupt occurs Reset Timer Solve the problem EOI Enable/Disable Global Interupt Indicator While(!ping) Get back at the left point in a main loop Setup config. Registers Clear variables registers Decrees a big index Setup uM Timer to count until… When the count is done the interupt ocure and the Ping is checked While(1) /Infinite loop Compute Temperature/ Humidity levels using SPI Report Temperature/ Humidity to Hercules via RS232 No Index<=0 Yes Send Radion Signal/LAN comunication faild EOI Reset Hercules Get back at the left point in a main loop Fig. 88 Software flowchart 146 Humidity > Href And Temperature > Tref No Yes Turn off Hercules Compute level/using ADC if Acclerometer is analgic/ using I2C or SPI if is digital No Level>Lref Yes Turn off Hercules Compute Voltage level provided by power source using ADC Voltage <= Vref Yes No Send Rescuse Signal Turn off Hercules/ Save power for WD To while loop Is Hercule Turned OFF? Yes While (Hercule ==Off) Fig. 89 Software flow chart (continuation) 147 While (Hercule ==Off) Compute Temperature/ Humidity levels using SPI Report Temperature/ Humidity to Hercules via RS232 Humidity > Href and Temperature > Tref No Set FLAG 1 Yes Compute level/using ADC if Acclerometer is analgic/ using I2C or SPI if is digital Yes Level>Lref No Set FLAG 2 Compute Voltage level provided by power source using ADC Voltage <= Vref Yes Yes While (Hercule ==Off) No FLAG1==FLAG2==FLAG3 Yes Turn on Hercules To While(infinite loop) Fig. 90 Software flow chart (continuation) 148 Set FLAG 3 Appendix 13: Detail port description of the full hardware buoy system Wire ID Title I. Power supply Watchdog PCB connector Number ID of vias PA6 2 Description Power supply of the RF module from the watchdog due the special voltage requisites for the RF amplifier and the RF transmitter. Current sensing of the main battery to calculate the consumption. It should give a voltage proportional from 0 to 5V. II. Current sensing PA8 2 III. Battery control PA7 3 Signal that is able to disconnect the main battery in case of emergency. IV. Power supply PA4 2 Power supply from the main battery to the watchdog. V. Enable + Signal PA5 3 Enable and data signals needed for the RF module to execute the rescues signal. Power supply Power supply Reset, on/off PA9 2 Power supply of the Hercules board. Power supply of the access point Reset and on/off control signal to VII. VIII. IX. 149 Pin Information 1. +6V for the radio amplifier. 2. +5V for the radio transmitter. 1. Ground. 2. Proportional voltage between +5V to 0V that represents the current consumption of the whole system. 1. Digital control signal from PIC microcontroller. 2. +5V. 3. Ground. 1. Ground. 2. +12V, main battery supply. 1. Ground. 2. Digital control signal from PIC microcontroller. 3. Digital control signal from PIC microcontroller. 1. Digital control signal from PIC control the Hercules power state. X. RS232 PA3 3 XI. Live sensing PA2 2 XII. Ethernet - - XIII. Programming PA1 6 XIV. Amplified signal - - XV. Hydrophone signal - - RS232 communications protocol between the Hercules and the watchdog. Periodical signal from the Hercules board to know the state of the programs running on. Ethernet communications between the Hercules and the access point. PIC Kit 3 programming port. That is the amplified signal that comes from the analogical amplifier which is between the hydrophone and the Hercules. Is the signal that we get from the hydrophone which is under the water captinwiegjweg 150 2. 1. 2. 3. microcontroller. Ground. PC-Rx. PC-Tx. Ground. 1. Pc activity signal. 2. Ground. 1. 2. 3. 4. 5. 6. - - !MCLR/VPP Vdd Target Vss Ground ICSPDAT/PGD ICSPCLK/PGC LVP Appendix 14: Watchdog Board Fig. 91 Watchdog module 152 Fig. 92 Watchdog layout 153 Fig. 93 Top Layout Fig. 94 Bottom Layout 154 Fig. 95 Package disposition 155 Appendix 15: List of components Designator C1, C2, C3, C4 C10, C11 C12, C13, C14 C15, C16, C17 Value Comment Description 1µ MAX232 capacitor Polarized Capacitor (Radial) 4 30pF Capacitor 2 Polarized Capacitor (Radial) 3 Polarized Capacitor (Radial) 3 C18 10nF Polarized Capacitor (Radial) 1 C19, C20 10nF Polarized Capacitor (Radial) 2 C21 10nF Polarized Capacitor (Radial) 1 C22 D1 10nF Polarized Capacitor (Radial) Typical INFRARED GaAs LED 1 1 Diode 1N4001 1 IC1 Oscillator capacitor 78xx input voltage decoupling capacitor 78xx output voltage decoupling capacitor decoupling cap of accelerometer decoupling cap of level adapter of accelerometer decoupling cap of level adapter of sht decoupling cap of PIC LED Diode for charging the 9v battery PIC18F4525 1 IC2 MAX232ACPE IC5 IC6 IC7 IC8, IC9 P1 7805 7833 7806 ADG3304 Reset PIC microcontroller +5V Powered, Multi-Channel RS-232 Driver/Receiver Voltage Regulator Voltage Regulator Voltage Regulator voltage level adapter P2 General power switch PA1 PA2 PA3 PA4 PA5 PA6 PA7 PA8 PA9 PA10, PA11, PA12 PA13 R1 4K7 R2, R7 4K7, 10K PicKit3 Live sensing Serial Port +12V Vatery Supply RF module RF Power Battery control Current sensing Hercules power control 100µF 10µF D2 Single-Pole, Single-Throw Switch Header, 6-Pin Quantity 1 1 1 1 2 1 1 Header, 3-Pin Header, 2-Pin Header, 3-Pin Header, 2-Pin Header, 3-Pin Header, 2-Pin Header, 2-Pin 1 1 1 1 1 1 1 1 1 AD22103 Analogic temperature sensor 3 9V battery charger sht73 pull-up resistor reset resistor Header, 2-Pin Resistor PICkit3 pull-up resistor, 1 1 2 156 R4 1K R5 1K R10 R11 S1 S2 XTAL1 1K4 1K LED Resistor resistor for charging the 9v battery Res1 voltage sensing resistor SHT73 LIS3LV02DL 4MHz 157 Resistor Resistor 1 Resistor 1 Resistor Resistor 1 1 1 1 1 Accelerometer Crystal Oscillator Appendix 16: Schematic 158 Appendix 17: Organization chart Director Michel André Associated researcher Josep Maria Alonso James L. Aroyan Researcher Alex Mas Senior scientist Joan Vicent Castell Maria Morell 159 Acoustic identification Legal adviser Cristina Álvarez Baquerizo Developing Mike van der Schaar Techniques Processing Ludwig Houégnigan Serge Zaugg Appendix 18: Contact information companies Shell Royal Dutch Shell plc Carel van Bylandtlaan 16 2596 HR DEN HAAG Postbus 162 2501 AN DEN HAAG General number: +31 (0)70 - 377 9111 Contact person: Department: Ron van den Berg Exploration and production Maersk Head office Maersk Drilling 50, Esplanaden 1098 Copenhagen K Denmark General number: +45 33 63 33 63 Safety department Lisbeth Norup Frømling, Director Maersk Drilling 50, Esplanaden 1098 Copenhagen K Denmark General number: +45 33 63 32 08 BP BP Exploration (Alaska), Inc. 900 East Benson Boulevard Anchorage AK 99508-4254 General number: +1 907 561 5111 Department sustainability: +1 281 366 5511 160