1
Biotechnology Explorer™
Forensic DNA Fingerprinting Kit
Instruction Manual
Catalog #166-0007EDU
explorer.bio-rad.com
The kit is shipped at room temperature. Open immediately upon
arrival and store reagent bag at –20°C within 3 weeks of receipt.
Duplication of any part of this document is permitted for classroom use only.
Please visit explorer.bio-rad.com to access our selection of language translations for
Biotechnology Explorer kit curriculum.
For technical service call your local Bio-Rad office, or in the US, call 1-800-4BIORAD (1-800-424-6723)
Can DNA evidence solve human problems?
DNA fingerprinting is now used routinely to solve crimes. In recent years, news stories have
reported how miniscule amounts of DNA have been used to identify individuals involved in
incidents even many years in the past, as well as exonerate innocent people from incrimination.
The power of DNA as a tool for individual identification captures students’ imaginations.
This activity provides in-depth instruction about how restriction enzymes cleave DNA, how
electrophoresis is used to separate and visualize DNA fragments, and how these techniques
can be combined to obtain a DNA fingerprint. Principles of restriction analysis, plasmid
mapping and DNA fragment size determination can also be documented with this kit.
Open the door to rich discussions about scientific, ethical, and legal implications of DNA
profiling. DNA fingerprinting is used in medical and forensic procedures, as well as in
paternity determinations to discern genetic relationships between individuals at the molecular
level. This kit allows students to play the role of a forensic scientist and make a positive
ID—that is, to simulate using real DNA as evidence and figure out for themselves: “Who
done it?”
In this activity, students analyze six different samples of plasmid DNA. One sample collected
from a hypothetical “crime scene” and five samples obtained from “suspects” are digested
with two restriction enzymes. The resulting DNA fragments are separated and visualized in
agarose gels using Bio-Rad’s Fast Blast™ DNA staining solution. Based on the restriction
fragment patterns, students compare the evidence and match one of the suspects’ DNA to
the sample collected at the crime scene.
As an alternative to the classical human forensic applications for this kit, have your students
imagine they are high tech pathologists investigating an outbreak of an aggressive infectious
disease that has never been seen before. The Centers for Disease Control and Prevention
suspects that a new strain of bacteria has arisen that not only is the cause of the new disease,
but also has acquired multiple resistance plasmids from some other bacterial strains. Their
job is to develop a DNA diagnostic tool for identifying the culprit plasmids. They decide to
use restriction enzyme analysis and “DNA electrophoresis fingerprinting” to identify and
distinguish different suspect plasmids and track their spread through the environment. DNA
from the cultures of a number of stricken patients has been isolated. Have your students
identify the new killer bug before the pathogen gets out into the general population and
starts a true epidemic!
We strive to continually improve our Biotechnology Explorer kits and curricula. Please
share your stories, comments and suggestions!
You can download this complete instruction manual on the Internet. Visit us on the Web at
explorer.bio-rad.com or call us in the US at 1-800-4BIORAD (1-800-424-6723).
This curriculum was developed in collaboration with Len Poli and Russ Janigian of the S.F.
Base Biotechnology Program in San Francisco, California, and Peggy Skinner of the Bush
School in Seattle, Washington. We’d like to thank them for their invaluable guidance and
contributions to this curriculum.
Ron Mardigian
Biotechnology Explorer Program
Bio-Rad Life Science Group
2000 Alfred Nobel Drive
Hercules, California 94547
Create context. Reinforce learning. Stay current.
New scientific discoveries and technologies
create more content for you to teach,
but not more time. Biotechnology
Explorer kits help you teach more
effectively by integrating multiple
core content subjects into a
single lab. Connect concepts
with techniques and put
them into context with
real-world scenarios.
• Use of restriction enzymes and
electrophoresis to fingerprint DNA
• Use of experimental controls
• Interpretation of experimental results
• Use of DNA evidence in court
• Creation and use of standard curves
Environmental
and Health
Science
• Epidemiology and disease
• Genetic testing
• Role, place, limits, and
possibilities of science and
technology
• Privacy of information issues
• Cell structure and organization
• Tissue types for biological
sampling
• Plasmid mapping
• Genetic variations in the
human genome
• Genotype vs. phenotype
• Biodiversity
• Bacterial defense
mechanisms
Scientific
Inquiry
Forensic
DNA
Fingerprinting
Kit
Cell and
Molecular
Biology
Evolution
Chemistry
of Life
Genetics
• DNA structure, function,
and chemistry
• Chemistry of DNA
electrophoresis
• Biochemistry of
restriction enzymes
• Restriction fragment length
polymorphisms (RFLP analysis)
• Genetic engineering techniques
• Mendelian inheritance
• Plasmid mapping
Table of Contents
Overview
Kit Inventory Checklist
Instructor’s Manual
Instructor’s Manual Background
Kit Components and Required Accessories ..............2
..................................................................4
Setting the Stage for Your Students ..........................4
Instructor’s Advance Preparation Guide ..............................................9
Implementation Timeline
Advance Preparation and Student Lessons ..............9
Workstation Checklist
Student and Instructor Lab Setups ..........................11
Instructor’s Advance Preparation
Lab Prep and Lesson Highlights..............................13
Quick Guide
Graphic Laboratory Protocol ..................................20
Student Manual
Pre-Lab Activity
Introduction to DNA Fingerprinting ..........................23
Lesson 1
Restriction Digestion of DNA Samples ....................25
Lesson 2
Agarose Gel Electrophoresis of DNA Samples........31
Post-Lab Activity
Analysis and Interpretation of Results ....................40
Extension Activity 1
Plasmid Mapping ....................................................47
Extension Activity 2
Constructing a Plasmid ..........................................55
Appendices
Appendix A
Alternative DNA Fingerprinting Scenarios ..............60
Appendix B
Prelab Activities ......................................................63
A Review of Restriction Enzymes......................63
A Review of Electrophoresis..............................68
Appendix C
Instructor’s Answer Guide ......................................70
Appendix D
Fast Gel Protocol ....................................................90
Appendix E
Plasmid Maps ........................................................91
Appendix F
References ............................................................95
Overview for the Instructor
Intended Audience
This investigation is intended for use by any high school or college student,
independent of the degree of prior familiarity with the chemistry of nucleic acids.
Student Objectives
That all students who participate in this investigation:
1) Become challenged by the task and intrigued by the methodology of the investigation.
2) Develop an understanding of some of the basic scientific principles involved in DNA
fingerprinting and analysis of plasmid mapping.
3) Weigh evidence and be able to analyze and interpret the data that are generated in this
investigation with clarity and confidence.
4) Have a clear understanding of the thought processes involved in scientific work.
5) Develop the curiosity and confidence to further explore questions and issues involving
scientific investigations.
6) Use critical thinking to solve problems.
Teaching Strategies
This curriculum is designed to simulate human forensic testing, but can also be used to
simulate a wide range of applications for genetic analysis. The actual scenario employed is
up to the discretion of the instructor. Refer to alternative scenarios in Appendix A.
The analysis sections of this investigation are intended to guide students through the
process of discovering and understanding concepts that are of significance to the procedures
and the analysis of the data at each step along the way. It is hoped that this approach (as
compared to the teacher giving the students all of the background information) will make
the entire investigation more comprehensible to a greater number of students. So long as
the teacher has the opportunity to check on the progress and level of understanding of
each group, some degree of self pacing is possible, if so desired. We have found that this
approach allows a larger number of the diverse population of students we work with to
experience the goals that have been identified above.
Safety Issues
Eating, drinking, smoking, and applying cosmetics are not permitted in the work area.
Wearing protective eyewear and gloves is strongly recommended. Students should wash
their hands with soap before and after this exercise. If any of the solutions gets into a
student's eyes, flush with water for 15 minutes. Although Fast Blast DNA stain is not toxic,
latex or vinyl gloves should be worn while handling the stain to keep hands from becoming
stained. Lab coats or other protective clothing should be worn to avoid staining clothes.
Storage Temperatures
The kit is shipped at room temperature. Open immediately upon arrival and store the
reagent bag at –20°C within 3 weeks of receipt.
1
Kit Inventory Checklist
This section lists the equipment and reagents necessary to conduct the Forensic DNA
Fingerprinting laboratory. We recommend that students be teamed up – two to four students
per workstation.
Kit Components
Number/Kit
1. Crime Scene (CS) DNA with buffer, lyophilized, 60 µg
1 vial
2. Suspect 1 (S1) DNA with buffer, lyophilized, 60 µg
1 vial
3. Suspect 2 (S2) DNA with buffer, lyophilized, 60 µg
1 vial
4. Suspect 3 (S3) DNA with buffer, lyophilized, 60 µg
1 vial
5. Suspect 4 (S4) DNA with buffer, lyophilized, 60 µg
1 vial
6. Suspect 5 (S5) DNA with buffer, lyophilized, 60 µg
1 vial
1 vial
7. EcoRI/PstI, restriction enzyme mix, lyophilized, 3,000 units
8. Sterile water, 2.5 ml
1 vial
9. HindIII lambda digest (DNA size marker), 0.2 µg/µl, 100 µl 1 vial
10. DNA sample loading dye
1 vial
11. Fast Blast DNA stain, 500x, 100 ml
1 vial
12. Colored micro test tubes, 2.0 ml
60
13. Clear micro test tubes, 1.5 ml
30
14. Agarose powder, 5 g
1
15. Electrophoresis buffer, 50x TAE, 100 ml
1
16. Foam micro test tube holders
16
17. Gel staining trays
4
✔)
(✔
❑
❑
❑
❑
❑
❑
❑
❑
❑
❑
❑
❑
❑
❑
❑
❑
❑
Required Accessories
Number/Kit
Adjustable micropipet, 2–20 µl, catalog #166-0506EDU
1–8
Pipet tips, 2–200 µl 5 racks of 200, catalog #223-9347EDU
1
Horizontal electrophoresis chamber, catalog #166-4000EDU
1–8
Power supply, catalog #164-5050EDU
1–4
Adjustable micropipet, 20–200 µl, catalog #166-0507EDU
1
Adjustable micropipet, 100–1000 µl, catalog #166-0508EDU
1
Pipet tips, 100–1000 µl, 5 racks of 200, catalog #223-9350EDU 1
Permanent markers
1
Microwave oven or hot plate
1
Distilled water
1
500 ml Erlenmeyer flask for microwaving agarose
1
500 ml flask or beaker for diluting DNA stain
1
Ice bucket with ice
1
Laboratory tape (not Scotch 3M brand or similar tape)
1
✔)
(✔
❑
❑
❑
❑
❑
❑
❑
❑
❑
❑
❑
❑
❑
❑
Optional Accessories
37°C water bath, catalog #166-0504EDU or
Mini incubation oven, catalog #166-0501EDU
Gel support film (50 sheets), catalog #170-2984EDU
Microcentrifuge, catalog #166-0602EDU
or mini centrifuge
Rocking platform, catalog #166-0709EDU
✔)
(✔
2
Number/Kit
1
1
❑
❑
1
1
❑
❑
Refills Available Separately
Fast Blast DNA stain, 500x, 100 ml, catalog #166-0420EDU
Molecular biology agarose, 25 g, catalog #161-3100EDU
DNA fingerprinting kit refill package, catalog #166-0027EDU (contains crime scene and
suspect DNA samples, EcoRI/PstI restriction enzyme mix, sample loading buffer,
Fast Blast DNA stain, DNA markers, sterile water)
EcoRI/PstI restriction enzyme mix, catalog #166-0047EDU
Small DNA Electrophoresis Reagent Pack, catalog #166-0450EDU
(to pour, run & stain 48 1% or 16 3% 7x10 cm agarose gels)
Medium DNA Electrophoresis Reagent Pack, catalog #166-0455EDU
(to pour, run & stain 270 1% or 90 3% 7x10 cm agarose gels)
Large DNA Electrophoresis Reagent Pack, catalog #166-0460EDU
(to pour, run & stain 1080 1% or 360 3% 7x10 cm agarose gels)
3
INSTRUCTOR'S MANUAL
BACKGROUND
Instructor’s Manual Background
Introduction
Technicians working in forensic labs are often asked to do DNA profiling or “fingerprinting”
to analyze evidence in law enforcement cases and other applications. Restriction Fragment
Length Polymorphism (RFLP) has been the workhorse of forensic DNA profiling for many
years. First described by English geneticist Alec Jeffries in 1985, RFLP analysis provides a
unique banding pattern based on the restriction sites present in an individual’s DNA sequence.
Currently, DNA profiling involves polymerase chain reaction (PCR) amplification which allows
the analysis of minute quantities of DNA in a much shorter time. In this lab activity, students will
compare band patterns produced by restriction enzyme cleavage of DNA samples when
separated on an agarose gel (RFLP). The patterns in this exercise are produced from one
sample that represents DNA taken at the crime scene and five samples obtained from suspects
in the case. It may be important for you to point out to your students that this laboratory exercise
models the more elaborate technique that is performed on complex human DNA samples.
Restriction Enzymes
Scientists have benefited from a natural, bacterial defense mechanism: the restriction
enzyme. A restriction enzyme acts like molecular scissors, making cuts at specific
sequence of base pairs that it recognizes. These enzymes destroy DNA from invading
viruses, or bacteriophages (phages). Phages are viruses that infect and destroy bacteria.
Bacterial restriction enzymes recognize very specific DNA sequences within the phage
DNA and then cut the DNA at that site. Although the bacteria’s own DNA may also contain
these sites the bacteria protect their own restriction sites by adding a methyl group. Once
purified in the laboratory the fragmented phage DNA no longer poses a threat to the bacteria.
These restriction endonucleases (endo = within, nuclease = enzyme that cuts nucleic
acids) are named for the bacteria from which they were isolated. For example, EcoRI was
isolated from Escherichia coli. Restriction enzymes can be used to cut DNA isolated from
any source. Restriction enzymes were named before scientists understood how they
functioned because they would limit (or restrict) the growth of phages. A restriction enzyme
sits on a DNA molecule and slides along the helix until it recognizes specific sequences of
base pairs that signal the enzyme to stop sliding. The enzyme then cuts or chemically
separates the DNA molecule at that site—called a restriction site.
If a specific restriction site occurs in more than one location on a DNA molecule, a
restriction enzyme will make a cut at each of those sites, resulting in multiple fragments.
Therefore, if a linear piece of DNA is cut with a restriction enzyme whose specific
recognition site is found at two different locations on the DNA molecule, the result will be
three fragments of different lengths. If the piece of DNA is circular and is cut with a
restriction enzyme whose specific recognition site is found at two different locations on the
DNA molecule, the result will be two fragments of different lengths. The length of each
fragment will depend upon the location of restriction sites on the DNA molecule.
When restriction enzymes are used to cut strands of circular plasmid DNA, such as the
samples included in this kit, fragments of varying sizes are produced. DNA that has been
cut with restriction enzymes can be separated and observed using a process known as
agarose gel electrophoresis. The term electrophoresis means to carry with electricity.
The resulting fragments can then be used to create a plasmid map – see page 47.
Instructor’s Manual
4
Agarose gel electrophoresis separates DNA fragments by size. DNA fragments are
loaded into an agarose gel slab, which is placed into a chamber filled with a conductive
buffer solution. A direct current is passed between wire electrodes at each end of the
chamber. Since DNA fragments are negatively charged, they will be drawn toward the
positive pole (anode) when placed in an electric field. The matrix of the agarose gel acts as
a molecular sieve through which smaller DNA fragments can move more easily than larger
ones. Therefore, the rate at which a DNA fragment migrates through the gel is inversely
proportional to its size in base pairs. Over a period of time, smaller DNA fragments will
travel farther than larger ones. Fragments of the same size stay together and migrate in
single bands of DNA. These bands will be seen in the gel after the DNA is stained.
Consider this analogy. Imagine that all the desks and chairs in the classroom have
been randomly pushed together. An individual student can wind his/her way through the
maze quickly and with little difficulty, whereas a string of four students would require more
time and have difficulty working their way through the maze.
DNA Fingerprinting
Each person has similarities and differences in DNA sequences. To show that a piece
of DNA contains a specific nucleotide sequence, a radioactive complementary DNA probe
can be made that will recognize and bind that sequence. Radioactive probes allow molecular
biologists to locate, identify, and compare the DNA of different individuals. This probe can
be described as a "radioactive tag" that will bind to a single stranded DNA fragment and
produce a band in a gel or a band on a piece of blotting membrane that is a replica of the
gel (also known as a Southern blot). Because of its specificity, the radioactive probe can be
used to demonstrate genotypic similarities between individuals. In DNA fingerprinting, the
relative positions of radiolabeled bands in a gel are determined by the size of the DNA
fragments in each band. The size of the fragments reflect variations in individuals’ DNA.
The evidence needed for DNA fingerprinting can be obtained from any biological
material that contains DNA: body tissues, body fluids (blood and semen), hair follicles, etc.
DNA analysis can even be done from dried material, such as blood stains or mummified
tissue. If a sample of DNA is too small it may be amplified using PCR techniques. The
DNA is then treated with restriction enzymes that cut the DNA into fragments of various
length.
Instructor’s Manual
5
INSTRUCTOR'S MANUAL
BACKGROUND
Agarose Gel Electrophoresis
Because they cut DNA, restriction enzymes are the "chemical scissors" of the molecular
biologist. When a particular restriction enzyme "recognizes" a particular recognition
sequence (four- or six- base pair (bp)) on a segment of DNA, it cuts the DNA molecule at
that point. The recognition sequences for two commonly used enzymes, EcoRI and PstI,
are shown below. The place on the DNA backbones where the DNA is actually cut is
shown with a (✄) symbol:
✄
✄
For the enzyme EcoRI
G A AT T C
C T TA AG
✄
For the enzyme PstI
CTGCAG
GACGTC
✄
INSTRUCTOR'S MANUAL
BACKGROUND
Restriction Digestion of DNA
Like all enzymes, restriction enzymes function best under specific buffer and
temperature conditions. The proper restriction enzyme buffer has been included with the
DNA sample in this kit, so that when the rehydrated DNA and enzymes are mixed, the ideal
conditions are created for the enzymes to function optimally. The final reaction buffer consists
of 50 mM Tris, 100 mM NaCl, 10 mM MgCl2, 1 mM DDT, pH 8.0, which is the ideal condition
for EcoRI and PstI enzymes to function.
Making DNA Visible
DNA is colorless so DNA fragments in the gel cannot be seen during electrophoresis.
A sample loading buffer containing two bluish dyes is added to the DNA samples. The
loading dye does not stain the DNA itself but makes it easier to load the samples and
monitor the progress of the DNA electrophoresis. The dye fronts migrate toward the positive
end of the gel, just like the DNA fragments. Bromophenol blue, the “faster” dye, comigrates
with DNA fragments of approximately 500 bp in a 1% agarose gel, while the xylene cyanol,
the “slower” dye, comigrates with DNA fragments of approximately 4,000 bp in a 1%
agarose gel.
Staining the DNA pinpoints its location on the gel. When the gel is immersed in Fast
Blast DNA stain, the stain molecules attach to the DNA trapped in the agarose gel. When
the bands are visible, your students can compare the DNA restriction patterns of the different
samples of DNA.
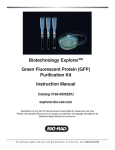
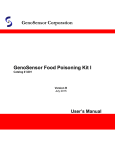
The gel on page 7 shows the DNA pattern that will be obtained by your students
following electrophoresis. The DNA from the crime scene has been labeled CS, that from
Suspect #1, S1 and so on. The DNA from the crime scene is placed in lane 2; one suspect’s
DNA is placed in each of lanes 3, 4, 5, 6 and 7. Lane 1 contains HindIII lambda digest
(DNA size markers). By convention, the lanes are numbered from the top left. The students’
task is to look at the DNA banding patterns and see if any of the suspects’ bands match
those of the DNA found at the crime scene.
Instructor’s Manual
6
CS
2
S1
3
S2
4
S3
5
S4
6
S5
7
INSTRUCTOR'S MANUAL
BACKGROUND
M
1
8
It is easy to see that the DNA taken from the crime scene and the DNA from S3 are
identical. You may want to point out how “strong” or “weak” this evidence is in convicting a
suspect. The DNA evidence may place the suspect at the scene, but other evidence may
be needed to prove him or her guilty!
You may point out to your students that this is a simulation. In actual DNA fingerprinting,
technicians analyze much larger segments of DNA and many more bands and lanes are
produced.
Reliability of DNA Evidence
Two major factors affecting the reliability of DNA fingerprinting technology in forensics are
population genetics and genetic statistics. In humans there are thousands of RFLP loci or DNA
segments that can be selected and used for fingerprinting analysis. Depending on demographic
factors such as ethnicity or geographic isolation, some segments will show more variation
than others. In general one can assume that any two humans are 99.9% identical DNA
sequence. Thus they will differ by only 1 bp in 1,000. It is necessary to examine areas that
differ to create a useful DNA fingerprint.
Some populations show much less variation in particular DNA segments than others.
The degree of variation will affect the statistical odds of more than one individual having
the same sequence. If 90% of a given population has the same frequency in its DNA
fingerprinting pattern for a certain DNA segment, then very little information will be attained.
But if the frequency of a DNA pattern turning up in a population for a particular segment is
extremely low, then this segment can serve as a powerful tool to discriminate between
individuals in that population. Different populations show different patterns in their genotypes
due to the contributions made to their individual gene pools over time.
Therefore, in analyzing how incriminating the DNA evidence is, one needs to ask the
question:
“Statistically, how many people in a population have the same pattern as that taken
from a crime scene: 1 in 1,000,000? 1 in 10,000? Or, 1 in 10?”
Instructor’s Manual
7
INSTRUCTOR'S MANUAL
BACKGROUND
Plasmid Mapping Extension
The information contained in this kit can be used to perform an optional plasmid mapping
activity extension. Plasmid mapping is a technique that allows molecular biologists to quickly
evaluate the success of cloning experiments and to easily identify plasmids and associated
traits in different organisms. The crime scene and suspect DNA samples in this kit do not
contain human DNA but are constructed using plasmid DNA isolated from bacteria.
Plasmids are circular, non-chromosomal pieces of DNA that can replicate in and are
commonly found in bacteria and simple eukaryotic organisms such as yeast. They typically
carry accessory genes separate from the the organism’s genomic DNA. In nature, bacteria
evolved plasmids containing genes that enabled them to grow in the presence of antibiotics
produced by other micro-organisms in the environment. This antibiotic resistance gave the
bacteria harboring these plasmids a selective advantage over their competitors. Bacteria
were able to pass the beneficial plasmid DNA to other bacteria via conjugation.
Scientists routinely take advantage of plasmid DNA because its small size makes it
easy to purify, and once a genetically-engineered DNA sequence has been added it can
be reintroduced into bacterial cells using a procedure called transformation. Plasmids cut
with a restriction enzyme can be joined to foreign DNA from any source that has been cut
with the same enzyme. The resulting hybrid DNA can then be transformed into bacterial
cells. The hybrid plasmids can perpetuate themselves in bacteria just as before, except
that the foreign DNA that was joined to them is also perpetuated. Every hybrid plasmid now
contains a copy of the piece of foreign DNA joined to it. We say that the foreign piece of
DNA has been “cloned”, and the plasmid DNA that carried it is called a “vector”. During this
hybrid plasmid construction process, it is necessary to confirm that the foreign DNA has
been successfully inserted into the host plasmid. While it is possible to have the complete
DNA sequence of each construct determined, it is easier and quicker to use a restriction
digestion to create a plasmid map.
Plasmids can be mapped (described) in terms of the location of restriction sites, using
simple experiments and the use of logic. The general procedure is to digest a plasmid with
two restriction enzymes separately (two single digests) and then together (a double digest).
Sizes of fragments are then estimated by comparison with known standards. The sizes of
the fragments from the single digests and the double digest are determined then logic is
used to assess the relative location of restriction sites.
Instructor’s Manual
8
Instructor’s Advance Preparation Guide
Implementation Timeline
•
A series of prelab considerations for students
•
An active student investigation
•
Questions for analysis and interpretation of lab results
INSTRUCTOR'S MANUAL
ADVANCE PREPARATION
There are four activities and two optional extension activities in this fingerprinting
curriculum. All activities are designed to be carried out in consecutive 50 minute periods.
Activities include:
Student Schedule
Pre-Lab Activity:
Introduction to DNA Fingerprinting
Activity
Lecture and discussion
Prelab considerations 1 and 2
Lesson 1
Restriction Digest of DNA Samples
Activity
Pour gels; perform the restriction digests
Complete preliminary analysis and review questions
Lesson 2
Electrophoresis of DNA Samples
Activity
Load and run gels; stain gels
Do analysis and review questions
Post-Lab Activity
Analysis and Interpretation of Results
Activity
Do analysis questions
Generate standard curve
Discuss results and weigh evidence
Extension Activities
Activity 1
Plasmid Mapping
Work through questions
Activity 2
Constructing a Plasmid
Work through questions
Instructor’s Manual
9
Instructor’s Advance Preparation
This sections outlines the recommended schedule for advanced preparation on the
part of the instructor. A detailed Advance Preparation Guide is provided on pages 13–19.
INSTRUCTOR'S MANUAL
ADVANCE PREPARATION
Activity
Read manual
When
Immediately
Time required
1 hour
Prepare electrophoresis TAE
buffer and pour agarose gels
Prior to or during Lesson 2
1 hour
Rehydrate lyophilized DNA/
buffer samples and enzyme
mix and aliquot
Prior to Lesson 2
20 minutes
Prepare Fast Blast
DNA stain,
Prepare HindIII standard,
Aliquot loading dye and
prepared standard
Prior to Lesson 3
20 minutes
Set up workstations
The day of student labs
10 minutes/day
Instructor’s Manual
10
Student Workstations. Materials and supplies that should be present at each student
workstation prior to beginning each laboratory experiment are listed below. The components
provided in this kit are sufficient for 8 student workstations (we recommend 2–4 students
per workstation).
Teacher’s (Common) Workstation. A list of materials, supplies, and equipment that should
be present at a common location, which can be accessed by all student groups, is also listed
below. It is up to the discretion of the teacher as to whether students should access common
buffer solutions and equipment, or whether the teacher should aliquot solutions and operate
equipment. To avoid the potential for contamination and spills, you may choose to aliquot
stock solutions of DNA and enzymes for the students. All other reagents should be kept at
the front of the room for student teams to access as they need them.
Lesson 1 Restriction Digestion of DNA Samples
Materials Needed for Each Workstation
Agarose gel electrophoresis system (electrophoresis
chamber, casting tray, 8-well comb)
EcoRI/PstI enzyme mix
Pipet tips, 2–200 µl
Adjustable micropipet, 2–20 µl
Colored micro test tubes:
green, blue, orange, violet, red, yellow
Permanent marker
Waste container
Foam micro test tube holder
Laboratory tape (not 3M Scotch brand or similar tape)
✔)
(✔
❑
Quantity
1
1 tube (80 µl)
15 tips
1
❑
❑
❑
1
1
1
1
1
❑
❑
❑
❑
❑
Instructor’s Workstation
Crime scene (C5) DNA with buffer, rehydrated
1 vial
Suspect 1 (S1) DNA with buffer, rehydrated
1 vial
Suspect 2 (S2) DNA with buffer, rehydrated
1 vial
Suspect 3 (S3) DNA with buffer, rehydrated
1 vial
Suspect 4 (S4) DNA with buffer, rehydrated
1 vial
Suspect 5 (S5) DNA with buffer, rehydrated
1 vial
Molten 1% agarose in 1x TAE(See Advance Prep page 14) 40–50 ml per gel
37°C water bath or incubator (optional)
1 per class
Microcentrifuge
1 per class
or mini centrifuge
4 per class
❑
❑
❑
❑
❑
❑
❑
❑
❑
❑
Protective eye goggles should be worn in the laboratory at all times.
Proper safety precautions, such as no eating or drinking, should
always be practiced.
Instructor’s Manual
11
INSTRUCTOR'S MANUAL
ADVANCE PREPARATION
Workstation Checklist
Lesson 2 Electrophoresis of DNA Samples
INSTRUCTOR'S MANUAL
ADVANCE PREPARATION
Materials Needed for Each Workstation
Agarose gel electrophoresis system
Agarose gel
Digested DNA samples
HindIII lambda digest (DNA marker)
DNA sample loading dye
Permanent marker
Pipet tips, 2–20 µl
Adjustable micropipet, 2–20 µl
Waste container
Gel support film (if applicable)*
Fast Blast DNA stain, 1x or 100x*
Large containers for destaining (if applicable)*
Foam micro test tube holder
Power supply
Gel staining tray
Electrophoresis buffer (1x TAE)
Instructor’s Workstation
Microcentrifuge
or mini centrifuge (optional)
Rocking platform (optional)
Quantity
1
1
6
1
1
1
13
1
1
1
120 ml per 2 stations
1–3 per 2 stations
1
1
1 per 2 stations
275 ml per station
1
4
1
✔)
(✔
❑
❑
❑
❑
❑
❑
❑
❑
❑
❑
❑
❑
❑
❑
❑
❑
❑
❑
❑
Post-Lab Activity: Analysis of Results
Materials Needed for Each Workstation
Millimeter ruler
Semilog graph paper
Gel support film (if applicable)*
Quantity
1
1
1
Instructor’s Workstation
None required
* Depending on whether the quick or overnight staining will be followed.
Instructor’s Manual
12
✔)
(✔
❑
❑
❑
Instructor’s Advance Preparation for Labs
This section describes the preparation that needs to be performed by the instructor
before each laboratory. An estimation of preparation time is included in each section.
Lesson 1 Restriction Digestion of DNA Samples
Objectives:
Rehydrate DNA/buffer samples and restriction enzymes
Aliquot restriction enzymes
Pour agarose gels to prepare for lesson 2. If you prefer to have your
students pour their own gels during the lab, prepare the molten
agarose ahead of time. If prepared in advance, molten agarose
should be kept in a water bath set at 50–55°C until gels are poured.
Set temperature of 37°C for water bath or incubator
Set up student and instructor workstations
Time required:
Thirty minutes to 1 hour, depending on how you choose to prepare
agarose gels
What’s required:
Horizontal electrophoresis gel chamber, casting trays, and combs
Electrophoresis buffer (50x TAE)
Agarose powder
8 clear microtubes
3 liters distilled water
Procedures
Note: All of the DNA and enzyme vials should contain a white residue, which may
appear as a loose powder in the DNA vials. The lyophilized DNA samples have
color-coded labels on clear glass vials. The lyophilized EcoRI/PstI enzyme mix is in an
amber vial.
1. Rehydrate DNA samples
A. To rehydrate DNA samples, carefully remove the stopper and add 200 µl of sterile
water to each lyophilized DNA vial. Replace the stopper and vigorously shake the
vial. It is critical to dissolve all the powder, some of which may be stuck to the stopper. Allow DNA/buffer samples to rehydrate at room temperature for 15 minutes or
until dissolved. Gentle heating at 37°C for 10 minutes may be necessary. You may
choose to transfer the rehydrated DNA/buffer samples to color-coded, labeled 1.5 ml
microtubes to make pipetting easier for your students.
The rehydrated DNA samples are now at a concentration of 0.3 µg/µl in 100 mM
Tris, 200 mM NaCl, 20 mM MgCl2, 2 mM DTT, pH 8.0. Once the DNA in buffer is
added to the enzyme, the final concentration of buffer will be 50 mM Tris, 100 mM
NaCl, 10 mM MgCl2, 1 mM DTT, pH 8.0, which is the ideal condition for EcoRI and
PstI enzymes to function.
2. Rehydrate lyophilized EcoRI/PstI enzyme mix. To rehydrate EcoRI/PstI enzyme mix,
add 750 µl sterile water and swirl to resuspend the enzymes. Allow enzymes to rehydrate
on ice for 5 minutes. It is critical that the enzyme mix is kept on ice, but not frozen, once
it has been rehydrated. The rehydrated enzymes should be used within 12 hours.
3. Aliquot enzyme mix. Transfer 80 µl of the rehydrated enzyme mix into each of eight,
clear 1.5 ml microtubes labeled ENZ.
Instructor’s Manual
13
INSTRUCTOR'S MANUAL
ADVANCE PREPARATION
Advance Preparation
4. Prepare agarose gels.* The recommended agarose concentration for gels in this
classroom application is 1% agarose. This concentration of agarose provides good
resolution and minimizes run time required for electrophoretic separation of DNA
fragments. The recommended thickness for the gel is 0.75–1.0 cm for easy sample
loading and gel handling. Be sure to use electrophoresis buffer, not water, to
prepare agarose gels. (See Appendix D for alternative Fast Gel Protocol)
INSTRUCTOR'S MANUAL
ADVANCE PREPARATION
a.
Electrophoresis buffer preparation. TAE (Tris-acetate-EDTA) electrophoresis
buffer is provided as a 50x concentrated solution. In addition to the 1x TAE buffer
needed to make the agarose gels, approximately 275 ml is also required for each
electrophoresis chamber. Three liters of 1x TAE buffer will be sufficient to run 8
electrophoresis chambers and prepare 8 agarose gels. To make 3 L of 1x TAE from
50x TAE concentrate, add 60 ml of 50x concentrate to 2.94 L of distilled water.
b.
Agarose preparation. These procedures may be carried out 1 to 2 days ahead of
time by the teacher or done during class by the individual student teams.
i.
To make a 1% agarose solution, use 1 gram of agarose for each 100 ml of 1x TAE
electrophoresis buffer. Be sure to use electrophoresis buffer, not water.
If electrophoresis chambers are limiting, you can use a 7 x 10 cm tray and two
8-well combs to pour a gel that can be used to run two sets of student digests.
Use this table as a guide for gel volume requirements when
casting single or multiple gels.
Volume of 1% agarose for:
Number of gels
7 x 7 cm tray
7 x 10 cm tray
1
2
4
8
40 ml
80 ml
160 ml
320 ml
50 ml
100 ml
200 ml
400 ml
ii. Add the agarose powder to a suitable container (e.g., 500 ml Erlenmeyer flask for 200 ml
or less). Add the appropriate amount of 1x TAE electrophoresis buffer and swirl to
suspend the agarose powder in the buffer. If using an Erlenmeyer flask, invert a 25 ml
flask into the open end of the 500 ml Erlenmeyer flask containing the agarose. The
small flask acts as a reflux chamber, thus allowing long or vigorous boiling without much
evaporation. The agarose can be melted for gel casting by boiling until agarose has
melted completely on a magnetic hot plate, hot water bath, or in a microwave oven.
Heated agarose can quickly boil over so watch the process carefully.
Caution: Always wear protective gloves, goggles, and lab coat while preparing and casting
agarose gels. Boiling molten agarose or the flasks containing hot agarose can cause
severe burns if allowed to contact skin.
Microwave oven method. This technique is the fastest and safest way to dissolve agarose.
Place the gel solution in an appropriate bottle or flask into the microwave. LOOSEN THE
CAP IF YOU ARE USING A BOTTLE. Use a medium setting and set to 3 minutes. Stop the
microwave oven every 30 seconds and swirl the flask to suspend any undissolved agarose.
Boil and swirl the solution until all of the small transparent agarose particles are dissolved.
Set aside and cool to 55–60°C before pouring.
* Convenient precast agarose gels (catalog #161-3057EDU) are available from Bio-Rad.
These are 2 x 8-well, 1% TAE gels and fit into Bio-Rad’s Mini-Sub Cell GT cell or any
horizontal gel electrophoresis system that fits 7 x 10 cm gels.
Instructor’s Manual
14
Magnetic hot plate method. Add a stirbar to the undissolved agarose solution. Heat the
solution to boiling while stirring on a magnetic hot plate. Bubbles or foam should be disrupted
before rising to the neck of the flask.
Boil the solution until all of the small transparent agarose particles are dissolved. Set aside
to cool to 55–60°C before pouring gels.
This laboratory activity requires that each gel has at least 7 wells. Follow the instructions
above to prepare the agarose and to determine what volume of 1% agarose will be
needed for your class(es). Pour enough agarose to cover the gel comb teeth or to a depth
of 0.5–0.75 cm. Do not move or handle the gel tray until the gel has solidified. Solidified
gels can be stored in sealable bags at room temperature for 1 day or in the refrigerator
for up to 1 week before using. Have students label their plastic bags. The time needed
to pour gels by an entire class is approximately 30 minutes. If possible, pour one or two
extra gels for back-up. This section outlines the tape-the-tray method for casting gels.
Other methods are detailed in the Sub-Cell GT cell (electrophoresis chamber)
instruction manual.
i.
Seal the ends of the gel tray securely with strips of standard laboratory tape
(not Scotch tape or similar). Press the tape firmly to the edges of the gel tray to
form a fluid-tight seal.
ii. Level the gel tray on a leveling table or workbench using the leveling bubble
provided with the chamber.
iii. Prepare the desired concentration and amount of agarose in 1x TAE
electrophoresis buffer.
iv. Cool the agarose to at least 60°C before pouring.
v. While the agarose is cooling to 60°C, place the comb into the appropriate slot
of the gel tray. Gel combs should be placed within 1/2 inch of the end of the
gel casting tray if a single-well, 7 x 7 cm gel is cast. To pour a double-well gel
using a 7 x 10 cm tray and two 8-well combs, place one comb at one end of
the tray and the other comb in the middle of the tray. The combs will form the
wells into which the samples will be loaded.
vi. Allow the gel to solidify at room temperature for 10 to 20 minutes. It will appear
cloudy, or opaque, when ready to use.
vii. Carefully remove the comb from the solidified gel.
viii. Remove the tape from the edges of the gel tray.
ix. You have two options:
Option 1: If you do not have sufficient time to proceed to Lesson 2, store gels in a
sealable plastic bag with 1–2 ml of 1x TAE running buffer at room temperature for 1 day
or in the refrigerator (4°C) for up to 1 week before using. Have your students label their
plastic bags.
Option 2: If there is sufficient time to proceed to Lesson 2, place the tray onto the leveled
DNA electrophoresis chamber so that the sample wells are at the black (cathode) end of
the base. DNA samples will migrate towards the red (anode) end of the chamber during
electrophoresis.
Restriction Digests. A 45-minute incubation at 37°C is the optimum digestion condition.
If a 37°C heating block, water bath or incubator is not available, samples can be digested
by placing tubes in foam micro test tube holders, floating them in a large volume (1 liter or
more) of 37°C water, and allowing them to incubate overnight as the water cools to room
temperature.
Instructor’s Manual
15
INSTRUCTOR'S MANUAL
ADVANCE PREPARATION
c. Procedure for Casting Gels
Practice Using Micropipets (Optional)
We recommend that you familiarize your students with proper pipeting techniques
prior to Lesson 1. Have your students learn how to transfer different volumes of a solution from one tube into another with a micropipet. Students may practice by using either
sample loading dye or food coloring mixed with either a dense saturated sugar or glycerol
solution. Here is a quick summary on how to use micropipets:
1. Look at the micropipet to determine the volume range.
2. Twist the dial on the micropipet to set the desired volume.
3. Attach a clean pipet tip.
INSTRUCTOR'S MANUAL
ADVANCE PREPARATION
4. Press the micropipet plunger to the first (soft) stop.
5. Insert the pipet tip into the solution to be transferred.
6. Slowly release the plunger to retrieve the liquid.
7. Insert the pipet tip into the desired tube.
8. Press the plunger past the first stop to the second (hard) stop to transfer the liquid.
Make sure to keep the plunger pressed when lifting the pipet tip out of the tube.
9. Eject the pipet tip.
Instructor’s Manual
16
Lesson 2 Agarose Gel Electrophoresis and Visualization of DNA
Fragments
Objectives
Prepare HindIII lambda digest (DNA marker) and aliquot (optional)
Aliquot sample DNA loading dye (optional)
Prepare the electrophoresis chamber
Dilute Fast Blast DNA strain to 1x (for overnight staining)
or 100x concentration (for quick staining)
Set up student and teacher workstations
Time required
45 minutes
What is required
HindIII lambda digest (DNA marker)
Sample loading dye
Electrophoresis chambers, casting trays, and combs
Electrophoresis buffer (1x TAE)*
Fast Blast DNA stain, 500x
Procedures
1. Prepare HindIII lambda digest (DNA marker) and aliquot (optional). Add 20 µl of DNA
sample loading dye to the stock tube containing the HindIII lambda DNA marker. Heat
the marker to 65°C for 5 minutes, then chill on ice — this results in better separation of
the marker bands. Label clear micro test tubes “M”. Aliquot 15 µl of the DNA markers
containing loading dye to 8 clear micro test tubes labeled “M”.
2. Aliquot DNA sample loading dye. Label eight clean micro test tubes “LD” for loading
dye and aliquot 50 µl of sample loading dye into each tube. Distribute one tube to each
team.
3. Prepare the electrophoresis chamber. When the agarose gel has solidified, sample
loading and electrophoresis can begin.
a.
b.
c.
d.
When placing the gel tray into the electrophoresis chamber, make sure that the
sample wells are at the black cathode end. DNA samples will migrate toward the
red anode end during electrophoresis. Make sure the tray is fully seated in the
chamber.
Prepare the required volume of 1x TAE buffer, if you have not prepared it already.
Submerge the gel under about 2 mm of 1x TAE buffer.
Prepare samples for gel loading. See laboratory protocol in the student section.
Note: Power requirements vary depending on gel thickness, length, and concentration, and
on type of electrophoresis buffer used. For this exercise we recommend using a constant
voltage of 100 V for 30 min. See Appendix D for a faster electrophoresis protocol which
allows the gel to be run in 20 min.
4. Prepare Fast Blast DNA stain
a. To prepare 100x stain (for quick staining), dilute 100 ml of 500x Fast Blast with
400 ml of distilled or deionized water in an appropriately sized flask or bottle and
mix. Cover the flask and store at room temperature until ready to use.
b. To prepare 1x stain (for overnight staining), dilute 1 ml of 500x Fast Blast with 499 ml
of distilled or deionized water in an appropriately sized flask or bottle and mix. Cover
the flask and store at room temperature until ready to use.
* 0.25 x TAE buffer is used for fast gel electrophoresis. Refer to Appendix D for detailed information.
Instructor’s Manual
17
INSTRUCTOR'S MANUAL
ADVANCE PREPARATION
Advance Preparation
Making DNA Visible
Fast Blast DNA stain is a convenient, safe, and nontoxic alternative to ethidium
bromide for the detection of DNA in agarose gels following electrophoresis. Fast Blast
contains a cationic compound that is in the thiazin family of dyes. The positively
charged dye molecules are attracted to and bind to the negatively charged phosphate
groups on DNA molecules. The proprietary dye formula stains DNA deep blue in
agarose gels and provides vivid, consistent results and detects as little as 50 nanograms
of DNA.
INSTRUCTOR'S MANUAL
ADVANCE PREPARATION
Fast Blast DNA stain is provided as a 500x concentrate that must be diluted prior to
use. The stain can be used as a quick stain when diluted to a 100x concentration to allow
the visualization of DNA within 12–15 minutes or used as an overnight stain when diluted
to 1x concentration. When the agarose gel is immersed in Fast Blast DNA stain, the dye
molecules attach to the DNA molecules trapped in the agarose gel. When the DNA bands
are visible, your students can compare the DNA restriction patterns of the different samples
of DNA.
Detailed instructions on using Fast Blast are included in the student manual.
WARNING
Although Fast Blast DNA stain is nontoxic and noncarcinogenic, latex or vinyl
gloves should be worn while handling the stain or stained gels to keep hands from
becoming stained blue. Lab coats or other protective clothing should be worn to
avoid staining clothes. Dispose of the staining solutions according to protocols at
your facility. Use either 10% bleach solution or a 70% alcohol solution to remove
Fast Blast from most surfaces. Verify that these solutions do not harm the surface
prior to use.
Note:
•
We recommend using 120 ml of diluted Fast Blast to stain two 7 x 7 cm or 7 x 10 cm
agarose gels in individual staining trays provided in the kit (you may want to notch gel
corners for identification). If alternative staining trays are used, add a sufficient volume
of staining solution to completely submerge the gels.
•
Following electrophoresis, agarose gels must be removed from their gel trays before
being placed in the staining solution. This is easily accomplished by holding the base
of the gel tray in one hand and gently pushing out the gel with the thumb of the other
hand.
•
Because the gel is fragile, special attention must be given when handling it. We highly
recommend using a large spatula or other supportive surface to transfer the gel from
one container to another during the destaining steps involved with the quick staining
protocol.
•
Destaining (when performing the quick staining protocol) requires the use of at least
one large-volume container, capable of holding at least 500 ml, at each student
workstation. Each student team may utilize separate washing containers for each
wash step, or simply use a single container that is emptied after each wash and refilled
for the next wash.
•
100x Fast Blast can be reused at least seven times.
•
No washing or destaining is required when using the overnight staining protocol.
Instructor’s Manual
18
To obtain a permanent record of the gel before it is dried, either trace the gel outline (including
wells and DNA bands) on a piece of paper or acetate, take a photograph with a digital camera,
photocopy the gel or scan the gel.
Drying the Agarose Gel as a Permanent Record of the Experiment
We recommend using Bio-Rad’s exclusive gel support film (catalog #170-2984EDU)
to dry agarose gels. Remove the stained agarose gel from its staining tray and trim away
any unloaded lanes with a knife or razor blade. Place the gel directly upon the hydrophilic
side of a piece of gel support film. (Water will form beads on the hydrophobic side but will
spread flat on the hydrophilic side of the film.) Center the gel on the film and remove
bubbles that may form between the gel and film. Place the film on a paper towel and let
the gel dry, making sure to avoid direct exposure to light. As the gel dries, it will bond to
the film but will not shrink. If left undisturbed on the support film, the gel will dry completely
at room temperature after 2–3 days. The result will be a flat, transparent, and durable
record of the experiment.
Gel Support Film
Note: Avoid extended exposure of dried gels to direct light to prevent band fading.
However, DNA bands will reappear if the dried gels are stored in the dark for 2–3 weeks
after fading.
Graphing the Data
Many of your students may not be familiar with logarithms and semilog graph paper. It
is suggested that you prepare a short lesson to demonstrate the proper way to label the
coordinates and plot the points. You might also choose to discuss the advantage of using
semilog vs. standard graph paper in this instance. A math extension here can also provide
an opportunity to explore linear and exponential (arithmetic and geometric) sequences of
numbers. We have included semilog graph paper on page 44 of this manual.
Instructor’s Manual
19
INSTRUCTOR'S MANUAL
ADVANCE PREPARATION
Note: Drying agarose gels requires the use of Bio-Rad’s specially formulated high-strength
analytical grade agarose. Other gel media may not be appropriate for this purpose.
Forensic DNA Fingerprinting Kit Quick Guide
Lesson 1 Restriction Digestion
1.
Place the tube containing the restriction enzyme mix, labeled ENZ, on ice.
2.
Label one of each colored micro test
tubes as follows:
green tube
CS (crime scene)
blue tube
S1 (suspect 1)
orange tube S2 (suspect 2)
violet tube
S3 (suspect 3)
red tube
S4 (suspect 4)
yellow tube
S5 (suspect 5)
Ice
ENZ
CS
S2
S1
S3
S5
S4
Label the tubes with your name, date,
and lab period. Place the tubes in the
foam micro test tube holder.
QUICK GUIDE
3.
Using a fresh tip for each sample,
pipet 10 µl of each DNA sample from
the stock tubes and transfer to the
corresponding colored micro test
tubes. Make sure the sample is
transferred to the bottom of the tubes.
4.
Pipet 10 µl of enzyme mix (ENZ) into
the very bottom of each tube. Use a
fresh tip to transfer the ENZ sample
to each tube. Pipet up and down
carefully to mix well.
5.
Tightly cap the tubes and mix
the components by gently flicking
the tubes with your finger. If a
microcentrifuge is available, pulsespin in the centrifuge to collect all the
liquid in the bottom of the tube.
Otherwise, gently tap the tube on
the table top.
6.
Place the tubes in the foam micro tube
holder and incubate for 45 min at 37°C
or overnight at room temperature in a
large volume of water heated to 37°C.
7.
If required, follow the instructors
directions to pour a 1% agarose gel.
8.
After the incubation period, remove the
tubes from the water bath and place in
the refrigerator until the next laboratory
period. If there is sufficient time to
continue, proceed directly to step 2 of
Lesson 2.
DNA Samples
+
Enzyme Mix
Stock
CS
S1
S2
S3
S4
Flick
Student Manual
Water bath
20
S5
Tap
Lesson 2 Agarose Gel Electrophoresis
1. Remove the digested DNA samples from the
refrigerator (if applicable).
Centrifuge
2. If a centrifuge is available, pulse spin the
tubes in the centrifuge to bring all of the
liquid into the bottom of the tube or gently tap
on the table top.
3. Using a separate tip for each sample, add
5 µl of loading dye "LD" into each tube. Cap
the tubes and mix by gently flicking the tube
with your finger. Collect the sample at the
bottom of the tube by tapping it gently on the
table or by pulse-spinning in a centrifuge.
DNA Loading Dye
4. Remove the agarose gel from the refrigerator
(if applicable) and remove the plastic wrap.
5. Place the agarose gel in the electrophoresis
apparatus. Fill the electrophoresis chamber
with 1x TAE buffer* to cover the gel, using
approximately 275 ml of buffer for a Bio-Rad
Mini-Sub Cell, horizontal electrophoresis
chamber.
(+)
(–)
6. Check that the wells of the agarose gels are
near the black (–) electrode and the bottom
edge of the gel is near the red (+ ) electrode.
QUICK GUIDE
7. Using a separate tip for each sample, load
the indicated volume of each sample into
7 wells of the gel in the following order:
Lane 1: M, DNA size marker, 10 µl
Lane 2: CS, green tube, 20 µl
Lane 3: S1, blue tube, 20 µl
Lane 4: S2, orange tube, 20 µl
Lane 5: S3, violet tube, 20 µl
Lane 6: S4, red tube, 20 µl
Lane 7: S5, yellow tube, 20 µl
8. Carefully place the lid on the electrophoresis
chamber. The lid will attach to the base in
only one orientation. The red and black jacks
on the lid of the horizontal electrophoresis
chambers will match with the red and black
jacks on the base. Plug the electrodes into
the power supply, red to red and black to
black.
9. Turn on the power and electrophorese your
samples at 100 V for 30 minutes.
* or 0.25x TAE if using the Fast Gel Protocol
Student Manual
21
Visualization of DNA Fragments
1. When the electrophoresis run is complete,
turn off the power and remove the top of
the chamber. Carefully remove the gel and
tray from the gel box. Be careful — the gel
is very slippery. Slide the gel into the
staining tray.
2. You have two options for staining your gel:
Quick staining (requires 12–15 minutes)
QUICK GUIDE
a. Add 120 ml of 100x Fast Blast DNA
stain into a staining tray (2 gels per
tray).
b. Stain the gels for 2 minutes with
gentle agitation. Save the used stain
for future use.
c. Transfer the gels into a large
washing container and rinse with
warm (40–55°C) tap water for
approximately 10 seconds.
d. Destain by washing twice in warm tap
water for 5 minutes each with gentle
shaking for best results.
e. Record results.
f. Trim away any unloaded lanes.
g. Air-dry the gel on gel support film and
tape the dried gel into your laboratory
notebook.
Overnight staining
a. Add 120 ml of 1x Fast Blast DNA
stain to the staining tray (2 gels per
tray).
b. Let the gels stain overnight, with
gentle shaking for best results. No
destaining is required.
c. Pour off the stain into a waste
beaker.
d. Record results.
e. Trim away any unloaded lanes.
f. Air-dry the gel on gel support film and
tape the dried gel into your laboratory
notebook.
Student Manual
22
Student Manual
Pre-Lab Introduction to DNA Fingerprinting
You are about to perform a procedure known as DNA fingerprinting. The data obtained
may allow you to determine if the samples of DNA that you will be provided with are from the
same individual or from different individuals. For this experiment it is necessary to review the
structure of DNA molecules.
DNA consists of a series of nitrogenous base molecules held together by weak hydrogen
bonds. These base pairs are in turn bonded to a sugar-phosphate backbone. The four
nitrogenous bases are adenine, thymine, guanine, and cytosine (A, T, G, and C).
Remember the base-pairing rule is A - T and G - C. Refer to the figure below of a DNA
molecule.
The Structure of DNA
The schematics above represent a very small section of DNA from three different
individuals. In this representation of DNA the symbol system is as follows:
Backbone:
S = Five carbon sugar molecule known as deoxyribose
P = Phosphate group
DNA Nucleotide Bases:
A = adenine
C = cytosine
G = guanine
T = thymine
Student Manual
23
STUDENT MANUAL
BACKGROUND
Analysis of the three DNA samples above (see next page) might help us detect
similarities and differences in samples of DNA from different people.
STUDENT MANUAL
PRE-LAB ACTIVITY
Pre-Lab Focus Questions: Introduction to DNA Fingerprinting
Consideration What is the structure of DNA?
1. Compare the “backbone” of the sugar-phosphate arrangement in the side chains of all
three figures. Are there any differences?
2. In the above figure, do all three samples contain the same bases? Describe your
observations.
3. Are the bases paired in an identical manner in all three samples? Describe the pattern
of the base pair bonding.
4. In your attempt to analyze DNA samples from three different individuals, what conclusions
can you make about the similarities and differences of the DNA samples?
5. What will you need to compare between these DNA samples to determine if they are
identical or non-identical?
Student Manual
24
Lesson 1 Restriction Digestion of DNA Samples
Consideration How can we detect differences in base sequences?
In 1968, Dr. Werner Arber at the University of Basel, Switzerland and Dr. Hamilton
Smith at the Johns Hopkins University, Baltimore, discovered a group of enzymes in
bacteria, which when added to any DNA will result in the breakage [hydrolysis] of the
sugar-phosphate bond between certain specific nucleotide bases [recognition sites]. This
causes the double strand of DNA to break along the recognition site and the DNA molecule
becomes fractured into two pieces. These molecular scissors or “cutting” enzymes are
restriction endonucleases.
Two common restriction enzymes (endonucleases) are EcoRI and PstI which will be
provided to you in this lab procedure. To better understand how EcoRI and PstI may help
you in performing your DNA fingerprinting experiment, first you must understand and
visualize the nature of the "cutting" effect of a restriction endonuclease on DNA:
✄
✄
AT G A AT T C T C A AT TAC C T
TAC T TA AG AG T TA AT G G A
The line through the base pairs represents the sites where bonds will break if the restriction
endonuclease EcoRI recognizes the site GAATTC. The following analysis questions refer to
how a piece of DNA would be affected if a restriction endonuclease were to "cut" the DNA
molecule in the manner shown above.
1. How many pieces of DNA would result from this cut? ___________
2. Write the base sequence of the DNA fragments on both the left and right side of the
“cut”.
Left:
Right:
3. What differences are there in the two pieces?
Student Manual
25
STUDENT MANUAL
LESSON 1
At first sight, your task might seem rather difficult. You need to determine if the linear
base pair sequence in the DNA samples is identical or not! An understanding of some
historically important discoveries in recombinant DNA technology might help you to develop
a plan.
4. DNA fragment size can be expressed as the number of base pairs in the fragment. Indicate
the size of the fragments [mention any discrepancy you may detect].
a) The smaller fragment is ___________ base pairs (bp).
b) What is the length of the longer fragment? ______________
5. Consider the two samples of DNA shown below - single strands are shown for simplicity:
Sample #1
STUDENT MANUAL
LESSON 1
CAGTGATCTCGAATTCGCTAGTAACGTT
Sample #2
TCATGAATTCCTGGAATCAGCAAATGCA
If both samples are treated with the restriction enzyme EcoRI [recognition sequence
GAATTC] then indicate the number of fragments and the size of each fragment from each
sample of DNA.
Sample # 1
Sample # 2
# of fragments:________
# of fragments:_________
List fragment size in order: largest ——> smallest
Sample # 1
Sample # 2
Student Manual
26
Lesson 1 Restriction Digestion of DNA Samples
Upon careful observation, it is apparent that the only difference between the DNA of
different individuals is the linear sequence of their base pairs. In the lab, your team will be
given 6 DNA samples. Recall that your task is to determine if any of them came from the
same individual or if they came from different individuals.
•
The similarities and differences between the DNA from different individuals.
•
How restriction endonucleases cut (hydrolyze) DNA molecules.
•
How adding the same restriction endonuclease to two samples of DNA might provide
some clues about differences in their linear base pair sequence.
Now that you have a fairly clear understanding of these three items you are ready to
proceed to the first phase of the DNA fingerprinting procedure—performing a restriction
digest of your DNA samples.
Your Workstation Checklist
Make sure the materials listed below are present at your lab station prior to beginning
the lab.
Material Needed for Each Workstation
Agarose gel electrophoresis system (electrophoresis
chamber, casting tray, 8-well comb)
EcoRI/PstI enzyme mix
Pipet tips, 2–200 µl
Micropipet, 2–20 µl
Colored micro test tubes:
green, blue, orange, violet, red, yellow
Permanent marker
Waste container
Foam micro test tube holder
Laboratory tape (not 3M Scotch brand or similar tape)
Instructor’s Workstation
Crime scene DNA with buffer, rehydrated
Suspect 1 DNA with buffer, rehydrated
Suspect 2 DNA with buffer, rehydrated
Suspect 3 DNA with buffer, rehydrated
Suspect 4 DNA with buffer, rehydrated
Suspect 5 DNA with buffer, rehydrated
Molten 1% agarose in 1x TAE (See Advance Prep)
37°C water bath or incubator (optional)
Microcentrifuge
or mini centrifuge
Quantity
1
✔)
(✔
❑
1 tube (80 µl)
15 tips
1
❑
❑
❑
1
1
1
1
1
❑
❑
❑
❑
❑
1 vial
1 vial
1 vial
1 vial
1 vial
1 vial
40–50 ml per gel
1 per class
1 per class
4 per class
❑
❑
❑
❑
❑
❑
❑
❑
❑
❑
Student Manual
27
STUDENT MANUAL
LESSON 1
Thus far you have learned the following:
Observations
1) Describe the samples of DNA (physical properties).
2) Is there any observable difference between the samples of DNA?
3) Describe the appearance of the restriction endonuclease mix.
STUDENT MANUAL
LESSON 1
4) Combine and react.
Using a new pipet tip for each sample, pipet 10 µl of the enzyme mix “ENZ” to each
reaction tube as shown below. Pipet up and down carefully to mix well.
Note: Change tips whenever you switch reagents, or, if the tip touches any of the liquid
in one of the tubes accidentally. When in doubt, change the tip! DNA goes in the tube
before the enzyme. Always add the enzyme last.
ENZ
CS
S1
S2
S3
S4
S5
Now your DNA samples should contain:
DNA Samples
(10 µl each)
Crime Scene [CS]
Suspect 1 [S1]
Suspect 2 [S2]
Suspect 3 [S3]
Suspect 4 [S4]
Suspect 5 [S5]
EcoRI/PstI
Enzyme Mix
10 µl
10 µl
10 µl
10 µl
10 µl
10 µl
Student Manual
28
Total
Reaction
Volume
20 µl
20 µl
20 µl
20 µl
20 µl
20 µl
5. Mix the tube contents.
CS
S1
S2
S3
S4
S5
Flick
Tap
6. Incubate the samples.
Place the tubes in the foam micro tube holder and incubate them at 37°C for 45 minutes.
Alternatively, the tubes can be incubated in a large volume of water heated to 37°C and
allowed to slowly reach room temperature overnight. After the incubation, store the
DNA digests in the refrigerator until the next lab period, or proceed directly to step 2 of
Lesson 2 if instructed by your teacher.
Water bath
Note: While you are waiting, this is a good time to cast your agarose gel, unless they
have already been prepared for you. Check with your teacher for the proper procedure.
Student Manual
29
STUDENT MANUAL
LESSON 1
Tightly cap on each tube. Mix the components by gently flicking the tubes with your
finger. If there is a centrifuge available, pulse the tubes for two seconds to force the
liquid into the bottom of the tube to mix and combine reactants. (Be sure the tubes are
in a BALANCED arrangement in the rotor). If your lab is not equipped with a centrifuge,
briskly shake the tube (once is sufficient) like a thermometer. Tapping the tubes on the
lab bench will also help to combine and mix the contents.
Lesson 1 Restriction Digestion of DNA Samples
Review Questions
1. Before you incubated your samples, describe any visible signs of change in the contents
of the tubes containing the DNA after it was combined with the restriction enzymes.
STUDENT MANUAL
LESSON 1
2. Can you see any evidence to indicate that your samples of DNA were fragmented or
altered in any way by the addition of EcoRI/PstI? Explain.
3. In the absence of any visible evidence of change, is it still possible that the DNA samples
were fragmented? Explain your reasoning.
4. (Answer the next day—after the restriction digest)
After a 24 hour incubation period, are there any visible clues that the restriction
enzymes may have in some way changed the DNA in any of the tubes? Explain your
reasoning.
Student Manual
30
Lesson 2 Agarose Gel Electrophoresis (Laboratory Procedure)
Student Workstations
Agarose gel electrophoresis system
Agarose gel
Digested DNA samples
HindIII lambda digest (DNA markers)
DNA sample loading dye
Permanent marker
Pipet tips, 2–20 µl
Micropipet, 2–20 µl
Waste container
Gel support film (if applicable)*
Fast Blast DNA stain, 1x or 100x*
Large containers for destaining (if applicable)*
Foam micro test tube holder
Power supply
Gel staining tray
Electrophoresis buffer (1x TAE)**
Instructor’s Workstation
Microcentrifuge
or mini centrifuge (optional)
Rocking platform (optional)
✔)
(✔
❑
❑
❑
❑
❑
❑
❑
❑
❑
❑
❑
❑
❑
❑
❑
❑
Quantity
1
1
6
1
1
1
13
1
1
1
120 ml per 2 stations
1–3 per 2 stations
1
1
1 per 2 stations
275 ml per station
❑
❑
❑
1
4
1
** 0.25 x TAE buffer is used for fast gel electrophoresis. Refer to Appendix D for detailed information.
Student Manual
31
STUDENT MANUAL
LESSON 2
*If performing the quick staining procedure.
Lesson 2 Agarose Gel Electrophoresis (Laboratory Procedure)
1. Obtain a prepoured agarose gel from your teacher, or if your teacher instructs you to do
so, prepare your own gel.
2. After preparing the gel, remove your digested samples from the refrigerator.
Using a new tip for each sample add 5 µl of sample loading dye "LD" to each tube:
DNA Samples
Crime Scene [CS]
Suspect 1 [S1]
Suspect 2 [S2]
Suspect 3 [S3]
Suspect 4 [S4]
Suspect 5 [S5]
Loading dye
5 µl
5 µl
5 µl
5 µl
5 µl
5 µl
Loading Dye
CS
S1
S2
S3
S4
S5
Flick
Tap
LD
STUDENT MANUAL
LESSON 2
Tightly cap each tube. Mix the components by gently flicking the tubes with your finger.
If a centrifuge is available, pulse spin the tubes to bring the contents to the bottom of the
tube. Otherwise, gently tap the tubes on the table top.
3. Place the casting tray with the solidified gel in it, into the platform in the gel box. The
wells should be at the (–) cathode end of the box, where the black lead is connected.
Very carefully, remove the comb from the gel by pulling it straight up.
4. Pour ~ 275 ml of electrophoresis buffer into the electrophoresis chamber. Pour buffer in
the gel box until it just covers the wells of the gel by 1–2 mm.
–
+
5. Obtain the tube of HindIII lambda digest (DNA marker). The loading dye should already
have been added by your instructor.
32
Student Manual
6. Using a separate pipet tip for each sample, load your digested DNA samples into the
gel. Gels are read from left to right. The first sample is loaded in the well at the left hand
corner of the gel.
Lane 1:
HindIII DNA size marker, clear tube, 10 µl
Lane 2:
CS, green tube, 20 µl
Lane 3:
S1, blue tube, 20 µl
Lane 4:
S2, orange tube, 20 µl
Lane 5:
S3, violet tube, 20 µl
Lane 6:
S4, red tube, 20 µl
Lane 7:
S5, yellow tube, 20 µl
7. Secure the lid on the gel box. The lid will attach to the base in only one orientation: red
to red and black to black. Connect electrical leads to the power supply.
+
While you are waiting for the gel to run, you may begin the review questions on the
following page.
9. When the electrophoresis is complete, turn off the power supply and remove the lid
from the gel box. Carefully remove the gel tray and the gel from the electrophoresis
chamber. Be careful, the gel is very slippery! Proceed to pg 35 for detailed instructions
on staining your gel.
Student Manual
33
STUDENT MANUAL
LESSON 2
8. Turn on the power supply. Set it for 100 V and electrophorese the samples for at least
30 min. The gel can be run for up to 40 min to improve resolution if the time is available.
The Fast Gel Protocol in Appendix D allows the gel to be run in 20 min at 200 V.
Lesson 2 Agarose Gel Electrophoresis
Review Questions
1. The electrophoresis apparatus creates an electrical field with positive and negative
poles at the ends of the gel. DNA molecules are negatively charged. To which electrode
pole of the electrophoresis field would you expect DNA to migrate? (+ or -)? Explain.
2. What color represents the negative pole?
3. After DNA samples are loaded into the sample wells, they are “forced” to move through
the gel matrix. What size fragments (large vs. small) would you expect to move toward
the opposite end of the gel most quickly? Explain.
STUDENT MANUAL
LESSON 2
4. Which fragments (large vs. small) are expected to travel the shortest distance from the
well? Explain.
Student Manual
34
Staining DNA with Fast Blast DNA Stain (Laboratory Procedure)
Consideration Are any of the DNA samples from the suspects the same as that of
the individual at the crime scene?
Take a moment to think about how you will perform the analysis of your gel. In the final
two steps, you will:
A. Visualize DNA fragments in your gel.
B. Analyze the number and positions of visible DNA bands on your gel.
Making DNA Fragments Visible
Since DNA is naturally colorless, it is not immediately visible in the gel. Unaided visual
examination of the gel after electrophoresis indicates only the positions of the loading dyes
and not the positions of the DNA fragments. DNA fragments are visualized by staining the
gel with a blue stain called Fast Blast DNA stain. The blue stain molecules are positively
charged and have a high affinity for the DNA. These blue stain molecules strongly bind to
the DNA fragments and allow DNA to become visible. These visible bands of DNA may
then be traced, photographed, sketched, or retained as a permanently dried gel for analysis.
Detained instruction on staining your gel are found on the following pages.
•
Each lane has a different sample of DNA
•
Each DNA sample was treated with the same restriction endonucleases.
With reference to the numbered lanes, analyze the bands in the gel drawing below,
then answer the questions on page 40. Note that this picture is an example and it may not
correspond to the pattern of bands that you will see in the lab.
Lane
1 2
3 4 5 6
Student Manual
35
STUDENT MANUAL
LESSON 2
The drawing below represents an example of a stained DNA gel after electrophoresis.
For fingerprinting analysis, the following information is important to remember:
Staining DNA with Fast Blast DNA Stain (Laboratory Procedure)
There are two protocols for using Fast Blast DNA stain in the classroom. Use option 1
for quick staining of gels to visualize DNA bands in 12–15 minutes, and option 2 for
overnight staining. Depending on the amount of time available, your teacher will decide
which protocol to use. Two student teams will stain the gels per staining tray (you may want
to notch gel corners for identification). Mark staining trays with initials and class period
before beginning this activity.
WARNING
Although Fast Blast DNA stain is nontoxic and noncarcinogenic, latex or vinyl
gloves should be worn while handling the stain or stained gels to keep hands from
becoming stained blue. Lab coats or other protective clothing should be worn to
avoid staining clothes.
Protocol 1: Quick Staining of Agarose Gels in 100x Fast Blast DNA
Stain
This protocol allows quick visualization of DNA bands in agarose gels within 15 minutes.
For quick staining, Fast Blast DNA stain (500x) should be diluted to a 100x concentration.
We recommend using 120 ml of 100x Fast Blast to stain two 7 x 7 cm or 7 x 10 cm agarose
gels in individual staining trays provided in Bio-Rad's education kits. If alternative staining trays
are used, add a sufficient volume of staining solution to completely submerge the gels.
STUDENT MANUAL
LESSON 2
Following electrophoresis, agarose gels must be removed from their gel trays before
being placed in the staining solution. This is easily accomplished by holding the base of the
gel tray in one hand and gently pushing out the gel with the thumb of the other hand. Because
the gel is fragile, special attention must be given when handling it. We highly recommend
using a large spatula or other supportive surface to transfer the gel from one container to
another. Destaining requires the use of at least one large-volume container, capable of holding
at least 500 ml, at each student workstation. Each student team may utilize separate washing
containers for each wash step, or simply use a single container that is emptied after each
wash and refilled for the next wash.
1. Label the staining trays with your initials and class period. You will stain 2 gels per tray.
2. Stain gels
Remove each gel from the gel tray and carefully slide it into the staining tray. Pour
approximately 120 ml of 100x stain into the staining tray. If necessary, add more 100x
stain to completely submerge the gels. Stain the gels for 2–3 minutes, but not for more
than 3 minutes. Using a funnel, pour the 100x stain into a storage bottle and save it for
future use. The stain can be reused at least 7 times.
2–3 minutes
3. Rinse gels
Transfer the gels into a large container containing 500–700 ml of clean, warm
(40–55°C) tap water. Gently shake the gel in the water for ~10 seconds to rinse.
10 seconds
36
Student Manual
4.
Wash gels
Transfer the gel into a large container with 500–700 ml of clean, warm tap water. Gently
rock or shake the gel on a rocking platform for 5 minutes. If no rocking platform is available,
move the gels gently in the water once every minute.
5 minutes
5.
Wash gels
Perform a second wash as in step 4.
5 minutes
6.
Record results
Pour off the water and examine the stained gels for expected DNA bands. The bands may
appear fuzzy immediately after the second wash, but will begin to develop into sharper
bands within 5–15 minutes after the second wash. This is due to Fast Blast stain molecules
migrating into the gel and binding more tightly to the DNA.
a. Place your gel on a light background and record your results by making a diagram
as follows. Place a clear sheet of plastic sheet or acetate over the gel. With a
permanent marker, trace the wells and band patterns onto the plastic sheet to
make a replica picture of your gel. Remove the plastic sheet for later analysis.
Alternatively, gels can be photocopied on a yellow piece of transparent film for
optimal contrast.
b. Dry the agarose gel as a permanent record of the experiment.
i.
Trim away any unloaded lanes with a knife or razor blade. Cut your gel from
top to bottom to remove the lanes that you did not load samples into, leaving
only lanes 1–4.
ii. Place the gel directly upon the hydrophilic size of a piece of gel support film.
(Water will form beads on the hydrophobic side of a piece of gel support film.)
Center the gel on the film and remove bubbles that may form between the gel
and film. Place the film on a paper towel and let the gel dry in a well-ventilated
area, making sure to avoid direct exposure to light. As the gel dries it will bond
to the film but will not shrink. If left undisturbed on the support film, the gel will
dry completely at room temperature after 2–3 days. The result will be a flat,
transparent, and durable record for the experiment.
Gel support film
Student Manual
37
STUDENT MANUAL
LESSON 2
To obtain maximum contrast, additional washes in warm water may be necessary. Destain
to the desired level, but do not wash the gel in water overnight. If you cannot complete the
destaining in the allocated time, you may transfer the gel to 1x Fast Blast stain for overnight
staining. See Protocol 2.
Protocol 2: Overnight Staining of Agarose Gels in 1x Fast Blast DNA
Stain
For overnight staining, Fast Blast DNA stain (500x) should be diluted to a 1x concentration.
We recommend using 120 ml of 1x Fast Blast to stain two 7 x 7 cm or 7 x 10 cm agarose gels
in individual staining trays provided in Bio-Rad's education kits. If alternative staining trays are
used, add a sufficient volume of staining solution to completely submerge the gels.
Following DNA electrophoresis, agarose gels must be removed from their gel trays
before being placed in the staining solution. This is easily accomplished by holding the
base of the gel tray in one hand and gently pushing out the gel with the thumb of the other
hand. Because the gel is fragile, special attention must be given when handling it.
1.
Label the staining tray with your initials and class period. You will stain 2 gels per tray.
2.
Stain gels (overnight)*
Pour 1x stain into a gel staining tray. Remove the gel from the gel tray and carefully slide it
into the staining tray containing the stain. If necessary, add more 1x staining solution to
completely submerge the gels. Place the staining tray on a rocking platform and agitate
overnight. If no rocking platform is available, agitate the gels staining tray a few times during
the staining period. You should begin to see DNA bands after 2 hours, but at least 8 hours
of staining is recommended for complete visibility of stained bands.
STUDENT MANUAL
LESSON 2
Stain overnight
* It is crucial that you shake gels gently and intermittently while performing the overnight staining in 1x Fast Blast stain since smaller
fragments tend to diffuse without shaking.
38
Student Manual
3.
Record results
No destaining is required after staining with 1x Fast Blast. The gels can be analyzed
immediately after staining.
a. Place your gel on a light background and record your results by making a diagram
as follows. Place a clear sheet of plastic sheet or acetate over the gel. With a
permanent marker, trace the wells and band patterns onto the plastic sheet to
make a replica picture of your gel. Remove the plastic sheet for later analysis.
Alternatively, gels can be photocopied on a yellow piece of transparent film for
optimal contrast.
b. Dry the agarose gel as a permanent record of the experiment.
i.
Trim away any unloaded lanes with a knife or razor blade. Cut your gel from top
to bottom to remove the lanes that you did not load samples into, leaving only
lanes 1–4.
ii. Place the gel directly upon the hydrophilic size of a piece of gel support film.
(Water will form beads on the hydrophobic side of a piece of gel support film.)
Center the gel on the film on a paper towel and let the gel dry in a well-ventilated
area, making sure to avoid direct exposure to light. As the gel dries it will bond
to the film but will not shrink. If left undisturbed on the support film, the gel will
dry completely at room temperature after 2–3 days. The result will be a flat,
transparent, and durable record for the experiment.
Note: Avoid extended exposure of dried gels to direct light to prevent band fading.
However, DNA bands will reappear if the dried gels are stored in the dark for 2–3
weeks after fading.
Student Manual
39
STUDENT MANUAL
LESSON 2
Gel support film
Post-Lab: Thought Questions
1. What can you assume is contained within each band?
2. If this were a fingerprinting gel, how many samples of DNA can you assume were
placed in each separate well?
3. What would be a logical explanation as to why there is more than one band of DNA for
each of the samples?
4. What caused the DNA to become fragmented?
5. Which of the DNA samples have the same number of restriction sites for the restriction
endonucleases used? Write the lane numbers.
6. Which sample has the smallest DNA fragment?
7. Assuming a circular piece of DNA (plasmid) was used as starting material, how many
restriction sites were there in lane three?
8. From the gel drawing on page 35, which DNA samples appear to have been “cut” into
the same number and size of fragments?
STUDENT MANUAL
POST-LAB ACTIVITY
9. Based on your analysis of the example gel drawing on page 35, what is your conclusion
about the DNA samples in the drawing? Do any of the samples seem to be from the
same source? If so, which ones? Describe the evidence that supports your conclusion.
40
Student Manual
Post-Lab: Analysis of Results
If the overnight staining protocol was used to stain gels, record your results and dry gels as
described in the gel staining procedures in Lesson 2 page 38.
Attach the plastic sheet tracing of the banding patterns from the DNA electrophoresis
below.
l
f l
h
Tracing of electrophoresis gel
G l
Dried electrophoresis gel
Student Manual
41
STUDENT MANUAL
POST-LAB ACTIVITY
Attach the dried gel showing the banding patterns from the DNA electrophoresis
below.
Quantitative Analysis of DNA Fragment Sizes
If you were on trial or were trying to identify an endangered species, would you want to
rely on a technician’s eyeball estimate of a match, or would you want some more accurate
measurement?
In order to make the most accurate comparison between the crime scene DNA and the
suspect DNA, other than just a visual match, a quantitative measurement of the fragment
sizes needs to be completed. This is described below:
1. Using a ruler, measure the distance (in mm) that each of your DNA fragments or bands
traveled from the well. Measure the distance from the bottom of the well to the center of
each DNA band and record your numbers in the table on the next page. The data in the
table will be used to construct a standard curve and to estimate the sizes of the crime
scene and suspect restriction fragments.
2. To make an accurate estimate of the fragment sizes for either the crime scene or
suspect DNA samples, a standard curve is created using the distance (x-axis) and
fragment size (y-axis) data from the known HindIII lambda digest (DNA marker). Using
both linear and semilog graph paper, plot distance versus size for bands 2–6. On each
graph, draw a line of best fit through the points. Extend the line all the way to the righthand edge of the graph.
Which graph provides the straightest line that you could use to estimate the crime
scene or the suspects’ fragment sizes? Why do you think one graph is straighter than
the other?
3. Decide which graph, linear or semilog, should be used to estimate the DNA fragment
sizes of the crime scene and suspects. Justify your selection.
4. To estimate the size of an unknown crime scene or suspect fragment, find the distance
that fragment traveled. Locate that distance on the x-axis of your standard graph. From
that position on the x-axis, read up to the standard line, and then follow the graph line to
over to the y-axis. You might want to draw a light pencil mark from the x-axis up to the
standard curve and over to the y-axis showing what you’ve done. Where the graph line
meets the y-axis, this is the approximate size of your unknown DNA fragment. Do this
for all crime scene and suspect fragments.
STUDENT MANUAL
POST-LAB ACTIVITY
5. Compare the fragment sizes of the suspects and the crime scene.
Is there a suspect that matches the crime scene?
How sure are you that this is a match?
42
Student Manual
1
9,416
23,130
Approx.
size (bp)
Crime Scene
Distance
(mm)
Approx.
size (bp)
Suspect 1
Distance
(mm)
Approx.
size (bp)
Suspect 2
Distance
(mm)
Approx.
size (bp)
Suspect 3
Distance
(mm)
Approx.
size (bp)
Suspect 4
Distance
(mm)
Approx.
size (bp)
Suspect 5
STUDENT MANUAL
POST-LAB ACTIVITY
2
6,557
Distance
(mm)
Electrophoresis data: Measure the distance (in millimeters) that each fragment traveled from the
well and record it in the table. Estimate its size, in base pairs, by comparing its position to the
HindIII lambda DNA markers. Remember: some lanes will have fewer than 6 fragments.
Lambda/HindIII
size marker
3
4,361
Actual
size (bp)
4
2,322
Distance
(mm)
5
2,027
43
Band
6
Student Manual
Semilog Graph Paper
100,000
Size, base pairs
10,000
1,000
100
0
5
10
15
Distance, mm
STUDENT MANUAL
POST-LAB ACTIVITY
44
Student Manual
20
25
30
Graph Paper
25,000
15,000
10,000
5,000
0
0
5
10
15
20
25
30
Distance, mm
Student Manual
45
STUDENT MANUAL
POST-LAB ACTIVITY
Size, base pairs
20,000
Post Lab: Interpretation of Results
1. What are we trying to determine? Restate the central question.
2. Which of your DNA samples were fragmented? What would your gel look like if the
DNA were not fragmented?
3. What caused the DNA to become fragmented?
4. What determines where a restriction endonuclease will “cut” a DNA molecule?
5. A restriction endonuclease “cuts” two DNA molecules at the same location. What can
you assume is identical about the molecules at that location?
6. Do any of your suspect samples appear to have EcoRI or PstI recognition sites at the
same location as the DNA from the crime scene?
7. Based on the above analysis, do any of the suspect samples of DNA seem to be from
the same individual as the DNA from the crime scene? Describe the scientific evidence
that supports your conclusion.
STUDENT MANUAL
POST-LAB ACTIVITY
46
Student Manual
Plasmids and Restriction Enzymes
This lesson will demonstrate the principles of plasmid mapping by examining restriction
digestion patterns of plasmids used in the laboratory section of the kit and determining the
position of restriction enzyme recognition sites in the plasmids by use of logic. Plasmid
mapping has revolutionized molecular biology and paved the way for the biotechnology
industry. This technique allows molecular biologists to quickly evaluate the success of
cloning experiments as well as to easily identify plasmids and associated traits in different
organisms. Although real-world DNA fingerprinting is performed on genomic DNA, this
activity utilizes plasmid DNA to simulate how real DNA fingerprints are analyzed. Plasmids
are circular, non-chromosomal pieces of DNA that can replicate in bacteria. Plasmids often
carry genes encoding resistance to antibiotics which gives bacteria a selective advantage
over their competitors.
Scientists routinely take advantage of plasmid DNA and a natural bacterial defense
mechanism, the restriction enzyme, as the basis for much of biotechnology. Restriction
enzymes allow bacteria to destroy DNA from invading bacteriophages (phages) which are
viruses that infect and destroy bacteria. Restriction enzymes recognize specific DNA
sequences within the phage DNA and then cut the DNA at that site. Fragmented DNA no
longer poses a threat to bacterial survival. Purified restriction enzymes can be used in the
laboratory to cut DNA isolated from any organism not just phage DNA.
After plasmids are cut with a restriction enzyme, they can be joined (or ligated) to a piece
of DNA from any organism (foreign DNA) that has been cut with the same enzyme. The
resulting hybrid DNA plasmid can be put into (transformed) bacterial cells. A hybrid plasmid
can replicate itself in bacteria similar to the original plasmid, except that the foreign DNA that
was incorporated is also perpetuated. Every hybrid plasmid now contains a copy of the
piece of foreign DNA joined to it. We say that the foreign piece of DNA has been “cloned”
and the plasmid DNA that carries it is called a “vector”.
The crime scene and suspect DNA samples in this kit were created by inserting lambda
phage DNA that had been digested with the PstI restriction enzyme into PstI-digested plasmid
pTZ18U. Recombinant plasmids were selected that gave distinct, striking banding patterns,
or restriction fragment length polymorphisms (RFLP), when digested with restriction
enzymes PstI and EcoRI and analyzed on an agarose gel. Restriction maps of some of the
crime scene and suspect plasmids are included on page 48.
Plasmids can be mapped or described in terms of location of restriction sites using simple
experiments and logic. The general procedure is to cut (digest) a plasmid with two restriction
enzymes separately (two single digests) and the together (a double digest). Sizes of the
resulting DNA fragments are determined then one uses logic to determine the relative
location of the restriction sites. In the forensic DNA fingerprinting lab two restriction
enzymes, PstI and EcoRI, were used together in a double digest. The resulting fragments
were run on a gel to solve the “who done it”. The background material can be used to
construct a plasmid map
Since the plasmids are circular, the number of fragments represents the number of cuts
or restriction sites. To visualize this, take a rubber band and cut it once. How many fragments are there? Cut the same rubber band again. How many fragments are there now?
The most informative part of plasmid mapping comes from using logic to overlap the information from two single digests with information obtained from a double digest. How do the
cuts from one restriction enzyme overlay with cuts from a second restriction enzyme?
There are clues to see how to overlap them: Do any of the first fragments remain uncut
Student Manual
47
STUDENT MANUAL
EXTENSION ACTIVITY 1
Extension Activity 1: Plasmid Mapping
STUDENT MANUAL
EXTENSION ACTIVITY 1
with the second enzyme? Do the sizes of any of fragments from the double digest add up
the size of a fragment from a single digest? Do any of the fragments seem to remain the
same size after being cut by the second enzyme? A simple example is shown below:
1000 bp plasmid example
DNA size
marker
1000 bp
700 bp
500 bp
300 bp
200 bp
Undigested
Digested with
Enzyme 1
1000bp
Digested with
Enzyme 2
Digested with
Enzyme 1 & 2
1000 bp
700 bp
500 bp
300 bp
200 bp
300 bp
Note that the two 1000 bp fragments (undigested sample and sample digested with
enzyme 2) might not run at exactly the same distance on an agarose gel. There is a small
difference in migration if a fragment of the same size is uncut (circular), cut (linear) or uncut
and twisted (supercoiled). Also fragments that are very similar in size may migrate together
in an agarose gel and it may not be possible to distinguish between them. In addition,
fragments that are very small, may not be detected by the DNA stain or may run off the end
of the gel.
Reading a Plasmid Map
A plasmid map includes information on the size of the plasmid, the genes present, the
origin of replication site, and restriction sites for restriction enzymes. All five of the plasmids
used in the DNA fingerprinting activity were constructed from the same pTZ18U plasmid
parent but had different foreign fragments of DNA inserted into them. In the DNA fingerprinting
exercise, only two restriction enzymes were used, but other enzymes could also have been
used to cut these plasmids. The restriction sites are marked on the map with a number that
indicates the location of the site. Since the plasmid is circular, there is an arbitrary zero
point. All of the restriction sites are indicated with a number between zero and the total
base pairs in the plasmid. Fragment sizes can then be calculated by simple subtraction
(and in some cases addition) between points on the plasmid.
Plasmids Used In This Lesson
Plasmid maps show the positions (numbered by DNA base pairs) of sites where the
plasmid may be cut by particular restriction enzymes. The name of the plasmid and its size
of DNA in bp is shown inside the circle. In addition it shows the Origin of Replication (Ori),
the gene encoding beta lactamase (the enzyme that gives the bacteria resistance to the
antibiotic ampicillin) and the location where foreign DNA from the lambda bacteriophage
was inserted. Refer to the plasmid maps on page 49 for more detail.
48
Student Manual
STUDENT MANUAL
EXTENSION ACTIVITY 1
Sample Plasmid Maps
Plasmid S2
Plasmid S5
Student Manual
49
STUDENT MANUAL
EXTENSION ACTIVITY 1
Reading a Plasmid Map Questions
1. From the map of plasmid S2 list all the restriction enzymes that would cut this plasmid.
2. Which plasmid, S2 or S5, is the biggest and what is its size?
3. Using plasmid S2 as an example, find the restriction sites for the enzyme PvuII. How
many sites are there? What is their location? If PvuII was used to cut (digest) this
plasmid, how many fragments would it make?
4. Next determine the size of the fragments created when plasmid S2 is cut by PvuII. DNA
fragment size is calculated by subtracting the site locations from each other. (Note: if a
fragment contains the 0 point of the plasmid, it is not just a simple subtraction!). How
big are the fragments from plasmid S2 that is cut with PvuII? The fragment sizes should
add up to the total for that plasmid (5869 bp).
5. If the fragments from the plasmid S2 digested with PvuII were run on an agarose gel,
what would they look like? Draw the gel and label the fragments and their sizes.
Student Manual
50
Enzymes
Fragments
Plasmid S2 (5869 bp)
EcoRI
PstI
Both
Total
7. If plasmid S2 was digested and run on an agarose gel, what would the gel look like?
Draw a gel and the fragment sizes if digested by EcoRI alone, PstI alone and by EcoRI
and PstI together.
8. How does your diagram in question 7 compare to what was observed in your gel after
the experiment? Indicate a reason for why your data in question 7 might be different
from the actual experimental data seen from lesson 2.
Mapping the Plasmid
The first step in mapping a plasmid is to determine how many times a restriction site is
found on that plasmid. First examine the results for plasmid S5 as an example. The data
given in the following table are for the double digest using both EcoI and PstI. Also given
are the data for single digests by the individual enzymes. The numbers in the columns
under each enzyme represent the sizes of all of the fragments that are formed when each
enzyme is used for a single digest.
The charts below show the sizes of fragments that will be generated when plasmid S5
has been digested with the indicated restriction enzyme.
Student Manual
51
STUDENT MANUAL
EXTENSION ACTIVITY 1
6. Now you can determine the fragment sizes of the plasmids when cut with the two
enzymes, EcoRI and PstI. Indicate the sizes of the fragments that would be generated
if the plasmid were a digest by PstI alone, EcoRI alone or by both PstI and EcoRI.
STUDENT MANUAL
EXTENSION ACTIVITY 1
Plasmid S5
Enzymes
Fragments
Plasmid S5 (9481 bp)
EcoRI
PstI
9481
2860
2838
1986
1093
468
164
72
Both
2838
2817
1986
1093
468
164
72
43
Total
Mapping the Plasmid Questions
1. How big is plasmid S5? Add the fragments in each column. The total should add up to
the size of the plasmid. Why?
2. Look at the data from the EcoRI digest of plasmid S5. How many fragments are there?
Did the enzyme cut the plasmid, or did it remain as a circle? How could you tell?
Student Manual
52
4. How many fragments are there when EcoRI and PstI are used to digest plasmid S5?
Does that answer the question of whether or not EcoRI cut the plasmid? Why?
5. Which fragment of PstI digested plasmid S5 was shortened by a cut with EcoRI? How
do you know this?
6. Draw the PstI fragment that is cut with EcoRI in plasmid S5 to demonstrate how the
fragment was cut with EcoRI.
Enzymes
Fragments
Plasmid S3 (7367 bp)
EcoRI
PstI
6504
4507
863
2860
Both
3687
2817
820
43
Total
7. Restriction mapping is an exercise in critical thinking and logic. Plasmid S5 is difficult to
completely map because of the numerous PstI restriction sites. With the data, it would
be very difficult to place all the restriction sites in order. It is easier to map plasmid S3.
Shown above is the data generated from digestion of plasmid S3 with EcoRI and PstI.
How many times did EcoRI cut plasmid S3? What are the fragment sizes?
Student Manual
53
STUDENT MANUAL
EXTENSION ACTIVITY 1
3. Compare the data from the PstI digest of plasmid S5 with that of the EcoRI digest. How
many fragments are there? How many restriction sites are there for PstI?
STUDENT MANUAL
EXTENSION ACTIVITY 1
8. The data from the EcoRI digest of plasmid S3 indicate that the fragments are not equal.
Draw a possible map and label the EcoRI sites and the sizes of the fragments.
9. Now draw an approximate map of the PstI sites on plasmid S3 and label the PstI sites
and the sizes of the fragments.
10. Draw a circular map of plasmid S3 digested with both PstI and EcoRI. Mark sizes of
each fragment and name the restriction sites on your figure.
11. Is there another possible order of restriction sites on plasmid S3 digested with both PstI
and EcoRI? How might you resolve these possibilities?
12. When the gels were run for this experiment, there were only three bands for plasmid
S3. Which band is missing from your gel? Why?
Student Manual
54
Extension Activity 2: Constructing a Plasmid
Some plasmids replicate when the bacterial genomic DNA replicates, but others replicate
independently producing hundreds of copies of the plasmid within one cell. A self-replicating
plasmid contains its own origin of replication (Ori). Many plasmids also contain genes that
give antibiotic resistance to bacteria.
This exercise is based on plasmids used in the forensic DNA fingerprinting lab. Five
plasmids were constructed from a parent plasmid, and then were cut (digested) to make
fragments of different sizes for a gel analysis. How were the plasmids constructed? Could
one have made the plasmids differently? Can one predict fragment sizes using plasmid
maps constructed from the lambda bacteriophage genome? In this activity you will design a
new plasmid.
The parent plasmid pTZ18U used for plasmid construction is 2860 bp in size. It has
numerous restriction sites (see diagram on pages 56–57). The five plasmids constructed for
the DNA fingerprinting lab were all based on this plasmid.
The pTZ18U plasmid was digested with the PstI restriction enzyme. Lambda phage
DNA was also digested with the PstI restriction enzyme and the resulting fragments were
then inserted into the PstI – digested pTZ18U plasmid. As you look at the different plasmids,
notice that each plasmid contains different fragments of lambda phage DNA. For example,
plasmid S1 contains lambda sequence 20285–22425.
Student Manual
55
STUDENT MANUAL
EXTENSION ACTIVITY 2
Plasmids are made of DNA just like the bacterial genome. Since DNA is universal in all
living things, plasmids with inserted foreign DNA may be put into a bacteria (transforming
them), causing the bacteria to transcribe and translate that message into a protein product.
The biotech industry is in part based on this principle. Bacteria can be given human genes
via a plasmid, and once transformed can produce a human protein product.
STUDENT MANUAL
EXTENSION ACTIVITY 2
Plasmid S1
Plasmid S4
Student Manual
56
STUDENT MANUAL
EXTENSION ACTIVITY 2
Parent Plasmid pTZ18U
57
Student Manual
Constructing a Plasmid Questions
1. Where is the PstI site on the pTZ18U plasmid?
2. Look at plasmid S4. What segment of the lambda bacteriophage has been inserted?
STUDENT MANUAL
EXTENSION ACTIVITY 2
3. After looking at the plasmid map and also the lambda phage map, can you determine
how many PstI restriction sites were added to the plasmid because of the inserted
lambda phage DNA fragment? Note that it is possible for these extra PstI sites to have
been added if the original restriction digestion was done for a short time so that not all
PstI sites would have been completely cut in every piece of lambda phage DNA.
4. Look at plasmid S1. What segment of lambda was added to that plasmid? Were any
PstI restriction sites added to the plasmid with the inserted fragment of lambda DNA?
5. Now let us create a different plasmid from the parent plasmid. You will use EcoRI for
the construction and need to refer to the lambda bacteriophage genome map that
includes the EcoRI sites. You must make a plasmid that is at least 5,000 base pairs but
not more than 10,000 base pairs in size. Remember that the parent plasmid is 2860 bp
in size. Where is the EcoRI site on the parent pTZ18U plasmid?
6. Choose a segment of lambda bacteriophage genome that could be cut out by the
EcoRI enzyme. Which segment will you use?
Student Manual
58
8. How many restriction sites are there now for PstI in your new plasmid? Predict what
fragments you would generate if you were to digest your plasmid with:
i.
EcoRI alone
ii.
PstI alone
iii. EcoRI and PstI together (a double digest)
9. Draw an agarose gel for each of these digests and label the fragment sizes.
10. The lambda phage fragment can be inserted into the host plasmid in either orientation
– forwards or backwards. How could you use plasmid mapping to determine in which
orientation your fragment was inserted? Use a diagram in your explanation.
59
Student Manual
STUDENT MANUAL
EXTENSION ACTIVITY 2
7. Draw your new plasmid with the insert of your choice. Be sure to include the restriction
sites for PstI and EcoRI in your drawing. How big is your new plasmid? Give the
positions of the restriction sites in your new plasmid a number indicating the location.
Remember that the first EcoRI site will still be position 255 as it is in the parent pTZ18U
plasmid map.
Appendix A
Alternative DNA Fingerprinting Scenarios
DNA typing, DNA profiling, and DNA fingerprinting are all names for the same process,
a process that uses DNA to show relatedness or identity of individual humans, plants, or
animals. DNA typing has become the subject of much debate and interest because of its
uses for forensics analysis in prominent criminal cases such as the O. J. Simpson case.
The applications of DNA typing, however, are much broader than forensic science alone
and are having a profound impact on our society.
DNA typing is used in forensics, anthropology, and conservation biology not only to
determine the identity of individuals but also to determine relatedness. This process has
been used to free innocent suspects, reunite children with their relatives, identify stolen
animals, and prove that whale meat has been substituted for fish in sushi. It is used in
times of war to help identify the remains of soldiers killed in combat. It is also being used to
find genetic linkages to inherited diseases. In addition, scientists are learning a great deal
about our evolutionary history from DNA analysis.
Each of the following paragraphs describes a scenario in which DNA has been used to
show how individuals are related to each other, or to show that a person is (or is not) the
perpetrator of a crime. These scenarios provide a context for using DNA typing for use in
teaching molecular biology, conservation biology, and biotechnology. Have your students
research a scenario that is interesting to them and present their findings to the class.
1. Food identification (endangered species identification).
APPENDIX A
The purity (or impurity) of ground beef has been proven using DNA typing. Hamburger
has been shown to often be a mixture of pork and other non-beef meats. Using portable
testing equipment, authorities have used DNA typing to determine that the fish served
in sushi was really meat from whales and dolphins. These are, many times, endangered
species that are protected by international law.
2. Accused and convicted felons set free because of DNA typing.
A man imprisoned for 10 years was released when DNA testing, unavailable when he
was convicted, was used to show that he could not have been the rapist. Statistics
show that about 1/3 of all sexual assault suspects are freed as a result of DNA testing.
3. Identifying human remains.
Scientists have used DNA typing to confirm that the body in the grave was (or was not)
the person that was supposed to be there. Bones found in Russia are believed to be
those of the Romanovs, Russia’s last imperial family. Czar Nicholas II and his family
were executed by the Bolsheviks in 1918. Experts from around the world have been
studying the bones to match skulls, teeth, and other features with photographs. DNA
from the bones was compared to that of known descendants and it was determined that
the bones do belong to the czar and his family (“Identification of the remains of the
Romanov family by DNA analysis” Nature Genetics vol 6, 130, 1994.)
60
4. Determining relatedness of humans.
DNA typing has shown that the 5,000 year old “Iceman” found in a melting glacier is
most closely related to modern Europeans. ("Iceman Gets Real." Science, vol.
264:1669. June 17, 1994.) The DNA typing evidence also “removes all the suspicions
that the body was a fraud—that it had been placed on the ice,” says Svante Paabo of
the University of Munich. (Science, vol. 264:1775. June 17, 1994).
5. Studying relatedness among ancient peoples.
DNA found at archeological sites in western Montana is being used to help determine
how many related groups of people (families) lived at a particular site. (Morell, Virginia.
"Pulling Hair from the Ground." Science, vol. 265:741-745 August 1994.)
6. DNA testing of families.
DNA testing of families has been used in Argentina and El Salvador to identify the
children of at least 9,000 citizens of these countries who disappeared between 1975
and 1983, abducted by special units of the ruling military and police. Many of the children
born to the disappeared adults were kidnapped and adopted by military "parents" who
claimed to be their biological parents. After genetic testing of the extended family
revealed the true identity of a child, the child was placed in the home of its biological
relatives. It was feared that transferring a child from its military "parents" who were
kidnappers, but who had reared the child for years, would be agonizing. In practice, the
transferred children became integrated into their biological families with minimal trauma.
7. Identifying organisms that cause disease.
Eva Harris, a UCSF scientist, has helped scientists in Nicaragua and Ecuador to learn
to use DNA technology to detect tuberculosis, and identify the dengue virus and various
strains of Leishmania. Other available tests cause waits of many weeks while disease
organisms are cultured and sent to foreign labs to be identified. (Marcia Barinaga, "A
Personal Technology Transfer Effort in DNA Diagnostics." Science, vol. 266:1317–1318.
Nov. 25, 1994.)
Girls in Florida were discovered to have been switched at birth when one girl died of a
hereditary disease. The disease was not in her family, but was known to be in the family
of another girl, born in the same hospital and about the same time she was born.
9. Proving paternity.
A woman, raped by her employer on Jan. 7, 1943, her 18th birthday, became pregnant.
The child knew who her father was, but as long as he lived, he refused to admit being
her father. After the man died, DNA testing proved that she was his daughter and she
was granted a half of his estate. ("A Child of Rape Wins Award from Estate of Her
Father." New York Times, July 10, 1994.)
61
APPENDIX A
8. Identifying birth parents (paternity testing).
10. Determining effectiveness of bone marrow transplants.
"DNA fingerprinting can help doctors to monitor bone marrow transplants. Leukemia is
a cancer of the bone marrow and the diseased marrow must be removed. The bone
marrow makes new blood cells, so the leukemia sufferer will die without a transplant of
healthy marrow. Doctors can quickly tell whether the transplant has succeeded by DNA
typing of the patient and the donor. If the transplant has worked, a fingerprint from the
patient’s blood shows the donor’s bands. But if the cancerous bone marrow has not
been properly destroyed, then the cancerous cells multiply rapidly and the patient’s own
bands predominate." ("Our Ultimate Identity Card in Sickness and in Health," in "Inside
Science", New Scientist, Nov. 16, 1991.)
11. Proving relatedness of immigrants.
DNA fingerprinting has been used as proof of paternity for immigration purposes. In
1986, Britain’s Home Office received 12,000 immigration applications from the wives
and children of Bangladeshi and Pakistani men residing in the United Kingdom. The
burden of proof is on the applicant, but establishing the family identity can be difficult
because of sketchy documentary evidence. Blood tests can also be inconclusive, but
DNA fingerprinting results are accepted as proof of paternity by the Home Office. (DNA
fingerprints, source unknown: Based on A. J. Jeffreys et al., "Positive Identification of
an Immigration Test-Case Using Human DNA Fingerprints." Nature, vol. 317:818–819,
1985.)
12. Confirming relatedness among animals.
APPENDIX A
Scientists who extracted DNA from the hair of chimpanzees throughout Africa now
have evidence that there might be a third species of chimpanzee. At the same time
they have learned things about chimp behavior and kinship patterns that would have
once taken years to theorize. They discovered a group of chimps living in western
Africa to be genetically distinct from the chimps living in other parts of Africa, suggesting
that the group may be an endangered species. The have discovered that male chimps
living in a given area are often as closely related as half-brothers, and many so-called
sub-species may all be part of a single species. The male chimps’ relatedness may
explain why, unlike other primates, the males are quite friendly to each other.
13. DNA testing of plant material puts murderer at the scene.
Two small seed pods caught in the bed of his pick-up truck put an accused murderer at
the murder scene. Genetic testing showed that DNA in the seed pod exactly matched
the DNA of a plant found at the scene of the murder. The accused had admitted he had
given the victim a ride, but he denied ever having been near the crime scene.
62
Appendix B
Prelab Activity 1 A Review of Restriction Enzymes
DNA consists of a series of nitrogenous base molecules held together by weak hydrogen
bonds. These base pairs are in turn bonded to a sugar–phosphate backbone. The four different
nitrogenous bases are adenine, thymine, guanine and cytosine. (A, T, G, and C:
Remember the base-pairing rule is A-T and G-C). Refer to the figures below to review the
structure of a DNA molecule.
Fig. 1. The Structure of DNA
If a segment of DNA is diagrammed without the sugars and phosphates, the base-pair
sequence might appear as:
Read to the right----> A C T C C G T A G A A T T C....>
<....T G A G G C A T C T T A A G <----Read to the left
Look at the linear sequence of bases (As, Ts, etc.) on each of the strands:
1. Describe any pattern you might see in the upper sequence of bases.
2. Compare the bases in the upper portion of the molecule to those in the lower portion.
Describe any relationship you can see.
63
APPENDIX B
3. Now look at the upper sequence of bases and compare it to the lower. Do you notice
any grouping of bases that when read toward the right on the upper strand and read to
the left on the bottom strand are exactly the same?
You may have discovered that the sequence of base pairs is seemingly random and that
the two strands are complementary to each other: As are paired with Ts and Cs are paired
with Gs. You may have also noticed that a portion of the top strand GAATTC (read toward
the right), has a counterpart in the lower strand, CTTAAG (read toward the left). Example
sequences are:
GAATTC
CTTAAG
AAGCTT
TTCGAA
CTGCAG
GACGTC
When such a sequence is looked at together with its complementary sequence the
group reads the same in both directions. These sequences, called palindromes, are fairly
common along the DNA molecule.
Restriction Enzymes — Molecular Scissors
Viruses called bacteriophages frequently infect bacteria. These viruses inject their own
DNA into bacteria and force the bacteria to multiply the DNA. Bacteria have evolved
restriction enzymes, to cut up and destroy the invading viral DNA. Bacteria prevent destruction
of their own DNA by modifying certain DNA bases within the specific enzyme recognition
sequence, which allows them to protect their own DNA while cutting up viral DNA. This could
be considered a very primitive immune system. Restriction enzymes search the viral DNA
for specific palindromic sequences of base pairs, such as GAATTC, and cut the DNA at
these sites. The actual sequence of DNA is called a restriction site. Some restriction
enzymes may leave a short length of unpaired nucleotide bases, called a “sticky” end, at
the DNA site where they cut, whereas other restriction enzymes make a cut across both
strands at the same place creating double stranded DNA fragments with “blunt” ends.
Look at the DNA sequence below:
✄
Palindrome
✄
G T A G A AT T C A T T C A C G C A
C A T C T TA A G T A A G T G C G T
Restriction site
GTAG
CATCTTAA
Fragment 1
AATTCATTCACGCA
GTAAGTGCGT
“sticky” end cut
Fragment 2
APPENDIX B
A restriction enzyme cut the DNA between the G and the A in a GAATTC
palindrome.
4. How many bases are still paired to the left of the “cut”?
5. How many bases are still paired to the right of the “cut”?
6. Counting the number of paired bases, is the right fragment the same size as
the left fragment?
7. How could you describe the size of each fragment in terms of the number of
base pairs in the fragment?
64
An important feature of restriction enzymes is that each enzyme only recognizes a specific
palindrome and cuts the DNA only at that specific sequence of bases. A palindromic sequence
can be repeated a number of times on a strand of DNA, and the specific restriction enzyme
will cut all those palindromes, no matter what species the DNA comes from.
8. If the GAATTC palindrome is repeated four times on the same piece of linear DNA, and
the restriction enzyme that recognizes that base sequence is present and digests the
DNA, how many DNA fragments will be produced?
9. If the GAATTC palindrome repeats are randomly found along the DNA strand, then
what can you say about the sizes of the fragments that will be produced when the DNA
is digested with a restriction enzyme that recognizes that sequence?
The table below shows palindromic sequences that are recognized by the enzymes that
are used to digest the DNA you will be analyzing in this activity.
Name of restriction enzyme that
recognizes the palindrome
EcoRI
GAATTC
CTTAAG
AAGCTT
TTCGAA
HindIII
CTGCAG
GACGTC
PstI
65
APPENDIX B
Palindromic sequence
Below is the summary of what we have learned so far:
•
A sequence on one strand of DNA and its complementary sequence on the other
strand can form a palindrome i.e., GAATT C
CT TAAG
•
Palindromes can be detected by restriction enzymes
•
Restriction enzymes cut the palindromes at restriction sites
•
Restriction enzymes recognize specific palindromes
•
Cutting DNA at restriction sites will produce DNA fragments
•
Fragment size can be described by the number of base pairs a fragment
contains
Applying What You Have Learned
A linear DNA molecule is represented below. The DNA is represented by one line,
although in actuality, DNA has two strands.
1. If the DNA molecule has two restriction sites, for restriction enzyme A, how many fragments
would be produced if the DNA is cut by that enzyme?
2. Number each fragment.
3. Which fragment is the largest?
4. Which fragment is the smallest?
APPENDIX B
66
5. Draw a DNA molecule that has five randomly spaced restriction sites for a specific
palindrome. How many fragments would be produced if each site were cut by that
specific restriction enzyme?
6. Label each fragment.
7. Rank them in order of size from largest to smallest.
In this diagram A and B are different palindrome sequences on a DNA strand. Only the
restriction enzyme that recognizes site B is present.
67
APPENDIX B
8. Explain why only two fragments would be produced.
Prelab Activity 2 A Review of Electrophoresis
Agarose gel electrophoresis is a procedure used to separate DNA fragments based on
their sizes. DNA is an acid and has many negative electrical charges. Scientists have used
this fact to design a method that can be used to separate pieces of DNA. A solution containing
a mixture of DNA fragments of variable sizes is placed into a small well formed in an agarose
gel that has a texture similar to gelatin. An electric current causes the negatively-charged
DNA molecules to move towards the positive electrode.
Imagine the gel as a strainer with tiny pores that allow small particles to move through it
very quickly. The larger the size of the particles, however, the slower they are strained
through the gel. After a period of exposure to the electrical current, the DNA fragments will
sort themselves out by size. Fragments that are the same size will tend to move together
through the gel and form bands.
A piece of DNA is cut into four
fragments as shown in the diagram.
A solution containing the four
fragments is placed in a well in an
agarose gel. Using the information
given above, draw (to the right) how
you think the fragments might be
separated. Label each fragment with
its corresponding letter.
Have your teacher check your diagram before you proceed.
1. Where would the larger fragments, those with the greater number of base pairs, be
located, toward the top of the gel or the bottom? Why?
2. Suppose you had 500 pieces of each of the four fragments, how would the gel appear?
APPENDIX B
3. If it were possible to weigh each of the fragments, which one would be the heaviest?
Why?
4. Complete this rule for the movement of DNA fragments through an agarose gel.
The larger the DNA fragment, the …
68
This diagram represents a piece of DNA cut with HindIII at each of the restriction sites pointed
to by the arrows. The numbers represent the number of base pairs in each fragment.
23,130
2,027
2,322
9,416
6,557
4,361
5. How many fragments were produced by the restriction enzyme HindIII?
6. On the gel diagram, show how you believe these fragments will sort out during
electrophoresis. The two fragments with no length indicated will be too small to be
visualized on the gel.
Well
Negative
Positive
69
APPENDIX B
7. Label each fragment with its correct number of base pairs.
APPENDIX C
Appendix C
Instructor’s Answer Guide
Pre-Lab Focus Questions: Introduction to DNA Fingerprinting
1. Compare the “backbone” of sugar-phosphate arrangement in the side chains of all
three figures. Are there any differences?
The arrangement is identical for all three samples.
2. In the above figure, do all three samples contain the same bases? Describe your
observations.
All samples contain the same bases: adenine, thymine, guanine and cytosine.
3. Are the bases paired in an identical manner in all three samples? Describe the pattern
of the base pair bonding.
The adenine is always bonded with thymine and the cytosine is always bonded
with the guanine.
4. In your attempt to analyze DNA samples from three different individuals, what
conclusions can you make about the similarities and differences of the DNA samples?
The sugar phosphate arrangement is the same for all samples and so are the
kind of bases; what is different is the arrangement of bases among the three
samples.
5. What will you need to compare between these DNA samples to determine if they are
identical or non-identical?
The sequence of base pairs in each individual sample.
70
1. How many pieces of DNA would result from this cut ?
2
2. Write the base sequence of the DNA fragments on both the left and right side of the
“cut”.
ATG
TACTTAA
A A T T C T C AA T T A C C T
GAGTTAATGGA
3. What differences are there in the two pieces?
Each fragment is a different size.
4. DNA fragment size can be expressed as the number of base pairs in the fragment.
Indicate the size of the fragments [mention any discrepancy you may detect].
One fragment is short and one is long; also some bases are unpaired.
a) The smaller fragment is
3
base pairs (bp).
b) What is the length of the longer fragment ?
11
5. Consider the two samples of DNA shown below [single strands are shown for simplicity]:
Sample #1:
CAGTGATCTCGAATTCGCTAGTAACGTT
Sample #2:
TCATGAATTCCTGGAATCAGCAAATGCA
If both samples are treated with a restriction enzyme [recognition sequence
GAATTC] then indicate the number of fragments and the size of each fragment from
each sample of DNA.
Sample # 1
# of fragments:
Sample # 2
2
# of fragments:
2
List fragment size in ascending order: largest ——> smallest
Sample # 1
Sample # 2
17 bp fragment
23 bp fragment
11 bp fragment
5 bp fragment
71
APPENDIX C
Lesson 1 Restriction Digests of DNA Samples
APPENDIX C
Lesson 1 Restriction Digestion of DNA Samples
Observation Questions
1. Describe the samples of DNA (physical properties).
The DNA samples are clear, colorless liquid samples.
2. Is there any observable difference between the samples of DNA?
No. All samples appear similar.
3. Describe the appearance of the restriction endonuclease mix.
The restriction enzymes appear to be clear, colorless liquids.
72
Review Questions
1. Before you incubated your samples, describe any visible signs of change in the contents
of the tubes containing the DNA combined with the restriction enzymes.
DNA + EcoRI/PstI enzyme mix:
No visible change apparent in the tubes.
2. Can you see any evidence to indicate that your samples of DNA were fragmented or
altered in any way by the addition of EcoRI/PstI? Explain.
No. No visible change apparent in the tubes.
3. In the absence of visible evidence of change, is it still possible that the DNA samples
were fragmented? Explain your reasoning.
Yes. They may be chemically changed but the changes may not be visible.
Enzymes may have cut the DNA.
4. After a 24 hour incubation period, are there any visible clues that the restriction
enzymes may have in some way changed the DNA in any of the tubes? Explain your
reasoning.
No. No visible change apparent in the tubes but the enzymes may have cut the
DNA. The reactions are at the molecular level and too small to be seen.
73
APPENDIX C
Lesson 1 Restriction Digestion of DNA Samples
APPENDIX C
Lesson 2 Agarose Gel Electrophoresis
Review Questions
1. The electrophoresis apparatus creates an electrical field [positive and negative ends of
the gel]. DNA molecules are negatively charged. To which pole of the electrophoresis
field would you expect DNA to migrate (+ or -)? Explain.
Positive.
2. What color represents the negative pole?
The negative pole (or cathode) is black. The positive pole (or anode) is red.
3. After DNA samples are loaded in wells, they are "forced" to move through the gel
matrix. Which size fragment (large vs small) would you expect to move toward the
opposite end of the gel most quickly? Explain.
Smaller. There is less resistance to their movement through the gel matrix.
4. Which fragments are expected to travel the shortest distance [remain closest to the
well]? Explain.
Larger. There is more resistance to their movement through the gel matrix.
74
1. What can you assume is contained within each band?
DNA fragments.
2. If this were a fingerprinting gel, then how many kinds (samples) of DNA can you
assume were placed in each separate well?
One.
3. What would be a logical explanation as to why there is more than one band of DNA for
each of the samples?
The DNA must have been cut into fragments by restriction enzymes.
4. What probably caused the DNA to become fragmented?
The chemical action of the restriction enzymes cutting at specific base
sequences.
5. Which of the DNA samples have the same number of restriction sites for the restriction
endonuclease used? Write the lane numbers.
Lanes 2, 3, and 4 (CS, S1, and S2).
6. Which sample has the smallest DNA fragment?
The sample in lane 5 (S3).
7. Assuming a circular piece of DNA (plasmid) was used as starting material, how many
restriction sites were there in lane three? Please note that the starting material was a
circular piece of DNA.
Two sites that cut the sample into two fragments.
8. From the gel drawing on page 35, which DNA samples appear to have been “cut” into
the same number and size of fragments?
Lanes 2 and 4 (CS and S2).
9. Based on your analysis of the example gel drawing on page 35, what is your conclusion
about the DNA samples in the photograph? Do any of the samples seem to be from the
same source. If so which ones? Describe the evidence that supports your conclusion.
The DNA samples in lanes 2 and 4 (CS and S2) are from the same individual
because they have identical restrictions sites that yield identical fragments.
75
APPENDIX C
Post-Lab Thought Questions
APPENDIX C
Approx.
size (bp)
Suspect 4***
Distance
(mm)
Suspect 3
Approx.
size (bp)
Suspect 2
Distance
(mm)
Suspect 1
Approx.
size (bp)
3,679
Crime Scene
Distance
(mm)
19.0
Lambda/HindIII
size marker
Approx.
size (bp)
2,817**
29.5
Suspect 5***
Approx.
size (bp)
Distance
(mm)
21.0
2,817**
Distance
(mm)
Actual
size (bp)
2,817**
20.5
Approx.
size (bp)
Distance
(mm)
21.0
1,700
820
Distance
(mm)
Band
3,679
25.0
32.0
2,817**
19.0
1,191
1,159
21.0
23,130
23.5
28.5
2,817**
11.0
2,817**
949
21.0
1
20.5
30.5
1,986
9,416
820
24.0
13.0
32.0
1,093
2
6,557
1,093
15.0
29.5
3
2,322
4,361*
23.0
2,027
18.0
5
24.0
4
6
*This fragment may appear faint if the markers were not heated to 65 ºC. Lamba HindIII digestion also generates bands of 564 and 125 bp that are usually too faint to see on a gel.
**The measured migration distance for these bands varies depending upon the thickness of the bands. The 2,817 bp bands in plasmids S4 and S5 are especially intense because they are
actually two individual bands (2,817 bp and 2,838 bp) that are too close to be visibly separated.
***S4 and S5 DNA lanes may also contain a very faint band of 468 bp.
76
DNA Standard Band Migration
APPENDIX C
100,000
Size, base pairs
10,000
B
C
1,000
100
0
5
10
15
20
A
25
30
Distance, mm
To estimate the size of any unknown crime scene or suspect fragment, you first need
to determine the distances the specific fragment travelled. Locate the distance on the
x-axis of your standard graph. For example, suspect 5, band 2 migrated 24 mm (A). From
the 24 mm mark on the x-axis, read up to the standard line; when you intersect your
standard curve, mark the spot with a shaded circle (B). Follow the intersect point over to
the y-axis and determine where the graph line meets the y-axis this is the approximate size
of the fragment (C). Therefore, suspect 5, band 2 is approximately 2,000 bp. Repeat this
procedure for the crime scene and all suspects’ fragments. As you determine the approximate
fragment sizes, fill in the data in the data table.
77
APPENDIX C
Fingerprinting Standard Curve: Linear
25,000
Size, base pairs
20,000
15,000
10,000
5,000
0
0
5
10
15
20
Distance, mm
78
25
30
1. What are we trying to determine? Restate the central question.
We are trying to determine if samples of DNA that we were provided with are
from the same individual or from different individuals.
2. Which of your DNA samples were fragmented? What would your gel look like if the
DNA were not fragmented?
The number of fragmented samples will vary. They will have one band on the gel
if the DNA was not cut.
3. What caused the DNA to become fragmented?
The addition of restriction enzymes.
4. What determines where a restriction endonuclease will “cut” a DNA molecule?
A special sequence of bases on the DNA called restriction sites.
5. A restriction endonuclease “cuts” two DNA molecules at the same location. What can
you assume is identical about the molecules at that location?
The restriction sites are identical.
6. Do any of your suspect samples appear to have EcoRI or PstI recognition sites at the
same location as the DNA from the crime scene?
The samples in lanes 2 and 5 match (CS and S3).
7. Based on the above analysis, do any of the suspect samples of DNA seem to be from
the same individual as the DNA from the crime scene? Describe the scientific evidence
that supports your conclusion.
The CS and S3 samples appear to be identical. They both produce similar banding
patterns on the gel.
79
APPENDIX C
Post Lab Activity: Interpretation of Results
APPENDIX C
Extension Activity 1: Plasmid Mapping
Reading a plasmid map
1. From the map of plasmid S2 list all the restriction enzymes would cut this plasmid.
PvuII, EcoRI, BamHI, PstI, EcoRV, HindIII, ScaI
2. Which plasmid, S2 or S5, is the biggest and what is its size?
S5 is the largest (9481 bp)
3. Using plasmid S2 as an example, find the restriction sites for the enzyme PvuII. How
many sites are there? What is their location? If PvuII was used to cut (digest) this plasmid,
how many fragments would it make?
There are three sites for PvuII on plasmid S2. They are at position 55, 1993 and
3410. Three fragments would be created if plasmid S2 was digested with PvuII.
4. Next determine the size of the fragments created when plasmid S2 is cut by PvuII. Size
is calculated by subtracting the site locations from each other. (Note: if a fragment
contains the 0 point of the plasmid, it is not just a simple subtraction!). How big are the
fragments from plasmid S2 that is cut with PvuII? The fragment sizes should add up to
the total for that plasmid (5869 base pairs).
The fragment sizes are 1417, 1938 and 2514 bp.
5. If the fragments from the plasmid S2 digested with PvuII were run on an agarose gel,
what would they look like? Draw the gel and label the fragments and their sizes.
2514
1938
1417
6. Now you can determine the fragment sizes of the plasmids when cut with the two
enzymes, EcoRI and PstI. Indicate the sizes of the fragments that would be generated if
the plasmid were a digest by PstI alone, EcoRI alone or by both PstI and EcoRI.
Enzymes
Fragments
Plasmid S2 (5869 bp)
EcoRI
PstI
5869
2860
1700
1159
150
Total
80
Both
2817
1700
1159
150
43
EcoRI
5809
PstI
Both Enzymes
2860
1700
1159
150
43
2817
1700
1159
150
43
8. How does your diagram in question 7 compare to what was observed in your gel after
the experiment? Indicate a reason for why your data in question 7 might be different
from the actual experimental data seen from lesson 2.
They should be similar but the bands at 150 and 43 bp are too small to be
observed on the gel.
Mapping the Plasmid Questions
1. How big is plasmid S5? Add the fragments in each column. The total should add up to
the size of the plasmid. Why?
The plasmid is 9481 bp in size. The fragments are cut from the plasmid and all
the pieces together should be equal to the size of the original plasmid.
2. Look at the data from the EcoRI digest of plasmid S5. How many fragments are there?
Did the enzyme cut the plasmid, or did it remain as a circle? How could you tell?
There should be only one fragment. At first glance, it is not possible to tell if the
plasmid was cut although sometimes a circular (and possibly twisted) plasmid
does not run through an agarose gel at the same place as a linear piece of DNA
of the same size.
3. Compare the data from the PstI digest of plasmid S5 with that of the EcoRI digest. How
many fragments are there? How many restriction sites are there for PstI?
There should be 7 fragments and therefore 7 restriction sites.
4. How many fragments are there when EcoRI and PstI are used to digest plasmid S5?
Does that answer the question of whether or not EcoRI cut the plasmid? Why?
There should be 8 fragments when the plasmid is cut by both enzymes. The
additional fragment shows that EcoRI also cut the plasmid one time.
5. Which fragment of PstI digested plasmid S5 was shortened by an EcoRI cut?
The 2860 bp fragment was cut into two fragments (2817 bp and 43 bp)
6. Draw the PstI fragment that is cut with EcoRI in plasmid S5 to demonstrate how the
fragment was cut with EcoRI.
2,860
2,817
43
EcoRI
81
APPENDIX C
7. If plasmid S2 was digested and run on an agarose gel, what would the gel look like?
Draw a gel and the fragment sizes if digested by EcoRI alone, PstI alone and by EcoRI
and PstI together.
APPENDIX C
7. Restriction mapping is an exercise in critical thinking and logic. Plasmid S5 is difficult to
completely map because of the numerous PstI restriction sites. With the data, it would
be very difficult to place all the restriction sites in order. It is easier to map plasmid S3.
How many times did EcoRI cut plasmid S3? What are the fragment sizes?
EcoR1 cut plasmid S3 twice. The fragments are 863 and 6505 bp in size.
8. The data from the EcoRI digest of plasmid S3 indicate that the fragments are not equal.
Draw a possible map and label the EcoRI sites and the sizes of the fragments.
9. Now draw an approximate map of the PstI sites on plasmid S3 and label the PstI sites
and the sizes of the fragments.
10. Draw a circular map of plasmid S3 digested with both PstI and EcoRI? Mark sizes of
each fragment and name the restriction sites on your figure.
82
Using the data from the double digest there are two possibilities (see diagram).
However the single digest with PstI would have fragments of 3687 and 3637 bp
(not 4507 and 2860 bp as was seen).
12. When the gels were run for this experiment, there were only three bands for plasmid
S3. Which band is missing from your gel? Why?
The 43 bp band is so small that it does not bind enough Fastblast stain to be
visible or it may have run off the gel.
83
APPENDIX C
11. Is there another possible order of restriction sites on plasmid S3 digested with both PstI
and EcoRI? How might you resolve these possibilities?
APPENDIX C
Extension Activity 2: Constructing a Plasmid Questions
1. Where is the PstI site on the pTZ18U plasmid?
Position 298
2. Look at plasmid S4. What segment of the lambda bacteriophage has been inserted?
Lambda fragment 5,218–9,617 was added.
3. After looking at the plasmid map and also the lambda phage map, can you determine
how many PstI restriction sites were added to the plasmid because of the inserted
lambda phage DNA fragment? Note that it is possible for these extra PstI sites to have
been added if the original restriction digestion was done for a short time so that not all
PstI sites would have been completely cut in every piece of lambda phage DNA.
Two restriction sites for PstI were added: site 766 and site 3,604.
4. Look at plasmid S1. What segment of lambda was added to that plasmid? Were any
PstI restriction sites added to the plasmid with the inserted fragment of lambda DNA?
Lambda fragment 20,285–22,425 was added to plasmid S1. No additional PstI
sites were added.
5. Now let us create a different plasmid from the parent plasmid. You will use EcoRI for
the construction and need to refer to the lambda bacteriophage genome map that
includes the EcoRI sites. You must make a plasmid that is at least 5,000 base pairs but
not more than 10,000 base pairs in size. Remember that the parent plasmid is 2,860 bp
in size. Where is the EcoRI site on the parent pTZ18U plasmid?
The EcoRI site is at 255 bp.
6. Choose a segment of lambda bacteriophage genome that could be cut out by the
EcoRI enzyme. Which segment will you use?
There are three possibilities: lambda 21,226–26,104; lambda 26,104–31,747; lambda
39,168–44,972. All other options would make the plasmid larger than 10,000 bp.
7. Draw your new plasmid with the insert of your choice. Be sure to include the restriction
sites for PstI and EcoRI in your drawing. How big is your new plasmid? Give the positions
of the restriction sites in your new plasmid a number indicating the location. Remember
that the first EcoRI site will still be position 255 as it is in the parent pTZ18U plasmid
map.
POSSIBILITY 1
Lambda 21,226–26,104
4,878 bp insert
7,738 bp total
EcoEI 255, 5,133
PstI 1,454, 5,176
POSSIBILITY 2
Lambda 26,104–31,747
5,643 bp insert
8,503 bp total
EcoRI 255, 5,898
PstI 1,083, 5,943
84
POSSIBILITY 3
Lambda 39,168–44,972
5,804 bp insert
8664 bp total
EcoRI 255, 5,059
PstI 6,102
i.
EcoRI alone
Two fragments in each case since there are two EcoRI sites.
POSSIBILITY 1
POSSIBILITY 2
POSSIBILITY 3
Lambda
Lambda
Lambda
21,226-26,104
26,104-31,747
39,168-44,972
4878
2860
5643
2860
5804
2860
ii. PstI alone
Two fragments for possibility 1 & 2 and one fragment with possibility 3.
POSSIBILITY 1
POSSIBILITY 2
POSSIBILITY 3
Lambda
Lambda
Lambda
21,226-26,104
26,104-31,747
39,168-44,972
4016
3722
4858
3645
8664
iii. EcoRI and PstI together (a double digest)
Four fragments for possibility 1 and 2 and three fragments with possibility 3.
POSSIBILITY 1
POSSIBILITY 2
POSSIBILITY 3
Lambda
Lambda
Lambda
21,226–26,104
26,104–31,747
39,168–44,972
3679
4815
5804
2817
2817
2817
1199
828
43
43
43
9. Draw an agarose gel for each of these digests and label the fragment sizes.
POSSIBILITY 1
EcoRI PstI
Both
POSSIBILITY 2
EcoRI PstI
Both
POSSIBILITY 3
EcoRI PstI
8664
5804
Both
5804
5643
4878
4858
3722
2860
3679
2817
1199
2860
4815
2817
2860
2817
828
The band at 43 bp is too small to be seen.
10. The lambda phage fragment can be inserted into the host plasmid in either orientation –
forwards or backwards. How could you use plasmid mapping to determine in which
orientation your fragment was inserted? Use a diagram in your explanation.
Using possibility 1 from questions 8 and 9 above. The double digests will show
the same bands with either orientation but the PstI single digest will be different.
In the first orientation it will give two fragments of 4016 bp and 3722 bp. In the
second orientation it will give two bands at 6492 bp and 1242 bp.
85
APPENDIX C
8. How many restriction sites are there now for PstI in your new plasmid? Predict what
fragments you would generate if you were to digest your plasmid with:
APPENDIX C
Prelab Activity 1 A Review of Restriction Enzymes (from Appendix B)
1. Describe any pattern you might see in the upper sequence of bases.
There is no specific type of pattern associated with the upper sequence of bases.
2. Compare the bases in the upper DNA strand to those in the lower strand. Describe any
relationship you can see.
A always pairs with T; G always pairs with C.
3. Now look at the upper sequence of bases and compare it to the lower. Do you notice
any grouping of bases that when read toward the right on the upper strand and read to
the left on the bottom strand are exactly the same?
CTTAAG.
4. How many base pairs are there to the left of the cut?
4
5. How many base pairs are there to the right of the cut?
10
6. Counting the number of base pairs, is the right fragment the same size as the left
fragment?
No, it is larger.
7. How could you describe the size of each fragment in terms of the number of base pairs
in the fragment?
Fragment 1 is a 4-base-pair fragment.
Fragment 2 is a 10-base-pair fragment.
8. If the GAATTC palindrome is repeated four times on the same piece of linear DNA, and
the restriction enzyme that recognizes that base sequence is present and digests the
DNA, how many DNA fragments will be produced?
5
9. If the GAATTC palindrome repeats are randomly spaced along the DNA strand, then
what can you say about the size of the fragments that will be produced when the DNA
is digested with a restriction enzyme that recognizes that sequence?
Random sized fragments will be produced.
86
1. If a DNA molecule has two restriction sites, for restriction enzyme A, how many fragments
would be produced, if the DNA is cut by enzyme A?
3
2. Number each fragment.
3. Which fragment would be the largest?
Fragment 3.
4. Which fragment would be the smallest?
Fragment 2.
5. Draw a DNA molecule that has five randomly spaced restriction sites for a specific
palindrome. How many fragments would be produced if they were each cut by a
restriction enzyme?
6
6. Label each fragment
Answers will vary.
7. Rank them in order of size from largest to smallest.
Answers will vary.
In this diagram A and B are different palindrome sequences on a DNA strand. Only the
restriction enzyme that recognizes site B is present.
8. Explain why only two fragments would be produced.
The enzyme would cut only at site B, producing two DNA fragments.
87
APPENDIX C
Applying What You Have Learned
APPENDIX C
Prelab Activity 2 A Review of Electrophoresis (from Appendix B)
A piece of DNA is cut into four
fragments as shown in the diagram.
A solution of the four fragments is
placed in a well in an agarose gel.
Using the information given above,
draw on the diagram how you think
the fragments might be separated.
Label each fragment with its
corresponding letter.
Have your teacher check your diagram before you proceed.
1. Where would the larger fragments, those with the greater number of base pairs, be located;
toward the top of the gel or the bottom? Why?
The large fragments would be towards the top of the gel because it is more
difficult for the larger pieces to be strained through the gel.
2. Suppose you had 500 pieces of each of the four fragments, how would the gel appear?
There would still be only 4 bands present.
3. If it were possible to weigh each of the fragments, which one would be the heaviest? Why?
Fragment D would be heaviest because it is the largest piece of DNA and would
thus have the greatest mass.
4. Complete this rule for the movement of DNA fragments through an agarose gel.
The larger the DNA fragment, the slower it migrates through an agarose gel.
88
2,027
23,130
2,322
9,416
6,557
4,361
5. How many fragments were produced by the restriction enzyme HindIII?
8, however only 6 will be large enough to appear on the gel.
6. On the gel diagram, show how you believe these fragments will sort out during
electrophoresis. The two fragments with no length indicated will be too small to be
visualized on the gel.
Well
Negative
23,130
9,416
6,557
4,361
2,322
2,027
Positive
Agarose gel
7. Label each fragment with its correct number of base pairs.
See gel above.
89
APPENDIX C
This diagram represents a piece of DNA cut with HindIII at each of the restriction sites pointed
to by the arrows. The numbers represent the number of base pairs in each fragment.
Appendix D
Fast Gel Protocol
The DNA Fingerprinting gels can be run in under 20 minutes by using a reduced
concentration of running buffer (0.25x TAE), the same concentration of buffer in the gel
itself (1x TAE) and higher voltage (200 volts). Resolution is excellent and the gel can be run
33% faster.
The provided 50x TAE buffer is mixed with distilled water to yield the necessary
concentrations for making agarose gels and electrophoresis running buffer.
APPENDIX D
Use 1x TAE to make agarose gels:
Half a liter of 1x TAE is sufficient to make eight 7 x 10 cm agarose gels. To make 500 ml of
1x TAE from a 50x TAE concentrate, add 10 ml of concentrated TAE to 490 ml of distilled
water. For added convenience, precast 1% agarose gels made with 1x TAE are available
from Bio-Rad (catalog #161-3057EDU)
Use 0.25x TAE to make electrophoresis running buffer:
A 2.5 liter volume of 0.25x TAE buffer is required to run eight 7 x 10 agarose gels. To make
2.5 L of 0.25x TAE from a 1x TAE solution, add 625 ml of 1x TAE to 1,875 ml of distilled
water.
Note: Do not use 0.25x TAE to make agarose gels; doing so can lead to a loss of DNA
resolution.
To run gels:
Place the gel in an electrophoresis chamber and cover it with 0.25x TAE; ensure the gel is
submerged. Run gels at 200 V for no more than 20 min. Monitor the movement of gel
loading dye to get a relative idea of electrophoresis progress.
90
Appendix E: Suspect Plasmid Maps
Plasmid Maps
APPENDIX E
Suspect 1 DNA Sample
Suspect 2 DNA Sample
91
Crime Scene/Suspect 3 DNA Sample
APPENDIX E
Suspect 4 DNA Sample
92
APPENDIX E
Suspect 5 DNA Sample
93
APPENDIX E
Plasmid Parent Vector
94
Appendix F
References
2.
3.
4.
5.
6.
7.
DNA Profiling Fast Becoming Accepted Tool For Identification, Pamela Zurer, Chemical and
Engineering News, Oct. 10, 1994.
PCR means polymerase chain reaction; it is a technique used to amplify small amounts of DNA
(in this case so that further analysis of the DNA can occur).
RFLP means restriction fragment length polymorphisms..."riff-lips" in biotech jargon...Pieces of
DNA are cut with restriction enzymes into fragments of various lengths. Individuals possess
variable restriction recognition sites so that two pieces of DNA from separate sources may have
different fragment lengths when their DNA is cut by the same enzyme.
An excellent resource for the classroom teacher is Genetic Fingerprinting, Pauline Lowrie and
Susan Wells, New Scientist, 16 November 1991.
Is DNA Fingerprinting ready for the courts?, William C. Thompson and Simon Ford, New
Scientist, March 31, 1990.
When Science Takes the Witness Stand, Peter Neufeld and Nevelle Coleman, Scientific
American, Vol. 262: 5, May 1990.
Using Restriction Mapping to Teach Basic Skills in the Molecular Biology Lab, Lauren Walsh,
Elizabeth Shakir, and Elizabeth A De Stasio, Biochemistry and Molecular Biology Education, Vol
35, No 3, pp 199–205, 2007.
95
APPENDIX F
1.
Bio-Rad
Laboratories, Inc.
Web site www.bio-rad.com USA 800 4BIORAD Australia 61 02 9914 2800 Austria 01 877 89 01 Belgium 09 385 55 11 Brazil 55 21 3237 9400
Canada 905 712 2771 China 86 21 6426 0808 Czech Republic 420 241 430 532 Denmark 44 52 10 00 Finland 09 804 22 00 France 01 47 95 69 65
Germany 089 318 84 0 Greece 30 210 777 4396 Hong Kong 852 2789 3300 Hungary 36 1 455 8800 India 91 124 4029300 Israel 03 963 6050
Italy 39 02 216091 Japan 03 5811 6270 Korea 82 2 3473 4460 Mexico 52 555 488 7670 The Netherlands 0318 540666 New Zealand 0508 805 500
Norway 23 38 41 30 Poland 48 22 331 99 99 Portugal 351 21 472 7700 Russia 7 495 721 14 04 Singapore 65 6415 3188 South Africa 27 861 246 723
Spain 34 91 590 5200 Sweden 08 555 12700 Switzerland 061 717 95 55 Taiwan 886 2 2578 7189 United Kingdom 020 8328 2000
Life Science
Group
Bulletin 0000
US/EG
Rev A
00-0000
0000
Sig 1106
4006096 Rev G