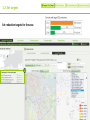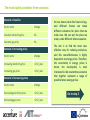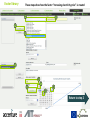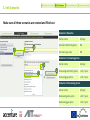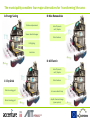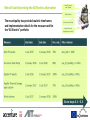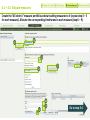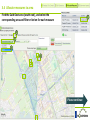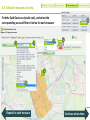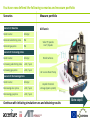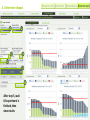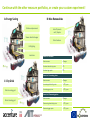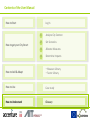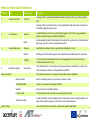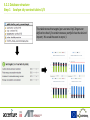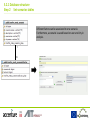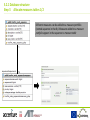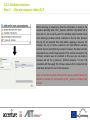
1
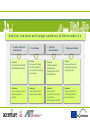
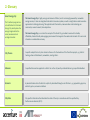
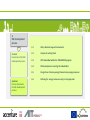
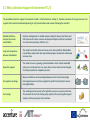
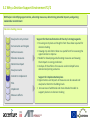
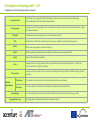
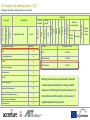
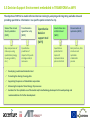
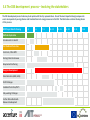
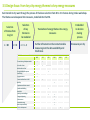
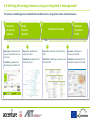
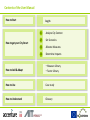
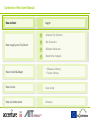
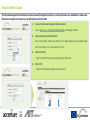
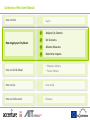
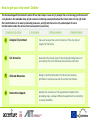
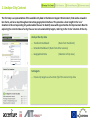
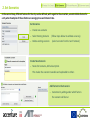
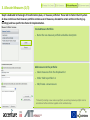
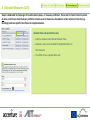
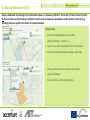
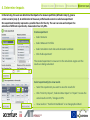
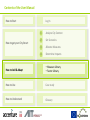
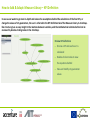
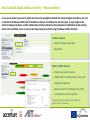
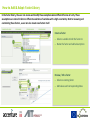
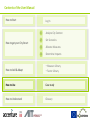
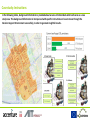
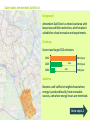
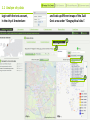
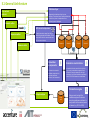
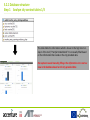
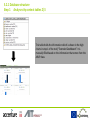
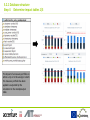
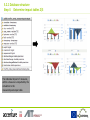
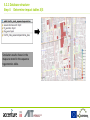
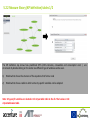
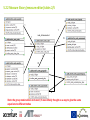
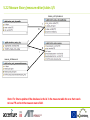
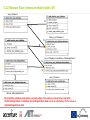
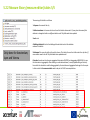
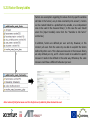
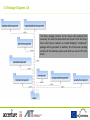
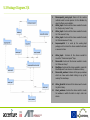
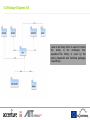
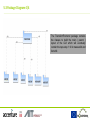
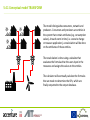
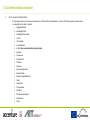
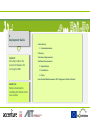
WP3 TRANSFORM Decision Support Environment “Enabling cities to become Smart Energy Cities” Deliverable 3.1 Finalized prototype quantitative decision support model ready for replication in other cities Disclaimer About the Structure of the Deliverables D3.1 and D3.2 The two TRANSFORM WP3 deliverables D3.1 Finalised prototype quantitative decision support model ready for replication in other cities and D3.2 Guidance for the replicable use of the model and/or methodology developed in this work package and recommendations for further development aim at different audiences and have to be seen as separate documents. Where D3.1 describes the tool itself, D3.2 is giving advice to cities which want to adopt the DSE in order to be able to use it in the future, so some content of the deliverables has been duplicated in order to serve the different audiences and should not confuse the readers of the two documents. Since these are public documents the WP3 team tried to make the deliverables as consumable as possible for future external readers. Outline, contents and target audience of deliverable 3.1 Process of the DSE development Content: Description of the DSE development process Audience: Parties interested in the DSE development process User Manual Technical documentation Content: Instructions for using the DSE through the user interface, including a case study. Content: Audience: Users of the Decision Support Environment. Audience: Technicians/IT specialists interested in the software architecture of the DSE. Technical details regarding the development of the DSE software. Deployment Guide Content: Document about the required hardware for running the DSE. Audience: Parties interested in installing the DSE on their own servers. Table of Contents 1. Introduction 5 2. Glossary 6 3. Process within TRANSFORM 7 3.1 Why a decision Support Environment? 8-9 3.2 Analysis of existing tools 10-11 3.3 Decision Support Environment embedded in TRANSFORM as WP3 12 3.4 The DSE development process – Involving the stakeholders 13 3.5 Design focus: from key city energy themes to key energy measures 14 3.6 Defining the energy measures using an integrated 4-step approach 15 4. User manual 16-51 5. Technical Documentation 52-80 6. Appendix: Deployment Guide (Word .doc) 81 (The headlines are clickable hyperlinks!) 1. Introduction WP3 Objectives in TRANSFORM To develop a prototype Decision Support Environment (DSE), which enables decision makers to evaluate the impacts of different transformation plans, under varying scenarios, based on open energy data. In addition to the prototype DSE, documentation materials are developed for dissemination of the DSE to other cities. The Deliverable 3.1 contains all the developed documentation material, describing the process and methodology of the DSE development and all relevant technical components, including step by step guidance through the DSE functionalities. 2. Glossary Smart Energy City The Transform program has set a definition for the Smart Energy City which places the energy targets within the social, economical and ecological context. The Smart Energy City is highly energy and resource efficient, and is increasingly powered by renewable energy sources; it relies on integrated and resilient resource systems, as well as insight-driven and innovative approaches to strategic planning. The application of information, communication and technology are commonly a means to meet, these objectives. The Smart Energy City, as a core to the concept of the Smart City, provides its users with a livable, affordable, climate-friendly and engaging environment that supports the needs and interests of its users and is based on a sustainable economy. City Theme A specific subject that a city has chosen to focus on for the duration of the Transform project, e.g. district heating, urban refurbishment, renewables, smart grids etc. Measure A specified intervention applied in a district or on the city level by a stakeholder or a group of stakeholders. Scenario A potential future state of a district and/or city described through a set of factors , e.g. population, gas price, electricity price, economic conditions City Data City specific information that describes the state of the city in accordance with the specified Key Performance Indicators (KPI’s) 3. DSE development process Content: Description of the DSE development process Audience: Parties interested in the DSE development process 3.1 Why a Decision Support Environment 3.2 Analysis of existing Tools 3.3 WP3 embedded within the TRANSFORM program 3.4 DSE development: involving the stakeholders 3.5 Design focus: from key energy themes to key energy measures 3.6 Defining the energy measures using a 4-step approach 3.1 Why a Decision Support Environment? 1/2 The quantitative decision support environment enables informed decision making. It simulates outcomes of energy measures and supports fact-based and sustainable planning for city transformations and contains following five benefits. Reliable & effective analyses to increase sustainability Decision making based on reliable analyses, taking all relevant city factors and KPIs into account. Future scenarios and expected impact on KPIs are visualized in a clear overview (maps, statistics, etc.). Long term cooperation between stakeholders The model is accessible online and serves as an online platform. Stakeholders can add data, analyze data and cooperatively propose investments and develop business plans. Open data support The model serves as a growing, dynamic database. data is stored and added online on a continuous basis. For every data set access levels can be managed, from fully accessible to completely secured. City expertise exchange Measure definitions can be exchanged between cities to share knowledge. Exchanged measures can then be applied to specific local city data to ensure local applicability. Cost savings The model gives direct access to the right data, measures, scenarios and tools. This prevents the city from starting every project with new data gathering and analysis, which saves project costs and time. 3.1 Why a Decision Support Environment? 2/2 DSE helps in identifying opportunities, allocating measures, determining potential impacts, and gaining stakeholder commitment Decision making process 1 Analyze the city context 2 Set scenarios and targets 3 Define measures 4 Allocate measures 5 Determine impact 6 Analyze results 7 Commit to implement 8 Plan 9 Implement 10 Measure effects Support for the transformation of the city’s strategic agenda • Focusing on city data and insights from these data required for decision making • Viewing city and district data in a spatial form for assessing the opportunities to improve • Model for developing and allocating measures and viewing their impact on energy indicators • Analysis of the effects of measures under multiple future demand and pricing scenarios Support for implementation plans • Opportunities and impacts of measures can be viewed and analyzed at district or building levels • An overview of additional and more detailed models to support planners in decision making 3.2 Analysis of existing tools – 1/2 Categories by which existing tools were screened Energy demand Energy supply Transport CO2 Calculation of the energy demand of the target location in terms of electric and thermal energy. Basic breakdown of the calculated energy demand. Energy conversion technologies used, consideration of energy conversion input and output types, energy distribution networks Consideration of the energy that is used in the transport sector Consideration of the CO2 emissions due to energy use, production or distribution processes Water Water use/management, used water lifecycle,… Waste Waste production/supply/collection, different uses of wastes in energy production Society Quality of life, comfort standards Costs Environment Scenario development Associated cost to energy production or energy efficiency measures implementation. E.g. fuel prices, investment cost for energy installations assessment of the impact on the environment caused by the energy systems or different energy systems scenarios Time frame The duration of the scenario that the tool could allow the user to develop Time step The time step of the calculations to determine energy demand and production Urban design Geographical scope The morphology of the city and the impact of different urban structures on the energy systems The geographical scale under which the tool could be used 3.2 Analysis of existing tools – 2/2 Categories by which existing tools were screened Geographical Scope Number City 3 City/neighborhood 6 Global 1 Global and regional 1 International 5 Island 1 Local/community 2 National/state/regional 22 National/state/regional/city 2 Single-project investigation 4 User-defined 1 Criteria Scenario development Time Time step frame Number of Tools CO2 29 of 59 Urban Design 11 of 59 GIS Interface 14 of 59 Existing tool analysis has exposed the need for a better spatial integration of energy related measures and linking of city wide asessment of interventions with the actions on the scale of neighborhoods/urban quarters. Urban design Costs Society Waste Water CO2 Transport Heat Energy supply Electricity Access Heat Organisation (link) Energy demand Electricity Dynamic Semi-dynamic GIS Interface Availability Environment Features Tool type Geogra phical scope 3.3 Decision Support Environment embedded in TRANSFORM as WP3 The objective of WP3 is to enable informed decision making by analyzing and integrating available data and providing quantitative information in a specific spatial context of a city. State of the art and the city ambition [WP1] Transformation agenda for a city [WP2] Map comparisons of status quo using spatial data (energy, housing, mobility etc.) Quantitative prediction of impact of city wide strategies and/or measures Quantitative decision support tool [WP3] Smart Urban Labs at district level [WP4] Dissemination & replication [WP5] Quantitative prediction for impact of implementation plans in districts Best practices, data structure and replicable stakeholder process Developing a web based simulation tool Promoting the sharing of energy data Supporting the process of stakeholder cooperation Measuring the impact of Smart Energy City measures Guidance for the replicable use of the model and/or methodology developed in this work package and recommendations for further development 3.4 The DSE development process – Involving the stakeholders The DSE development process had many touch points with the city representatives. One of the most important design components was to incorporate city energy themes and translate them into energy measures in the DSE. The table below contains the key phases of this process. WP3 Project Month Planning Methods Exploration Conclusions & 1st Sketch First feedback from cities From SULs, Other WP’s Visiting Cities & Interviews Requirement Gathering Design & Development Data Collection (AMS, HAM) Draft Prototype Feedback from Cities/WP’s Fully working Prototype Further Data collection & Measure Development 1-3 4 -6 7-9 10 - 12 13 - 15 16 - 18 19 - 21 22 - 24 3.5 Design focus: from key city energy themes to key energy measures Each transform city went through the process of the down selection from 80 to 3-5 themes during intake workshops. The themes were deepened into measures, modelled into the DSE. Selection of key themes to be modelled Selection of themes from long list n = 80 n = 10 n=3–5 Translation of energy themes into energy measures Further refinement on the most attainable measures given the data availability and timeframes Measure/ theme # measures per city City overview AMS LYS Thermal heat grid implementation w w Solar cell roll out w w CPH GOA HAM VIE w Wind turbine roll out w Energy distribution systems Retrofitting w Large consumers w Connect residual heat to THG w w w w Mobility Implement cold-heat recevoir Coordinated Building w w New Build Public/ private buildings w w Integrated planning w Infrastructure w Renewable energy w New entrepreneurship w District development w Embedded in decision making process 3.6 Defining the energy measures using an integrated 4-step approach The measure modelling process enabled the translation of an energy theme into a detailed measure. 1 3 2 Definition of research question 4 Design of model structure Validation of measure in DSE Collection of city data Time 1 Key users: development of research question and user structure Transform: guidance on development and kick-off 2 3 4 Key users: validation of model structure Key users: collection of required city data Key users: validation of measure in the DSE Transform: development of model structure Transform: modelling of measure and data into DSE Transform: demonstration of modelled measure in the DSE 4. DSE Full User Manual Link to the tool: http://sbc1.ait.ac.at/web/mfumarola/dst Content: Instructions for using the DSE through the user interface, including a case study. Audience: Users of the Decision Support Environment. Contents of the User Manual How to Start How to get your City Smart Log In 1 Analyze City Context 2 Set Scenarios 3 Allocate Measures 4 Determine Impacts How to Add & Adapt • Measure Library • Factor Library How to Use Case study How to Understand Glossary Contents of the User Manual How to Start How to get your City Smart Log In 1 Analyze City Context 2 Set Scenarios 3 Allocate Measures 4 Determine Impacts How to Add & Adapt • Measure Library • Factor Library How to Use Case study How to Understand Glossary How to Start: Log In The Decision Support Environment can be accessed through the internet, and test accounts are available for new users that want to explore the options and get familiar with the DSE. 1. Access the Decision Support Environment ‒ Go to sbc1.ait.ac.at/web/mfumarola/dst via Google Chrome 2. Type Username and Password ‒ Click on the field, enter your details. If no login details are provided, login with username ‘test’ and password ‘test’. 3. Select the City - City for which the scenario planning will be made 4. Click ‘OK’ - Opens the Decision Support Environment Contents of the User Manual How to Start How to get your City Smart Log In 1 Analyze City Context 2 Set Scenarios 3 Allocate Measures 4 Determine Impacts How to Add & Adapt • Measure Library • Factor Library How to Use Case study How to Understand Glossary How to get your city smart: Outline The Decision Support Environment consist of four main steps. A user can (1) analyse the current energy performance of a city based on the available data, (2) set scenarios containing assumptions about the future state of a city, (3) mimic the transformation of an area by allocating measures, and (4) test the local or city-wide impact of such a transformation under the various future assumptions (scenarios). 1 Analyze City Context View and analyze the current situation of the city and set targets for the future 2 Set Scenarios Determine the future state of the city by allocating factors of uncertainty that will influence the outcomes over time 3 Allocate Measures Design transformation plans for the city via measure portfolios in certain areas and for certain time frames 4 Determine Impacts Analyze the outcomes of the experiment created in the preceding steps, compare different experiments to each other to assess feasibility 1. Analyze City Context The first step is a representation of the available city data in the Decision Support Environment, that can be viewed in bar charts, and on a map through an interactive geographical interface. This provides a clear insight in the ‘as is’ situation in the corresponding city, and enables the user to identify areas with opportunities for improvement. Next to exploring the current status of a city, the user can set sustainability targets, referring to the ‘to be’ situation of the city. Analyze the city data ‒ Transform Dashboard (Data from Transform) ‒ Extended Dashboard (Data from other sources) ‒ Geographical Data (Selection of city area) Set targets ‒ Future city targets as a function (%) of the current city data 2. Set Scenarios In the second step, different futures for the city can be defined, with regard to the uncertain, uncontrollable factors for a city actor. Examples of these factors are energy prices and interest rate. Set Scenarios ‒ Create new scenario ‒ Select Existing Scenario (follow steps below to validate accuracy) ‒ Delete existing scenario (select scenario from list and ‘remove’) Create New Scenario ‒ Name the Scenario, Add a description This makes the scenario traceable and explicable to others Add factors to the Scenario ‒ Customize by adding under which factors the scenario will be run 3. Allocate Measures (1/3) Step 3 is dedicated to the design of transformation plans, or ‘measure portfolios’. These refer to factors that city actors do have control over. Each measure portfolio contains a set of measures, allocated to certain entities in the city (e.g. buildings) and to a specific time frame for implementation. Create Measure Portfolio ‒ Name the new measure portfolio and add a description Add measures to the portfolio: ‒ Select measures from the dropdown list ‒ Either ‘Add to portfolio’ or ‒ Edit/Create a new measure *Instead of creating a new measure portfolio, an existing measure portfolio can be selected and either edited or applied via the outlined steps. 3. Allocate Measures (2/3) Step 3 is dedicated to the design of transformation plans, or ‘measure portfolios’. These refer to factors that city actors do have control over. Each measure portfolio contains a set of measures, allocated to certain entities in the city (e.g. buildings) and to a specific time frame for implementation. Allocate time and penetration rate ‒ Select a measure and choose Allocate Time ‒ Allocate a start and end date for implementation of this measure ‒ Use slider to set a penetration rate 3. Allocate Measures (3/3) Step 3 is dedicated to the design of transformation plans, or ‘measure portfolios’. These refer to factors that city actors do have control over. Each measure portfolio contains a set of measures, allocated to certain entities in the city (e.g. buildings) and to a specific time frame for implementation. Allocate area ‒ Choose the appropriate level of detail (block / building / network / …) ‒ Select an area for implementation of the measure ‒ End the selection by double-clicking on the map ‒ Choose a filter criterion to select only certain types of buildings ‒ Press Select to confirm the selection 4. Determine Impacts In the last step, the user can determine the impacts of a measure portfolio (defined in step 3), given a certain scenario (step 2). A combination of measure portfolio and scenario is called an experiment. One experiment basically represents a possible future for the city. The user can view and compare the outcomes of different experiments, measured on four city KPIs. Create experiment ‒ Select Scenario ‒ Select Measure Portfolio ‒ Select simulation start date and simulation end date ‒ Click ‘Add experiment’ The created experiment is now sent to the simulation engine and the results are being calculated. Select experiment(s) to view results ‒ Select the experiment you want to view the results for ‒ Click ‘Total City Impact’, ‘Selected Area Impact’ or ‘Impact’ to view the actual results on KPIs / changes in KPIs ‒ View results in ‘Transform Dashboard’ or as ‘Geographical Data’ Contents of the User Manual How to Start How to get your City Smart Log In 1 Analyze City Context 2 Set Scenarios 3 Allocate Measures 4 Determine Impacts How to Add & Adapt • Measure Library • Factor Library How to Use Case study How to Understand Glossary How to Add & Adapt: Measure Library – KPI Definition In case a user wants to go more in-depth and review the assumptions behind the calculations of the four KPIs, or change the values of city parameters, the user is referred to the KPI Definition tab of the Measure Library. A mindmaplike structure gives an easy insight in the relations between variables, and the mathematical relations behind can be reviewed by double-clicking nodes in the mindmap. Review KPI definitions ‒ Choose a KPI and see how it is calculated ‒ Double-click on nodes to view the equations behind ‒ View and modify city parameter values How to Add & Adapt: Measure Library – Measure Editor In case a user wants to go more in-depth and review the assumptions behind the measure impact calculations, the user is referred to the Measure Editor tab of the Measure Library. A mindmap-like structure gives an easy insight in the relations between variables, and the mathematical relations behind can be reviewed and modified by double-clicking nodes in the mindmap. A user can also create new measures by itself, using the Measure Editor interface. Create a measure ‒ Name the measure and add a description Review / Edit a measure ‒ Visualize an existing measure ‒ Double-click on existing nodes* to view and change the equations ‒ Add new nodes* by clicking on one of the colored buttons in the top menu *See glossary for the meanings of the different types of nodes, or variables How to Add & Adapt: Factor Library In the factor library, the user can review and modify the assumptions about different futures of a city. These assumptions are stored in factors: different evolutions of variables with a high uncertainty. Next to reviewing and customizing these factors, a user can also create new factors itself. Create a factor ‒ Select a variable to link the factor to ‒ Name the factor and add a description Review / Edit a factor ‒ Select an existing factor ‒ Add values and corresponding dates Contents of the User Manual How to Start How to get your City Smart Log In 1 Analyze City Context 2 Set Scenarios 3 Allocate Measures 4 Determine Impacts How to Add & Adapt • Measure Library • Factor Library How to Use Case study How to Understand Glossary Case study: Instructions In the following slides, background information is provided about an area of Amsterdam which will serve as a case study area. This background information is interspersed with specific instructions on how to move through the Decision Support Environment successfully, in order to generate insightful results. Case study: Amsterdam Zuid Oost Background Amsterdam Zuid Oost is a mixed-used area with low prices and little restrictions, which makes it suitable for urban innovation and experiments. Challenge Current and target CO2 emissions 2012 390 kt/year -55% 2025 2040 -81% 176 kt/year 74 kt/year Ambition Become a self-sufficient neighborhood where energy is produced locally, from renewable sources, and where energy losses are minimized. Go to step 1.1 1.1 Analyze city data Login with the test account, in the city of Amsterdam: and look up different maps of the Zuid Oost area under “Geographical data”. 1 2 3 4 Case study: Question Challenge Current and target CO2 emissions 2012 390 kt/year -55% 2025 2040 -81% 176 kt/year 74 kt/year Question What is the most cost-effective way for reducing CO2 emissions in this area of the city (taking into consideration the local characteristics of the area)? Go to step 1.2 1.2 Set targets Set reduction targets for the area 1 The municipality considers three scenarios Scenario 1: Baseline Factor name Change Constant electricity price 0% Constant gas price 0% Scenario 2: Increasing prices Factor name Change Increasing electricity price + 2% / year Increasing gas price + 2% / year Scenario 3: Decreasing prices Factor name Change Decreasing electricity price + 2% / year Decreasing gas price + 2% / year No one knows what the future brings, and different futures can mean different outcomes for plans that we make now. We can test the plans we make, under different future scenarios. The aim is to find the most costeffective way for reducing emissions, and this cost-effectiveness is highly dependent on energy prices. Therefore, the uncertainty in energy prices is where the municipality is most interested in. We create three scenarios that together represent a range of possible future energy prices. Go to step 2 2. Set Scenarios • Start creating a scenario by clicking on “Create” • Give the scenario a name (e.g. “Baseline”) and start adding factors to the scenario • If the factor list is empty, create factors in the factor library (see next slide) • When you’re finished with the Baseline scenario, continue with the “Increasing prices” and “Decreasing prices” scenarios and add the corresponding factors to these scenarios. 1 2 3 4 5 Go to Factor library Factor library These steps show how the factor “Increasing electricity price” is created 2 4 1 3 5 6 7 8 10 9 Return to step 2 2. Set Scenarios Make sure all three scenarios are created and filled out Scenario 1: Baseline 1 2 Factor name Change Constant electricity price 0% Constant gas price 0% Scenario 2: Increasing prices 3 4 Factor name 5 Increasing electricity price Increasing gas price Change + 2% / year + 2% / year Scenario 3: Decreasing prices Factor name Change Decreasing elec. price + 2% / year Decreasing gas price + 2% / year The municipality considers four major alternatives for ‘transforming’ the area A: Energy Saving B: Max Renewables Window replacement Solar PV panels roof / façade Shower Heat Exchanger Wind turbines LED lighting Insulation D: All Electric Solar PV panels roof / façade C: City Grids Wind turbines District cooling grid Air source Heat Pump District heating grid Aquifer thermal storage (open system) We will start by testing the All Electric alternative Solar PV panels roof / façade Wind turbines The municipality has provided realistic timeframes and implementation details for the measures within the “All Electric” portfolio: Air source Heat Pump Aquifer thermal storage (open system) Go to steps 3.1 – 3.3 3.1 – 3.3 Allocate measures Create the “All electric” measure portfolio and start adding measures to it (repeat step 3 – 5 for each measure). Allocate the corresponding timeframes to each measure (step 6 – 9). 1 2 3 5 4 6 7 8 9 Go to step 3.4 3.4 Allocate measures to area Find the Zuid Oost area (south east), and select the corresponding area and filter criterion for each measure 1 2 3 4 5 Please continue 3.4 Allocate measures to area Find the Zuid Oost area (south east), and select the corresponding area and filter criterion for each measure 9 8 6 11 10 5 7 Repeat for each measure Continue when done You have now defined the following scenarios and measure portfolio Scenarios Measure portfolio Scenario 1: Baseline All Electric Factor name Change Constant electricity price 0% Constant gas price 0% Solar PV panels roof / façade Factor name Change Wind turbines Increasing electricity price + 2% / year Increasing gas price + 2% / year Scenario 2: Increasing prices Air source Heat Pump Scenario 3: Decreasing prices Factor name Change Decreasing elec. price + 2% / year Decreasing gas price + 2% / year Aquifer thermal storage (open system) Continue with initiating simulation runs and obtaining results Go to step 4 4. Determine Impact 2 1 3 4 5 6 7 After step 5, wait till experiment is finished, then view results Continue with the other measure portfolios, or create your custom experiment! A: Energy Saving B: Max Renewables Window replacement Solar PV panels roof / façade Shower Heat Exchanger Wind turbines LED lighting Insulation Scenario 1: Baseline Factor name Change Constant electricity price 0% Constant gas price 0% Scenario 2: Increasing prices C: City Grids District cooling grid Factor name Change Increasing electricity price + 2% / year Increasing gas price + 2% / year Scenario 3: Decreasing prices District heating grid Factor name Change Decreasing electricity price + 2% / year Decreasing gas price + 2% / year Contents of the User Manual How to Start How to get your City Smart Log In 1 Analyze City Context 2 Set Scenarios 3 Allocate Measures 4 Determine Impacts How to Add & Adapt • Measure Library • Factor Library How to Use Case study How to Understand Glossary How to Understand: Glossary DSE Step Title Terminology Description 1 Analyze City Data City Data Viewing of the city specific data that describes the state of the city on the specified KPI's. Viewing of the city specific data in a maps functionality with the option to select (via 'freehand polygon') specific areas. 2 3 4 Set Scenarios Allocate Measures Determine Impact Scenario A potential future state of a city described through a set of factors, e.g. population, gas price, electricity price, economic conditions. Factor An independent (market) that provides the context for any future city transformation plans (e.g. gas price, oil price, population growth). Measure Specified interventions that are applied by stakeholders to a city. Enabler Technique of method that supports the implementation/effectiveness of a measure. Portfolio A set of measures each allocated to a certain geographic area in time, forming a transformation plan for a city. Experiment The combination of a scenario plus its measures (measure portfolio) on a city or city area resulting in outcomes on the predetermined KPI's. Measure Library Factor Library Area where all measures are stored, made visible and are adaptable. Measure Editor Area for adapting measure, in structure, in values or both. Affected Variable Future / to-be value of a building attribute Variable Current value of a building attribute Input Variable A constant value that represents an assumption/parameter Auxiliary Variable A node that serves as intermediate step in an equation, used to simplify equations. A node that connects a group of nodes to be used in another node. Area where all factors are stored, made visible and are adaptable. 5. Technical Documentation 5.1 General architecture 5.2 User interface 5.2.1 Database structure Step 1 Analyse city context tables Step 2 Set scenarios tables Content: Technical details regarding the development of the DSE software. Step 3 Allocate measures tables Step 4 Determine impact tables 5.2.2 Measure library tables 5.2.3 Factor library tables 5.3 Package Diagram 5.4 Simulation model Audience: Technicians/IT specialists interested in the software architecture of the DSE. 5.4.1 Conceptual model TRANSFORM 5.4.2 Package overview 5.4.3 Internal data structure 5.4.4 Simulation scheduler 5.1 General Architecture Database layer City context explorer Separates the databases from the user interface. This allows from a flexible architecture in which the system is independent from different types of databases. Scenario editor GIS visual component Sequence editor Creates interactive maps from the city data and geographical database. These maps can be used to visualize data and for the user selections. Sequences Measures City data Scenarios Measure editor Simulation components Simulation model initiator Contains the standard software components to simulate producers, network, and consumers. Instantiates for each record in the city data (e.g. house) a simulation component and connects it through a network to the right producers. In a typical simulation experiment, about 300 000 consumers are instantiated. Simulation engine Output analyzer Output data Using a model as input, the simulation engine will calculate every key performance indicator for every month for the selected period of interest (e.g. 2013 to 2025). 53 5.2 User Interface This part of the documentation provides an overview of the database tables and classes used to create the web user interface. 5.2.1 Database structure Step 1 Analyse city context tables Step 2 Set scenarios tables Step 3 Allocate measures tables Step 4 Determine impact tables 5.2.2 Measure library tables 5.2.3 Factor library tables 54 5.2.1 Database structure Step 1 Analyse city context tables 1/3 This table holds the information which is shown in the high charts in step 1 of the tool (“Transform Dashboard”. It is manually filled based on the information that resides in the city provided data. One option to avoid manually filling in the information is to create a view in the database based on the city provided data. 55 5.2.1 Database structure Step 1 Analyse city context tables 2/3 This table holds the information which is shown in the high charts in step 1 of the tool (“Extended Dashboard”. It is manually filled based on the information that comes from the ARUP data. 56 5.2.1 Database structure Step 1 Analyse city context tables 3/3 This table stores the targets (per user and city).Targets are defined to check if a certain measure portfolio has the desired impact ( this could be seen in step 4 ). 57 5.2.1 Database structure Step 2 Set scenarios tables Different factors can be associated to one scenario. Furthermore, a scenario is saved based on user and city in analysis. 1 N 58 5.2.1 Database structure Step 3 Allocate measures tables 1/2 Different measures can be added to a measure portfolio (named sequence in the db). Measures added to a measure portfolio appear in the sequence to measure table 1 sequenceid=sequence.id N 59 5.2.1 Database structure Step 3 Allocate measures tables 2/2 When allocating a measure to time the information is stored in the sequence planning table. The f_measure attribute is by default set to false and it is not currently used. This attribute might become handy when desiring to achieve certain conditions in the city data (because the city has not provided that data) before applying a measure. For instance, the city of Vienna wanted to test two different scenarios (normal scenario and efficiency) scenario. However, the initial situation data (which was a kind of improvement of the normal scenario) for the efficiency scenario was not provided. In this case you can create a measure and set the f_measure ( fictitious measure ) to true. The simulation will then apply this fictitious measure first to transform the initial data and later the rest of the measures. Note: A check box should be added to the measure portfolio table if it is desired to activate the functionality of the f_measure attribute from the GUI 60 5.2.1 Database structure Step 4 Determine impact tables 1/3 The impact of a measure portfolio on either a city or in the area(s) in which this measure portfolio has been applied is outputted by the simulation to the mainkpioutput table. 61 5.2.1 Database structure Step 4 Determine impact tables 2/3 The individual impact of measures, within a measure is outputted by the simulation to the measureimpactoutput table. 62 5.2.1 Database structure Step 4 Determine impact tables 3/3 Simulation results shown in the maps are stored in the sequence togeometries table. 63 5.2.2 Measure library (KPI definition) tables 1/2 1 2 The KPI definition tap shows how predefined KPI’s (CO2 emissions, renewables and consumption costs ) are structured. By double clicking on the nodes two different type of windows can be seen. 1) Window that shows the structure of the equations that form a node 2) Window that shows a table in which some city specific variables can be adapted. Note: City specific variables are located in the cityvariable table in the db. Their values in the cityvariablevalue table. 64 5.2.2 Measure library (KPI definition) tables 2/2 The formula table stores all the information needed to create the nodes. Because, KPI’s are predefined, the information in this table needs to be manually added. The meaning of the table attributes is as follows: Indicator: Is the name of the KPI (i.e CO2 emissions ) nodename: the name of the node. nodetype: The type of node ( which is use to handle which type of window is shown ) formulacomponent: Equations linked to a specific node 65 5.2.2 Measure library (measure editor) tables 1/5 The measure editor is integrated by 23 tables which relation is shown in the next slides. However, hereby it is introduced some terminology which is needed to further understand the structure of the measure editor. Affected Variable: Affected variable ( dark green in the GUI ) is a variable which informs the simulation about the variables that will change their previous value after a measure is applied at time t. Variable: A variable ( red in the GUI ) which represents a building related variable. Its initial value comes from the city provided data. At the time of applying a measure ( t ) the initial value of this variable is seen by the simulation as (t-1). That is why in the GUI it has a “t_1” suffix. The name of the variables ( user friendly names) in the GUI differ from the names that appear in the DB. The names given in the db to these variables is as follows: Affected Variables-> Measure Node Variable -> Building Attribute Auxiliary Variable-> Purpose Node Input Variable ->Purpose Node Input Variable: A variable( orange in the GUI ) that serves as input for the calculations. It could be either a table or a constant. Tables are mainly used in the LOOK UP equation types. Factor: Factor ( white in the GUI ) are created in the factor library and could be added to measures as a way to include variation of input variables in time. Auxiliary Variable: Variable used as an auxiliary ( intermediate step in calculations ). Auxiliary variables are most of time connected to other auxiliary variables or to a measure node. Furthermore, they are mainly dependent on input, factor or building attribute variables. 66 5.2.2 Measure library (measure editor) tables 2/5 N 1 1 node_id=basenode.id 1 1 N 1 N N 1 1 N 1 N Note: the group node table is not used ( it was initially thought as a way to give the same equations to different nodes 67 5.2.2 Measure library (measure editor) tables 3/5 Variable_id=CityVariable.id 1 1 N 1 N 1 1 measure_id=Measure.id N Note: For future update of the database is the id in the measure table the one that needs to be a PK and not the measure name field. 68 5.2.2 Measure library (measure editor) tables 4/5 value_id=Value.id N 1 1 Table_key_id=TableKey.id N 1 N 1 Key_id=TableKey.id and attribute_id=buildingattribute.id N 1 1 1 N value_id=Value.id attribute_id=BuildingAttribute.Id Note: Building attribute value table is currently empty. The values are stored now in the table cityTobuildingattribute. In addition, the buildingattribute table serves as a dictionary for the values in citytobuildingattribute table 69 5.2.2 Measure library (measure editor) tables 5/5 The meaning of the fields is as follows: 1.cityname: the name of the city 2.attributerealname: is the name of column found in the table referenced in 5 (every time the name of this attribute is changed in the db or a different table is used. This field needs to be updated. 3.unit: units 4.Buildingattributeid:the id in the building attribute table to which the attribute realname is linked to. Only done for Amsterdam, Lyon and Vienna 5.tablename:The name of a table in the public schema. This table is the one that shall contain the city data ( if a new table is used in the db. This field needs to be updated as well. 6.function: Sometimes the cities give aggregated information (BLOCKS) or disaggregated (BUILDING). In case this information is aggregated, cities need to give a attributerealname ( i.e area/typeofbuilding or function ) from which the calculation could be disaggregated by the simulation and aggregated back again for the ouput. In that case the field measurevariable needs to be put to FALSE. See example below. 70 5.2.3 Factor library tables Factors are assumptions regarding the values that city specific variables will take in the future ( way to take uncertainty into account ). Factors can be created linked to a predefined city variable, or as independent ones to be used in the measure library ( in this case the user should select the [Input Variable] name from the “Variable to link factor” combo box) 1 In addition, factors are defined per user and city. However, at this moment, all users from the same city are able to see/edit the factors defined by other users. This is because measures in the measure library are only defined per city, and if a factor needs to be added to specific measure it needs to be defined in the same way. Otherwise, the same measure could have a different behaviour per user. N Note: Instead of the factor name as a FK in the factor entry table the factor.id should be used. 71 5.3 Package Diagram 1/4 The charts package contains all the classes and JavaScript files necessary to create the charts which are shown in the GUI. Every time a chart type is created ( as a Vaadin Widget) a “component” package will be generated. In addition, the chartqueries package contains all the database queries and which are used to fill in the charts 72 5.3 Package Diagram 2/4 1. 2. 3. 4. 5. 6. 7. 8. 9. 10. 11. Measureporlet_service_impl: Stores all the custom methods used to make queries to the database by using the liferay service builder. Webui_step1: Contains all the classes needed to create the “Analyze city Context” step Webui_step2: Contains all the classes needed to create the “Set scenarios” step. Webui_step3: Contains all the classes needed to create the “Allocate measures” step. Sequenceportlet: It is used by the webui_step3 package and it contains the classes needed to allocate a measure to time Webui_step4: Contains all the classes needed to create the “Determine Impact” step. Measurelib: Contains all the classes needed to create the “Measure Library” MindMap: Contains all the classes needed to create the MindMaps which are shown in the Measure Library. Measurelib_windows: Contains all the pop up windows which are shown when double clicking in any of the nodes of the mindmaps. Webui_factorlib: Contains all the classes need to create the factor library. Charts_windows: Contains the classes which to create the windows in which the charts in step 1 and 4 are shown. 73 5.3 Package Diagram 3/4 Jeval is the library which is used to connect the nodes in the mindmaps from equations.This library is used by the webui_measurelib and mindmap packages respectively. 74 5.3 Package Diagram 4/4 The TransformFrontend package contains the classes to build the main ( parent ) layout of the GUI which will eventually contain the taps step 1 till 4 measurelib and factorlib 75 5.4 Simulation model This part of the documentation provides an overview of the simulation model, its internal data structure and the simulation scheduler. 5.4.1 Conceptual model TRANSFORM 5.4.2 Package Overview 5.4.3 Internal data structure 5.4.4 Simulation scheduler 76 5.4.1 Conceptual model TRANSFORM The model distinguishes consumers, network and producers. Consumers and producers are entities in the system that contain attributes (e.g. consumption values). At each event in time (i.e. scenario change or measure application), a recalculation will be done on the attributes of these entities. The recalculation is done using a calculate that evaluates the formulas that the users input in the measures and assigns the values to the entities. The calculator will eventually calculate the formulas that are made to determine the KPIs, which are finally outputted to the output database. 77 5.4.2 Package overview • Src.nl.macomi.transform.data – • Src.nl.macomi.transform.database – • The internal data structure of the simulation model Src.nl.macomi.transform.model.modelbuilder – • Classes to evaluate equations Src.nl.macomi.transform.model.data – • Classes built from atomic and coupled models that is the actual representation of the simulation model Src.nl.macomi.transform.calculator – • Classes to represent a measure Src.nl.macomi.transform.model – • Classes to represent an equation and its components Src.nl.macomi.transform.measure – • Classes to support database loading and outputting Src.nl.macomi.transform.equations – • A data representation of the data loaded from the database -classes that use automatically generate the simulation model from input data Src.nl.macomi.transform.model.utils – Various utils functions that we need in other classes 78 5.4.3 Internal data structure • Src.nl.macomi.transform.data – This package contains the internal representation of the data from the database, it contains the following classes whose name corresponds to the data it contains: • AggregatedEntity • BuildingAttribute • BuildingAttributeValue • Carrier • CityVariable • ConstantValue • Entity: this contains data from the city tables • Equation • Groupnode • KeyValuePair • KPINode • Measure • MeasureApplication • MeasureNode • MeasureUpdatableNode • Node • NodeValue • PurposeNode • TableKey • TableKeyCombination • TablueValue • Value 79 5.4.4 Simulation scheduler The simulation scheduler is a java application that is continuously running and reads the experiments table in the database to check whether there is an experiment that has not been executed yet. As soon as it finds an experiment that has not been executed, it will simply spawn the simulation model with the appropriate sequence and scenario ID. The simulation scheduler consists of 3 classes: • Dataservice: to read the database table containing the experiments • Scheduler: the main class that runs the program that will check the table regularly • Tunnel: a helper class to start a SSH tunnel programmatically 80 6. Deployment Guide 1 Introduction 1.1 Intended audience 2 Glossary Content: Document about the required hardware for running the DSE. 3 Hardware Requirements 4 Software Requirements 4.1 Specification 4.2 Installation 4.3 Data (see attached Word document: DSE Deployment Guide v1.0.docx) Audience: Parties interested in installing the DSE on their own servers.