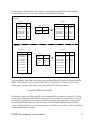
1
Ability to read and process variables or formulas quickly. In this database the information of a record is not stored sequentially, which is very different from a traditional relational database. However, the concept of a record can still be used here. Our new database engine can read/write variables much more quickly. A new mixed mode data access is provided. It will allow users to mix household variables with the district aggregation in the same formula without first producing the district aggregation database. A correctly implemented mixed model variable access will also make it possible to store the variables of higher aggregation levels much more efficiently. This is crucial since large amounts of district level variables are needed in modeling. Introduction of categorical variables. A categorical variable is equivalent to a set of dummies. The provision of categorical variables eases the task of comparing them and/or its cross product. Limited operation allowed for the categorical variable insures the correctness of categorical variable manipulation. Adding, subtracting, or dividing two categorical variables is prohibited. While multiplication of two factors is interpreted and implemented as making new categorical variables of paired values. In contrast, a traditional database treats all numeric variables equally, whether or not they are categorical or continuous variables, thus mistakenly adding a categorical variable with a continuous variable is possible in most statistical packages or databases. Variable comparability is strictly enforced; only variables compatible in survey and census are allowed to enter the regression stage. This will greatly reduce potential errors. Since the regression uses only the record with no missing value, it is very important for researchers to know how many records will become unavailable as the result of data processing. It is quite difficult in traditional statistical software to produce such a report but users will be able to do it in PovMap2. While users are exploring the data within PovMap2, all the actions will be recorded in the form of a script log. The script log can be used or modified at a later date., or to be used in another dataset. PovMap2 has a content sensitive help system. Advanced data processing and tabulation function. User can use PovMap2 to finish all computation needs without switching to other software tools. Dataflow in Poverty Mapping The following chart illustrates the dataflow of poverty mapping. The majority of it is processed in the ‗checker‘ screen of PovMap2. The box labeled ―Consumption prediction model‖ consists of four screens which need to be handled sequentially. DRAFT for comment; not for citation 10