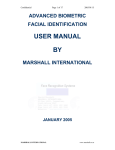
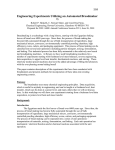
1
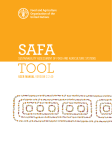
safa
Sustainability Assessment of Food and Agriculture systems
tool
User Manual beta version 2.1.50
e
Wat
er
Atmosphe
r
NA
nd
La
n
versi
ty
Corporate
Ethics
Biodi
Cultural
Diversity
Animal Welfare
th &
eal fety
H
n
Sa
ma
uit
Vu
y
Decent
Livelihood
nom
Fair
Tr
Prac ading
tices
ht
Rig
ur
bo
La
ab
ili
nt
ty
o
l Eco
i
er
stme
Ec
Loca
al
ln
y
lit
ua n
t q io
uc at
od rm
Pr info
&
s
Eq
Inve
y
my
GOV
io
at
y
&
s
ial
ter gy
Ma er
En
no
ER
ip
lit
t
ic
tab
i
o
en
w
f La
rt
Hu
oun
vir
nm
eo
Pa
Acc
ic
Holist nt
eme
manag
CE
Rul
N
En
so
c
NATURAL RE S OURCE S MANAGEMENT AND ENVIRONMENT DE P ARTMENT
safa
Sustainability Assessment of Food and Agriculture systems
tool
User Manual beta version 2.1.50
Food and Agriculture organization of the united nations - rome 2013
The designations employed and the presentation of material in this information product do not imply
the expression of any opinion whatsoever on the part of the Food and Agriculture Organization of the
United Nations (FAO) concerning the legal or development status of any country, territory, city or area
or of its authorities, or concerning the delimitation of its frontiers or boundaries. The mention of specific
companies or products of manufacturers, whether or not these have been patented, does not imply that
these have been endorsed or recommended by FAO in preference to others of a similar nature that are
not mentioned. The views expressed in this information product are those of the author(s) and do not
necessarily reflect the views of FAO.
All rights reserved. FAO encourages the reproduction and dissemination of material in this information
product. Non-commercial uses will be authorized free of charge, upon request. Reproduction for resale or
other commercial purposes, including educational purposes, may incur fees.
Applications for permission to reproduce or disseminate FAO copyright materials, and all queries
concerning rights and licenses, should be addressed by e-mail to [email protected] or to the Chief,
Publishing Policy and Support Branch, Office of Knowledge Exchange, Research and Extension, FAO,
Viale delle Terme di Caracalla, 00153 Rome, Italy.
© FAO, December 2013
acknowledgements
SAFA is an initiative led by Nadia El-Hage Scialabba, Natural Resources Management and
Environment Department; thanks go to Alexander Mueller for his continuous support and
to the Government of Switzerland for the generous financial assistance.
The SAFA Tool (beta version 2.1.50) is an open source, freely-available, and userfriendly software offered by FAO to implement the SAFA Guidelines (version 3.0) and
the SAFA Indicators for sustainability assessment of enterprises.
Special thanks go to the software developers: David Kahnt, Thomas Lindner and Anne
Mordhorst.
The SAFA Guidelines, SAFA Indicators and SAFA Tool are freely downloadable from:
http://www.fao.org/nr/sustainability/sustainability-assessments-safa
SAFA tool
iii
U s e r Ma n u a l b e t a v e r s i o n 2 . 1 . 5 0
Table of Contents
Goals of the SAFA tool...............................................................................................................1
Purpose of the SAFA tool..............................................................................................................................................1
The SAFA Guidelines (version 3.0)................................................................................................................................1
Use of results................................................................................................................................................................1
User Groups.................................................................................................................................2
Enterprise’ assessors...................................................................................................................................................2
Independent assessors.................................................................................................................................................2
Download and Start of Software...........................................................................................3
Technical requirements................................................................................................................................................3
Unzip and start..............................................................................................................................................................3
Introducing .XML data files...........................................................................................................................................4
How to open .XML data files..........................................................................................................................................4
How to save .XML data files..........................................................................................................................................4
Structure of the SAFA tool ......................................................................................................5
Main navigation.............................................................................................................................................................5
Navigation elements.....................................................................................................................................................5
“scroll to top” .................................................................................................................................................................5
“Contextualization” as index ........................................................................................................................................5
The allocation line for indicators.....................................................................................................................................6
Glossary..........................................................................................................................................................................7
Info boxes........................................................................................................................................................................7
Completing the assessment......................................................................................................8
Welcome .......................................................................................................................................................................8
Mapping.........................................................................................................................................................................8
Enter data to mapping.....................................................................................................................................................8
Declaration for” small-scale producers” status and its effect.........................................................................................9
Contextualization..........................................................................................................................................................9
Procedure of Contextualization........................................................................................................................................9
Deselection of sub-themes..............................................................................................................................................9
Adding rating definitions to indicators...........................................................................................................................11
Sharing the contextualization of a SAFA........................................................................................................................12
Indicators....................................................................................................................................................................13
Entering data for an indicator.......................................................................................................................................13
Adding indicators (under development).........................................................................................................................14
iv
SAFA tool
U s e r Ma n u a l b e t a v e r s i o n 2 . 1 . 5 0
Reporting.....................................................................................................................................................................14
Explanation of reporting results....................................................................................................................................15
Interpretation options of report.....................................................................................................................................18
Save and print “Reporting”...........................................................................................................................................18
Comparison of Results..................................................................................................................................................18
Usage of results for communication..............................................................................................................................18
List of Figures
Figure 1. Contextualization as index.............................................................................................................................6
Figure 2. Allocation line example for E 5.3.4 Food loss and waste reduction............................................................7
Figure 3. All extra information opened in the example for G2.1.1 Holistic audits....................................................10
Figure 4. Selection and deselection of sub-themes..................................................................................................11
Figure 5. Adding rating definitions in the example of G3.1.1.....................................................................................12
Figure 6. Indicator Input Sheet for C 2.1.1..................................................................................................................14
Figure 7. Example of a polygon after completing the step “Indicators”.................................................................15
Figure 8. Selection of themes.....................................................................................................................................16
Figure 9. Disaggregated rating of the Theme Biodiversity ......................................................................................17
SAFA tool
v
U s e r Ma n u a l b e t a v e r s i o n 2 . 1 . 5 0
Goals of the SAFA tool
Purpose of the SAFA tool
The free of charge SAFA Tool (beta version 2.1.50) is created by FAO to undertake
sustainability assessment, as described in the SAFA Guidelines (version 3.0). The SAFA
Tool guides users through the four SAFA assessment steps: “Mapping”, “Contextualization”,
“Indicators” and “Reporting”. The indicators used are those offered in the Guidelines’
complement: SAFA Indicators.
The SAFA Guidelines (version 3.0)
SAFA is a holistic global framework for the assessment of sustainability along food and
agriculture value chains. SAFA establishes an international reference for assessing tradeoffs and synergies between all four dimensions of sustainability. It has been prepared so
that enterprises, whether companies or small-scale producers, involved with the production,
processing, distribution and marketing of goods have a clear understanding of the
constituent components of sustainability and thus, better tackle their strength, weakness
and progress towards sustainability. By providing a transparent and aggregated framework
for assessing sustainability, SAFA seeks to harmonize sustainability approaches within
the food value chain, as well as furthering good practices.
Use of results
SAFA is intended primarily for self-evaluation and internal communication about
sustainability goals and performance. It is possible to use the SAFA report for communication
with other businesses to establish a common understanding of sustainability aspects.
SAFA results can be used for internal management, as well as learning and communication
purposes. For credibility, it is essential that the SAFA procedures and results have a high
degree of transparency. The completion of a SAFA assessment does not allow the entity to
use the logo of SAFA or FAO in any way that implies endorsement or certification, as no one
is verifying the claim. When a SAFA assessment is fully transparent in all its choices and
customization (e.g. with regards to boundaries, data sources, indicator selection, rating),
reference can be made to “Consistency with the SAFA procedures and principles”.
SAFA tool
1
U s e r Ma n u a l b e t a v e r s i o n 2 . 1 . 5 0
User Groups
Enterprise’ assessors
When an enterprise, whether a small-scale producer or a large company, desires to
undertake a SAFA, it must ensure that the entrusted “assessor” has access to the
necessary information resources. The enterprise has to ensure that the assessor receives
all the information needed to do the mapping, contextualization and data gathering for
the indicators.
Independent assessors
Enterprises might chose to hire a third party assessor in order to benefit from expert
knowledge for the assessment and/or claim reliability of the assessment (i.e. no selfinterest). As any external person needs first to get familiar with the structure of the
enterprise in order to be able to do the mapping correctly, the assessor might need to visit
the premises of the assessed entity.
2
SAFA tool
U s e r Ma n u a l b e t a v e r s i o n 2 . 1 . 5 0
Download and Start of Software
The SAFA Tool is free of charge and can be downloaded as a ZIP file at the FAO website:
www.fao.org/nr/sustainability/sustainability-assessments-safa
Technical requirements
In order to run the software the following technical requirements are needed for an optimal
execution of the SAFA Tool:
Operating system
Windows XP Service Pack 3
Windows Vista
Windows 7
Windows 8
Processor
Intel Pentium 4
RAM
512 MB
Minimum screen resolution
1024x768 Pixel
Free disk space
200 MB
For opening PDFs in the SAFA Tool, a PDF reader is needed. For example, the Adobe
Acrobat Reader can be downloaded free of charge from:
http://get.adobe.com/de/reader/
Unzip and start
To unzip the downloaded folder, use the zipping software delivered with the Windows
system software. Open the context menu with a right click on the folder and choose “Extract
all”. If needed, change the location of the folder in the following dialogue and click again
on “Extract”.
After unzipping, open the SAFA Tool application folder which is called by default
“SAFAtool” and double click on the file “start.exe” to start the program. The welcome
screen of the SAFA tool opens. No further installations are necessary.
SAFA tool
3
U s e r Ma n u a l b e t a v e r s i o n 2 . 1 . 5 0
Introducing .XML data files
The SAFA tool saves an assessment into a .XML data file. This type of file works like a little
database that stores the entered information. To share e.g. the contextualization of a SAFA
or to compare several results the single .XML file contains all the needed information (see
also “Completing the assessment”).
How to open .XML data files
To open a .XML data file from the application folder that has been saved from the SAFA
tool after entering information, open the SAFA tool and click on the button
(or minimized
) in the upper left corner at any page. A dialogue will appear displaying
your private folder. Navigate to the .XML data file that you want to load and mark it. Click
“Open”. The tool will load the welcome page of the SAFA tool.
How to save .XML data files
In the upper left corner, two options are displayed to save the .XML data files of a SAFA:
1. “Save As”
(or minimized
)
opens a dialogue for giving a name to the file and choosing the desired folder for saving
the file.
2. “Quick Save”
(or minimized
)
saves the status quo automatically in the SAFA-Tool application folder (default
“SAFAtool”). The file is named safa_self_assessment_YYYY-MM-DD_quicksave (for
example safa_self_assessment_2013-12-03_quicksave). YYYY-MM-DD stands for the
current year, month and day. The quick save will always overwrite any quicksave file
of the same day if not renamed.
4
SAFA tool
U s e r Ma n u a l b e t a v e r s i o n 2 . 1 . 5 0
Structure of the SAFA tool
Main navigation
The main navigation follows the four implementation steps of a SAFA. The “Welcome”
screen is followed by “Mapping”, “Contextualization”, “Indicators” and “Reporting”.
These navigation steps are always shown in the upper part of the screen. They will be
minimized when scrolling down at a page. The same applies to “Load”, “Save as”, “Quick
save”, “Manual” and “Glossary”. The tool is built in such a way that the user can move back
and forth between the steps as soon as the required data in “Mapping” is filled out. The
navigation is thus not limited to navigate in a “one way” direction.
Navigation elements
“scroll to top”
As soon as a page is scrolled down the half translucent button “scroll to top” appears. Go
back to the top of the page by clicking on this button.
“Contextualization” as index
The overview of dimensions / themes / sub-themes / indicators in the step “Contextualization”
can also be used for orientation and as an index to jump directly to the data input screen of
a specific indicator in the step “Indicators”.
Click on the dimension fields to automatically scroll down to the dimension section.
To open the data input screen of a specific indicator click on the arrow
at the right
hand side of that indicator.
SAFA tool
5
U s e r Ma n u a l b e t a v e r s i o n 2 . 1 . 5 0
Figure 1. Contextualization as index
Link from the contextualization
index to the data input screen of
a specific indicator
The allocation line for indicators
The step “Indicators” provides an indicator allocation line for orientation. It shows which
indicator is displayed below in the data input screen, as well as to which dimension, theme
and sub-theme it belongs to.
The squares symbolize indicators. White squares are indicators which are selected as
relevant, grey squares are indicators which are deselected. The first layer of lines around
the squares connect indicators of one sub-theme with each other. The second layer of lines
groups the themes of a dimension. The index number of the current indicator is shown in its
square and marked with a yellow line. Above the allocation line the according dimension,
theme and sub-theme are displayed.
6
SAFA tool
U s e r Ma n u a l b e t a v e r s i o n 2 . 1 . 5 0
Figure 2. Allocation line example for E 5.3.4 Food loss and waste reduction
It is not possible to click into the allocation line to navigate to another indicator. Use
the buttons
and
to go back and forth. Use
the index in the step “Contextualization” to jump to an indicator that is not close by or to
have a full overview including descriptions (see above).
Glossary
The glossary is filled in an alphabetical order with the same content as the glossary in the
SAFA Guidelines (version 3.0). Click on the button
and pick the according
letter of the word that you want to inquire. To close the glossary again, click on “Close” in
the upper right corner.
Info boxes
Wherever details from the SAFA guidelines (version 3.0) are essential to understand the
assessment process a box with additional information can be opened. Click on
next to the section for which you need more information to open the info box.
SAFA tool
7
U s e r Ma n u a l b e t a v e r s i o n 2 . 1 . 5 0
Completing the assessment
Welcome
The step “Welcome” offers information on the process of a SAFA and gives hints on where
to find more information. To proceed with the assessment, click on the button “Start a
SAFA”, or click in the main navigation on “Mapping”.
Mapping
Mapping the supply chain will clarify what is being measured, where the sphere of influence
and direct control of the enterprise would stop, what the organizational and operational
boundaries are and what interactions take place in the production network.
Enter data to mapping
Follow the order of questions and fill out. Navigate between the question by scrolling and
clicking into the answer fields or by using the tab-cursor.
You can return to the mapping step whenever you want. Note, that there are three fields
that require an answer before proceeding with the step “Contextualization” is possible:
»»
»»
»»
Year for which data will be collected
Name of Entity
Do you consider the entity assessed a small-scale producer? (See below for details).
There are four types of data that can be entered:
1. Entering text information (
): Click into the field underneath the question and start
to write the answer.
2. Entering numbers (
): Click into the field underneath the question and start to write
the answer. Note, that you can only type numbers.
3. Choosing from a drop down (
): Click on the field. A list will be enfolded. Choose
the correct answer from the list if necessary by scrolling down and click on it.
4. Uploading pictures: For defining the supply chain boundaries the tool offers an upload
function for pictures in the format: .jpg, .png, .gif and a size up to 1 MB. To upload a
picture click on the field “Upload a picture of the supply chain” or drag and drop the
picture into the area in the mapping section. Read the info box for instruction how to
create a supply chain map or consult the SAFA Guidelines (version 3.0). To remove the
picture click on “Remove Image”.
8
SAFA tool
U s e r Ma n u a l b e t a v e r s i o n 2 . 1 . 5 0
Declaration for” small-scale producers” status and its effect
At the end of the page comes the question “Do you consider the entity assessed a smallscale producer?” which requires an answer. When the box “yes” is checked a further
question will appear asking for a justification for the assumption.
When an entity is declared as a small-scale producer, the calculation of the scores
include exemptions for the performance indicators of the dimension “Environmental
Integrity”. In case that one of these indicators is not answered by the small-scale producer,
the related sub-theme will not weight omissions as “unacceptable” scoring. Instead, the
option “No data” can be chosen and such answer will be rated as neutral in the calculation
of the final result. Read more on the calculation rules in the SAFA Guidelines (version 3.0).
Contextualization
Following the step of detailed mapping and boundary-setting, the assessor will have
to collect a wide range of information about their context – meaning their geographic
or regional circumstances, such as resource availability, as well as their socio-political
circumstances such as labour trends, legal framework and other details.
The SAFA Tool provides the themes, sub-themes and default indicators as defined in
the SAFA Guidelines (version 3.0) and the separate document “SAFA Indicators”. The
purpose of contextualizing these sub-themes and indicators is to refine the measurements
and ratings for relevance, based on the circumstances surrounding the entity assessed.
Procedure of Contextualization
First, the decision has to be made if a sub-theme is relevant and, second, the rating steps
of the related indicators have to be adjusted to the context of the assessed entity(-ies). To
guide the assessor through the step “Contextualization” the tool lists the SAFA dimensions
/ themes / sub-themes / indicators (see figure 1 in “Navigation Elements”). Some extra
information appears by clicking on the different items:
»»
»»
Theme (e.g. G1 – Corporate Ethics): a description of the Theme’ goal appears.
»»
Indicator (e.g. G1.1.1 – Mission Explicitness): the indicator question appears, along with
Sub-theme (e.g. G1.1 – Mission Statement): a description of the Sub-theme’ objective
appears.
ratings’ conditions.
SAFA tool
9
U s e r Ma n u a l b e t a v e r s i o n 2 . 1 . 5 0
Figure 3. All extra information opened in the example for G2.1.1 Holistic audits
<click>
<click>
<click>
Deselection of sub-themes
The assessor should begin with a review of SAFA’s sub-themes, paying careful attention to
the sub-theme objectives which describe the sustainability goals that should be achieved in
the areas of performance. In the tool the deselection is only possible on the level of SAFA
sub-themes. The default SAFA indicators cannot be cancelled individually. That means
whenever a sub-theme is relevant all underlying default indicators have to be answered.
Deselect a sub-theme by clicking on the checked box at the right side. The check
mark disappears and the related indicators get crossed through automatically. As of
transparency reasons it is important to understand for third persons why the assessor
cancelled the sub-theme. That is why in case of deselection, the objective of the sub-theme
appears in order to recall the sub-theme’s importance, and a text field is given to write a
justification for the deselection. This justification will be displayed again in the reporting
section. Should the sub-theme be selected again, the previously written justification
will be kept in the database, for the sake of future sub-theme reselection, due to either
mistake or reconsideration of the sub-theme’ relevance. The justification can then be
reused or modified.
10
SAFA tool
U s e r Ma n u a l b e t a v e r s i o n 2 . 1 . 5 0
Figure 4. Selection and deselection of sub-themes
Sub-theme
deselected
Sub-theme
selected
Adding rating definitions to indicators
After clarifying which sub-themes are relevant, the next step of contextualization provides
the basis for customizing the metrics in order to determine performance in the intermediate
ranges between “best” (dark green) and “unacceptable” (red), that is: good (green), moderate
(yellow), orange (limited). The assessor should refer to the local conditions by using studies,
expert knowledge, etc. Consult the SAFA Guidelines (version 3.0) for further information.
To add the description of the rating steps to an indicator, click on its name (for example
E 3.3.1 – Stakeholder identification). The indicator question and the rating steps appear. The
steps “best” and “unacceptable” are already defined and cannot be changed. In some cases,
“moderate” is already defined too. Click into the text field of one rating step after another
and write a definition for which performance this rating would be achieved. Afterwards,
the field can be minimized by clicking once more on the indicator name.
In case that a sub-theme gets deselected, the already written definition for the related
indicator ratings will remain in the database in case that the sub-theme was deselected by
mistake or the sub-theme gets reselected again in a later stage. The definitions can then
be reused or modified.
SAFA tool
11
U s e r Ma n u a l b e t a v e r s i o n 2 . 1 . 5 0
Figure 5. Adding rating definitions in the example of G3.1.1
To jump after defining the rating steps directly to the input screen for the specific
indicator click on the arrow
at the right hand side next to the indicator name. This
functionality offers also the possibility to use the “Contextualization” as an indicator index
(see “Navigation elements”).
Sharing the contextualization of a SAFA
To share only the contextualization of a SAFA fill out the contextualization step and give
access to the saved .XML file. In case the contextualization applies to a certain climate
or region indicate this in the step “Mapping” in the section for the assessed entity.
Save the file by clicking on
. Choose a telling name incl. a date such as
“SAFA_contextualization_farming_small-scale_Peru_20131203”.
In whichever way you want to share the .XML data file, do not forget to provide also the
link for downloading the SAFA tool.
12
SAFA tool
U s e r Ma n u a l b e t a v e r s i o n 2 . 1 . 5 0
Indicators
The step “Indicators” provides an input screen for collecting data in answer to the indicator
questions, defining the accuracy score and rating the indicator performance of the assessed
entity on a range from “best” to “unacceptable”. Only those indicators appear in this section
which are part of a relevant sub-theme (see “Contextualization”).
Information on data types (e.g. primary and secondary data), possible data resources and
collection methodologies as well as background on rating can be found in the info boxes,
the “Indicator information” (link next to the heading), the SAFA Guidelines (version 3.0)
as well as the separate document “SAFA Indicators”.
Entering data for an indicator
Only one indicator can be displayed at a time. Use the allocation line above the indicator
input screen for orientation (see “Navigation Elements” and Figure 2).
There are two different types of input to the indicator question: quantitative (numbers
and percentages) and qualitative (descriptions of practices, targets, performance, etc.).
Following the question for the specific indicator, the type of input is indicated.
After answering the question, decide which quality the entered data has. Choose one of
the different possibilities in the drop-down menu. Depending on the selection, the Accuracy
Score will be automatically calculated in the “Reporting” step. Take into account that in
case of not selecting the data quality, the worst case is assumed.
The rating steps are displayed according to the contextualization defined in the previous
step “Contextualization”. Select the radio button that corresponds with the rating. The
final result will be calculated automatically in the step “Reporting”. Take into account –
as for the Accuracy Score – that any not rated indicator will be automatically scored as
“unacceptable” (red). That means it is obligatory to answer all indicators which are part of
a relevant sub-theme as defined in the step “Contextualization”.
There is an exemption for calculating the final result when an entity is declared in the step
“Mapping” as a small-scale producer. In case that the entity cannot give any information on
the performance indicators in the dimension “Environmental Integrity”, the option “No data”
can be chosen for rating the indicator. This option will be rated as neutral in the calculation
of the final result. Read more on the calculation rules in the SAFA Guidelines (version 3.0).
For all comments concerning critical areas, disclosure issues, data availability, etc. use
the comment field at the bottom.
SAFA tool
13
U s e r Ma n u a l b e t a v e r s i o n 2 . 1 . 5 0
Figure 6. Indicator Input Sheet for C 2.1.1
Adding indicators (under development)
In the next version of the SAFA Tool (immediately after field testing this Beta version), the
assessor will be enabled for the addition of extra indicators. Until then, this SAFA Tool can
be used only with the indicator set published in FAO, 2013, SAFA Indicators.
Reporting
The step “Reporting” creates transparency on a single SAFA assessment result. It is a
synthesis based on the information entered, including amongst others:
»»
determining factors from the step “Mapping” (assessor, goal of the assessment,
»»
»»
list of irrelevant sub-themes justified from the “Contextualization”
14
description of the enterprise and the assessed entity)
the automatically calculated themes’ ratings and accuracy scores visualized in a polygon
from the “Indicators” step
SAFA tool
U s e r Ma n u a l b e t a v e r s i o n 2 . 1 . 5 0
Furthermore, it provides space for the user to describe the assessment process, hotspot
issue details and areas for improvement.
Explanation of reporting results
In the section “Results and interpretation by the assessor”, a range of automatically
generated information gives insight on the performance of the assessed entity in the
different themes of a SAFA. The polygon provides the rating per theme represented in a
spider diagram over a traffic light. The legend gives definitions of the ratings. All themes
that are rated as “unacceptable” are marked red, or hot spots. All themes of which all
sub-themes are deselected are marked grey, as not relevant. The number of deselected
sub-themes can be viewed in the box “Omitted Sub-themes”.
Figure 7. Example of a polygon after completing the step “Indicators”
legend
BEST
GOOD*
MODERATE*
LIMITED*
UNACCETABLE
not relevant
* c o n t e x t uali z e d b y as s e s sing p e r s o n / t e am / o r gani z a ti o n
SAFA tool
15
U s e r Ma n u a l b e t a v e r s i o n 2 . 1 . 5 0
Underneath the polygon, each Theme is displayed in a box coloured according to the
relating SAFA dimension. Hot spot themes have a red flag. The boxes of those Themes of
which all Sub-themes were deselected in the step “Contextualization” are grey.
Figure 8. Selection of themes
To see more details on the performance of a Theme, click on its box. The graph below
will jump to the Theme displaying the ratings of the indicators and the achieved Accuracy
Score at the Sub-theme level. Again, red text stands for “hot spot” and grey for “not
relevant”. The labels on the right border describe the elements of the graph.
16
SAFA tool
U s e r Ma n u a l b e t a v e r s i o n 2 . 1 . 5 0
Figure 9. Disaggregated rating of the Theme Biodiversity
SAFA tool
17
U s e r Ma n u a l b e t a v e r s i o n 2 . 1 . 5 0
Interpretation options of report
The questions in the orange boxes at the bottom of the report page serve as guidance
to recapture the assessment process and for evaluating the final results and defining
measurements to take. Use the polygon and the evaluation graph to go through all themes
and understand deficits and potentials. Fill out this orange box in order to finalize the report.
The comment fields below the orange box can be used to note down any information
for own use, towards the verifier (if applicable) and FAO (if desired).
Save and print “Reporting”
The reporting can be saved as HTML-file that can be opened by any browser software
(which is usually preinstalled) and printed from there.
To save the reporting file click next to the polygon result on the button
.
The HTML-file will be saved automatically in the application folder (by default “SAFAtool”)
with the file name safa_self_assessment_YYYY-MM-DD_report.html (for example safa_
self_assessment_2013-12-13_report.html). YYYY-MM-DD stands for the current year,
month and day. Saving will always overwrite any report file of the same day if not renamed.
Comparison of Results
To compare up to three polygons based on the same contextualization (e.g. production
processing, retailing of a value chain), click on the according button in the “Comparison
area” to load the .XML file of the assessment that you want to add. An extra line appears
in the polygon. To add a third line click on the second “Compare” button and load the
second .XML file. Refer to the legend to differentiate the lines.
Please, note that you should not compare the resulting polygons of SAFA assessments
that are based on different contextualization. As with the contextualization the baseline for
comparison gets lost. This refers also to future versions of the SAFA tool. .XML files of future
versions might not be compatible with the .XML files of the SAFA tool beta version 2.1.50.
To remove a SAFA result from the polygon click on the according “Remove” button.
Usage of results for communication
Please, refer to the SAFA Guidelines (version 3.0) to read more on the communication
principles or open the info box provided in the intro text of the step “Reporting”.
18
SAFA tool
© FAO | December 2013
Design and Layout :: [email protected]
safa
SuStainability aSSeSSment of
food and agriculture SyStemS
safa tool
www.fao.org/nr/sustainability/sustainability-assessments-safa
food and agriculture organization of the united nations (fao)
Viale delle Terme di Caracalla - 00153 Rome, Italy