1
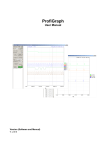
ProfiGraph
User Manual
Version (Software and Manual)
V. 2.12
ProfiGraph – User Manual
ProfiGraph is like a virtual oscilloscope; you can inspect in graphical way the data exchanged between
PROFIBUS devices and the diagnostic response of the slaves. In simple way, without to interfere with your
PROFIBUS installation, it can visualize the incoming data from a remote unit or analyze the timing of the
telegrams on the bus.
ProfiGraph relies on ProfiTrace Analyser to obtain data in real-time from a PROFIBUS network.
ProfiGraph can be run locally or remotely through a network, since it uses an efficient TCP connection with the
computer running ProfiTrace.
ProfiGraph has a simple and intuitive interface and has two operating modes.
- The "Data - Time Analyzer" mode shows in graphical way the process data.
- The "Bus Timing" mode shows in graphical way the telegrams on the bus.
Pressing the button statistics, it visualize the distribution, the mean, the minimum, the maximum, the standard
deviation of the cycle time of PROFIBUS telegrams (Data Exchange, Token Pass) or digital signals.
Technical data:
Number of Channels: 8
Telegrams/Channel: 60000
Trigger:
Set level, positive slope, negative slope, Transition faster than Interval Width, Trig.1 and (Trig.2
Inside Interval), Trig.1 and (Trig.2 Outside Interval), Trig.1 or Trig.2.
Wait for ProfiCore Trigger
Manual
Continuous Viewing : Continuous Scrolling mode or Repeated acquisition mode
ProfiGraph saves the graphical screen in bitmap format (.bmp) and exports data into compatible text file (.csv).
ProfiGraph, in Offline Mode, can be use to analyze ProfiTrace Data Files (.ptd) in graphical way.
ProfiGraph is compatible with ProfiCore + ProfiTrace 1.62 and with ProfiCore Ultra + ProfiTrace 2.0.3 or higher.
2
ProfiGraph – User Manual
Installation and start up
3
ProfiGraph – User Manual
Plugin Installation
1. Check the ProfiTrace directory (usually C:\Program\ProfiTrace_V1_6_2\ or
C:\Program\ProfiTrace_V2_1_1\).
2. Copy the ProfiGraph license file “ProfiGraph_xxxx.pld” into the app directory (usually
C:\Program\ProfiTrace_Vx_x_x\app).
3. Run ProfiTrace.
4. Select from the Setting menu, plugins.
5. Press Install plugin. Select the plugin “plg_profigraph_profilogger.dll” from the directory
C:\Program\ProfiTrace_Vx_x_x\plg.
6. After the installation, select Enables.
7. Press Close.
8. From the menu Setting->Preferences->General select "Automatically enable on Startup"
9. Close ProfiTrace.
4
ProfiGraph – User Manual
After completing the installation, you can run ProfiTrace to verify that the installation process has completed
successfully:
1.
2.
3.
4.
5.
Run ProfiTrace
Press Init Proficore
Select from the Setting menu, plugins.
Check the plugin version. Select the "General Info" Tab.
Press General Setup and check if the TCP server is running. “TCP Server status: Run”
6. Minimize, without closing, ProfiTrace and run ProfiGraph. Check the version. Click on the ProfiGraph
icon in the title bar and press "About:".
Attention!
- ProfiTrace must be at least Version 1.6.2 or higher.
- For to activate the offline functionality, you must use one time the program online with ProfiCore.
-
If a plugin is to be updated (using this 'Install Plugin' button) then please restart ProfiTrace with the left
CTRL key held down during startup.
A window will be shown indicating no plugins will be loaded. After restarting, the plugin should be active.
5
ProfiGraph – User Manual
TCP setting
ProfiTrace and ProfiGraph running on the same computer.
The Server Name must be localhost.
Attention! If you change the Port number, you must restart ProfiTrace.
To check the Port number go ProfiTrace-> Setting->plugins and press General Setup
6
ProfiGraph – User Manual
ProfiTrace and ProfiGraph running on separate computers connected in a network.
Insert the IP address of the computer where ProfiTrace is running.
Attention! Check your Firewall setting.
In order to use the program you need to ensure that your firewall or security utility are set to allow ProfiGraph
and ProfiTrace.
7
ProfiGraph – User Manual
Operating modes
-
“Data - Time Analyzer” mode.
The “Data - Time Analyzer” mode shows in graphical way the process data.
-
“Bus Timing” mode.
The “Bus Timing” mode shows in graphical way the time position and duration of telegrams on the bus.
8
ProfiGraph – User Manual
Description of menu buttons
9
ProfiGraph – User Manual
Channel Setting “Data - Time Analyzer” mode
-
Enable
Enables/Disables the channel.
-
Name
Can be used to better describe the visualized channel.
-
Profibus Address
The Profibus address of the slave device.
-
Signal Type
Type of the signal in the device. Possible Signal Types are:
Digital Input
Digital Output
Analog/Generic Input
Analog/Generic Output
Slave Diag. (bit)
Slave Diag. (data bytes)
-
Start Byte
Selects, inside the Profibus data message, the start position of the data that to be visualized.
10
ProfiGraph – User Manual
-
Data Type
Selects the numeric format which has to be used. Possible data types are:
Int8
Int16
Int32
Unsign.8 (bin.B)
Unsign.16 (bin.W)
Unsign.32
Float
Int16_intel
Int32_intel
Unsign.16_intel
Unsign.32_intel
Float_Intel
AI/AO Val+Status (PA V3.0)
DI/DO Val+Status (PA V3.0)
The Unsign.8 (bin.B) and Unsign.16 (bin.W) show in the Info Panel the binary value of the data. Useful for Status
Byte or Status Word.
-
(Off+DataValue*Factor)
A formula can be used in order to scale the data value.
-
Unit
It can be used to better indicate the unit of the visualized data.
Button “Import .pti files”
It can be used to read a ProfiTrace “Data Inspection” file for to import the settings.
Button “Set all DP add. To:”
Useful if you change the address of a slave of if you have to check more slave of the same type
Wizard Buttons
They help you to fill the setting form.
11
ProfiGraph – User Manual
Import Hardware configuration
It can be used to read a SIEMENS Step 7 hardware configuration file. The Step 7 hardware configuration file
must be exported to a file. In Step 7 open HW Config and select Station->Export. Press Browse and select the
directory C:\Program\ProfiTrace_V1_6_2\ProfiGraph\HW_Configuration. Insert the file name. Select Option
“Export symbols” and Format “Readable”, and press Save.
Press
Select the cfg file.
Select the module and press OK.
Check the data Start byte, Data type and insert the name of the channel.
12
ProfiGraph – User Manual
Channel Setting “Bus Timing” mode
-
Enable
Enables/Disables the channel.
-
Name
It can be used to better describe the visualized channel.
-
Profibus Address
The Profibus address of the telegram. It depends on the selected “Type”. For the type “Token Pass” it represents
the Master Destination Address, for the other types it represents the Slave address; “[*]” means all the address
from 0 to 127.
-
Type
Type of the telegram. Possible Types are:
Data Input (Slave Response)
The Data-Exchange response telegram is shown.
Data Output (Request to Slave)
The Data-Exchange request telegram is shown.
Diagnostic Request to Slave
Diagnostic Response (Slave Diagnostic)
Acknowledgement
Check Config
FDL Status Request
FDL Status Response
Global Control
Set Parameter
Token Pass
Wizard Buttons
They help you to fill the setting form.
13
ProfiGraph – User Manual
Data Acquisition
Press Start.
Select
if you want to have a Continuous Scrolling of the data.
Useful for “N. of telegram/Ch” > 5000.
Select
if you want to repeat the acquisition continuously.
DP Address
Select
corner of the graphic.
if you want to show the Profibus Address. The DP address is shown at the top-left
Expand Trace
Shows the selected trace in full screen mode.
Export Data
The data can be exported into compatible text file (.csv format).
14
ProfiGraph – User Manual
Keyboard Shortcuts
F1
Help
Delete
Delete the selected trace
Up Arrow
Move up the selected trace
Down Arrow
Move down the selected trace
Left Arrow
Select previous trace
Right Arrow
Select next trace
Measurement of time interval
Select Enable Meas. Curs. Inside the graphic area, press the right button of the mouse and place the first and
the second cursor.
The measurement is shown at the top-right corner of the graphic.
15
ProfiGraph – User Manual
Offline Mode (.ptd files)
It can be used to analyze a ProfiTrace message file (.ptd).
For to activate the offline functionality, you must use one time the program online with ProfiCore.
Select
and press Start. Choose the file.
Select the trigger.
Select if you want to start from the begin of the file (Start from 0 [s]) or after a time.
16
ProfiGraph – User Manual
Trigger
Possible Trigger Types are:
Trig.1
Trig.1 and (Trig.2 Inside Interval)
Trig.1 and (Trig.2 Outside Interval)
Trig.1 or Trig.2
Transition faster than Interval Width
Wait for Profitrace Trigger
DISABLE
-
Trig.1
In this mode you have only one trigger. You must select the trigger source, the positive or negative slope and the
trigger level.
Example:
-
Trig.1 and (Trig.2 Inside Interval)
In this mode you have two triggers, the main trigger and the second trigger. You must select for both the trigger
source, the positive or negative slope and the trigger level. You must choose also the Interval Width.
Example:
The trigger is generated if after a positive edge on channel 1 occurs another positive edge on channel 1 within
the selected interval of 100 ms.
17
ProfiGraph – User Manual
Example:
The trigger is generated if after a positive edge on channel 1 occurs a negative edge on channel 2 within the
selected interval of 100 ms.
-
Trig.1 and (Trig.2 Outside Interval)
In this mode you have two triggers, the main trigger and the second trigger. You must select for both the trigger
source, the positive or negative slope and the trigger level. You must choose also the Interval Width.
Example:
The trigger is generated if after a positive edge on channel 2 occurs outside the selected interval of 500 ms a
positive edge on channel 4, or never occurs. The trigger is reset is after a positive edge on channel 2 occurs a
positive edge on channel 4 within the selected interval of 500 ms.
-
Trig.1 or Trig.2
In this mode you have two triggers. You must select for both the trigger source, the positive or negative slope
and the trigger level.
Example:
The trigger is generated if a positive edge on channel 1 or a negative edge on channel 3 occurs.
-
Transition faster than Interval Width
You must select for the trigger source, the start level, the end level and the time.
Example:
The trigger is generated if a positive transition, from 0.0 to 0.5, faster than 200 ms occurs.
18
ProfiGraph – User Manual
-
Wait for Profitrace Trigger
In this mode the program wait for ProfiTrace Trigger. Please look the ProfiTrace help section “Search &
Triggers”.
-
Disable
In this mode the trigger is disable.
Retriggering
If
is selected, ProfiGraph waits for the trigger signal before to repeat the acquisition.
19
ProfiGraph – User Manual
Time unit
Select this checkbox = seconds
Unselect this checkbox = Tbits
Save the Screen
Saves the graphical screen in bitmap format (.bmp).
Select a trace
Before removing or changing a trace, you must select it.
Press the left button over the trace name.
Statistic
It gives you useful statistical information about the period of digital signals: it can display time distribution, mean,
standard deviation, minimum and maximum values of any trace. For instance, cycle time of PROFIBUS
telegrams (Data Exchange, Token Pass) or any other cyclical digital signals.
20
ProfiGraph – User Manual
Scale
Press the Scale button or click over the scale label, insert the new limit and click outside of the edit box.
Click over the scale label and insert the new limit, than click outside of the edit box.
Zoom IN
Inside the graphic area, press and hold the left button of the mouse for to draw the zoom window.
Use the arrow button for scrolling.
Scroll left
Scroll right
Zoom OUT
Press the Zoom Undo button
21
ProfiGraph – User Manual
C.S.M.T. Gestione S.c.a.r.l.
Via Branze, 45
25123 Brescia ITALY
Tel.: +39 030 3384030, +39 030 6595111
Fax: +39 030 396999, +39 030 6595000
Author: Francesco Venturini
E-mail: [email protected]
Web: http://www.csmt.it
22