1
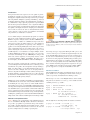
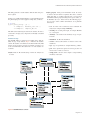
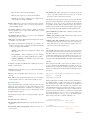
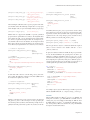
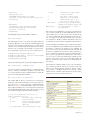
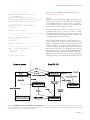
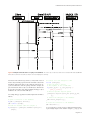
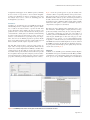
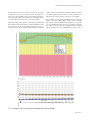
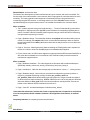
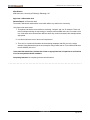
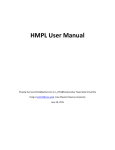
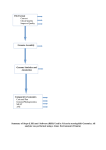
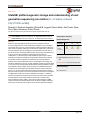
F1000Research 2013, 2:248 Last updated: 27 DEC 2013 WEB TOOL StatsDB: platform-agnostic storage and understanding of next generation sequencing run metrics [v1; ref status: indexed, http://f1000r.es/28e] Ricardo H. Ramirez-Gonzalez, Richard M. Leggett, Darren Waite, Anil Thanki, Nizar Drou, Mario Caccamo, Robert Davey The Genome Analysis Centre, Norwich Research Park, Norwich, NR4 7UH, UK v1 First Published: 15 Nov 2013, 2:248 (doi: 10.12688/f1000research.2-248.v1) Article Status Summary Latest Published: 15 Nov 2013, 2:248 (doi: 10.12688/f1000research.2-248.v1) Referee Responses Abstract Modern sequencing platforms generate enormous quantities of data in ever-decreasing amounts of time. Additionally, techniques such as multiplex sequencing allow one run to contain hundreds of different samples. With such data comes a significant challenge to understand its quality and to understand how the quality and yield are changing across instruments and over time. As well as the desire to understand historical data, sequencing centres often have a duty to provide clear summaries of individual run performance to collaborators or customers. We present StatsDB, an open-source software package for storage and analysis of next generation sequencing run metrics. The system has been designed for incorporation into a primary analysis pipeline, either at the programmatic level or via integration into existing user interfaces. Statistics are stored in an SQL database and APIs provide the ability to store and access the data while abstracting the underlying database design. This abstraction allows simpler, wider querying across multiple fields than is possible by the manual steps and calculation required to dissect individual reports, e.g. ”provide metrics about nucleotide bias in libraries using adaptor barcode X, across all runs on sequencer A, within the last month”. The software is supplied with modules for storage of statistics from FastQC, a commonly used tool for analysis of sequence reads, but the open nature of the database schema means it can be easily adapted to other tools. Currently at The Genome Analysis Centre (TGAC), reports are accessed through our LIMS system or through a standalone GUI tool, but the API and supplied examples make it easy to develop custom reports and to interface with other packages. Referees 1 2 3 report report report v1 published 15 Nov 2013 1 Mick Watson, University of Edinburgh UK 2 Cyriac Kandoth, Washington University USA 3 Anuj Kumar, University of Michigan USA Latest Comments No Comments Yet F1000Research Page 1 of 15 F1000Research 2013, 2:248 Last updated: 27 DEC 2013 Corresponding authors: Richard M. Leggett ([email protected]), Robert Davey ([email protected]) How to cite this article: Ramirez-Gonzalez RH, Leggett RM, Waite D et al. (2013) StatsDB: platform-agnostic storage and understanding of next generation sequencing run metrics [v1; ref status: indexed, http://f1000r.es/28e] F1000Research 2013, 2:248 (doi: 10.12688/f1000research.2-248.v1) Copyright: © 2013 Ramirez-Gonzalez RH et al. This is an open access article distributed under the terms of the Creative Commons Attribution Licence, which permits unrestricted use, distribution, and reproduction in any medium, provided the original work is properly cited. Data associated with the article are available under the terms of the Creative Commons Attribution Licence, which permits unrestricted use, distribution, and reproduction in any medium, provided the original data is properly cited. Grant information: The development of StatsDB has been funded by a Biotechnology and Biological Sciences Research Council (BBSRC) National Capability Grant at TGAC. The funders had no role in study design, data collection and analysis, decision to publish, or preparation of the manuscript. Competing Interests: The authors declare that there are no competing interests. First Published: 15 Nov 2013, 2:248 (doi: 10.12688/f1000research.2-248.v1) First Indexed: 27 Dec 2013, 2:248 (doi: 10.12688/f1000research.2-248.v1) F1000Research Page 2 of 15 F1000Research 2013, 2:248 Last updated: 27 DEC 2013 Introduction Next generation short-read sequencers are now capable of generating hundreds of gigabases of sequence data per run. This increase in throughput is complemented by technologies such as long-read single molecule platforms, multiplex sequencing and RADSeq1,2, that lead to differing analytical techniques and enable hundreds of samples to be combined into a single sequencing experiment, respectively. With this data heterogeneity and abundance comes a significant challenge to keep track of samples, to understand data quality and to understand how quality control (QC) and yield are changing across instruments and over time. As well as the desire to understand historical data, centres often have a duty to provide clear summaries of individual run performance to collaborators or customers. A user’s initial attempts to understand the QC profile of a run usually involve using manufacturer-supplied software, for example Illumina’s Sequence Analysis Viewer or PacBio’s SMRTAnalysis. As well as these, a number of community-developed tools have emerged for assessing run quality and they are often included in the primary analysis pipelines of sequencing centres. FastQC3 is a popular tool for analysing FASTQ files and is able to report a wide range of information related to the quality profile of the reads, as well as analysing GC content and over-represented sequence, such as PCR duplicates or over-abundance of adaptors. HTQC, another toolkit for FASTQ data analysis, is composed of a set of six tools for analysis and trimming of reads4. PRINSEQ also analyses and trims reads, with an emphasis on metagenomic datasets5. Other tools include NGSQC6, QRQC7 and SAMStat8. The latter tool, as the name implies, works with SAM files rather than FASTQ files. The new generation of single molecule sequencing technologies, such as the RS platform from Pacific Biosciences with longer reads and different error profiles, have brought their own QC challenges. While it is still possible to get useful information from next generation tools such as FastQC, new tools are emerging which are tailored to the platform. Examples include stsPlots, which provides graphical summaries of data included in the sts.csv files output by the instrument9 and PacBioEDA which operates on the .bas.h5 files produced by the PacBio primary analysis10. While there are a range of useful tools available to generate QC statistics for individual runs, we are not aware of any currently available solution for facilitating the easy storage and access of this valuable information. For this reason, we have created StatsDB, a platform-independent, tool-independent run QC and metadata database with APIs in Perl and Java. StatsDB features a generic database schema which enables the storage of data from any QC tool designed for any sequencing platform. StatsDB is designed to automate the storage of run QC metrics, enabling more granular queries over the data held within. Installation is simple and use of the software and API requires no knowledge of SQL. Methods and implementation Figure 1 illustrates the overall structure of the StatsDB system. At the core of StatsDB is a MySQL database which stores run metrics on a per-base, per-partition or per-run basis. On top of the database sits an API - currently implemented in both Perl and Java - which abstracts the database design from the tools that use the data and provides a simple interface for adding or querying data. Figure 1. At the core of StatsDB is a MySQL database supported by Perl and Java APIs. Parsers are simple scripts to write the output of QC tools to the database, while Consumers present the database contents to users. We envisage two types of programs utilising the API - parsers and consumers. Parsers process external data output from QC tools and use the StatsDB API to write the data. Conversely, consumers query the data stored in StatsDB and present it to the user, typically in the form of text and graphs. The StatsDB package includes parser implementations and examples of consumers, and the API enables others to be developed quickly and easily. Additionally, integrating these consumers into third-party applications is promoted - the open source LIMS system currently in development at TGAC, MISO11, provides support for accessing data in StatsDB out-of-the-box. Database installation The StatsDB framework supplies two SQL files that are used to set up the database for use, comprising the schema and the stored procedures, respectively, and detailed in the following sections. The first step is to create a new MySQL database called ‘statsdb’ and grant a user read-write access to it, e.g. a new ’statsdb’ user with a suitable password, e.g. ‘statsdb’: mysql > CREATE DATABASE statsdb ; mysql > USE statsdb; mysql > GRANT ALL ON ‘statsdb‘.* TO ’statsdb’@’localhost’; mysql > GRANT ALL ON ‘statsdb‘.* TO ’statsdb’@’localhost’ IDENTIFIED BY ’statsdb’; The two SQL files are then imported into the database as follows: $ mysql -D statsdb < $ mysql -D statsdb < -u statsdb -p \\ statsdb_schema . sql -u statsdb -p \\ stored-procedures . sql Page 3 of 15 F1000Research 2013, 2:248 Last updated: 27 DEC 2013 This will populate the ‘statsdb’ database with the tables and procedures required. Testing a successfully installed database can be undertaken by running the FastQC parser on the supplied example data, as follows: $ cd Perl $ perl parse_fastqc . pl \\ -i examples / metadata_test.txt \\ -d examples / template_db.txt This will result in data being inserted into the database. In order to revert back to an empty state, reimport the schema SQL as detatiled previously. analysis_property holds general information about the analysis and the run from which it originated. The values contained within this table are populated directly from a user-specified tab-delimited table of property headings and respective values, i.e. the RunTable object (see ’Parsers’ below). The following properties are used to define common denominators across platforms and analyses: • tool - the name of the tool that was used to undertake the analysis (for example, FastQC, PRINSEQ). • encoding - the encoding of the input, for example ‘Illumina 1.5’, ‘fasta+qual’. • chemistry - a short name for the chemistry or type of experiment run. Database design The StatsDB database is designed to be flexible and to hold virtually any type of QC analysis. Figure 2 illustrates the database schema. The database is normalised to the third normal form (3NF) and has stored procedures and views to facilitate consistent access to the stored information. The tables in the core of the database are as follows: • instrument - the ID of the instrument. analysis holds the ID and timestamp of when the analysis was recorded. • sample_name - the name of the sample as assigned during the library construction. • s oftware - the basecaller software or software version of the instrument. • t ype - type of experiment, for example ‘RNA-Seq’, ‘WGS’. • p air - if the experiment is paired end or mate pair, then 1 if the first read or 2 if the second read. Figure 2. StatsDB database schema. Page 4 of 15 F1000Research 2013, 2:248 Last updated: 27 DEC 2013 • lane - the lane or flowcell of the instrument. • r un - the name of the run, as given by the instrument. • barcode - if the sample is multiplexed, the adaptor barcode of the sample, for example ‘ACCTTG’. analysis_value is used to store the properties that can be represented as a value for the whole run, e.g. overrepresented sequences, counts of multiplexed tags. per_position_value stores values related to a absolute position that is never grouped, such as counts of how many times a certain quality is represented. per_partition_value is similar to per_position_value, but allows grouping by some range or factor. value_type is an auxiliary table that holds descriptions for the values and the scope of the value. type_scope is an auxiliary table defining the scope relevant to the analysis to group the values consistently. Currently, the following are the scopes supported by StatsDB. • analysis - global values for the analysis, for example ‘Total GC content’. • base_partition - values of summaries per base, allowing grouping of ranges, for example quality mean per position. • sequence_cumulative - for cumulative counts, such as quality scores or read counts. In addition to the tables, StatsDB has three auxiliary views, used to facilitate complex queries: property transposes the analysis_property table, transforming the row values to columns. run merges the corresponding values from property, according to the run. latest_run selects the latest run from the run view, so if an analysis has been run more than once, only the latest results are stored. Stored procedures Most of the functionality of StatsDB is embedded directly in the database as views and stored procedures. This enables it to have lightweight APIs which behave consistently across languages and means that the API can easily be ported to other languages should the implementation require it. The following stored procedures are used by the APIs to query the database: list_runs will list all available runs. list_selectable_properties will list the properties that can be used as queries. list_selectable_values_from_property will list the values for a given property. list_summary_per_scope will return the descriptions present for a given scope. This is useful to know if a value_type is already present or not, before trying to insert it again. The following stored procedures are used to generate reports. To make queries, the common arguments to specify the run or runs to group are: instrument_in, run_in, lane_in, pair_in and barcode. The arguments are optional and if more than one analysis meets the query criteria, a summary is produced. This can be used, for example, to query the quality of a given lane and use this information to find systematic issues. general_summaries_for_run returns a summary of all the values global to the analysis. summary_per_position_for_run returns all the values queried from the per_partition_value table. summary_value_with_comment returns the summary values with a descriptive text, if it was present as a note for a value. For example, this can be used to retrieve further description of the overrepresented sequences in a FastQC report. API The StatsDB framework provides two APIs, one in the Perl language and the other in Java, both of which offer the same functionality. They call the stored procedures and provide a sufficient layer of abstraction such that parsers and consumers do not need to access the stored procedures directly. Therefore, the typical method of accessing the data held within StatsDB is through the following APIs. Perl API Before using the Perl API, a connection to the database has to be created as defined by the Perl DBI API12. A template for the configuration file is provided in Perl/examples/template_db.txt, and the values need to match those used in the database installation instruc tions above: db_string dbi:mysql:statsdb;host=localhost db_user statsdb db_password statsdb The Perl API comprises modules to import analysis information to the StatsDB database, as well as functions to query the database. The abstraction of the database is contained in the QCAnalysis module, which is used to add an analysis to the database. It automatically fills the missing types of value in the database, so it is not necessary to have a comprehensive list of types of analysis that are going to be stored a priori. However, a parser needs to define valid types for the QCAnalysis object, i.e. value_type, and to which scope they should be assigned, i.e. the type_scope, as described in the Database design section above, and in the following code: // function signature $analysis->add_valid_type ($value_type, $value_scope); // examples $analysis->add_valid_type ("general_gc_content", "analysis"); Page 5 of 15 F1000Research 2013, 2:248 Last updated: 27 DEC 2013 $analysis->add_valid_type ("gc_content_percentage", "base_partition"); $analysis->add_valid_type ("gc_content_count", "sequence_cumulative"); $analysis->add_valid_type ("base_content_c", "base_partition"); After defining the valid values and scopes, the properties of the analysis should be added. The following example adds a ‘tool’ property with a ‘FastQC’ value, to represent a FastQC analysis property type: $analysis->add_property ("tool","FastQC"); Global values are supported in StatsDB to represent generalised properties that are permissible across analyses. To add global values to the analysis, the add_general_value function is used. General values can have an optional description. When the description is present, and if the value is new to the database, the description is added. If the value is already present in the database, the description is ignored. This is by design and allows for consistency across analyses: // function signature $analysis->add_general_value ($key, $value, $description); // examples $analysis->add_general_value ( "ACCTGATAT", 10, "over-representedcommonprimerinlibraryA" ); $analysis->add_general_value ( "average_length", 100 ); To add values with a discrete count the add_position_value function is called. The following example specifies that 15,000 reads in the analysis had a quality score of 30: // function signature $analysis->add_position_value ($position, $key, $value); $analysis->add_position_value( 30, "quality_score_count", 15000 ); Finally, to add values that can be grouped in ranges the function add_partition_value is called. A range is an array specifying the first and last position (inclusive). The following example inserts a quality mean from position 10 to position 14 (5 values) of the run: // function signature $analysis->add_partition_value ($range, $key, $value); $analysis->add_partition_value ( [10-14], "quality_mean", 38.7 ); An auxiliary function, parse_range, is provided to convert a string representation of a range into an array type. If a single string value is provided, it returns an array with the value repeated, representing a partition of size 1. If a range string is passed, it returns an array with the positions as needed by add_partition_value: $analysis->parse_range {"10"} -> [10,10] $analysis->parse_range {"10-14"} -> [10,14] Once the QC Analysis object is constructed with all the required values, it can be inserted to the database with db- > insert _analysis ($ analysis). To query the database from the Perl API, the Reports.pm module is used. To allow flexibility in the querying and to be able to get summaries at different granularities (barcode, lane, pair, etc) the convention is that all the queries accept as an argument a properties hash comprising the required key-value pairs to build the query. A constant, declared in the Reports.pm module, represents the set of controlled platform-agnostic keys and is defined as follows: use constant { ENCODING => "encoding", CHEMISTRY => "chemistry", INSTRUMENT => "instrument", SOFTWARE_ON_INSTRUMENT => "softwareOnInstrument" , TYPE_OF_EXPERIMENT => "typeOfExperiment", PAIR => "pair", SAMPLE_NAME => "sampleName", LANE => "lane", BARCODE => "barcode", RUN => "run" }; An example script to query the different types of tables is provided with the StatsDB framework, i.e. examples/example_consumer.pl. Java API The Java API is supplied as a Maven13 project to ease building and testing. For convenience, a pre-built JAR file is available to use in existing Java projects by simply downloading the JAR file from the TGAC Maven repository14, or including the following repository and dependency Maven declarations in your pom.xml build descriptor to download the artifact: Page 6 of 15 F1000Research 2013, 2:248 Last updated: 27 DEC 2013 <repository> <id>tgac-repo</id> <name>TGAC Maven Repository</name> <url>https://repos.tgac.ac.uk/maven/repo</url> </repository> ... <dependency> <groupId>uk.ac.tgac.statsdb</groupId> <artifactId>statsdb-api</artifactId> <version>1.1</version> </dependency> The API is built using the standard Maven command: mvn clean install This will compile the source code and provide a library JAR comprising the API, but does not attempt the StatsDB database-level tests. These unit tests make sure the database is accessible, that the schema is correct, and that the API calls available work correctly. To turn these tests on, supply the relevant database connection properties in Java/statsdb – api/src/test/resources/test.statsdb.properties: statsdb.driver=com.mysql.jdbc.Driver statsdb.url=jdbc:mysql://localhost:3306/statsdb statsdb.username=statsdb statsdb.password=statsdb Then use the following profile activation when building the library: mvn clean install -DdbTests=true An option to build an executable JAR file is available which includes a dedicated command-line application that allows API access for loading and querying a StatsDB database. To enable this option, use the following build command: mvn clean install -Donejar=true The resulting JAR can then be executed by the user. This helper application requires either an input file representing the analysis report to be parsed, e.g. a f astqc_data.txt file, or a StatsDB metadata table file (see Table 1) comprising multiple analysis reports. The helper application will then process the analysis file(s) and load the data into StatsDB. Supplying the –t option allows testing of a given parser without writing any information into the database. $ java -jar statsdb-api.one-jar.jar -h usage: statsdb.one-jar.jar -f <file> Use given input report file -h Print this help -m <file> Process multiple reports using a StatsDB metadata table file -p <fastqc,other> Use specified parser type -r <run> Associate the report with a given run name -t Test mode. Doesn’t write anything to the database -v Verbose mode. Use if you like lots of tasty output INFO [main] – No parser type specified. Using FASTQC as the default report type ERROR [main] - No input metadata or report file specified. Before using the Java API library, a connection to the database has to be created in a similar way to the Perl API. This file needs to be called statsdb.properties, needs to reside on the classpath (in the case of the executable JAR, this would simply be in the same directory, for example), and contains the same fields as the test properties example above. Finally, as with the Perl API, the values need to match those used in the database installation instructions above. In terms of building and initiating queries within custom applications, the Java API mirrors the Perl API whereby the abstraction of the database is contained in the QCAnalysis class. Similarly, the Reports class is used to query the database from the Java API, and the query key granularity is represented as a Map < RunProperty, String > comprising the required key-value pairs to build the query. For convenience, the API tolerates missing values and, in such a case, the average is returned by default. When explicitly specifying these values, in the same way as the Perl API constants, the RunProperty enumeration represents the set of controlled platformagnostic keys. The following is a minimal example to query each of the different types of tables. Note that the first step is to construct a map of the values to query. In this particular example, the barcode is explicitly specified, i.e. "ACCGTT". If this was to be omitted, a general summary for lane 1 would be returned instead of a specific sample, allowing for an overview assessment of the run: Table 1. Example fields in an analysis metadata table file. Field Example TYPE_OF_EXPERIMENT NGS PATH_TO_ANALYSIS /path/to/fastqc_data.txt ANALYSIS_TYPE FastQC INSTRUMENT MISEQ-1 CHEMISTRY_VERSION TRUSEQ_SBS_V3 SOFTWARE_ON_INSTRUMENT_ VERSION MCS_2.2.0_RTA_1.17.28.0 CASAVA_VERSION 1.8.2 RUN_FOLDER /path/to/run_folder SAMPLE_NAME TEST_SAMPLE LANE 1 BARCODE AAACTGA PAIR 1 RUN RUN_NAME Page 7 of 15 F1000Research 2013, 2:248 Last updated: 27 DEC 2013 // Setup the query arguments Map <RunProperty, String> properties = new HashMap<>(); properties.put (RunProperty.lane, "1"); properties.put (RunProperty.barcode, "ACCGTT"); properties.put (RunProperty.run, "RUN-123"); // Get summary values of the run ReportTable table = r.getAverageValues ( properties ); log.info (table.toJSON()); // Get the quality mean of the selected run across partitions table = r.getPerPartitionValues ( "quality_mean", properties ); log.info (table.toCSV()); // Get the quality score count per base position table = r.getPerPositionValues ( "quality_score_count", properties ); log.info (table.toCSV()); All javadoc for the StatsDB Java API can be found at https://repos. tgac.ac.uk/statsdb/javadoc/latest/. Parsers StatsDB parsers are small programs, usually scripts, which take the output of a QC tool and use one of the APIs to store the data. Parsers for StatsDB should have the same structure, e.g. adhering to the contractual Java interfaces, and only ever need implement the specific parsing code for the analysis to be added. Both parsing APIs require analyses to be defined in an analysis metadata table (see Table 1). This is represented as a simple tab-delimited flat file describing the list of analysis fields and values. This file should supply one analysis per line, for example a path to a FastQC data file and related properties. Every new parser should conform to the contract shown in Figure 3. To write a parser it is not necessary to know the schema of the database or to modify the contents directly. StatsDB conveniently provides the database access objects within its APIs which then connect to the database. The Wrapper object represents a managerial entity that calls a SpecificParser to actually undertake the parsing, but also manages connections to the underlying StatsDB DB object. The Wrapper should open a connection to the database, then create a RunTable object to contain a list of runs, its properties and a path to the analysis to be stored, as described by the metadata table. The path Figure 3. StatsDB parser interaction diagram, using the Perl API. To add new parsers, only the SpecificParser has to be written. The rest of the classes abstract the interaction with the database and ensure the consistency of the data. The Java API utilises different class and method names but employs the same generalised interactions. Page 8 of 15 F1000Research 2013, 2:248 Last updated: 27 DEC 2013 Figure 4. Example of the execution of a query to the database. The client only needs to be aware of the Java/Perl API and StatsDB will format the result in CSV or JSON, so that the client can display the summary. is then used on the call to the SpecificParser, an object that creates an Analysis object with the properties from the run and the values in the file with the analysis. The Analysis object holds the values in the categories described above. Once the parsing of the file is complete, the parser forwards the Analysis object to the DB object, which inserts the properties and values of the analysis. Finally, the Wrapper object should close the connection in the DB object. An example Wrapper application would be implemented in Perl as follows: # Opens a connection to the database my $db = QCAnalysis::DB->new(); $db->connect ($config); # Reads the metadata table file (Figure 3) my @analysis = QCAnalysis::RunTable->parse_file ( $input); # Iterates over each analysis to add foreach (@analysis){ # Gets the path to the file # The argument is the column name my $fast_qc_file = $_->get_property (“ path_to_counts”); # Executes specific TagCount parser QCAnalysis::TagCount->parse_file ($fast_qc_file, $_); # Inserts the analysis to the database $db->insert_analysis ($_); } # Closes the connection to the database. $db->disconnect (); A concrete Wrapper and SpecificParser implementation that interrogates FastQC output can be found in Perl/parse_ fastqc.pl and Page 9 of 15 F1000Research 2013, 2:248 Last updated: 27 DEC 2013 Perl/QCAnalysis/FastQC.pm in the Github repository. Similarly, the Java version of a SpecificParser can be found in FastQCReportParser.java. Examples of wrapper construction of the parser and analysis objects can be seen in the StatsDBApp.java and TestFastQCParser.java classes. Consumers Consumers are programs that process StatsDB data through the API. StatsDB provides a comprehensive API to query for summaries or results of an analysis related to a specific run. The client needs to know if the value is global to the run, per position, or per partition in order to select the relevant method to call. To provide a consistent interface, all the queries are summaries and the following properties can be used as selecting criteria: encoding, chemistry, instrument, softwareOnInstrument, typeOf Experiment, pair, sampleName, lane, barcode, run. If all the properties are specified, only the latest corresponding analysis for the run is returned. This approach allows consumers to make complex comparative analyses. The Perl API examples/example_consumer.pl script provides example calls to the Reports.pm reporting module, which forms the basis for any consumer implementation. Similarly, to facilitate these complex queries in the Java API, we provide a ReportsDecorator class which contains specific methods to interact with each report, but also encapsulates related reports. One example is getPerPositionBaseContent() which produces a matrix of the base content of each base per position, rather than producing individual queries for each base. Figure 4 shows the general approach to query the database. The consumers call the corresponding summary or the report decorator. The queried properties are then used to call the stored procedures. StatsDB reads the result set to produce an internal representation of the table, which can then be used directly by the consumer, or can be formatted as CSV or JSON. For further details and the available methods, the inline perldoc or javadoc documentation provides a comprehensive description of each method. Reporting tools such as FastQC produce informative plots to visualise run metrics. StatsDB supplies example plots based on those produced by FastQC, written using the d3.js Javascript library15, to demonstrate downstream processing and representation of consumer-generated StatsDB JSON. In this way, developers can easily integrate StatsDB plots on their own web pages. A dedicated helper class to generate a set of required JSON fragments is supplied, i.e. D3PlotConsumer.java, and downstream Javascript and HTML that renders the JSON fragments can also be found in the GitHub repository in the Web directory. Examples of interactive plots generated from FastQC per-base quality and per-base GC content can be seen in Figure 6. Use case At TGAC, we use StatsDB as part of our Primary Analysis Pipeline. Each Illumina run sequenced at TGAC, both with HiSeq and MiSeq instruments, passes through this pipeline. Two important steps in the process are QC analysis with FastQC and contamination Figure 5. StatsDB Reporter allows overlay plots of QC data across instruments and runs. Page 10 of 15 F1000Research 2013, 2:248 Last updated: 27 DEC 2013 analysis using an in-house kmer-based screening tool. The output of both of these tools is parsed using two separate Perl scripts provided as part of the StatsDB package, and loaded into StatsDB. As well as these QC output, we load details of the instrument, chemistry version, RTA version and Casava version into StatsDB. Our PacBio primary analysis pipeline is still under development, but this currently includes using FastQC to analyse FASTQ files output as part of the process. We are also working on parsers for the sts.csv files that are produced by the instrument. With StatsDB, it is perfectly A C G possible to mix data from different platforms and different tools into one database. When querying the data, the consumer application can make the decision about what data comparisons are meaningful. We currently access data stored in StatsDB using two consumers: TGAC’s open-source LIMS, MISO, and the prototype StatsDB Reporter tool. Using the MISO web-based interface, it is possible to access StatsDB information and produce graph plots of FastQC data, which are based on the d3.js consumer examples supplied with the framework (Figure 6). StatsDB Reporter allows selection T 100% 90% 80% 70% 60% 50% 40% 30% 20% 10% 0% 250 230 240 220 210 190 200 180 170 160 150 140 130 110 120 90 100 80 70 60 50 45 40 35 30 25 20 15 9 8 7 6 5 4 3 2 1 Percentage 10 Base Position Figure 6. Examples of d3.js plots, generated from FastQC data parsed into StatsDB. Page 11 of 15 F1000Research 2013, 2:248 Last updated: 27 DEC 2013 of runs by instrument, lane, run, sample or barcode and provides comparison of data across runs (Figure 5). Conclusions Many software tools exist for the generation of run quality statistics and FastQC is possibly the most notable example. However, until now, there has been no easy solution to the problem of storage and analysis of historical run metadata and statistics. StatsDB has been designed to address this problem and offers a flexible, easy to use, platform-agnostic and tool-independent framework for consolidated access to run metrics. Software details Homepage: http://www.tgac.ac.uk/tools-resources/ Source code: https://github.com/TGAC/statsdb and 10.5281/zenodo.7534 Licence: GPL v3. Author contributions MC initiated the project, which RD now leads. RHRG designed the database, implemented the Perl API and, with RD, implemented the Java API. RML and DW wrote parsers and consumers to use the API. AT developed the d3.js plots. RML, RHRG, RD, DW and AT all contributed to the manuscript. Installation of StatsDB and integration with existing analysis pipelines is achieved with minimal effort. To perform data entry into StatsDB, a parser is included for the popular FastQC tool, and parsers for other tools can be written in less than a day by a competent programmer or scripter. Similarly, command line tools are provided in both Perl and Java to load parsed data into StatsDB. Competing interests The authors declare that there are no competing interests. To perform downstream analysis and visualisation of data held within StatsDB, reporting helper entities are provided. Furthermore, an example consumer tool is supplied in the form of the StatsDB Reporter application which currently exists in prototype form but a mature version will be available in due course from the GitHub repository for StatsDB, as well as parsers for other tools (for example, PacBio sts files). The funders had no role in study design, data collection and analysis, decision to publish, or preparation of the manuscript. Grant information The development of StatsDB has been funded by a Biotechnology and Biological Sciences Research Council (BBSRC) National Capability Grant at TGAC. Acknowledgements We are grateful to the Library Preparation and Sequencing Operations teams at TGAC for generating the data that has been used to test StatsDB. References 1. Miller MR, Dunham JP, Amores A, et al.: Rapid and cost-effective polymorphism identi.cation and genotyping using restriction site associated DNA (RAD) markers. Genome Res. 2007; 17(2): 240–248. PubMed Abstract | Publisher Full Text | Free Full Text 8. Lassmann T, Hayashizaki Y, Daub CO: Samstat: monitoring biases in next generation sequencing data. Bioinformatics. 2011; 27(1): 130–131. PubMed Abstract | Publisher Full Text | Free Full Text 2. Baird NA, Etter PD, Atwood TS, et al.: Rapid SNP discovery and genetic mapping using sequenced RAD markers. PLoS One. 2008; 3(10): e3376. PubMed Abstract | Publisher Full Text | Free Full Text 9. Ashby M, Lee L: stsPlots. Reference Source 10. 3. Andrews S: FastQC: A quality control tool for high throughput sequence data. Reference Source Skelly T: PacBio Exploratory Data Analysis. Reference Source 11. 4. Yang X, Liu D, Liu F, et al.: Htqc: a fast quality control toolkit for Illumina sequencing data. BMC Bioinformatics. 2013; 14: 33. PubMed Abstract | Publisher Full Text | Free Full Text Davey RP, Bian X, Thanki A, et al.: MISO: An open-source LIMS for small-to-large scale sequencing centres. Reference Source 12. 5. Schmieder R, Edwards R: Quality control and preprocessing of metagenomic datasets. Bioinformatics. 2011; 27(6): 863–864. PubMed Abstract | Publisher Full Text | Free Full Text Perl DBI. Perl DBI. Reference Source 13. The Apache Software Foundation. Maven. Reference Source 6. Dai M, Thompson RC, Maher C, et al.: Ngsqc: cross-platform quality analysis pipeline for deep sequencing data. BMC Genomics. 2010; 11(Suppl 4): S7. PubMed Abstract | Publisher Full Text | Free Full Text 14. The Genome Analysis Centre. TGAC Maven Repository. Reference Source 7. Buffalo V: QRQC - quick read quality control. Reference Source 15. D3.js - Data-Driven Documents. 2012. Reference Source Page 12 of 15 F1000Research 2013, 2:248 Last updated: 27 DEC 2013 Current Referee Status: Referee Responses for Version 1 Anuj Kumar Department of Molecular, Cellular & Developmental Biology, University of Michigan, Ann Arbor, MI, USA Approved: 27 December 2013 Referee Report: 27 December 2013 The manuscript by Ramirez-Gonzalez et al. presents a software package to store and analyze metrics from next-generation sequencing runs. The open-source software package, StatsDB, stores statistics from sequencing reactions in a MySQL database, and APIs provide means to access and analyze the data. The StatsDB package facilitates easy querying, particularly across multiple fields from respective tables in the database. StatsDB provides modules that can be used in conjunction with FastQC as well as with other tools suited for the analysis of sequence data. From the perspective of a wet-lab genomicist, the StatsDB package seems to be a useful tool, and I can certainly see the utility in storing data from the sequencing reactions, particularly for a genome analysis center. I only have a few minor comments. 1. Since FastQC is commonly used for the analysis of sequencing runs, and since the StatsDB package works with FastQC, it would be useful to provide a little more explicit information describing the output/types of data provided by FastQC. Some of these data are presented in the StatsDB schema, but it would be nice to add a bit more detail in this regard (possibly a very simple figure) into the Introduction. 2. I appreciate the use case provided, but I think it would be helpful to provide an additional small example of how the StatsDB package could be useful to an individual lab that uses a moderate level of next-generation sequencing in their research (as opposed to a genome center). Possibly, a summary of the StatsDB Reporter application would suffice. 3. It would be helpful to add a few sentences to the Introduction to indicate how other sequencing centers, etc. store output from FastQC or other similar tools. This does not have to be an extensive overview. I have read this submission. I believe that I have an appropriate level of expertise to confirm that it is of an acceptable scientific standard. Competing Interests: No competing interests were disclosed. Cyriac Kandoth The Genome Institute, Washington University, St Louis, MO, USA Approved with reservations: 16 December 2013 F1000Research Page 13 of 15 F1000Research 2013, 2:248 Last updated: 27 DEC 2013 Referee Report: 16 December 2013 The authors have developed a tool that is well documented, open sourced, and version controlled. The first two thirds of the article read like a user's manual, which is appropriate in a technical article, but not in its entirety. The neatly organized code snippets and commentary will help a programmer who is considering using the API. However, to encourage them to use it, the Use case section must be expanded with figures and performance metrics. I have added more details in the comments below. Major comments: 1. Title - "platform-agnostic storage and understanding..." - The word "understanding" seems either ambiguous or inappropriate since StatsDB is just the facilitator for interpreting/visualizing the run metrics. Consider a title like "StatsDB: platform-agnostic storage schema and API for interpreting next-generation sequencing run metrics" 2. Page 4, Database design - The relationship between the analysis table and the auxiliary views is unclear. For example, the analysis table stores a unique ID and timestamp of when an analysis run was performed. But the latest_run view mentions that an analysis can be run more than once. Please clarify. 3. Page 10, Use case - Add a figure with a flowchart showing the TGAC pipeline that is explained in the text. It is critical to show how StatsDB plugs into a standard analysis pipeline. 4. For the source code, an LGPL license might be more appropriate than GPL because StatsDB is an API, rather than a standalone tool in a workflow. LGPL would also allow parsers/consumers for manufacturer-supplied metrics. Minor comments: 1. Page 3, Database installation - The code snippets show file names with accidental whitespace. Specifically: statsdb_schema.sql, stored_procedures.sql, and parse_fastqc.pl 2. Page 3, Introduction - "With this data heterogeneity and abundance, comes a..." - missing comma. 3. Page 5, Database design - How would you store metrics that depend on genomic positions or ranges? e.g targeted sequencing coverage. If tables per_position_value and per_partition_value stored values based on genomic positions or ranges, it would also depend on which reference sequence build (e.g. NCBI36, GRCh37) was in use for that analysis. Would we define that build as a value_type? And in the stored procedures used by the APIs, how can we handle a mix of different reference builds used across runs? 4. Page 7, Java API - accidental whitespace in filename fastqc_data.txt I have read this submission. I believe that I have an appropriate level of expertise to confirm that it is of an acceptable scientific standard, however I have significant reservations, as outlined above. Competing Interests: No competing interests were disclosed. Mick Watson F1000Research Page 14 of 15 F1000Research 2013, 2:248 Last updated: 27 DEC 2013 Mick Watson ARK-Genomics, University of Edinburgh, Edinburgh, UK Approved: 10 December 2013 Referee Report: 10 December 2013 The article is well written and describes a tool which will be very useful to the community. I only have a few minor issues: 1. Throughout I felt that the terms used were confusing: "analysis" and "run" for example. These can take on multiple meanings in sequencing (for example, what the SRA calls a run is not what I call a run). I feel these terms need a better definition when they are first introduced, with examples where appropriate. 2. Is it valid to still use the term "short-read" sequencers? 3. There is a lot of technical information about the design, database and APIs, but only a single example (using Illumina data) at the end; examples using PacBio and Ion Torrent data would show the true flexibility of the tool. I have read this submission. I believe that I have an appropriate level of expertise to confirm that it is of an acceptable scientific standard. Competing Interests: No competing interests were disclosed. F1000Research Page 15 of 15