1
Potential Air Contaminants and Noise Levels Generated by
the Kodak NexPress 2500 Digital Production Color Press:
A Study of its Emissions of Respirable Dust, Ultrafine Particulates,
Volatile Organic Compounds, Ozone, and Occupational Noise Exposure
by Federico Leal
A thesis submitted in partial fulfillment of the requirements
for the degree of Master of Science
in the School of Print Media
in the College of Imaging Arts and Sciences
of the Rochester Institute of Technology
May 2007
Primary Thesis Advisor: Dr. Scott Williams
Secondary Thesis Advisor: Dr. Sandra Rothenberg
i
School of Print Media
Rochester Institute of Technology
Rochester, New York
Certificate of Approval
Potential Air Contaminants and Noise Levels Generated by
the Kodak NexPress 2500 Digital Production Color Press:
A Study of its Emissions of Respirable Dust, Ultrafine Particulates,
Volatile Organic Compounds, Ozone, and Occupational Noise Exposure
This is to certify that the Master’s Thesis of
Federico Leal
Has been approved by the Thesis Committee as satisfactory
for the thesis requirement for the Master of Science degree
at the convocation of
May 2007
Thesis Committee:
Primary Thesis Advisor
Secondary Thesis Advisor
Graduate Thesis Coordinator
Graduate Program Coordinator
Chair, School of Print Media
ii
Thesis Author Permission Statement
Potential Air Contaminants and Noise Levels Generated by
the Kodak NexPress 2500 Digital Production Color Press:
A Study of its Emissions of Respirable Dust, Ultrafine Particulates,
Volatile Organic Compounds, Ozone, and Occupational Noise Exposure
Author: Federico Leal
Degree: Master of Science
Program: Graduate Print Media
College: Imaging Arts and Sciences
I understand that I must submit a print copy of my thesis or dissertation to the RIT
Archives, per current RIT guidelines for the completion of my degree. I hereby grant to
the Rochester Institute of Technology and its agents the non-exclusive license to archive
and make accessible my thesis in whole or in part in all forms of media in perpetuity.
I retain all other ownership rights to the copyright of the thesis or dissertation. I also
retain the right to use in future works (such as articles or books) all or part of this thesis.
Print Reproduction Permission Granted
I, Federico Leal, hereby grant permission to the Rochester Institute of Technology to
reproduce my printed thesis in whole or in part. Any reproduction will not be for
commercial use or profit.
Signature of Author: __________________________________ Date: ____________
Inclusion in the RIT Digital Media Library Electronic Thesis & Dissertation Archive
I, Federico Leal, additionally grant to the Rochester Institute of Technology Digital Media
Library (RIT DML) the non-exclusive license to archive and provide electronic access to
my thesis in whole or in part in all forms of media in perpetuity.
I understand that my work, in addition to its bibliographic record and abstract, will be
available to the worldwide community of scholars and researchers through the RIT DML.
I retain all other ownership rights to the copyright of the thesis. I also retain the right to
use in future works (such as articles or books) all or part of this thesis. I am aware that
the Rochester Institute of Technology does not require registration of copyright for
ETDs.
I hereby certify that, if appropriate, I have obtained and attached written permission
statements from the owners of each third party copyrighted matter to be included in my
thesis. I certify that the version I submitted is the same as that approved by my
committee.
Signature of Author: __________________________________ Date: ____________
iii
In Loving Memory of
Agustina Arrieta Leal
(1924-2006)
iv
Acknowledgements
The following Kodak managers made this thesis possible: Dr. Arun Chowdry,
Cavan Kelsey, Dr. Thomas Tombs, John Heyer, and James Balmer. Their cooperation
and generosity always exceeded my expectations.
This thesis owes to the timely advice and assistance of Dr. Jennifer Schneider,
Dr. Mary Anne Evans, Joshua Goldowitz, Bill Garno, Jeremy Vanslette, Brian Waltz,
and Barbara Giordano.
Many thanks, of course, to my thesis advisors, Dr. Scott Williams, and Dr. Sandra
Rothenberg, and to the Harold W. Gegenheimer Graduate Research Fellowship.
David Hartmann deserves special recognition and all my gratitude.
v
Table of Contents
Abstract.........................................................................................................................xii
Chapter 1 Introduction.....................................................................................................1
Topic Statement.................................................................................................................................................1
Significance of the Topic ..................................................................................................................................2
Reasons for Interest...........................................................................................................................................2
Glossary of Frequently Used Terms ................................................................................................................3
Chapter 2 Applicable Mathematical Models ....................................................................5
Chapter 3 Review of Literature......................................................................................10
The Ascent of Digital Printing ...................................................................................................................... 10
The Printing Industry’s Environmental, Health and Safety Impacts .......................................................... 11
Conventional Printing Technologies........................................................................................................ 11
Digital Printing Technologies................................................................................................................... 14
Introduction to Indoor Air Quality and Applicable Regulations in the U.S............................................... 17
The Kadam Thesis.......................................................................................................................................... 20
The NexPress 2500 and its Environmental Footprint .................................................................................. 25
Chapter 4 The Research Statement ................................................................................29
Chapter 5 Methodology .................................................................................................31
The Checklist Used During the Print Runs................................................................................................... 32
The Digital Printing Device........................................................................................................................... 33
Choice of the Paper ........................................................................................................................................ 33
Choice of the Print Target.............................................................................................................................. 34
vi
Measurement of Ventilation Parameters....................................................................................................... 35
Measurement of Respirable Dust .................................................................................................................. 38
Measurement of Ultrafine Particulates ......................................................................................................... 41
Measurement of Total Dust Concentration................................................................................................... 44
Measurement of Volatile Organic Compounds............................................................................................ 46
Measurement of Ozone Concentration ......................................................................................................... 49
Measurement of Noise Level......................................................................................................................... 52
Limitations of the Methodology.................................................................................................................... 53
Chapter 6 Analysis of Experimental Results ..................................................................54
Carbon Dioxide, Relative Humidity, and Temperature ............................................................................... 55
Respirable Dust, Ultrafine Particulates, and Total Dust .............................................................................. 62
Volatile Organic Compounds ........................................................................................................................ 69
Ozone Emissions ............................................................................................................................................ 71
Noise Levels ................................................................................................................................................... 74
Evaluation of the Hypotheses and Comparison to the Kadam Results....................................................... 81
Chapter 7 Conclusions...................................................................................................84
Summary ......................................................................................................................................................... 84
Implications of the Findings .......................................................................................................................... 89
Agenda for Further Research......................................................................................................................... 90
Bibliography .................................................................................................................92
vii
List of Tables
Table 1: Glossary of Frequently Used Terms...................................................................3
Table 2: The Principles of the Rule of Thumb Method.....................................................6
Table 3: Sample Application of the Rule of Thumb Method ............................................7
Table 4: OSHA PEL and ACGIH TLV for Noise Exposure.............................................8
Table 5: Comparison of Environmental and Occupational Aspects Studied by Kadam in
2004 and by Leal in 2007.......................................................................................23
Table 6: Comparison of Results of the Kadam Study and the Present Study...................82
viii
List of Figures
Figure 1: The Sheetfed Offset Lithographic Process on the Heidelberg Speedmaster 74
(Source: Kipphan, 2001)........................................................................................20
Figure 2: The Wet Ink Electrophotographic Process on the HP Indigo 3000 (Source:
Printing Applications Laboratory, Rochester Institute of Technology, 2007)..........21
Figure 3: Cross-section of the NexPress (Source: Kodak G.C.G., 2007).........................26
Figure 4: Schematic of the NexPress Imaging Module (Source: Ng, 2003) ....................27
Figure 5: Screenshot of the Digital File GATF_Sample_tagged_baby.pdf (Source:
Kodak, 2006).........................................................................................................34
Figure 6: The Q-Trak Indoor Air Quality Monitor and Its Probe (far right)....................35
Figure 7: The 8520 DustTrak Aerosol Monitor ..............................................................38
Figure 8: The 8525 P-Trak Ultrafine Particulate Counter ...............................................41
Figure 9: ESCORT ELF Air Pump and Air Cassettes ....................................................44
Figure 10: The TVA-1000B Organic Vapor Analyzer and Its Probe (above it) ..............46
Figure 11: The Dasibi 1008 UV Photometric Ozone Analyzer and the Primary Standard
..............................................................................................................................49
Figure 12: The CK110 doseBadge Noise Dosimeters and the Reader Unit.....................52
Figure 13: CO2 Readings During the Preliminary (A) and Experiment (B) Runs............55
Figure 14: Relative Humidity During the Preliminary (A) and Experiment (B) Runs .....58
ix
Figure 15: Temperature During Preliminary (A) and Experiment (B) Runs....................60
Figure 16: Respirable Dust Concentrations Detected During the Preliminary (A) and
Experiment (B) Runs .............................................................................................62
Figure 17: Ultrafine Particulates During the Preliminary (A) and Experiment (B) Runs.65
Figure 18: Laboratory Analysis Reports for Milligrams of Total Dust Collected During
the Preliminary (A) and Experiment (B) Runs........................................................67
Figure 19: Calculation of the Concentration of Total Dust During the Preliminary (A) and
Experiment (B) Runs .............................................................................................68
Figure 20: VOC Emissions During the Preliminary (A) and Experiment (B) Runs.........69
Figure 21: Ozone Levels Recorded During the Preliminary (A) and Experiment (B) Runs
..............................................................................................................................71
Figure 22: Sketch of Kodak’s Manitou Demo Room......................................................73
Figure 23: Not-to-scale Sketch of the Distribution of the Stationary Noise Dosimeters ..74
Figure 24: Noise Levels Detected by All Five Dosimeters Around the NexPress ...........75
Figure 25: NexPress Operator’s Noise Exposure Levels During the Experiment Run.....76
Figure 26: Noise Levels Detected at the Operator Station During the Experiment Run ..77
Figure 27: Noise Levels Detected East of the Press........................................................78
Figure 28: Noise Levels Detected North of the Press .....................................................79
Figure 29: Noise Levels Detected West of the Press ......................................................80
x
List of Equations
Equation 1: Formula Used in the Calculation Method......................................................7
Equation 2: Application of the Calculation Method Formula ...........................................8
xi
Abstract
The printing industry is beginning to get acquainted with the environmental
impact of digital printing technologies. This study addressed issues related to the
electrophotographic dry toner printing technology used in the Kodak NexPress 2500
Digital Production Color Press. The importance of these topics will grow as high-speed
variable data printing becomes pervasive, because these printed products will become
widespread, and a greater number of operators will be exposed to these technologies.
Indoor air quality and noise levels generated by the NexPress under normal
operating conditions were studied: ventilation, dust, volatile organic compounds, ozone,
and noise. The results of this study were then compared to a previous study that examined
the environmental impacts of HP Indigo 3000 versus the Heidelberg Speedmaster 74.
All the test results were below the permissible exposure limits of the Occupational
Safety and Health Administration. The NexPress proved environmentally friendlier than
the HP Indigo 3000 and the Heidelberg Speedmaster 74 in all aspects under scrutiny
except for average noise exposure. The results also show that the NexPress emitted
similar gas, aerosol, and noise levels regardless of print run length.
This study highlights the need to develop regulations for ultrafine particulates,
demonstrates how to compare environmental aspects between asymmetric printing
platforms, and delivers a methodology to conduct indoor air quality and noise tests in a
prominent branch of the digital printing industry.
xii
Chapter 1
Introduction
This study is a combination of indoor air quality measurements with a noise level
survey around the NexPress 2500 digital printer while it was running under normal
operating conditions. The following parameters were measured: carbon dioxide levels,
temperature, relative humidity, respirable dust, ultrafine particulates, total dust, volatile
organic compounds, ozone, peak noise, and time-weighed average noise.
Topic Statement
Printers cannot easily replace expensive presses overnight just because the
government determines that they are using harmful chemicals. Therefore, managers of
printing companies must stay one step ahead of the regulators. The problem is that some
printing processes are newer than others. As a consequence, there are processes whose
environmental impact is better documented than others -digital printing is one such case
of little publicly available information. Since it is closely tied to ever-evolving computer
hardware and software, and because not all applications are well suited to this
technology, the printing industry is beginning to understand the environmental impact of
this process. This study was an effort to address some of these environmental issues as
1
they manifest themselves in the dry ink electrophotographic printing technology used in
the Kodak NexPress 2500 Digital Production Color Press.
Significance of the Topic
Awareness of environmental and occupational exposure issues plays an important
role in the selection of environmentally friendly technology. This topic was worthy of
scholarly study because literature dealing with the environmental footprint of digital
printing technologies is scant.
Digital printing devices have the potential to release dust, volatile organic
compounds, and ozone during their operation. These emissions must be kept as low as
possible in order to maintain good indoor air quality conditions and to protect the health
of building occupants and employees (Gullison, 2006). Occupational noise exposure is
another issue that all industries must address under the watchful eye of the U.S.
Occupational Health and Safety Administration (OSHA), through the application of
engineering controls and hearing conservation programs, if necessary.
Reasons for Interest
This topic first caught the author’s attention when Dr. Mary Anne Evans gave a
lecture in the Materials and Processes II course, which is part of the Masters in Print
Media curriculum at RIT. Dr. Evans explained that there is very little information
publicly available on the environmental impact of digital printing, when compared to all
2
the information that is available for lithographic printing. She also stated that printers
rarely try to ascertain the impact that their technologies have on the environment.
In 10 or 20 years, the author will run his family’s printing business in Costa Rica.
There is a limited market for books, magazines, and other products that are printed
conventionally in this small country. Therefore, in time, the company will have to expand
into variable-data digital printing. The author chose the Kodak NexPress 2500 over the
HP Indigo 3000 because the Kadam study (2004), which Dr. Evans referred to, had
already analyzed that particular technology.
Glossary of Frequently Used Terms
Table 1 is a glossary of terms that will be used frequently throughout this
document.
Table 1: Glossary of Frequently Used Terms
Term
Definition in the Context of This Study
Conventional
Printing
Also known as “static printing”. This term refers to traditional
ink-on-paper approaches (offset lithography being the most
common) where every sheet is reproduced from the same image
carrier fixed with the same image (Romano, 2001).
Decibel (dB)
Unit of measurement of sound level; one tenth of a Bel (B)
(OSHA, 2007).
Dry Toner
The marking material that the NexPress uses. It is made up of a
polymer binder, a negative charge agent, and a colorant; it
develops the latent image and it is transferred onto the paper
(NexPress Solutions LLC, 2006).
3
Table 1 (continued): Glossary of Frequently Used Terms
Term
EHS Aspect
Definition in the Context of This Study
An element of an organization’s activities, products, or services
that can interact with the environment, health, or safety of the
employees (Envirowise, 2006).
A printing or copying method that uses an electrical charge to
create an image on a photoconductive surface. Toner is attracted
Electrophotography
to the charged area, then transferred and fused to the paper
(Romano, 2001).
Long Run
An entire printing press operation cycle that requires a relatively
long time for completion due to heavy print load (Kadam, 2004).
In this study, two hours or more was considered a long run.
Particulates
Solid or liquid matter suspended in the air, including nontoxic
materials such as soot, dust, and dirt, and toxic materials such as
lead, asbestos, suspended sulfates, and nitrates (Aerias, 2006).
PEL
Permissible exposure limit; a legal limit established for exposure
of an employee to a substance (OSHA, 2007).
Respirable Dust
Dust that is capable of reaching and penetrating the gas exchange
region of the human lungs (Aerias, 2006).
Short Run
An entire press operation cycle that requires a relatively short
time for its completion (Kadam, 2004). In this study, it was
understood as 30 minutes or less.
TLV
Threshold limit value; it represents conditions under which it is
believed that nearly all workers may be repeatedly exposed day
after day without adverse health effects (ACGIH, 2007).
Ultrafine
Particulates
Particulates smaller than 2.5 micrometers in diameter
(U.S. Environmental Protection Agency, 2007).
Volatile Organic
Compound (VOC)
Any organic compound that participates in atmospheric
photochemical reactions except those specifically excluded
(U.S. Environmental Protection Agency, 2007).
4
Chapter 2
Applicable Mathematical Models
Of the five environmental aspects under scrutiny, as they are treated in this study,
only noise exposure analysis requires understanding of specialized mathematical models.
When calculating the combined noise detected by more than one dosimeter, the methods
used by industrial hygienists are not intuitive; therefore, they are explained in this
section.
The human sense of hearing responds to sound stimuli in a logarithmic manner
(J. Schneider, personal communication, 2007). Logarithmic scales are useful when the
data covers a large range of values, as is the case with the hearing sense. A logarithmic
response helps compress this wide range so that our response to variations in weak
sounds is similar to that in loud sounds (Robertson, 2007).
Logarithmic scales do not operate the same way as linear scales. For example, the
combined noise emitted by two identical and constant 70 decibel (dB) sources is not
140 dB, but is instead 73 dB. In order to make such calculations, industrial hygienists use
one of two methods: the Rule of Thumb Method, and the Calculation Method, as
explained by Stewart (1999) and Berger (1986) respectively. The Rule of Thumb Method
is preferable when five or less dosimeters are involved, and it is favored by the American
Conference of Governmental Industrial Hygienists (ACGIH). The Calculation Method is
5
used by OSHA in all cases, and it is preferable if more than five dosimeters are involved
(J. Schneider, personal communication, 2007).
Consider the average noise levels detected by five different dosimeters arranged
in ascending order: 68.25, 68.58, 70.48, 70.68, and 71.97 dB. After arranging them in this
manner, the Rule of Thumb Method can be used to calculate their combined noise effect.
The principles involved in this method are seen in Table 2.
Table 2: The Principles of the Rule of Thumb Method
Difference in Decibels Between Consecutive
Levels Arranged in Ascending Order
0<Δ<1
2<Δ<4
5<Δ<9
Δ > 10
Number of Decibels to be
Added to the Higher Level
+ 3 dB
+ 2 dB
+ 1 dB
No Addition
If the difference between the first two dosimeters (Δ = 68.58 − 68.25 = 0.33) is
less than one, then according to Table 2, the combined noise effect will be the higher of
the two levels plus three decibels (see the first row of Table 2). This new value (68.58 + 3
= 71.58 dB) is then compared to the following level (70.48 dB) using the rules of
Table 2, and the process is repeated until there are no more dosimeters to compare.
6
The Rule of Thumb Method is explained step by step in Table 3. The average
noise detected by the five dosimeters appears in italic font, and their (single) combined
effect according to the Rule of Thumb Method is shown in bold font.
Table 3: Sample Application of the Rule of Thumb Method
Step
1
2
3
4
Addition of Averages
in Incremental Order
68.25 dB + 68.58 dB = 71.58 dB
71.58 dB + 70.48 dB = 74.58 dB
74.58 dB + 70.68 dB = 76.58 dB
76.58 dB + 71.97 dB = 77.58 dB
Rationale According to Table 2
Δ = 0.3 ⇒ Higher of the two + 3 dB
Δ = 1.1 ⇒ Higher of the two + 3 dB
Δ = 3.9 ⇒ Higher of the two + 2 dB
Δ = 4.6 ⇒ Higher of the two + 1 dB
If the difference between any two sources falls between the ranges specified in
Table 2, for example if Δ = 1.50 dB, then industrial hygienists must use their own
discretion in order to proceed. Decisions such as this are made in Step 2 and Step 4 of
Table 3, and the author’s logic was to err on the side of caution by adding more decibels
(rather than less) to the calculation. This is the reason why this method is not as accurate
as the Calculation Method, in which no subjective decisions are involved.
The second method used by industrial hygienists to calculate the combined sound
pressure level (SPL) detected by multiple dosimeters is the Calculation Method, and it
involves the formula seen in Equation 1.
n
SPLf = 10log("i =110SPLi / 10 )
Equation 1: Formula Used in the Calculation Method
!
7
Equation 2, seen below, results from inputting the noise averages used in Table 3
into Equation 1.
SPLf = 10log(1068.25 / 10 +1068.58 / 10 +1070.48 / 10 +1070.68 / 10 +1071.97 / 10 )
SPLf = 77.2dB
Equation 2: Application of the Calculation Method Formula
!
The result obtained using the Rule of Thumb Method (77.58 dB) is similar to the
total obtained using the Calculation Method (77.2 dB) −this is not a coincidence. The
Rule of Thumb Method was designed by industrial hygienists to produce a similar result
to that of the Calculation Method, but the former can be calculated by hand. When using
the Rule of Thumb Method, the industrial hygienist will not need to use a calculator with
a logarithmic function, as with the Calculation Method.
Finally, OSHA and ACGIH use different limits for time-weighed average noise
exposures, as seen in Table 4. These values are called Permissible Exposure Limits (PEL)
by OSHA, and Threshold Limit Values (TLV) by ACGIH.
Table 4: OSHA PEL and ACGIH TLV for Noise Exposure
Hours of Continuous
Noise Exposure
8.00
4.00
2.00
1.00
0.50
0.25
OSHA TWA
PEL (dB)
90
95
100
105
110
115
8
ACGIH
TLV (dB)
85
88
91
94
97
100
Therefore, according to Table 4, if the operator of a machine was exposed to
77.58 dB during eight continuous hours, this TWA is below the OSHA PEL of 90 dB, as
well as below the ACGIH TLV of 85 dB. This means that the machine used in this
example, whose noise levels were detected by means of five dosimeters, is safe to operate
by OSHA and ACGIH standards, during eight continuous hours without ear protection.
9
Chapter 3
Review of Literature
The Ascent of Digital Printing
The printing industry is undergoing a pivotal change: print volumes are slowly
migrating from conventional offset lithographic printing to digital printing. Lithographic
printing, however, is likely to remain a viable technology in the long term for static, long
run jobs, either as a stand-alone technology or as a component of hybrid print production.
The most recent U.S. Economic Census data (2002) establishes that lithography is by far
the most commonly used printing technology in the United States: 15,620 out of 34,146
printing companies (45%) are conventional, whereas 1,131 out of 34,146 (3.3%) are
strictly digital printing companies. The popularity of digital technology is partially
hindered by the small size and limited investment capital available to many printing
companies. Therefore, conversion from conventional to digital print technologies may be
economically difficult (Romano, 2001).
In the past, printing was all about mass customization, and because the economics
of the process required longer runs, it was necessary to try to reach a mass audience
(Romano, 2001). The new trend, however, is that run lengths are getting shorter. The new
digital technologies will increasingly allow marketers to tailor their messages to ever-
10
smaller consumer niches. Print runs of 2,000 and under accounted for 28% of all volume
in 1998, and Romano predicts that they will represent 47% in 2020 –a remarkable
growth.
With the advancement and proliferation of digital technologies, the printing
industry is looking forward to digital printing as a way to solve some significant technical
and regulatory problems that are currently associated with traditional printing methods
(M.A. Evans, personal communication, 2005). However, issues surrounding the
environment and workplace health and safety do not disappear just because a printing
company is using digital technologies rather than conventional printing processes.
Moreover, digital technology has its own drawbacks that restrict its use for certain
circumstances, such as long print runs, for which conventional technologies are more cost
effective. According to Evans, if printers want to continue to evolve and succeed, it is
essential for them to know and to understand how digital printing compares to traditional
printing technologies in terms of its environmental, health, and safety impacts.
The Printing Industry’s Environmental, Health and Safety Impacts
Conventional Printing Technologies
Twenty years ago the typical printing plant was not a pleasant place to visit:
“fumes from ink and press-cleaning materials were heavy in the air, and one had to shout
to be heard above the noise of the printing presses.” (Bloom, 1999). The industry has
limitations in meeting environmental goals at reasonable costs. When these limits are
11
reached, new technologies have to be developed before further progress can be made.
According to Bloom (1999), it appears that the printing industry is approaching that
threshold now, and we are likely to see even more change in the future as the industry
struggles to balance profitability with environmental concerns. Printing companies often
find it difficult to determine their impact on the environment (Envirowise, 2004), which
is for the most part related to the handling of solvents and other chemicals, emissions to
the atmosphere, effluent from the washing-down process, make-ready, and other
substrate waste. Envirowise does not address digital printing.
Increasingly, companies need to demonstrate that they have good environmental
credentials. Ferris (1995), however, said that environmental marketing can have
unintended negative consequences if not handled carefully because customer concern for
the environment is stronger than ever. Envirowise established in 2004 that it is beneficial
to be “seen to be green” in the eyes of customers, local authorities, government
environmental protection, and local residents. This means being able to demonstrate
through documentary evidence, that the printing company has considered environmental
issues and has taken steps to minimize adverse impacts. These impacts can be divided in
two categories: direct impacts –those over which the printer has control, and indirect
impacts –those over which the printer has influence. The latter are associated with the
operations of material and utility suppliers, as well as product use and disposal. An
environmental aspect is normally considered significant if it is controlled by legislation,
has the potential to cause demonstrable harm to the environment, or is of concern to
interested parties.
12
Printing companies whose environmental policies include waste reduction,
recycling, and proper chemical disposal are realizing considerably reduced operating
costs and improved manufacturing efficiencies (Burke, 1992). Such savings can result in
a competitive pricing advantage, which benefits the supplier and the customer. For
example, R.R. Donnelley & Sons Co. utilizes solvent recovery systems for its gravure
printing operations that reduce chemical waste and save solvents. Some printers are
purchasing pollution control systems and using other minimization techniques to protect
the environment and avoid fines and plant shutdowns (Petersen, 1992). One problem is
that too many printers worry about purchase costs but fail to consider operating or
maintenance fees. Furthermore, modifying equipment to meet new regulations can be as
costly as buying new equipment. In the following paragraphs the reader is presented with
examples of the findings of recent environmental research projects in the industry.
Leung (2005) conducted an indoor air quality assessment in seven printing plants.
His objective was to understand the effect of volatile organic compound (VOC)
emissions on indoor air quality and to develop effective mitigation measures to protect
workers. VOCs are carbon-containing chemicals that evaporate easily at room
temperature -for this reason they are an indoor air concern. The measurements showed
that, although a variety of VOCs were presented in the indoor air, none of them were
close to the occupational exposure limit. However, short-term personal exposure to total
VOCs was very high when a press operator cleaned the blanket and ink rollers.
Therefore, the occupational health risk was mainly due to repeated short-term exposures
during intermittent VOC-emitting procedures, rather than to long-term exposure.
13
Wadden (1995) determined emission rates during production for a sheetfed offset
printing shop by combining the measured concentrations and ventilation rates with mass
balance models that characterized the printing space. It was estimated that this typical
small printing facility was likely to release one to two tons of VOCs per year. In cities
like Los Angeles, California, printer facilities have a four-ton-per-year limit on VOC
emissions. According to Gerry Bonetto of the Printing Industries Association of Southern
California (Bloom, 1999), some members of the industry see this as a deterrent to growth.
Since state and local regulations cannot, and should not, be circumvented, a way must be
found to minimize these emissions and the overall environmental impact of printing
operations if the industry is to continue to thrive locally and globally.
McMahon (1988) measured the noise exposures of 274 print production workers
in 34 establishments in the New York City area. In general, a greater percentage of the
workers in the bindery departments were exposed to potentially harmful noise than
workers in the press departments. Results of this study indicated that many workers in the
binding areas (part of the printing industry) might be at risk of occupational hearing loss.
Digital Printing Technologies
According to Kadam (2004), digital printers get most of the information about
health and safety hazards from the Material Safety Data Sheets (MSDS) that come with
the chemicals they purchase and from the operator manuals provided by the digital press
manufacturer. Additional EHS resources (directly related to digital printing technologies)
are hard to find.
14
The Aerias Air Quality Sciences Indoor Air Quality Resource Center website
(2006) says that digital printing devices have the potential to emit dust, volatile organic
compounds, and ozone. These three emissions come from the following parts and
processes: the inks and toners, paper debris, coatings on transparencies, glue on adhesive
labels, the mechanical print process itself, plastic materials, circuit boards, and residual
cleaning chemicals.
Dust is a general term for a type of air pollution that consists of various types of
particulates suspended in the air that we breathe. These particulates may come from paper
debris, toners, and developers; they are small enough to be inhaled and have a variety of
sizes, shapes, and levels of toxicity. Zirilli (2006) said that the accumulation of dust
creates a dependability problem in digital printing devices. Toner particulates (often
regarded as dust) have to be collected, transported, and separated from the main
airstream, and this air must be filtered and reconditioned before being returned to the
printer or the operator environment. Breathing these particulates can result in the
development of respiratory diseases such as asthma, bronchitis, pneumonia and
emphysema (Aerias, 2006). Wolkoff (1993) and Skoner (1990) found that particulates
emitted from laser printers have been associated with headaches, mucous membrane
irritation, and dryness of the throat, eyes, and nose.
In addition to respirable dust, according to Aerias (2006), of recent concern are
ultrafine particulates, which are less than 2.5 micrometer in diameter. Ultrafines are a
problem because they cannot be detected with the sampling equipment traditionally used
to measure other particulates. The health hazards associated with the exposure to ultrafine
15
particulates suspended in the air are poorly understood. Researchers in California
conducted a study concerning human cell damage from the inhalation of ultrafine
particulates (Tran, 2003). They state that ultrafine particulates not only lodge deep inside
the lungs, but also penetrate deep into the mitochondria −the power source of a human
cell, and remain there indefinitely. Over time, ultrafines lodged in the cells cause severe
structural damage and impair proper cell function. The U.S. government, represented by
OSHA, stated in their “Occupational Exposure to Hexavalent Chromium” article
(February, 2006) that ultrafines penetrate into the alveolar region of the lung, are slowly
cleared from the respiratory tract, and can lead to pulmonary inflammation and
respiratory disease if sufficient amounts are inhaled. The University of Rochester’s
Particulate Matter Center is currently testing the hypothesis that ultrafine particulates
occurring in the urban atmosphere cause adverse health effects, including increased
morbidity and mortality in people with respiratory and cardiac diseases (Orr, 2005).
The second emission cited by the Aerias website (2006) are volatile organic
compounds (VOCs). Many of these compounds are irritants that can cause headaches,
and long-term health effects of exposure to them include damage to the heart, liver, the
central nervous system, as well as cancers. Some of these compounds are flammable and
even toxic at high concentrations.
The third emission cited by Aerias (2006), ozone, is a highly reactive gas that is
formed when air is ionized. In some digital printing processes, ozone is formed when a
high voltage is applied to a corona wire before creating the image (Zirilli, 2006). Aside
from being a strong lung irritant, ozone’s reactive nature makes it prone to deterioration
16
and damage of printer components, causing a printer reliability problem. As a result,
ozone needs to be collected at the source and converted back to oxygen.
Introduction to Indoor Air Quality and Applicable Regulations in the U.S.
According to the U.S. Occupational Safety and Health Administration (OSHA)
website (2006) the printing industry can be separated into four main segments:
lithography, flexography, gravure, and screen printing, and they must comply with all the
general industry standards (29CFR1910). OSHA cites eight specific standards for
lithography, one for flexography, one for gravure, and three for screen printing, but as of
early 2007, there are no Federal standards for the digital printing industry.
Gary Jones (2005b) stated that conventional printers should learn about air
pollution regulations that affect their businesses and discover whether or not a permit
application is required by their state or local governments. He also notes that managers
have to accept the fact that some level of emissions is inevitable with the current
technologies. The most common regulations that must be met by all printers include those
described in the following federal acts: The Clean Air Act, The Clean Water Act, The
Resource Conservation and Recovery Act, The Emergency Planning and Community
Right-to-Know Act, and the Comprehensive Environmental Response Compensation and
Liability Act (Jones, 2005a).
Under the Clean Air Act in the 1970s, the U.S. Environmental Protection Agency
(EPA) established national ambient air quality standards for pollutants believed to pose
the greatest overall threat to public health and welfare (Cox, 1990). For example, the
17
EPA issues technical control guidelines to help states develop regulations to reduce VOC
emissions from existing businesses (Petersen, 1991). The EPA lists offset lithography as
one source of VOC emissions that states should consider controlling. This institution
defines lithographic ink oils from web offset, sheetfed offset, and letterpress news inks as
volatile because they participate in photochemical reactions.
The EPA regulates, among other things, outdoor ambient air quality; OSHA has
jurisdiction over all workplace environments, but as of early 2007 no regulatory agencies
control indoor air quality exposure limits. Of the estimated 100,000 toxic substances to
which building occupants are potentially exposed, fewer than 400 have recommended
exposure limits (Hess-Kosa, 2002).
The EPA counts indoor air pollution as one of the top environmental concerns in
the continental United States. Most people spend the majority of their lives indoors and
that pollution is consistently found to be two to five times higher indoors than outdoors
(Hess-Kosa, 2002). The EPA issued the National Ambient Air Quality Standards with the
intention of controlling emissions of six specific pollutants when released in large
quantities (such as by vehicle exhausts): sulfur dioxide, total particulate, carbon
monoxide, oxidants, nitrogen dioxide, and lead. Poor air exchange rates have traditionally
been blamed for health complaints that have no known sources.
The health effects of poor indoor air quality depend upon the effect of each air
contaminant, its concentration, duration of exposure, and individual sensitivity. In an
effort to address increasing air quality health complaints, various recognized institutions
have made an effort to recommend guidelines. The most prominent of these organizations
18
in the United States include: the American Conference of Governmental Industrial
Hygienists (ACGIH), and the American Society for Heating, Refrigerating, and AirConditioning Engineers (ASHRAE), which in turn has often credited the World Health
Organization (WHO) in its efforts. During the 1990s the U.S. Department of Energy and
the Department of Housing and Urban Development issued standards related to indoor air
quality (Hess-Kosa, 2002).
The original OSHA exposure limits were derived from the 1968 ACGIH
recommendations, and only a handful of chemical pollutants have since been updated
(Hess-Kosa, 2002). Even when these chemicals have been properly identified, the OSHA
limits are seldom exceeded in office environments. This is why most industrial hygienists
consider OSHA limits outdated and prefer to use ACGIH guidelines (J. Heyer, personal
communication, 2007). The full force of federal law, nonetheless, backs OSHA.
ACGIH is a professional society of scientists and engineers that review and
recommend guidelines annually to industrial hygienists for use in the assessment of
occupational workplace exposures (Schneider, 2007). Their guidelines, however, are
generally limited to eight-hour exposure durations for healthy adults between the ages of
18 and 65. In 1981 ASHRAE introduced a mechanical ventilation standard that is now
referred to as Ventilation for Acceptable Indoor Air Quality Standard (Hess-Kosa, 2002).
The purpose of this standard is to “specify minimum ventilation rates and indoor air
quality that will be acceptable to human occupants and are intended to avoid adverse
health effects.” This standard has since become the most commonly cited guideline for
indoor air quality investigations.
19
The Kadam Thesis
The Kadam thesis (2004), which inspired the present study, compared EHS
aspects of sheetfed offset lithography as reflected by the Heidelberg Speedmaster 74, and
liquid ink-based electrophotographic digital printing as reflected by the HP Indigo 3000.
These technologies are briefly explained in the following pages.
Figure 1 is a simplified cross-section view of one of the imaging units of the
Heidelberg Speedmaster 74 lithographic press, whose emissions and noise levels Kadam
studied.
Figure 1: The Sheetfed Offset Lithographic Process on the Heidelberg Speedmaster 74
(Source: Kipphan, 2001)
The inking rollers (shown in red in Figure 1) and the dampening rollers (the five small
blue circles in Figure 1) are in contact with the plate by means of the plate cylinder. The
inked printing plate will roll over the circumference of the blanket cylinder, which holds
20
the blanket in place, transferring the ink to the blanket. The blanket, in turn, will roll over
the circumference of the impression cylinder, which holds the sheet of paper. The
chemical solutions that were used to clean the ink rollers, plates, and blankets were the
sources of VOCs that Kadam detected. In this particular printing process, the ink on the
paper is not totally dry as it arrives to the delivery pile. Therefore, to avoid smearing of
the printed images, and to prevent the sheets from getting stuck together in the pile by the
ink, a powder is applied to the printed sheets before they reach the delivery pile. This
powder, paper debris, and undefined aerosols in the printing room were the sources of
respirable and total dusts that Kadam detected in this process. The moving parts inside
the Speedmaster were the source of the noise levels that Kadam recorded.
Figure 2 is a simplified cross-section view of the imaging unit that is involved in
the wet ink electrophotographic process (B. Waltz, personal communication, 2007) of the
HP Indigo 3000, whose emissions and noise levels Kadam studied.
Figure 2: The Wet Ink Electrophotographic Process on the HP Indigo 3000
(Source: Printing Applications Laboratory, Rochester Institute of Technology, 2007)
21
The green circle in Figure 2 represents the Photo-imaging Plate (PIP), which is
electrically charged by the three Scorotrons on top of it to minus 900 volts. The writing
head (top of Figure 2) has 12 fine laser beams that change the voltage of the PIP from
minus 900 volts to minus 50 volts only at the places where the wet ink will be adhered.
The Binary Ink Developer (BID at the lower left of Figure 2) is charged to minus 450
volts. As the PIP rotates counterclockwise, the wet ink contained in the BID will be
drawn to the more positive (less negative) area of the PIP (minus 50 volts) and repelled
by the more negative areas (minus 900 volts). After the BID, the PIP will come in contact
with the Pre-Transfer Erase (PTE module), a series of light-emitting diode lights that
flash on and erase any leftover electrical charge on the PIP.
The PIP will then come in contact with the Intermediate Transfer Member (ITM)
drum, which holds a heated blanket charged to a positive 500 volts. At this juncture
almost 100% of the ink is transferred to the ITM because this ink is designed to be
attracted to positive charges. The blanket also acts as a fuser because it is heated to 320
degrees Fahrenheit (°F). Finally, the paper passes through, squeezing between the ITM
drum and the impression cylinder; this is where the ink reaches the paper.
After the ITM drum, the PIP will come in contact with the cleaning station, which
pours cool imaging oil that scrubs any wet ink that may not have gotten transferred to the
paper. The imaging oil is the source of the VOCs that Kadam studied. Paper debris and
undefined aerosols in the printing room were the sources of respirable and total dusts that
Kadam detected in this process. The moving parts inside the HP Indigo 3000 were the
source of the noise levels that Kadam recorded.
22
Table 5 is a comparison of the environmental, health, and safety aspects studied
by Kadam and by the author.
Table 5: Comparison of Environmental and Occupational Aspects Studied
by Kadam in 2004 and by Leal in 2007
EHS Aspect Analyzed
Carbon Dioxide Concentrations
Relative Humidity Levels
Temperature Levels
Respirable Dust Concentrations
Ultrafine Particulate Concentrations
Total Dust Concentrations
Volatile Organic Compound Concentrations
Ozone
Noise Level Survey
Material Utilization
Kadam
NO
NO
NO
YES
NO
YES
YES
NO
YES
YES
Leal
YES
YES
YES
YES
YES
YES
YES
YES
YES
NO
The following is a summary of the Kadam findings that are relevant to this study:
•
Total dust concentrations are slightly higher in the digital printer than in offset
lithography; however, all are well below PEL.
•
Respirable dust concentrations are similar in both processes and below PEL.
•
VOC emissions from both presses are below regulatory standards.
•
VOC emissions in the digital press increase proportionally with print volume.
•
VOC emissions in offset lithography do not increase significantly with an
increase in print volume.
•
Occupational noise exposure is well below OSHA PEL in both processes.
23
A mass balance experiment was involved in the Kadam thesis for the purpose of
calculating Material Utilization (see the last row of Table 5). The author chose not to
conduct this experiment because Hewlett-Packard, the manufacturer of the Indigo 3000,
raised numerous objections to the Kadam mass balance methodology and results (M.A.
Evans, personal communication, 2006). Kodak’s Advanced Technology Chief Engineer
also did not approve of the idea of a mass balance experiment given the cost and time
restrictions of this project:
The issue was that the time needed to get meaningful data was not
practical (i.e., enough). For example, in order to get 100 grams of toner
waste you would need to run about 10,000 pages but 100 grams is barely
enough to prime the waste system so the amount that you would collect in
the waste bottle could be much smaller depending on the state of the
machine prior to the start of the test. In addition the amount of waste
generated is highly dependant on the type of job that you run (single sided,
or double coverage, etc.) and the state of the machine. To get statistically
significant data for mass balance you would likely need to run a few
hundred thousand prints with a variety of images. I didn’t think that was
practical (T.N. Tombs, personal communication, 2006).
24
The NexPress 2500 and its Environmental Footprint
NexPress started as a joint venture between the Eastman Kodak Company and
Heidelberg, and in early 2003 Heidelberg sold all its interests in this venture to Kodak
(J. Vanslette, personal communication, 2006). The NexPress 2500 owes its name to the
fact that it can print up to 2,500 sheets (12 by 18 inches) per hour. It is a digital color
press with a 600 dots-per-inch resolution, and is advertised as having a reliability and
usable lifetime similar to those of lithographic presses (Kodak Graphic Communications
Group, 2006). This press uses dry toner electrophotographic technology to print digital
data directly onto the substrates.
The printing system has two major components: the Kodak NexPress 2500 digital
print engine and the Kodak NexStation Front End (Kodak Graphic Communications
Group, 2006). This last component is where the digital files are ripped, trapped,
compressed, and queued for printing, and it enables remote access through the customer’s
network with remote client software. The NexPress has four electrophotographic printing
units for black, yellow, magenta, and cyan dry toners. It has a fifth (optional) imaging
unit that accepts red, green, or blue for color gamut expansion, or a clear dry toner for
image protection and enhancement (Ng, 2006).
25
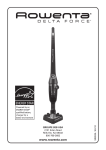
Figure 3 shows the main components involved in this printing process.
Figure 3: Cross-section of the NexPress (Source: Kodak G.C.G., 2007)
Ng (2003) describes this dry toner digital printing process as follows:
1. Media are released from the paper feeders (lower right of Figure 3) and pass
to the Automatic Sheet Positioner (ASP, top right of Figure 3).
2. The ASP places the media on the Web Transport, which carries it to the five
imaging units (top center of Figure 3) and color toner separations are
transferred to the media sequentially in registration.
3. The media are then passed on to the fuser and cooler units, which use mediadependent fusing technology.
4. If the image is printed on only one side of the media, it can be delivered to
either a proof tray or a main delivery unit (top left of Figure 3). For two-sided
printing, the media is passed to a perfecting unit at full speed.
26
Ng (2003) uses Figure 4 to explain how the toner transfer process (step 2 of the
previous list) takes place in each imaging module. The paper transfer nip is shown as an
inset on the right side of Figure 4.
Figure 4: Schematic of the NexPress Imaging Module (Source: Ng, 2003)
According to Ng (2003) the blanket cylinder (BC) is driven by an insulating endless web,
which is backed by a roller that defines the transfer geometry in this nip. Dry toner is
electrostatically transferred from the imaging cylinder (IC) to the BC with a constant
voltage supplied to the core of the BC. The electrostatic transfer force is maintained in
the nip by a constant current supplied to the core of the paper transfer roller that charges
the backside of the web and induces a polar charge on top of the media as it exits the nip;
the net charge is eliminated with a discharge brush. The image is then fixed to the media
by means of a heated fuser, which has a pneumatic pressure mechanism that allows it to
fix images on different medias of varying weight and thickness. After fusing, the media is
27
separated from the fuser roller with an air knife. This air stream cools the media before it
passes through the cooler module. The process is then complete, and the media exits the
press or is flipped for printing on its other side.
The NexPress manages its environmental impacts through the following systems:
a contamination control (CC) subassembly, a waste management (WM) system, and an
environmental control system (ECS). The CC uses airflow to help remove waste dry
toner and environmental contaminants from the press. The WM uses both mechanical
components and channeled airflow to control and to remove waste contamination from
the press. The purpose of the ECS is to provide the following conditions inside the press:
air at 70 °F, a relative humidity of 35% ± 5%, and non-conditioned air with controlled
and filtered flow.
28
Chapter 4
The Research Statement
This research project has reproduced a proven methodology for quantifying
various environmental aspects of digital printing as reflected by the Kodak NexPress
2500. This study has proved or disproved the following hypotheses:
1. The Material Safety Data Sheets (MSDS) of the fuser fluid, dry toners, and
developers of the NexPress 2500 do not reveal the presence of any
recognizable VOCs, as opposed to the MSDS of the HP Indigo 3000 imaging
oil, which reveals the presence of a VOC identified simply as petroleum
hydrocarbon, Chemical Abstracts Service number 90622-58-5.
Thus, the first hypothesis is Ho1: VOC emissions are higher in liquid ink
digital printing and sheetfed offset lithography when they are compared to dry
toner digital printing VOC emissions, both in short and long runs.
2. This hypothesis is based on the fact that the NexPress 2500 is equipped with
three sophisticated and independent contamination control, environmental
control, and waste management systems whose purpose is to remove dry toner
and environmental contaminants from the press.
29
Thus, the second hypothesis is Ho2: Respirable dust level emissions are higher
in liquid ink digital printing and sheetfed offset lithography when they are
compared separately to dry toner digital printing respirable dust emissions,
both in short and long runs.
3. This study was started under the assumption that dry toner digital printing is
inherently “cleaner”, or more environmentally friendly, than either wet ink
digital printing or sheetfed offset lithography. At the time this hypothesis was
conceived, the author was not aware of any evidence that pointed in either
direction.
Thus, the third hypothesis is Ho3: Eight-hour, time-weighed average noise
levels are higher in liquid ink digital printing when they are compared to dry
toner digital printing levels, in short and long print runs.
30
Chapter 5
Methodology
A similar methodology to the one used by Kadam (2004) was deployed. There are
several differences, however, between the two projects: Kadam does not include analysis
of carbon dioxide, relative humidity, room temperature, ultrafine particulates, and ozone.
With the NexPress 2500 digital production color press selected as the primary resource of
the study, raw materials were selected, and the length of the print runs was determined.
Following Kadam’s example, 30 minutes was chosen as the length of the short run, and
two hours as the length of the long run. Three Kodak scientists and two NexPress
operators validated these run lengths.
Two types of print runs were executed: preliminary and experiment. The purpose
of the preliminary runs was to become familiar with the measuring devices and their data
logging procedures; these techniques had been learned by the time the experiment runs
took place. In all instances a trained professional downloaded the data (after the print
runs) from each of the instruments to a personal computer using the software provided
with each device.
Another significant difference between the preliminary and the experiment runs
was that the order of the print runs (short and long) was inverted. This was done to see if
31
an apparent anomaly and some periodic events that were observed during the preliminary
runs would repeat themselves during the experiment runs. The outcome is discussed in
the Results chapter of this document.
The Checklist Used During the Print Runs
The following two paragraphs are transcripts of the checklists used before, during,
and after the preliminary and the experiment run.
First, the volume of the room where the print runs took place was measured by
multiplying its length by its width by its height. The instruments were connected to the
wall outlets (no batteries were used), turned on, and allowed to warm up and settle for 15
minutes. When the instruments were ready, background measurements were made and
written down for all of them. Digital pictures were taken of the position of the
instruments around the NexPress, and a sketch was made of the printer and the relative
position of any and all the other machines in the room. The serial numbers of the total
dust filters and air pumps were written down as part of the sketch; the same was done
with the noise dosimeter codes.
Once the print runs started, all events were logged together with their
corresponding start and finish. Ozone concentration levels had to be logged manually
because the instrument does not save this data. When the print runs were finished, a
digital copy of the file that was printed was retrieved, and so were five printed sheets.
32
The Digital Printing Device
Two different Kodak NexPress 2500 digital production color presses were used;
one on the preliminary run, and the other on the experiment run. They were located in
different rooms of the Kodak Manitou facility in Gates, New York. The fuser fluid, the
five dry toners (cyan, magenta, yellow, black, and clear), and the five corresponding
developers were the standard consumables that Kodak sells for use with this particular
digital press.
Choice of the Paper
The paper used was the Navajo Text, manufactured by Mohawk: its weight is 118
grams per square meter, it was trimmed down to 12 inches long by 18 inches wide, and
its grain was located along the latter side. The paper was chosen because, according to
Manitou NexPress operators, it is readily available to NexPress customers in the U.S., has
good curl resistance, allows excellent image contrast, and has been qualified (approved)
by Kodak to run on the NexPress 2500.
33
Choice of the Print Target
Figure 5 is a screenshot of the image that was printed on both sides of the paper.
Figure 5: Screenshot of the Digital File GATF_Sample_tagged_baby.pdf
(Source: Kodak, 2006)
This file was printed on both sides of the paper in order to maximize printer emissions,
and it was chosen because it is similar to the file used by Kodak Manitou NexPress
operators to test general color production performance variables, such as overprints,
shadow detail, highlights, skin tones, memory colors, the four process colors, vignettes,
grayscales, and fine line targets for evaluation of resolution.
34
Measurement of Ventilation Parameters
Carbon dioxide (CO2), relative humidity, and room temperature were measured
using the 8554 Q-Trak Indoor Air Quality Monitor, seen in Figure 6. The Q-Trak was
placed in the operator station in all print runs.
Figure 6: The Q-Trak Indoor Air Quality Monitor and Its Probe (far right)
The Q-Trak uses a Non-Dispersive Infrared Absorbance (NDIR) sensor to
monitor CO2. It has a range of zero to 5,000 parts per million (ppm), an accuracy of ± 3%
of reading at 77 °F, and a resolution of one ppm. The principle behind the NDIR is that
most molecules can absorb infrared light, causing them to bend, stretch, or twist. The
amount of infrared light absorbed is proportional to the concentration of the molecules.
CO2 has a strong absorbance at 4.26 micrometers as seen in its infrared spectrum; this
absorbance band is specific to this molecule. Given a fixed sensor cavity depth,
35
measuring the light intensity before and after the sample allows a measurement of the
concentration. According to the Q-Trak Operation and Service Manual (2006), the gas
sample diffuses into the cavity through a metal frit on the top of the instrument.
Polychromatic light from an incandescent bulb passes through the gas sample and is
absorbed in proportion to the amount of CO2 present. The filter in front of the detector
removes all of the light except at 4.26 micrometers, corresponding to CO2. This device
conforms to the EPA Method 3A, Title 40 Code of Federal Regulations (CFR) 60,
Appendix M.
The Q-Trak uses a thermistor to measure temperature. It has an effective range of
32 to 122 °F, an accuracy of ± 1 °F, and a resolution of 0.1 °F. The thermistor is a
thermally sensitive resistor that exhibits a change in electrical resistance when it is
subject to a change in temperature. The resistance decreases with an increase in
temperature, and the instrument has a built-in algorithm that uses a calibration curve (a
detailed matrix) that compares the expected resistance values at various temperature
points across the aforementioned range, and this is the temperature that the instrument
finally displays and logs.
The Q-Trak uses a thin-film capacitive sensor to measure relative humidity. It has
a range of five to 95% relative humidity, an accuracy of ± 3%, and a resolution of 0.1%.
The sensor operates on the principle that changes in relative humidity cause the
capacitance of the sensor to change in a detectable and repeatable manner. The sensor
itself is a combination of a substrate, electrodes, and a thin film of hygroscopic (a
substance that tends to absorb moisture from the air) polymer material. As with the
36
temperature, this instrument has a built-in algorithm that uses a matrix to compare the
expected capacitance values at various relative humidity percentages, and this is the
percentage that the instrument displays and logs.
The Q-Trak undergoes a factory calibration once a year. The following procedure
was used in order to take measurements:
1. Turn the Q-Trak on and allow it to warm up for one minute.
2. Press Sampling Mode until Log Mode 1 is displayed.
3. Press the Sample key; the Q-Trak will measure and log CO2, relative humidity
and temperature simultaneously.
4. At the end of measurements, press the Sample key and turn the Q-Trak off.
The Q-Trak logged CO2 levels in parts per million, relative humidity as a
percentage, and temperature in degrees Fahrenheit. These three variables were analyzed
separately, and they were plotted in the y-axis of a graph where the x-axis represented the
time of day in hours, minutes, and seconds. This allowed visual comparison of each level
to its corresponding OSHA and ASHRAE recommendation for maximum and minimum
acceptable exposure levels.
37
Measurement of Respirable Dust
Respirable dust was measured using the 8520 DustTrak Aerosol Monitor, which
was placed in the operator station in all runs. The DustTrak, seen in Figure 7, has an
aerosol concentration range of 0.001 to 100 milligrams per cubic meter (mg/m3), and a
particulate size range of 0.1 to 10 micrometers. This instrument uses a pump to draw air
through the 2.5 micrometer-wide discriminator and impacts the suspended dust against a
plate. Dust particulates greater than 2.5 micrometers contact and adhere to this plate, thus
being removed from the air stream. Particulates smaller than this are suspended in the air
and are drawn into the DustTrak. The stream is directed between a light source and a
detector; the latter measures the amount of transmitted light, which is inversely
proportional to the mass of respirable dust present in the sample. This information is then
displayed as milligrams per cubic meter.
Figure 7: The 8520 DustTrak Aerosol Monitor
38
The DustTrak monitor conforms to EPA Method 5, and it is sent to the
manufacturer for calibration and maintenance once a year. The following set of
instructions was used to confirm the zero point of the device, in accordance to the 8520
DustTrak Operation and Service Manual (2006):
1. Insert the 2.5 micrometer impaction plate and nozzle into the inlet of the
DustTrak (located on the front).
2. Turn the DustTrak on and allow it to warm up for one minute.
3. Attach the zero filter to the 2.5 micrometer nozzle.
4. Press the Time Constant key until 10 is displayed, then release.
5. Wait until the measured values reach zero; this may take up to one minute.
6. The DustTrak should settle on a value between –0.001 and +0.001 mg/m3. If
the displayed value is not within this range, follow steps 1-5.
7. Press and hold the Calibrate key until the display timer reaches zero, then
release. “Calibrate Zero” should be displayed; if not, then repeat steps 1-6.
8. Press the Sample key and allow the one-minute countdown to complete.
9. The zero is now stored. To return to survey mode, press the Calibrate key.
10. Connect the provided flowmeter to the 2.5 micrometer inlet.
11. Use the provided screwdriver to adjust the screw controlling the flow rate
(located on the front of the DustTrak) such that the flowmeter reads 1.7 l/m.
12. Disconnect the flow meter and connect the sampling tubing to the 2.5
micrometer inlet.
39
The following procedure was used to take measurements:
1. Confirm the zero of the DustTrak following the previous set of instructions.
2. Press the Sampling Mode key until Log 1 is displayed.
3. Press the Sample key to begin recording; “Recording” should be displayed.
4. At the end of the sampling period, press the Sampling Mode key until Survey
Mode is displayed.
5. Turn the DustTrak off.
The DustTrak logged respirable dust concentrations in milligrams per cubic
meter. These concentrations were plotted in the y-axis of a line graph where the x-axis
represented the time of day in hours, minutes, and seconds. This allowed visual
comparison of the respirable dust concentration to the corresponding OSHA PEL, the
ACGIH recommendation, and the Kadam results.
40
Measurement of Ultrafine Particulates
Ultrafine particulates were measured using the TSI 8525 P-Trak Ultrafine
Particulate Counter, seen in Figure 8. This instrument was placed in the operator station
in all print runs.
Figure 8: The 8525 P-Trak Ultrafine Particulate Counter
The P-Trak has a concentration range of zero to 500,000 particulates per cubic
centimeter, a sample rate of 100 cubic centimeters per minute, and a particulate size
range of 0.02 to one micrometer. This instrument draws in air using a pump and uses a
fixed filter system to screen out particulates greater than one micrometer. The collected
particulates are then enlarged by the introduction of 99.5% pure isopropyl alcohol. These
enlarged particulates are then made to pass between a light source and detector, where the
latter measures the amount of transmitted light.
41
As with the DustTrak, here the amount of light detected is inversely proportional
to the number (not the mass) of ultrafine particulates present in the sample. This data is
then displayed as the number of ultrafine particulates per cubic centimeter.
This device is sent to the manufacturer annually for calibration and maintenance.
The following instructions were used in order to confirm the zero point of the device,
according to its Operation and Service Manual (2006):
1. Turn the P-Trak on and allow it to warm up for one minute.
2. Attach the provided zero filter assembly to the P-Trak.
3. The particulate count displayed should read zero after five to ten seconds.
4. After zero has been reached, allow the P-Trak to continue running for 30
seconds, checking that the zero reading is stable. If a stable zero is not
reached, turn the P-Trak off, remove the zero filter assembly, and repeat steps
1-4.
5. Remove the zero filter assembly.
The following procedure was used to take measurements:
1. Insert the inlet screen assembly into the inlet located on the front.
2. Unscrew the storage cap from the front of the P-Trak.
3. Remove the alcohol cartridge from the alcohol container.
4. Gently shake the alcohol cartridge in order to drain excess alcohol on the
cartridge back into the alcohol container.
42
5. Insert the alcohol cartridge into the front of the P-Trak, locking it into place
with a 45-degree turn.
6. Seal the alcohol container with the storage cap (from step 2).
7. Confirm the zero point of the P-Trak (see the preceding procedure).
8. At the main menu, use the down arrow key to highlight the Log Mode option.
9. Use the left and right arrow keys until “Log Mode 1” is displayed; then press
the Enter key.
10. At the end of the sampling period, turn the P-Trak off.
11. Unscrew the alcohol cartridge from the P-Trak.
12. Screw the alcohol cartridge into the alcohol container.
13. Screw the storage cap into the front of the P-Trak.
The P-Trak logged the number of ultrafine particulates per cubic centimeter.
These concentrations were plotted in the y-axis of a line graph where the x-axis
represented the time of day in hours, minutes, and seconds. This allowed visual
comparison of the results from the preliminary and experiment runs.
43
Measurement of Total Dust Concentration
Total dust was measured using four MSA International ESCORT ELF air pumps
and the air cassettes that are provided with them. The pump draws air through a cassette
containing two filters that are pre-weighed and identical in mass. Air was allowed to pass
through one filter, and all particulates larger than five micrometers were retained. When
the experiment was complete, the filters were weighed in a laboratory to determine the
mass of dust captured. The second filter was not allowed to accumulate any dust but also
was weighed to adjust for absorption of water vapor from the environment. The ESCORT
ELF air pumps and the air filters are seen in Figure 9.
Figure 9: ESCORT ELF Air Pump and Air Cassettes
Four pumps and their corresponding cassettes were placed four feet around the
NexPress using a North-South-East-West configuration in all print runs. The device was
calibrated according to its Instruction Manual (1997):
1. Insert the outlet of the cassette into the inlet tubing of the pump.
2. Attach the inlet of the cassette to a flowmeter.
44
3. Turn the flowmeter on.
4. Turn the pump on and adjust its flow rate until the flowmeter reads 2 l/m.
5. Repeat steps 1-4 until two consecutive results are within 2% of each other.
The following procedure was followed in order to take measurements:
1. Attach the cassette, tubing, and pump to the location of interest.
2. Check the pump assembly at least once every two hours for proper operation.
3. At the end of the experiment, reinsert the assembly into the calibration setup.
4. Without adjusting the pump flow rate, record the flow rate of the pump as
displayed by the flowmeter, and turn the pump off.
5. Remove the cassette from the pump, and then seal the inlet and outlet.
6. The final phase was to send the dust cassettes to a laboratory for analysis.
Kodak chose Galson Laboratories in East Syracuse, New York, for this task.
The laboratory reported the mass of dust particulates retained in the air filters
using NIOSH Analytical Method 500 (NIOSH is the National Institute for Occupational
Safety and Health). This gravimetric method is based on the principle that the difference
in weight of a filter before and after collecting the sample will yield the mass of dust or
particulate matter retained on the filter, after moisture has been removed. Dividing the
reported mass by the volume of the room where the measurements took place yielded the
concentration of total dust in the corresponding rooms. This concentration was compared
to the total dust OSHA PEL, the ACGIH recommendation, and the Kadam results.
45
Measurement of Volatile Organic Compounds
Volatile organic compound emissions were measured using the TVA-1000B
Organic Vapor Analyzer. This device has an accuracy of ± 2.5 ppm from one to
10,000 ppm, and a sample rate of one liter per minute. The TVA-1000B is seen in
Figure 10. This instrument was placed in the operator station in all print runs.
Figure 10: The TVA-1000B Organic Vapor Analyzer and Its Probe (above it)
According to the instrument’s Instruction Booklet (1996), the TVA-1000B takes
the incoming sample air stream and passes it through a photo-ionization detector (PID).
This detector uses an ultraviolet (UV) light lamp to energize the incoming molecules.
This charged gas carries an electric current that can be measured by the device.
The gas then passes through the flame-ionization detector (FID), which measures
organic compounds by utilizing a flame produced by the combustion of hydrogen and
46
air. When hydrocarbons in the sample are introduced to the detection zone, ions are
produced. A collector electrode with a polarizing voltage also is located within the
detector chamber, and the ions produced by this reaction are attracted to it. As the
ions migrate toward the collector, a current is produced that is directly proportional to
the concentration of hydrocarbons introduced to the flame. This current is then
amplified and sent to a microprocessor and an analog readout device. This study did not
make use of the PID data, only the FID data, because the latter is more responsive to a
wider range of volatile organics.
The calibration of the vapor analyzer sets the background level (zero point) of the
electrical current produced in the detectors. A gas called Span of known concentration is
used to calibrate the vapor analyzer to a known electrical current produced by that
particular concentration.
The following set of instructions was followed in order to calibrate the device
according to the TVA Instruction Booklet (1996):
1. Turn the vapor analyzer on and allow it to run for 30 minutes in ambient air.
2. From the Main Menu, press 2 (Setup), followed by 1 (Calibration).
3. Press 2 (Background), followed by 1 (Both).
4. Introduce the calibration gas into the probe.
5. Press Enter: if the calibration was successful, the word “Accepted” will be
displayed; if not, follow steps 1-4 again until it does.
6. Press Exit until the Calibration Menu is displayed.
47
7. Press 3 (Span), and then press 1 (Both). Press 4 (Gas Conc), and then press 1.
8. Use the up and down arrow keys to select the unit (%, PPM, or PPB) of the
calibration gas concentration. In these experiments, the author used PPM.
9. Type the numerical concentration of the calibration gas, and then press Enter.
This is the procedure that was followed in order to take measurements, according
to its Instruction Booklet (1996):
1. Screw the sampling nose onto the wand, and connect the tubes to the analyzer.
2. Screw the hydrogen tank into the side of the vapor analyzer. Note that the
threads for the hydrogen tank are reversed.
3. Switch the red hydrogen cutoff valve to the open position.
4. Turn the vapor analyzer on and wait 15 seconds for the Main Menu to display;
then press the Control button.
5. Press 1 (turns pump on), then press Control, and then press 2 (Ignite).
6. If the FID flame fails to ignite, repeat steps 1-5.
7. At the Main Menu, press 1 (Run) and measure for as long as planned.
8. On the probe, press the button labeled Log.
9. At the end of the sampling period, turn the instrument off.
The TVA-1000B logged the concentration of VOCs in parts per million using
EPA method 25A. These concentrations were plotted in the y-axis of a line graph where
48
the x-axis represented the time of day in hours, minutes, and seconds. This allowed visual
comparison of the VOC concentrations for preliminary and experiment data.
Measurement of Ozone Concentration
Ozone concentration was measured using the Dasibi 1008 UV Photometric Ozone
Analyzer, and it conforms to EPA Method 411 (Lodge, 1989). This instrument has a
range of zero to 1,000 ppm, a sensitivity of 0.001 ppm (or one part per billion), an
accuracy of ± 1%, and a flow rate of three liters per minute. The ozone analyzer and the
device used to calibrate it are seen in Figure 11. This instrument was placed in the
operator station in all print runs.
Figure 11: The Dasibi 1008 UV Photometric Ozone Analyzer and the Primary Standard
This instrument uses a pump to draw in air and splits the air stream into two
pathways. One pathway contains a scrubber that removes any ozone before entering an
optical chamber; the other pathway leads directly to its own optical chamber. The optical
chambers have an ultraviolet (UV) light source and a detector. UV light passes through
49
the sample, and the detector measures the amount of transmitted light. The clean sample
is used to correct for other gases and contaminants in the air that may reduce this
transmission of light. The amount of light detected is inversely proportional to the
concentration of ozone.
The calibration process involves connecting the ozone analyzer with a primary
standard, certified by the National Institute of Standards and Technology (NIST) and
seen at the right of Figure 11. According to Wight (1994), a primary standard is a
“standard meter” known to be correct or more precise and accurate than the ozone
measuring device, and it typically has a resolution of ± 0.3%.
The following set of instructions was used to confirm the accuracy of the ozone
analyzer against the primary standard according to its User Manual (1990):
1. The primary standard should be connected to an exhaust system to capture and
treat the ozone generated.
2. Connect the ozone analyzer to a three-way valve in the exhaust system.
3. Turn the ozone analyzer on, and then turn the primary standard on.
4. Set the ozone analyzer to a flowrate of two liters per minute using the dial on
the front of the ozone analyzer.
5. Set the primary standard to generate 100 parts per billion (ppb) of ozone,
using the up and down arrows located on its front.
6. Allow the devices to equilibrate for 15 minutes.
7. Confirm that the readings on the ozone analyzer are within ± 5 ppb of the
primary standard.
50
8. Turn the primary standard off, and then allow the exhaust system 15 minutes
to remove any remaining ozone. Turn off and remove the ozone analyzer.
The following procedure was used to take measurements according to the Ozone
Analyzer’s User Manual (1990):
1. Connect the inlet and outlet tubing to the ozone analyzer (located on the back
of the machine).
2. Place the other ends of the tubing in the area of interest.
3. Turn the ozone analyzer on.
4. Adjust the flowrate to two liters per minute using the knob on the front of the
ozone analyzer.
5. Allow the instrument to settle for 15 minutes.
6. When sampling begins, record the displayed value on the ozone analyzer
manually. The instrument is not designed to log data for the user.
The UV Photometric Ozone Analyzer displayed (did not log) the concentration of
ozone in parts per million, which were then converted to parts per billion. These
concentrations were plotted in the y-axis of a line graph where the x-axis represented the
time of day in hours, minutes, and seconds. This allowed visual comparison of the ozone
concentrations to the OSHA PEL.
51
Measurement of Noise Level
Noise levels were measured using CK110 doseBadge Noise Dosimeters and a
Reader Unit, all seen in Figure 12. The doseBadge meets standards IEC 61252:1993
Personal Sound Exposure Meters, and the American National Standards Institute (ANSI)
S1.25:1991 Personal Noise Dosimeters. The Reader meets Internal Acoustic Calibrator
IEC (International Equipment Center) standard 60942:2001 Class 2.
The doseBadge has a range of 70 decibel (dB) to 130 dB time-weighed average,
and 120 to 140 dB as peak sound pressure. The noise dosimeters and the reader unit are
seen in Figure 12. Four units were placed around the NexPress, and the operator wore a
fifth one at shoulder height. The dosimeters were placed around the four sides of the
machine using a North-South-East-West configuration during the experiment run; a
sketch of this distribution can be seen in the Results chapter of this document. Each
dosimeter was assigned a specific color that identified it throughout this study.
Figure 12: The CK110 doseBadge Noise Dosimeters and the Reader Unit
According to its operation manual (2006), the doseBadge uses a microphone to
pick up the energy levels of incoming sound waves. The microphone works by using a
thin diaphragm made from a thin piece of metal that is made to vibrate by sound waves.
52
The vibration of the diaphragm causes a ceramic element to oscillate, thereby bending a
fulcrum that generates an electrical current. Finally, the magnitude of the current is
converted to decibels. The doseBadges and the Reader communicate via infrared ports.
The manufacturer calibrates the Reader unit annually. The following procedure
was used in order to take noise measurements:
1. Turn on and position the Reader unit within four inches of the doseBadge,
having the infrared ports on the doseBadge and the Reader unit facing each
other. Turn on the doseBadge.
2. Press the Run key. Wait until the status of the unit reads OK.
3. Repeat steps 1-2 for all doseBadges used.
4. Press the Stop key and wait until the status of the Reader reads OK.
The five doseBadges transmitted the noise levels they detected (in decibels) to the
Reader unit. These noise levels were plotted separately in the y-axis of a line graph (one
graph for every noisemeter) where the x-axis represented the time of day in hours,
minutes, and seconds. This allowed visual comparison of the noise levels to the timeweighed average OSHA PEL, ACGIH TLV, and the Kadam results.
Limitations of the Methodology
The preceding methodology was designed specifically for the Kodak NexPress
2500 and the standard consumables that Kodak sells for it. None of the methods, results,
or conclusions of this study can be compared to those of Kadam (2004) for mass balance,
material consumption, resource utilization, nor waste measurement.
53
Chapter 6
Analysis of Experimental Results
Two types of print runs were executed: preliminary and experiment runs.
Preliminary runs were conducted in a smaller office environment than the experiment
runs. The order of the print runs (short and long) was deliberately inverted during the
experiment runs. In the following pages the reader will be presented with stacked
graphics; the graph on top corresponds to preliminary run data (labeled A); the lower
graph represents experiment run data (labeled B). The scale of each pair of graphs is
identical in both axes in order to simplify visual comparison.
54
Carbon Dioxide, Relative Humidity, and Temperature
Figure 13 shows the carbon dioxide (CO2) readings detected by the Q-Trak.
Figure 13: CO2 Readings During the Preliminary (A) and Experiment (B) Runs
55
In their Standard 62.1-2004 (Ventilation for Acceptable Indoor Air Quality), the
American Society of Heating, Refrigerating and Air-Conditioning Engineers (ASHRAE)
provides the ventilation guideline of 700 parts per million (ppm) of CO2 above
background as a measure of the quality of the indoor air. If this guideline is followed,
odors and other indoor air contaminants should also be acceptable (J. Heyer, personal
communication, 2007). OSHA, on the other hand, provides a permissible exposure level
of 5,000 ppm in Table Z-1 of Standard 29CFR1910.1000. OSHA represents the U.S.
government, and ASHRAE represents the private sector.
Background levels were 490 ppm in the preliminary and 458 ppm in the
experiment run. CO2 levels were below 600 ppm in both runs, almost one order of
magnitude lower than the OSHA PEL of 5,000 ppm, and less than half of the ASHRAE
limit. To put these values in perspective, normal outdoor concentrations of CO2 range
from 250 ppm to 350 ppm.
The cycles in both curves –approximately every six minutes in Figure 13A, and
every eight minutes in Figure 13B– can be explained by the fact that the intake of the
Q-Trak and the intake of the ozone analyzer were located side by side in the operator’s
breathing zone. Every time the author approached the analyzer to record its readings
manually (every six minutes in the preliminary runs, and every eight minutes in the
experiment runs), the air exhaled by the author would trigger these spikes. The larger
spikes correspond to moments when three or four people stood near the instrument’s
intake.
56
CO2 concentration in an office environment is a surrogate for assessing indoor air
quality (J. Heyer, personal communication, 2007). CO2 occurs as a product of human
respiration. According to Heyer, the CO2 detected inside occupied spaces is typically a
combination of natural background and human respiration. He stated that it is highly
unlikely that the operation of the NexPress had any direct effect on CO2 levels in either
room. The concentration of this gas was measured to see how well fresh air (supplied
through the ventilation system of the rooms) was able to dilute indoor air contaminants.
The meaning of the preceding results was that the operation of the NexPress does
not result in a significant rise of CO2, and that the rooms in which these presses are
located are well ventilated according to ASHRAE and OSHA.
57
Figure 14 shows the percentage of relative humidity detected at the operator
station.
Q-Trak (Relative Humidity) – Preliminary Run
Q-Trak (Relative Humidity) – Experiment Run
Figure 14: Relative Humidity During the Preliminary (A) and Experiment (B) Runs
58
One of OSHA’s general rules is that office (indoor) temperature and relative
humidity are matters of human comfort rather than hazards that could cause death or
serious physical harm. OSHA has no specific regulations addressing them; however,
Section III, Chapter 2, Subsection V of the OSHA Technical Manual, “Recommendations
for the Employer,” provides the following guidance to prevent or minimize indoor air
quality issues: temperature must be in the range of 68-76 °F and relative humidity in the
range of 20-60%. In its Standard 55, “Thermal Environmental Conditions for Human
Occupancy,” ASHRAE recommends 68-74 °F during the winter and 30-60% relative
humidity as conditions that will be acceptable to 80% or more of the occupants within the
space.
Relative humidity is important for most print-on-paper processes because low
percentages are catalysts for static electricity sparks, which are hazardous to electronic
components inside printers, and they can cause the paper sheets to electrostatically adhere
together, which results in paper jams –especially during the winter, when outdoor air
becomes dryer. On the other hand, high percentages of relative humidity cause paper to
absorb moisture and deform, resulting in paper jams inside the machine.
As seen in Figure 14A, the relative humidity recorded during the preliminary run
was below the OSHA recommended minimum of 20%, going as low as 18.6%. These
levels are also below the ASHRAE minimum of 30%. The experiment run was within the
OSHA recommendation, but still below the ASHRAE minimum of 30% (see Figure
14B). Therefore, if static electricity discharges become frequent inside the room, the
moisture in the air can be increased using industrial air humidifiers.
59
Figure 15 shows the temperature recorded at the operator station by the Q-Trak.
Figure 15: Temperature During Preliminary (A) and Experiment (B) Runs
60
The temperature recorded in all instances was in accordance with OSHA; it never
went below 68 °F or above 76 °F. However, it exceeded the ASHRAE maximum of
74 °F during most of the experiment run (see Figure 15B). There was a 4 °F difference
between the temperature at the operator station of the small room and that of the Demo
room, and it was assigned to the ventilation systems of these rooms, which were located
at different buildings of the Kodak Manitou facility. If the operator manifests discomfort
with the slightly elevated temperature in the Demo room, the temperature can be
decreased by the air-conditioning system.
61
Respirable Dust, Ultrafine Particulates, and Total Dust
Figure 16 shows respirable dust concentrations detected by the DustTrak.
Figure 16: Respirable Dust Concentrations Detected During the Preliminary (A) and
Experiment (B) Runs
62
The American Conference of Governmental Industrial Hygienists (ACGIH) is an
independent organization that advances occupational and environmental health; ACGIH
is to respirable dust what ASHRAE is to ventilation. ACGIH recommends a maximum
respirable dust concentration of three mg/m3 (ACGIH, 2000), which is well above any
observed level.
Neither the first nor the second spike in Figure 16A, nor any measurement seen in
Figure 16B, exceeded the OSHA PEL of five mg/m3, according to Table Z-1 of Standard
29CFR1910.1000. In fact, even the 0.052 mg/m3 spike (the first spike in Figure 16A) is
96 times smaller than the OSHA PEL. This spike has been deemed an unexplained
anomaly. The reader may recall from the Methodology section that the order of the short
and long print runs was inverted in the preliminary and experiment runs; one of the
reasons for this change was to see if this particular spike was somehow associated with
the long print run. However, the event did not repeat itself during the experiment run;
therefore, this event has been dismissed as an anomaly. Another factor that suggested an
anomaly is that this data point was neither preceded nor followed by a similar
concentration level. This data point stands alone in the middle of an otherwise consistent
curve.
The second spike in Figure 16A occurred approximately one hour and twenty
minutes into the preliminary run and corresponds to the moment when the DustTrak was
tested by spraying its air intake with compressed air, the type used to clean computers.
This stirred the air around the intake and caused a sharp increase in the concentration of
particulates smaller than 2.5 micrometers.
63
The unexplained anomaly is different from the second spike in that the former
disappears as fast as it appeared, whereas the latter decreases slowly, as expected from an
event that is not an anomaly. The small spikes (or cycles) seen in both graphs are within
the resolution of this instrument (± 0.001 mg/m3). Nothing in the recorded data indicates
that (under normal operating conditions) the NexPress 2500 has any impact in the
concentration of respirable dust particulates smaller than 2.5 micrometers.
64
Figure 17 shows the ultrafine particulate concentrations detected by the P-Trak.
Figure 17: Ultrafine Particulates During the Preliminary (A) and Experiment (B) Runs
65
The spikes at the start of Figure 17A occurred at the same time the NexPress 2500
was turned on, performed a self check, and underwent a calibration cycle. Ultrafine
particulates may be sitting on top, inside of and around the press; as the press is turned
on, its fans and vibration may displace the ultrafines. The sharp rise in ultrafine
particulate levels at the end of Figure 17B is tied to the operation of the nearby Kodak
Digimaster 9110 Digital Production System; the ultrafine count rose precisely when the
Digimaster started running. A second reason for this sharp rise at the end of Figure 17B is
that during the long run, the printed sheets were discharged to the main delivery unit,
located inside the machine behind a closed door. During the short run, in contrast, the
operator had them discharged to the proof tray, where they were exposed to the room
atmosphere (see the top left of Figure 3). This allowed more ultrafines to reach the PTrak during the short run.
Finally, gravimetric determination of particulate matter was used to calculate total
dust. The cellulose filters used in this method only retain particulates larger than five
micrometers in diameter.
66
Galson Laboratories conducted the mass measurements seen in Figure 18. The
most important fact is that the laboratory reports “less than” milligram values, rather than
total milligram values. This is because 0.05 milligrams is the resolution of the
instruments used by Galson Laboratories.
A
B
Figure 18: Laboratory Analysis Reports for Milligrams of Total Dust Collected
During the Preliminary (A) and Experiment (B) Runs
67
The author divided these (less than) milligram values by the volume of the room
(in cubic meters) in which each print run (A and B) took place. Figure 19 shows how this
calculation was done.
A
LENGTH OF ROOM
27 feet
8.23 meters
WIDTH OF ROOM
32 feet
9.76 meters
HEIGHT OF ROOM
141.5 inches
3.59 meters
288.64 m3
VOLUME OF ROOM
MASS OF DUST PARTICLES
COLLECTED IN ANY
AND ALL AIR FILTERS
CONCENTRATION OF
TOTAL DUST
B
<
LENGTH OF ROOM
54 feet
16.46 meters
WIDTH OF ROOM
100 feet
30.49 meters
HEIGHT OF ROOM
141.5 inches
3.59 meters
1,804 m3
VOLUME OF ROOM
< 0.05 mg
MASS OF DUST PARTICLES
COLLECTED IN ANY
AND ALL AIR FILTERS
0.000173 mg/m3
CONCENTRATION OF
TOTAL DUST
<
< 0.05 mg
0.0000277 mg/m3
Figure 19: Calculation of the Concentration of Total Dust During
the Preliminary (A) and Experiment (B) Runs
As seen in Figure 18, the four filters analyzed for either run by Galson
Laboratories had a mass of “less than” 0.05 milligrams (mg). Dividing this number by the
volume of the room (calculated in Figure 19) gives a concentration of less than 0.000173
mg/m3 in the case of the preliminary run, and less than 0.0000277 mg/m3 during the
experiment run in the much larger Demo room. Both concentrations are far below the
OSHA PEL of 15 mg/m3 (according to Table Z-1 of Standard 29CFR1910.1000), as well
as below the ACGIH recommended maximum of 10 mg/m3 (ACGIH, 2000).
68
Volatile Organic Compounds
Figure 20 shows volatile organic compound levels detected by the TVA-1000.
Figure 20: VOC Emissions During the Preliminary (A) and Experiment (B) Runs
69
The spike in Figure 20A corresponds to the author’s computer-cleaning aerosol
experiment as described in the respirable dust section, and it was triggered by a
hydrocarbon called tetrafluoroethane. No significant levels of VOCs above background
were detected during either of the runs of the NexPress 2500 other than the spike in
Figure 20A. What Figure 20B shows may be the instrument’s zero base-lined drift.
According to Technical Service of the Foxboro Company (the manufacturer of the TVA1000B), this instrument is susceptible to this phenomenon, which involves the resistance
in the (Wheatstone bridge type) metering circuits inside this instrument. As mentioned
previously, when the Flame Ionization Detector of the instrument works, the
hydrocarbons in the sample gas react with the hydrogen flame and release ions, while a
collector electrode with a polarizing voltage attracts these ions. The migration of these
ions produces a current, which is directly proportional to the concentration of
hydrocarbons introduced to the flame. This current is then amplified and sent to a
microprocessor and an analog readout device.
It is during this last step that the zero drift occurs: some of the electrons in this
current bounce back (a form of feedback), and the instrument interprets these electrons
collectively as very low levels of hydrocarbons, which are seen in Figure 20B. The only
way to control this phenomenon is to calibrate the instrument constantly (J. Schneider,
personal communication, 2007). This effect is most visible when the instrument is trying
to measure levels close to zero because the instrument hovers over a range where it is
hard to distinguish current from non-current.
70
Ozone Emissions
Figure 21 shows ozone levels detected by the Ozone Analyzer.
Figure 21: Ozone Levels Recorded During the Preliminary (A) and Experiment (B) Runs
71
As seen in Figure 21, ozone experiment run levels (Figure 21B) double those of
the preliminary run (Figure 21A). This can be attributed to the fact that during the
experiment run, there were other digital printing machines running in the Demo room,
such as the aforementioned Digimaster. Ozone may be formed from oxygen by electrical
discharges and by action of high-energy electromagnetic radiation. This is especially true
in devices that use high voltages, such as the paper cutter, the glosser, the Digimaster,
and also the NexPress. The relative position of these machines can be seen in Figure 22.
The apparent cycles in Figure 21A and B are within the resolution of the
photometric analyzer, which is ± 0.001 ppm, or ± 1 ppb. For example, if the amount of
ozone in the air is exactly 3.5 ppb, the readings from the instrument will oscillate
between 3 and 4 ppb, as they do in Figure 21A. In fact, the ozone concentration did not
rise or fall, but because the instrument’s resolution is 1 ppb and not 0.5 ppb or less, the
instrument will not be able to detect that constant 3.5 ppb level but will oscillate above
and below it.
The PEL for ozone in the workplace is 100 ppb, according to Table Z-1 of the
OSHA Standard 29CFR1910.1000, which is identical to the ACGIH TLV for light work.
The highest ozone concentration detected during the runs was 8 ppb, less than a tenth of
the OSHA PEL. Background ozone levels reached on average 4 ppb, and when the
NexPress was running, the ozone level never rose beyond 8 ppb. Therefore, the worst
case scenario (i.e., if we ignore all the other ozone-emitting devices in the Demo room)
was that the NexPress, at its peak of ozone generation, emitted that 4 ppb difference. The
instrument probe was inserted in the machine after the experiment run was complete, and
72
a concentration of 39 ppb was detected. Assuming that the 4 ppb of ozone somehow
eluded the factory-installed NexPress 2500 filters, these filters were 89% (= 35/39 ppb)
efficient, and the ozone that eluded them was still 4% of the PEL. Figure 22 is a not-toscale sketch of the Demo room on the day the experiment run was executed.
Figure 22: Sketch of Kodak’s Manitou Demo Room
Figure 22 shows how other digital printing devices and peripheral machines were
distributed around the NexPress. Operating any of these electrical devices will raise the
ozone levels in the room, just as it occurred during the experiment run (Figure 21B) when
compared to the preliminary run (Figure 21A).
73
Noise Levels
Average noise levels detected by the four stationary dosimeters are shown in
Figure 23.
AVG = 68.58 dB
OSHA PEL = 90 dB
EIGHT HOUR TWA
AVG = 70.48 dB
AVG = 68.25 dB
AVG = 70.68 dB
Figure 23: Not-to-scale Sketch of the Distribution of the Stationary Noise Dosimeters
The noise level samples taken during the experiment run are representative of
those that occur during any given continuous eight-hour workday. Kodak scientists and
NexPress operators validated this crucial assumption, which allows comparison of
74
average noise values measured with the OSHA PEL of 90 dB as time-weighted average
(TWA) of eight hours. This TWA PEL, as well as the peak noise PEL of 140 dB, appears
in OSHA Standard 29CFR1910.95.
The operator was, on average, exposed to the highest levels of noise: 71.97 dB.
The dosimeter located west of the NexPress was exposed to the least amount of noise:
68.25 dB. Figure 24 shows the noise levels recorded by all the dosimeters.
Figure 24: Noise Levels Detected by All Five Dosimeters Around the NexPress
The red curve in Figure 24 corresponds to the dosimeter that was carried by the
operator, and by comparison to the other four curves, it is evident that the operator was
exposed to higher decibel levels than any of the other dosimeters. Each curve is analyzed
separately in the following pages.
75
Figure 25 shows the noise levels that the operator sustained.
Figure 25: NexPress Operator’s Noise Exposure Levels During the Experiment Run
In Figure 25 there are three distinct moments –two at the middle of the long run
(82.5 dB and 81.2 dB), and one in the middle of the short run (82.7 dB, the noise peak of
the experiment)– when the noise level rose above 80 dB. The numerous smaller spikes in
the curve correspond to moments when the operator came closer to the machine, raised
his voice, and/or held conversations with the other people in the Demo room. The noise
level went below 65 dB when the NexPress was stopped after the long run and was made
ready for the short run. In average, the operator was exposed to 71.97 dB of noise.
76
Figure 26 shows the noise levels at the operator station, seven feet south of the
NexPress.
Figure 26: Noise Levels Detected at the Operator Station During the Experiment Run
Sound levels never exceeded 75 dB at the operator station and never went below
66 dB. This dosimeter did not detect any significant differences in noise levels between
the short and long run. However, it detected, in average, a relatively high noise level of
70.68 dB (the second highest) despite the fact that it was the farthest away from the
NexPress.
77
Figure 27 shows the noise levels east of the machine, halfway between the
NexPress and one of the walls.
Figure 27: Noise Levels Detected East of the Press
Out of the five dosimeters, the east dosimeter most clearly reflects the time
periods that correspond to the long print run, followed by a pause, followed by the short
print run. As with all the other stationary dosimeters, the east dosimeter never picked up
noise levels above 75 dB. This dosimeter detected, in average, a noise level of 70.48 dB.
78
Figure 28 shows the noise levels north of the NexPress.
Figure 28: Noise Levels Detected North of the Press
The north dosimeter also shows a dip in noise levels just before the long run, and
before the short run, which correspond to machine idle cycles. This particular dosimeter
was more tightly “squeezed” between the NexPress and the back wall, and one would
have expected sound waves to bounce back from the wall and elevate noise levels above
those picked up by the other dosimeters, but that was not the case. This dosimeter
detected, in average, a noise level of 68.58 dB.
79
Figure 29 shows the noise levels West of the NexPress.
Figure 29: Noise Levels Detected West of the Press
Even though this dosimeter was located west at the same distance from the
NexPress as the east dosimeter, the former picked up all-around lower noise levels than
the latter. This could be due to the fact that the west dosimeter was not “sandwiched”
between a wall and the press, as was the east dosimeter. This dosimeter, like the north
dosimeter, was able to distinguish the moments when the press was idle between the long
and short run. This dosimeter detected, in average, a noise level of 68.25 dB.
80
Evaluation of the Hypotheses and Comparison to the Kadam Results
The author set out to prove or disprove the following three hypotheses, which are
the overlapping points of the Kadam study and the present study:
1. Ho1: VOC emissions are higher in liquid ink digital printing and sheetfed offset
lithography when they are compared separately to dry toner digital printing VOC
emissions, both in short and long runs. Outcome: No significant VOC emissions
were associated with the operation of the NexPress 2500 in all instances; Kadam
detected as much as 30 ppm of VOCs. Therefore Ho1 is true.
2. Ho2: Respirable dust level emissions are higher in liquid ink digital printing and
sheetfed offset lithography when they are compared separately to dry toner digital
printing respirable dust emissions, both in short and long runs. Outcome: Kadam
detected concentrations just under 0.3 mg/m3 in both processes, whereas operation
of the NexPress 2500 was associated with respirable dust levels of less than
0.052 mg/m3 in all instances. Therefore Ho2 is true.
3. Ho3: Eight-hour, time-weighed average noise levels are higher in liquid ink
digital printing when they are compared to dry toner digital printing levels, in
both runs. Outcome: Kadam recorded an average of 61.9 dB in digital printing,
whereas the current study recorded 77.58 dB. Therefore Ho3 is false.
81
Table 6 summarizes the results of the present study compared to the results of the
Kadam study. In the cases where there are two limits, such as the case of total dust, for
which OHSA mandates a maximum of 15 mg/m3 and ACGIH suggests no more than
10 mg/m3, the lower (safer) of the two limits is shown on Table 6.
Table 6: Comparison of Results of the Kadam Study and the Present Study
EHS
Aspect
Respirable Dust
Concentrations
Ultrafine
Concentrations
Total Dust
Concentrations
VOC
Concentrations
Ozone
Concentrations
Peak Noise
Levels
8-Hour TWA
Noise Levels
PEL or
TLV
Kadam
Lithography
Kadam
Wet Ink
Leal
Dry Toner
3 mg/m3
< 0.3 mg/m3
< 0.3 mg/m3
< 0.052 mg/m3
None
–
–
< 30,000 pt/cm3
10 mg/m3
< 0.8 mg/m3
< 0.9 mg/m3
< 0.000173 mg/m3
100 ppm
30 ppm
18.5 ppm
< 6 ppm
100 ppb
–
–
< 8 ppb
140 dB
147.7 dB
120.6 dB
82.7 dB
85 dB
63.1 dB
61.9 dB
77.6 dB
The respirable and total dust levels in Table 6 show that the NexPress 2500 emits
fewer dust particulates than either the Heidelberg Speedmaster 74 or the HP Indigo 3000.
However, this conclusion may prove to be false. Kadam makes no mention of the volume
of the rooms, nor of the environmental conditioning systems present in the rooms in
which his measurements took place. It may well be that the three machines emit the same
mass of dust particulates, but if the Demo room is much larger than the others, the dust
concentrations from the NexPress will be lower. Only under the assumption that the three
82
rooms had identical volume can it be concluded that the NexPress 2500 emits less
respirable dust (and less total dust) than the Heidelberg Speedmaster 74, or the HP Indigo
3000.
In the case of VOCs, the author knows by having examined the MSDS for the
NexPress consumables that there should not be any VOCs emitted by the NexPress. The
“less than 6 ppm” is considered a background level. Essentially, what the instrument
indicates is that there are no significant levels of VOCs being emitted by the NexPress.
The peak noise level detected in the lithographic process exceeded the OSHA
PEL; however, the exposure was momentary (not sustained) and unfortunately Kadam
does not explain it nor theorize. Noise peaks in both wet and dry digital printing were
below permitted levels, with dry toner digital printing proving to be the safer technology.
Time-weighted average noise levels were higher in dry toner digital printing than
in lithography or wet ink printing. This can be explained by the fact that the author used
five different dosimeters, deliberately distributed four feet around the printer, and one
carried by the operator, whereas Kadam only used one noise level meter attached to the
operator.
Based only on these four parameters (respirable dust, total dust, volatile organic
compound emissions, and noise peak levels), it can be concluded that the environmental
footprint of the NexPress 2500 is smaller than that of the Heidelberg Speedmaster 74 and
the HP Indigo 3000.
83
Chapter 7
Conclusions
Summary
The experiments conducted on two different Kodak NexPress 2500 digital
production color presses yielded favorable air quality and noise level results on all
aspects under observation.
Carbon dioxide levels during normal operation of the NexPress 2500 reached
concentrations that are a mere 11% of OSHA permissible exposure levels and 47% of the
ASHRAE recommended maximum. There was no evidence to suggest that the operation
of the NexPress had any effect on the CO2 concentration levels. A second conclusion is
that both rooms where the NexPress 2500s have been installed are adequately ventilated,
since it is generally understood that elevated CO2 levels are an indicator that an indoor
environment is poorly ventilated.
Relative humidity and temperature at the operator station are within the Nexpress
operating parameters, although relative humidity was low in the room where the
preliminary run was conducted. If the operator manifests no discomfort, and the press
performs flawlessly, then there is no need to install industrial air humidifiers in the room.
84
Relative humidity has an impact on operator comfort, is a potential cause of paper
jams, and has to be within a specific range for the NexPress to operate properly. In
addition, if too high, relative humidity can facilitate the growth of dust mites and molds
(ASHRAE, 2007). Kodak has equipped the NexPress with an Environmental Control
System that exerts negative pressure to the air outside the machine and conditions it to
optimal operating levels throughout the printing cycle (inside the press). The results
indicated that the normal operation of the NexPress has no impact on temperature or
relative humidity levels of its surroundings.
Respirable dust levels were found in very low concentrations at the operator’s
breathing zone –the average being 500 times lower than the OSHA PEL, and 300 times
lower than the ACGIH maximum. The concentration of respirable dust before, during,
and after the NexPress was operated did not change significantly. This means that the
NexPress Contamination Control subassembly was successfully removing waste dry
toner and other environmental contaminants from the printing process; therefore, the
NexPress does not add significantly to air pollution at the scale of 2.5 micrometers in
diameter, the scale that corresponds to fine respirable dust.
There was evidence that the operation of the NexPress raises the concentration of
ultrafine particulates in the operator’s breathing zone, but then again, so does the
operation of a nearby altogether different digital press, the Kodak Digimaster 9110. To
put the recorded ultrafine levels into perspective, consider that the P-Trak detected
18,000 ultrafines per cubic centimeter in a carpeted office setting where 30 people work.
This level means that (in comparison) the rooms in which the digital presses are located
85
are very clean rooms, registering most of the time less than 5,000 ultrafines per cubic
centimeter. The ultrafine particulate results are inconclusive because, as of early 2007,
there are no specific standards or guidelines have been developed specifically for
ultrafine particulates. This is an area rich with potential for further research, and until this
is done, it is not fair to say that the NexPress emits high, moderate, or low levels of
ultrafine particulates, from 20 nanometers to 1,000 nanometers in diameter.
Neither the NexPress toner nor the developer can account for the concentrations
of respirable dust or ultrafine particulates. The reason was that the toners have a volume
average diameter of eight micrometers, and developers (which consist of toner and
carrier) have a carrier that has a volume average diameter of 15 micrometers. Therefore,
it can be concluded that neither the NexPress toners nor the developers play any role in
respirable dust or ultrafine particulate concentrations. This is not necessarily the case for
total dust concentrations.
Gravimetric analysis revealed that the concentration of total dust in the rooms
where the NexPress were installed were five orders of magnitude lower than OSHA PEL
and ACGIH recommendation during the preliminary run, and six orders of magnitude
lower during the experiment run. This means that the factory-installed Contamination
Control system filters much of the toner, developer, and paper debris that escape the
printing process and does not allow it to go outside of the press.
Neither the NexPress 2500 nor its peripherals are a significant source of volatile
organic compounds. This was expected because none of the Material Safety Data Sheets
associated with the NexPress mention organic volatiles. In the NexPress, there are no
86
solvents involved in the process, and any fuser oil vapor is collected and vented though
filters prior to being exhausted to the outside. In conclusion, under normal operating
conditions, the NexPress operators will not exceed any recommended VOC exposure
guideline.
As part of its Environmental Control System, the NexPress 2500 is equipped with
activated-charcoal ozone filters that, according to the analysis of the recorded data, have
an efficiency of 89% in the worst case (how this number was calculated is explained in
the ozone Results subsection). The remaining ozone that was detected outside the press
was only 4% of the EPA permissible exposure limit. This scenario, however, assumes
that none of the other equipment (operating simultaneously in the same room as the
NexPress) emits ozone. This is highly unlikely because these machines have similar
ozone-generating components to those of the NexPress, such as electric motors.
Therefore, the real ozone emission levels of the NexPress are lower than 4% of OSHA
PEL. The difficulty lies in separating the ozone generated by the NexPress alone and the
ozone generated by the other machines. In any case, the ozone filters are at least 89%
efficient, and the operator was not at risk from even moderate exposure to this gas.
The sound level survey conducted around the NexPress revealed that the front of
the press tends to be noisier than the back. The press has most of its access panels (doors)
in the front, therefore, it was no surprise that most of the noise it generates inside bounces
off the back and escapes the press through these panels in the front. Overall this was a
quiet machine whose operation was not hazardous as far as noise was concerned. The
87
highest decibel levels detected, even had they been sustained during eight hours, did not
exceed the time-weighted average (TWA) OSHA permissible exposure limit.
In Chapter 2 of this document (Applicable Mathematical Models), the cumulative
noise detected by five dosimeters was calculated. The author used the five doseBadge
averages obtained in the actual experiment run in that example, reaching an overall
average of 77.58 dB for the NexPress. To put the 77.58 dB eight-hour average noise
exposure in perspective, consider that operating a kitchen blender continuously at
maximum speed during eight hours is considered hazardous because it meets the 90 dB
eight-hour OSHA PEL. Operating a vacuum cleaner under the same conditions yields an
80 dB TWA exposure (wikipedia.org, 2007), which is acceptable. The noise level data
supports the conclusion that noise levels (four feet and beyond) around the NexPress are
well within OSHA and ACGIH requirements. This is a safe machine to operate without
ear protection during eight continuous hours.
Perhaps the most important conclusion to be drawn by the analysis of the data was
that there was no noticeable difference on any of the measured parameters between the
short and the long runs. The recorded data suggest that this press was manufactured in
such a way that its consumables are used up evenly, regardless of print count (the number
of printed sheets). This may not be the case with power consumption, but this variable
was not included in the present project and is grounds for further research.
88
Implications of the Findings
The results of this study indicate that the NexPress 2500 is safe to operate (only
with regards to the EHS parameters herein tested) under normal conditions in the office
environments in which they were studied. More specific implications include:
•
Carbon Dioxide: assuming that the NexPress 2500 does not contribute to CO2
emissions, and that its concentration can only be assigned to the exhalations of
the people in the room at the time of the measurements, by extrapolation of
the levels detected in this study, it would take ten persons at or around the
operator station to meet the ACGIH limit, and 45 persons to exceed the OSHA
PEL for CO2.
•
Respirable Dust: assuming that all the detected respirable dust concentrations
can be assigned to the NexPress, the smallest room in which the press could
be installed without exceeding the ACGIH TLV would have to be about five
cubic meters, and exactly three cubic meters in order to exceed the OSHA
PEL for respirable dust. None of these scenarios are possible because the
press itself has a volume of 21 m3.
•
Total Dust: assuming that all the detected total dust concentrations can be
assigned to the NexPress, the smallest room in which the press could be
installed without exceeding the ACGIH TLV would have to be 0.005 cubic
meters –smaller than a shoe box, and 0.003 cubic meters (about the size of a
six pack of beer) in order to exceed the OSHA PEL for total dust.
89
•
Volatile Organic Compounds: assuming that the 5.99 ppm of VOCs detected
was not instrument noise, and further assuming that this VOC is the same that
Kadam detected and for which the OSHA PEL is 100 ppm, it would take a
room that is 17 m3 (just under the volume of the press) to exceed this limit.
•
Ozone: assuming that all the detected ozone concentrations can be assigned
exclusively to the NexPress, the smallest room in which the press could be
installed without exceeding OSHA and ACGIH limits would have to be
23 m3, just over the actual size of the press, but still much too small.
•
Noise: using the Calculation Method, and extrapolating the average noise
emitted by one NexPress (77.6 dB as calculated by this study), it would take
six presses installed in the Demo room to exceed the ACGIH limit, and 17
presses to exceed the OSHA PEL for eight-hour TWA noise exposure. All
these presses would have to be four feet away from the operator station, which
makes these scenarios unrealistic.
Agenda for Further Research
The author puts forth the following ideas for further research along the lines of the
present study:
•
Mass Balance Experiment: Time and budget constraints prevented the author
from conducting such an investigation on the NexPress. It would be
interesting to see if the NexPress measures up to its competitors on resource
efficiency and waste generation levels.
90
•
In-Depth Ultrafine Particulates Survey: Science is only beginning to
understand the impact that ultrafine particulates have on human health. The
author thinks that a full survey, involving numerous P-Trak devices located
strategically around the press, is justified. In order to attempt to determine
exactly what makes up these ultrafine particulates, this survey could be
accompanied by chromatography.
•
Power Consumption Analysis: This is important from cost optimization and
environmental perspectives, and it will also help determine just how
differently the NexPress 2500 handles short and long runs. In order to
evaluate the energy requirements for short and long runs, all energyconsuming units such as press motors, hydraulic oil pumps, conveyor belts,
fans, etc., have to be clearly identified and their power consumption
measured. Energy efficiency metrics can be determined by relating total
energy consumption to different print run lengths and/or usage of
consumables.
•
Ozone Emissions from Peripheral Equipment: The author suggests that the
experiment be repeated on each of the other machines in the Demo room
separately, with the rest of the machines turned completely off and their
power supply cut. This should help determine exactly how much ozone each
one emits independently and, thus, by subtraction, determine exactly how
much is emitted by the NexPress 2500.
91
Bibliography
92
Bibliography
American Conference of Governmental Industrial Hygienists (ACGIH). (2000). 2000
TLVs and BEIs: Threshold Limit Values for chemical Substances and Physical
Agents and Biological Exposure Indices. ACGIH Worldwide. Ohio, USA.
Berger, E.H., et al. (1986). Noise and Hearing Conservation Manual. American
Industrial Hygiene Association (AIHA), 143. Virginia, USA.
Bloom, R. (1999). AQMD targeting press cleaning solvents–again. Orange County
Business Journal, 22, 25-30.
Burke, R. (1992). Green marketing. American Printer, 210(2), 48-50.
Cox, K. (1990). Environmental issues: The Ins and Outs. American Printer, 205(3),
44-46.
Dasibi Environmental Corporation. (1990). 1008 UV Photometric Ozone Analyzer:
User Manual. California, USA.
Ferris, F. (1995). Greening your bottom line. American Printer, 215(1), 38-41.
Gullison, K. New Blue Angel Standard RAL 122 Tightens Emissions of Ozone
From Office Equipment With Print Functions. Market Wire. August 23, 2006: 1
pp. Online. Available: http://www.marketwire.com/mw/release_printer_
friendly?release_id =156714&category=. Accessed September 14, 2006.
Hess-Kosa, K. (2002). Indoor Air Quality: Sampling Methodologies. CRC Press LLC
Florida, USA.
Jones, G. (2005). EPA & OSHA. American Printer, 122(1), 18-21.
Jones, G. (2005). Determining VOC/HAP emissions from sheetfed offset lithographic
printing operations. Printer’s National Environmental Assistance Center.
Kadam, S. (2004). Comparative study of environmental, health, and safety aspects and
impacts associated with lithographic and digital printing processes.
RIT Printing Industry Center. Rochester, New York.
93
Kodak Graphic Communications Group. Kodak NexPress 2500 Data Sheet and
Brochure. Eastman Kodak Company Website. Available Online:
http://graphics.kodak.com/US/product/printers_presses/production_
color/KODAK%20NEXPRESS%202500%20Digital%20Production
%20Color%20Press/default. Accessed June 2006 through March 2007.
Kipphan, H. (2001). Handbook of print media. Springber-Verlag.
Heidelberg, Germany.
Leung, M.K., et al. (2005). Occupational exposure to volatile organic compounds and
mitigation by push-pull local exhaust ventilation in printing plants. Journal of
Occupational Health, 47(6), 540-7.
Lodge, J. (1989). Methods of Air Sampling and Analysis, Third Edition.
Lewis Publishers Inc. Michigan, USA.
McMahon, K.J., et al. (1998). Occupational noise exposure in the printing industry.
American Industrial Hygiene Association Journal, 49(1), 34-37.
MSA International. (1997). Escort ELF Pump Instruction Manual. Pennsylvania, USA.
NexPress Solutions LLC. (2006). NexPress 2500 Operations Manual. Available
online exclusively to customers of Kodak NexPress. New York, USA.
NoiseMeters Limited. (2006). How to Use the doseBadge (Manual). Texas, USA.
Ng, Y., et al. (2003). Advances in NexPress Production Digital Printing Technologies
Electronic correspondence with Mr. Cavan A. Kelsey, Business Director, Health,
Safety and Environment, Graphic Communications Group.
Received January 15, 2006.
Orr, L. Scientists Probe Air Pollution-Heart Disease Link. University of Rochester
Medical Center News Archives. December 12, 2005: 1 pp. Online. Available at
http://www.urmc.rochester.edu/pr/news/story.cfm?id=962.
Accessed February 11, 2006.
Petersen, D. (1991). A delicate balance. American Printer, 207(5), 26.
Petersen, D. (1992). Web offset: don’t blow your sack. American Printer, 209(2), 32-35.
Robertson, W. (2007). Combining Decibel Quantities. Middle Tennessee State
University. January, 2007: 4 pp. Online. Available: http://physics.mtsu.edu/
~wmr/log_4.htm. Accessed January 18, 2007.
94
Romano, F. (2001). Digital Basics. Mohawk Digital Papers. Cohoes, New York.
Skoner D.P., et al. (1990). Laser printer rhinitis. New England Journal of Medicine,
322(18), 1323.
Stewart, J., et al. (1999). Industrial-Occupational Hygiene Calculations:
A Professional Reference. Millennium Publishing.
The Foxboro Company. (1996). TVA-1000B Toxic Vapor Analyzer: Operation,
Configuration, and Maintenance. Massachusetts, USA.
Tran, T. UCLA/USC Study Finds Damage to Human Cells that Exposed to Air
Pollution. UCLA Newsroom. April 10, 2003: 1 pp. Online. Available:
http://www.newsroom.ucla.edu/page.asp?menu=fullsearchresults&id=4115.
Accessed February 11, 2006.
TSI Incorporated. (2006). Model 8552/8554 Q-Trak Plus IAQ Monitor: Operation
and Service Manual. Minnesota, USA.
TSI Incorporated. (2006). Model 8520 DustTrak Aerosol Monitor: Operation and
Service Manual. Minnesota, USA.
TSI Incorporated. (2006). Model 8525 P-Trak Ultrafine Particulate Counter: Operation
and Service Manual. Minnesota, USA.
Unknown Authors. Aerias AQS IAQ Resource Center Website.
http://www.aerias.org/DesktopDefault.aspx.
Accessed June 27, 2006 through February 2007.
Unknown Authors. U.S. Census Bureau Website.
http://www.census.gov/econ/census02/data/industry/E323115.HTM
Accessed June 26, 2006.
Unknown Authors. U.S. Environmental Protection Agency (EPA) Website.
http://epa.gov/. Accessed June 26, 2006 through February 2007.
Unknown Authors. Envirowise Website. http://www.envirowise.gov.uk/
Accessed June 26, 2006 through February 2007.
Unknown Authors. Occupational Safety and Health Administration (OSHA) Website.
http://osha.gov/. Accessed June 26, 2006 through February 2007.
95
Unknown Authors. Occupational Exposure to Hexavalent Chromium. OSHA Website.
http://www.osha.gov/pls/oshaweb/owadisp.show_document?p_table=
FEDERAL_ REGISTER&p_id=18599. Accessed February 11, 2006.
Unknown Authors. Wikipedia Website. Available online at http://wikipedia.org/.
Accessed June 26, 2006 through February 2007.
U.S. Department of Health and Human Services, Public Health Service Centers for
Disease Control and Prevention, National Institute for Occupational Safety and
Health. (1997). NIOSH Pocket Guide to Chemical Hazards. J.J. Keller &
Associates. Wisconsin, USA.
Wadden, R., et al. (1995). Determination of VOC emission rates and compositions for
offset printing. Journal of the Air and Waste Management Association; 45(7),
547-55.
Wight, G.D. (1994). Fundamentals of Air Sampling. CRC Press LLC. Florida, USA.
Wolkoff, P., et al. (1993). Comparison of volatile organic compounds from processed
paper and toners from office copiers and printers. Indoor Air; 3:113-123.
Zirilli, F. (2006). Clean Printing Through CFD. Desktop Engineering Website.
http://www.deskeng.com/Articles/Applications/Clean-Printing-Through-CFD20050201301.html. Accessed September 15, 2006.
96