1
eTPU Debugger and Trace
TRACE32 Online Help
TRACE32 Directory
TRACE32 Index
TRACE32 Documents ......................................................................................................................
ICD In-Circuit Debugger ................................................................................................................
Processor Architecture Manuals ..............................................................................................
eTPU .........................................................................................................................................
eTPU Debugger and Trace ..................................................................................................
1
General Note ......................................................................................................................
4
Brief Overview of Documents for New Users .................................................................
4
Warning ..............................................................................................................................
5
Target Design Requirement/Recommendations ............................................................
6
General
6
Quick Start eTPU Debugger .............................................................................................
7
Troubleshooting ................................................................................................................
8
FAQ .....................................................................................................................................
9
Configuration .....................................................................................................................
12
System Overview
12
eTPU Debugger Specific Implementations .....................................................................
14
eTPU operating modes
14
Debugging the eTPU
14
Breakpoints and Watchpoints
15
Software Breakpoints
15
On-chip Breakpoints/Watchpoints
15
Breakpoints/Watchpoints on Service Request or channel register write
15
Memory Classes
16
Address Spaces and Addressing Modes
16
General SYStem Commands ............................................................................................
SYStem.CONFIG
17
Assign core to TRACE32 instance
17
Select the CPU type
17
SYStem.CONFIG.CORE
SYStem.CPU
SYStem.CpuAccess
Run-time memory access (intrusive)
18
Select the debug clock frequency
18
Lock and tristate the debug port
19
SYStem.JtagClock
SYStem.LOCK
©1989-2015 Lauterbach GmbH
eTPU Debugger and Trace
17
Configure debugger according to target topology
1
SYStem.MemAccess
Run-time memory access (non-intrusive)
SYStem.Mode
20
Select operation mode
20
Use byte addressing for eTPU memory space
21
Implicitly use run-time memory access
21
CPU specific SYStem Commands ...................................................................................
22
SYStem.Option ByteWise
SYStem.Option DUALPORT
SYStem.Option FreezeCLKS
Freeze eTPU clocks if eTPU halted
22
SYStem.Option FreezePINS
Freeze pins if eTPU is halted
22
NEXUS specific SYStem Settings ....................................................................................
NEXUS.BTM
NEXUS.CHAN
NEXUS.CLIENT<x>.MODE
NEXUS.CLIENT<x>.SELECT
23
Control for branch trace messages
23
Enable CHAN register write trace messages
23
Set data trace mode of nexus client
23
Select a nexus client for data tracing
24
NEXUS.DTM
Control for data trace messages
24
NEXUS.OFF
Switch the NEXUS trace port off
24
NEXUS.ON
Switch the NEXUS trace port on
24
NEXUS.OTM
Enable ownership trace messages
25
NEXUS.PortMode
Define MCKO frequency
25
NEXUS.PortSize
Define the width of MDO
25
Program trace enable per channel
26
NEXUS.PTCE
NEXUS.Register
Display NEXUS trace control registers
26
NEXUS.RESet
Reset NEXUS trace port settings
26
NEXUS.STALL
Stall the program execution
26
Display NEXUS port configuration window
27
CPU specific TrOnchip Commands .................................................................................
28
NEXUS.state
TrOnchip.BusTrigger
Trigger bus on debug event
28
Halt on client breakpoint input
28
Select client breakpoint timing condition
28
Adjust range breakpoint in on-chip resource
29
Use EVTI signal to stop the program execution
29
External signals
30
TrOnchip.HTWIN
Halt on twin engine breakpoint
30
TrOnchip.RESet
Reset on-chip trigger settings
30
Select channels for that breakpoints are effective
30
Break on debug event
31
Set filter for the trace
31
TrOnchip.TOFF
Switch the sampling to the trace to OFF
32
TrOnchip.TON
TrOnchip.CBI
TrOnchip.CBT
TrOnchip.CONVert
TrOnchip.EVTI
TrOnchip.EXTernal
TrOnchip.SCM
TrOnchip.Set
TrOnchip.TEnable
Switch the sampling to the trace to “ON”
32
TrOnchip.TraceTrigger
Trigger trace on debug event
32
TrOnchip.VarCONVert
Adjust complex breakpoint in on-chip resource
33
Display on-chip trigger window
33
Complex Trigger Unit ........................................................................................................
34
TrOnchip.view
Usage
34
©1989-2015 Lauterbach GmbH
eTPU Debugger and Trace
2
Complex Trigger Examples for eTPU
35
Keywords for the Complex Trigger Unit
36
JTAG Connector ................................................................................................................
Mechanical Description
37
37
JTAG Connector MPC55XX (OnCE)
37
Connector for COLDFIRE
37
Support ...............................................................................................................................
38
Compilers
38
3rd Party Tool Integrations
38
Realtime Operation Systems
40
Products .............................................................................................................................
41
Product Information
41
Order Information
42
©1989-2015 Lauterbach GmbH
eTPU Debugger and Trace
3
eTPU Debugger and Trace
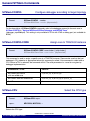
Version 06-Nov-2015
30-Jun-14
TrBus.Out and TrBus.Set were moved to general_ref_t.pdf.
General Note
This documentation describes the processor specific settings and features for TRACE32-ICD for the eTPU
core.
If some of the described functions, options, signals or connections in this Processor Architecture Manual are
only valid for a single CPU or for specific families, the name(s) of the family(ies) is added in brackets.
Brief Overview of Documents for New Users
Architecture-independent information:
•
”Debugger Basics - Training” (training_debugger.pdf): Get familiar with the basic features of a
TRACE32 debugger.
•
”T32Start” (app_t32start.pdf): T32Start assists you in starting TRACE32 PowerView instances
for different configurations of the debugger. T32Start is only available for Windows.
•
“General Commands” (general_ref_<x>.pdf): Alphabetic list of debug commands.
Architecture-specific information:
•
“Processor Architecture Manuals”: These manuals describe commands that are specific for the
processor architecture supported by your debug cable. To access the manual for your processor
architecture, proceed as follows:
-
•
Choose Help menu > Processor Architecture Manual.
“RTOS Debugger” (rtos_<x>.pdf): TRACE32 PowerView can be extended for operating systemaware debugging. The appropriate RTOS manual informs you how to enable the OS-aware
debugging.
©1989-2015 Lauterbach GmbH
eTPU Debugger and Trace
4
General Note
Warning
Signal Level
MPC55XX
The debugger drives the output pins of the JTAG/OnCE connector with the same
level as detected on the VCCS pin. If the IO pins of the processor are 3.3 V
compatible then the VCCS should be connected to 3.3 V.
ESD Protection
NOTE:
To prevent debugger and target from damage it is recommended to connect or
disconnect the debug cable only while the target power is OFF.
Recommendation for the software start:
1.
Disconnect the debug cable from the target while the target power is
off.
2.
Connect the host system, the TRACE32 hardware and the debug
cable.
3.
Power ON the TRACE32 hardware.
4.
Start the TRACE32 software to load the debugger firmware.
5.
Connect the debug cable to the target.
6.
Switch the target power ON.
7.
Configure your debugger e.g. via a start-up script.
Power down:
1.
Switch off the target power.
2.
Disconnect the debug cable from the target.
3.
Close the TRACE32 software.
4.
Power OFF the TRACE32 hardware.
©1989-2015 Lauterbach GmbH
eTPU Debugger and Trace
5
Warning
Target Design Requirement/Recommendations
General
•
Locate the JTAG/OnCE/Nexus connector as close as possible to the processor to minimize the
capacitive influence of the trace length and cross coupling of noise onto the BDM signals.
•
Ensure that the debugger signal (HRESET) is connected directly to the HRESET of the
processor. This will provide the ability for the debugger to drive and sense the status of HRESET.
The target design should only drive the HRESET with open collector, open drain. HRESET
should not be tied to PORESET, because the debugger drives the HRESET and DSCK to enable
BDM operation.
©1989-2015 Lauterbach GmbH
eTPU Debugger and Trace
6
Target Design Requirement/Recommendations
Quick Start eTPU Debugger
Starting up the debugger is done as follows.
NOTE: Debugger for e200 (or ColdFire) has to be started and configured first.
1.
Set the CPU type to load the CPU specific settings.:
SYStem.CPU MPC5676R
2.
Configure select target core. See SYStem.CONFIG.CORE for details.
SYStem.CONFIG.CORE <core-index>. 1.
3.
Start debug session by attaching to the eTPU:
SYStem.Mode.Attach
4.
Break eTPU and initialize program and data memory (optional).
Break
Data.Set P:0x0000--0x0BFF %Long 0xFFFFFFFF
Data.Set D:0x0000--0x02FF %Long 0xDEADDEAD
Go
5.
Load the debug symbols. The program code will be usually loaded by the master core (Coldfire/
PowerPC)
Data.LOAD.Elf app.elf /NoCODE /NoRegister
6.
Set up breakpoint(s) and run master CPU afterwards:
Break.Set func_increment /Onchip
7.
Or set a debug event on a service request:
TrOnchip.Set HSR ON
©1989-2015 Lauterbach GmbH
eTPU Debugger and Trace
7
Quick Start eTPU Debugger
Troubleshooting
No information available.
©1989-2015 Lauterbach GmbH
eTPU Debugger and Trace
8
Troubleshooting
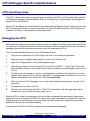
FAQ
Debugging via
VPN
The debugger is accessed via Internet/VPN and the performance is very
slow. What can be done to improve debug performance?
The main cause for bad debug performance via Internet or VPN are low data
throughput and high latency. The ways to improve performance by the debugger
are limited:
in practice scripts, use "SCREEN.OFF" at the beginning of the script and
"SCREEN.ON" at the end. "SCREEN.OFF" will turn off screen updates.
Please note that if your program stops (e.g. on error) without executing
"SCREEN.OFF", some windows will not be updated.
"SYStem.POLLING SLOW" will set a lower frequency for target state
checks (e.g. power, reset, jtag state). It will take longer for the debugger to
recognize that the core stopped on a breakpoint.
"SETUP.URATE 1.s" will set the default update frequency of Data.List/
Data.dump/Variable windows to 1 second (the slowest possible setting).
prevent unneeded memory accesses using "MAP.UPDATEONCE
[address-range]" for RAM and "MAP.CONST [address--range]" for ROM/
FLASH. Address ranged with "MAP.UPDATEONCE" will read the specified
address range only once after the core stopped at a breakpoint or manual
break. "MAP.CONST" will read the specified address range only once per
SYStem.Mode command (e.g. SYStem.Up).
©1989-2015 Lauterbach GmbH
eTPU Debugger and Trace
9
FAQ
Setting a
Software
Breakpoint fails
What can be the reasons why setting a software breakpoint fails?
Setting a software breakpoint can fail when the target HW is not able to
implement the wanted breakpoint.
Possible reasons:
The wanted breakpoint needs special features that are only possible to
realize by the trigger unit inside the controller.
Example: Read, write and access (Read/Write) breakpoints ("type" in Break.Set
window). Breakpoints with checking in real-time for data-values ("Data").
Breakpoints with special features ("action") like TriggerTrace, TraceEnable,
TraceOn/TraceOFF.
TRACE32 can not change the memory.
Example: ROM and Flash when no preparation with FLASH.Create,
FLASH.TARGET and FLASH.AUTO was made. All type of memory if the
memory device is missing the necessary control signals like WriteEnable or
settings of registers and SpecialFunctionRegisters (SFR).
Contrary settings in TRACE32.
Like: MAP.BOnchip for this memory range. Break.SELect.<breakpoint-type>
Onchip (HARD is only available for ICE and FIRE).
RTOS and MMU:
If the memory can be changed by Data.Set but the breakpoint doesn't work it
might be a problem of using an MMU on target when setting the breakpoint to a
symbolic address that is different than the writable and intended memory
location.
eTPU
Halt eTPU
when e200
halts without
using eTPU
debugger
Can I halt and start the eTPU synchronized to the e200 core, without using
the eTPU debugger?
When the eTPU debugger is used, synchronized debugging is enabled using
the command
Without eTPU debugger, run control can be synchronized to the e200 core by
enabling DC[DBE] and DC[CBI] in the NDEDI block. The DC register is
accessible through the NEXUS.Register window of the e200 debugger.
Commands for MPC5746R
©1989-2015 Lauterbach GmbH
eTPU Debugger and Trace
10
FAQ
eTPU
View channel
base relative
variables
Some variables can not be displayed with run-time memory access (i.e.
while the eTPU is running), even if the variable is declared static. How can
this variables displayed?
eTPU variables can be bound to a context, i.e. even static sariables can have an
address which is relative to the channel base address. While the eTPU runs, the
current context can not be determined, so the debugger can not display these
variables.
There are three ways to configure the debugger to displays those types of
variable:
Generate static copies of the variables for each channel.
There is a ready-to-use script available in the folder demo\etpu\etc\channelvars.
Please refer to readme.txt in the same folder for instructions.
Casting "trick":
Stop inside a function where this variable is used
Show the address of that variable in a window
&event_ref_count"
"Variable.View %e
Right click on the address and select "Show Constant" from the pulldown
This will open another window that shows the same variable as typecast
from a fixed address (which will remain valid even when the core runs)
Register.GOTO command:
Select the scope AND channel base with Register.GOTO, e.g. "Register.GOTO My_eTPU_FUNC <CHBASE>".
The second parameter is the value of CHBASE for the channel in which
you expect the code to run.
It is possible to use the "host" memory access class (H:) to extract this
information from the PowerPC side.
Show the local variable with "Variable.View %e event_ref_count"
Note: Stopping the core will revert to "normal" display of variables
©1989-2015 Lauterbach GmbH
eTPU Debugger and Trace
11
FAQ
Configuration
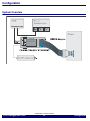
System Overview
©1989-2015 Lauterbach GmbH
eTPU Debugger and Trace
12
Configuration
©1989-2015 Lauterbach GmbH
eTPU Debugger and Trace
13
Configuration
eTPU Debugger Specific Implementations
eTPU operating modes
The eTPU is event driven. When no service request is pending, the eTPU is in IDLE mode. When the eTPU
is halted by the debugger (command Break) while it is not processing a service request, the debugger will
display IDLE in the status line.
When IDLE, the register set is invalid and will not be displayed in the Register window. There is also no valid
MPC (microprogram counter, i.e. instruction pointer) in this state. Therefore Data.List will fail, but Data.List
<address> or Data.List <function/label> can be always used.
Debugging the eTPU
Before the eTPU debug session can be started, the main core (e200 or ColdFire) has to initialize the eTPUs
i.e. load the eTPU program and initiate a host service request. Make sure that the eTPUs are not halted for
debugging, because this would prevent the main core from accessing the eTPUs.
This is the recommended method to start an eTPU debug session:
1.
Program main application to FLASH using main core (if not already programmed)
2.
Reset processor and begin debug session on main core (SYStem.Up)
3.
Begin eTPU debug session using SYStem.Mode.Attach
4.
Load debug symbols for all main and eTPU cores (Data.LOAD.Elf ....). Note: The eTPUs have
their own debug symbols. The source file of the main core does not include debug symbols of the
eTPUs.
5.
To debug a service request or function, set a Breakpoint or enable a debug event on a service
request. When another eTPU uses the same SCM, i is recommended to enable the “halt on twin
engine” debug event on the other eTPU. See TrOnchip.HTWIN.
6.
Make sure that all eTPU debuggers are in state running (green filed displaying “running” in the
status bar)
7.
Run application on main core (Go).
8.
The main core will initialize the eTPUs. The eTPU should halt for the debugger when the set
breakpoint or service request’s debug event occurs.
While an eTPU is halted for the debugger, it will not process any pending service requests. Some target
applications wait for a response from an eTPU and in some cases it was seen that a halted eTPU caused a
processor reset (e.g. by watchdog) in this case. Make sure that the main core’s application can handle a
halted eTPU e.g. by deactivating the watchdog.
On processors with eTPU2, the eTPU watchdog must be disabled for debugging.
©1989-2015 Lauterbach GmbH
eTPU Debugger and Trace
14
eTPU Debugger Specific Implementations
Breakpoints and Watchpoints
There are two types of breakpoints available: Software breakpoints (SW-BP) and on-chip breakpoints (HWBP).
Software Breakpoints
The debugger will use software breakpoints as default. The debugger supports an unlimited number of
software breakpoints.When using software breakpoints, MISC has to be disabled.
On a chip with more than one eTPU, the SCM (shared code memory) is only visible if both eTPUs
connected to the same SCM (A and B) are stopped. Therefore, using software breakpoints is not supported
in all cases, esp. if special break conditions (CBI, HTWIN) are enabled.
In systems with two eTPUs connected to the same SCM, software breakpoints will be visible for both cores.
If both eTPUs run the same code, on-chip breakpoints should be used.
On-chip Breakpoints/Watchpoints
An eTPU has two on-chip break-/watchpoints. They can be used to
•
generate a debug event (core halts for debugger)
•
generate a watchpoint hit trace message
•
enable/disable trace message generation when the event occurs.
The on-chip break-/watchpoints can be configured for
•
instruction address comparison (instruction break/watchpoint)
•
data address comparison (optional with data value comparison)
In addition, the break/watchpoints can be enabled for one channel, all channels or a certain set of channels.
See TrOnchip.SCM for details.
Breakpoints/Watchpoints on Service Request or channel register write
The eTPU supports also debug events on service request starts and on channel register writes. See
TrOnchip.Set for details. Like the on-chip break/watchpoints, they can be can be enabled for one channel,
all channels or a certain set of channels.
The debugger uses watchpoints on service request starts and on channel register writes to generate a
trigger signal (TrOnchip.BusTrigger) or to stop the trace recording (TrOnchip.TraceTrigger).
©1989-2015 Lauterbach GmbH
eTPU Debugger and Trace
15
eTPU Debugger Specific Implementations
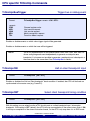
Memory Classes
The following memory classes are available:
Memory Class
Description
P
Program Memory (SCM)
D
Data Memory (SPRAM)
H
Memory space of the main core (HOST)
Address Spaces and Addressing Modes
The eTPU cores have an address space which is independent of the main core (e200 or ColdFire). Also
program and data address space is separated (harvard architecture).
In opposite to the main core, which uses byte addressing, the eTPU uses addresses it’s memory in 32-bit
words. The following table shows some examples:
eTPU address
main core address
eTPU_A/B SCM
P:0x0000
MPC5XXX: A:0xC3FD0000
ColdFire: IPSBAR + 0x1E0000
eTPU_A/B SCM
P:0x0001
MPC5XXX: A:0xC3FD0004
ColdFire: IPSBAR + 0x1E00004
eTPU_C SCM
P:0x0000
MPC5XXX: A:0xC3E30000
ETPU_A/B SPRAM
D:0x0000
MPC5XXX: A:0xC3FC8000
ColdFire: IPSBAR + 0x1D8000
ETPU_A/B SPRAM
D:0x0001
MPC5XXX: A:0xC3FC8004
ColdFire: IPSBAR + 0x1D8004
ETPU_C SPRAM
D:0x0000
MPC5XXX: A:0xC3E28000
If two eTPUs share one SCM (e.g. eTPU_a and eTPU_B), SCM is only accessible if both eTPUs are
stopped.
©1989-2015 Lauterbach GmbH
eTPU Debugger and Trace
16
eTPU Debugger Specific Implementations
General SYStem Commands
SYStem.CONFIG
Format:
Configure debugger according to target topology
SYStem.CONFIG <mode>
SYStem.MultiCore <mode> (deprecated)
For the description of SYStem.CONFIG commands, refer to the debugger manual for the main core in
SYStem.CONFIG in ”Qorivva MPC5xxx/SPC5xx Debugger and NEXUS Trace”
(debugger_mpc5500.pdf). This setting is only available for CPUs with JTAG as debug port (not available for
BDM).
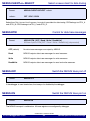
SYStem.CONFIG.CORE
Format:
Assign core to TRACE32 instance
SYStem.CONFIG CORE <core-index> [<chip-index>]
SYStem.MutiCore.Core <core-index> (deprecated)
This command is used to assign a specific core to a TRACE32 instance. Please make sure that the host
debugger’s CPU selection is appropriate before this command is called. If this command is called while a
CPU without eTPU is selected, the command will fail. The valid parameters for <core-id> are given by
debugger implementation:
Architecture / eTPU
Core-ID
MPC5XXX/SPC56XX
with one e200 core
2 (eTPU_A), 3 (eTPU_B)
MPC5XXX with two e200 cores
3 (eTPU_A), 4 (eTPU_B), 5 (eTPU_C)
ColdFire
2
SYStem.CPU
Select the CPU type
Format:
SYStem.CPU <cpu>
<cpu>:
MPC5554, MCF5232, ...
Selects the CPU type.
©1989-2015 Lauterbach GmbH
eTPU Debugger and Trace
17
General SYStem Commands
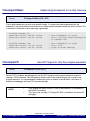
SYStem.CpuAccess
Run-time memory access (intrusive)
Format:
SYStem.CpuAccess <mode>
<mode>:
Enable | Denied | Nonstop
Enable
In order to perform a memory read or write while the CPU is executing the
program. the debugger stops the program execution shortly.
Each short stop takes 1 … 100 ms depending on the speed of the debug
interface and on the size of the read/write accesses required.
Denied
No memory read or write is possible while the CPU is executing the program.
Nonstop
Nonstop ensures that the program execution can not be stopped and that the
debugger doesn’t affect the real-time behavior of the CPU.
Nonstop reduces the functionality of the debugger to:
•
run-time access to memory and variables
•
trace display
The debugger inhibits the following:
•
to stop the program execution
•
all features of the debugger that are intrusive (e.g. spot breakpoints, performance analysis via StopAndGo, conditional breakpoints etc.)
SYStem.JtagClock
Format:
Select the debug clock frequency
SYStem.JtagClock <frequency>
SYStem.BdmClock <frequency>
<rate>:
1 000 000. … 50 000 000. (Default 4 MHz)
NOTE:
•
•
If possible, use the same JTAG clock frequency for all cores debugged
with the same debug interface.
MPC55XX: the max. allowed JTAG clock frequency is 1/4th of the core
frequency.
©1989-2015 Lauterbach GmbH
eTPU Debugger and Trace
18
General SYStem Commands
SYStem.LOCK
Format:
Lock and tristate the debug port
SYStem.LOCK [ON | OFF]
Default: OFF.
If the system is locked, no access to the debug port will be performed by the debugger. While locked, the
debug connector of the debugger is tristated. The main intention of the lock command is to give debug
access to another tool.
The command has no effect for the simulator.
©1989-2015 Lauterbach GmbH
eTPU Debugger and Trace
19
General SYStem Commands
SYStem.MemAccess
Run-time memory access (non-intrusive)
Format:
SYStem.MemAccess <mode>
<mode>:
Denied | CPU | NEXUS
This option declares if and how a non-intrusive memory access can take place while the CPU is executing
code. Although the CPU is not halted, run-time memory access creates an additional load on the
processor’s internal data bus.
The run-time memory access has to be activated for each window by using the memory class E: (e.g.
Data.dump E:0x100) or by using the format option %E (e.g. Var.View %E var1). It is also possible to activate
this non-intrusive memory access for all memory ranges displayed on the TRACE32 screen by setting
SYStem.Option DUALPORT ON.
Denied
Memory access is disabled while the CPU is executing code.
CPU
The debugger performs memory accesses via a dedicated CPU interface.
NEXUS
Memory access is done via the NEXUS interface. Available for MPC55XX/
MPC56XX family, for both the NEXUS and JTAG-only debugger.
SYStem.Mode
Select operation mode
Format:
SYStem.Mode <mode>
<mode>:
Down | Attach
Select target reset mode.
Down
Disables the Debugger. The state of the CPU remains unchanged.
Attach
Establishes connection to the eTPU.
NoDebug
Go
StandBy
Up
Not applicable for eTPU.
©1989-2015 Lauterbach GmbH
eTPU Debugger and Trace
20
General SYStem Commands
SYStem.Option ByteWise
Format:
Use byte addressing for eTPU memory space
SYStem.Option ByteWise [ON | OFF]
The eTPU addresses data and code memory in 32-bit (words). In the default setting (OFF), the debugger
addresses the eTPU memories also in 32-bit words.
There are however instructions, which can modify partitions of a 32-bit word (byte and 24-bit operations). In
this case, it might be more convenient to address the eTPU memories in byte units.
Set this option to ON to configure the debugger to use byte addressing. This setting should only be changed
before the debug session begins.
SYStem.Option DUALPORT
Format:
Implicitly use run-time memory access
SYStem.Option DUALPORT [ON | OFF]
Forces all list, dump and view windows to use the memory class E: (e.g. Data.dump E:0x100) or to use the
format option %E (e.g. Var.View %E var1) without being specified. Use this option if you want all windows to
be updated while the processor is executing code. This setting has no effect if
SYStem.Option.MemAccess is disabled.
©1989-2015 Lauterbach GmbH
eTPU Debugger and Trace
21
General SYStem Commands
CPU specific SYStem Commands
SYStem.Option FreezeCLKS
Format:
Freeze eTPU clocks if eTPU halted
SYStem.Option FreezeCLKS [ON | OFF]
Stop TCR clocks. Controls whether the TCR clocks from the eTPU stop running when the eTPU is halted for
the debugger.
SYStem.Option FreezePINS
Format:
Freeze pins if eTPU is halted
SYStem.Option FreezePins [ON | OFF]
Stop pins in debug mode. Controls whether the eTPU pins are sampled when the eTPU is halted for the
debugger. When set to ON, the pins are not sampled during debug mode. The pins are sampled during
normal single steps.
©1989-2015 Lauterbach GmbH
eTPU Debugger and Trace
22
CPU specific SYStem Commands
NEXUS specific SYStem Settings
Note: The following processors do not include a NEXUS trace module (tracing not possible):
•
MPC563xM, SPC563M (Monaco)
•
MPC564xA, SPC564A (Andorra)
•
eTPU in ColdFire processors
NEXUS.BTM
Format:
Control for branch trace messages
NEXUS.BTM [ON | OFF]
SYStem.Option BTM [ON | OFF] (deprecated)
Control for the NEXUS branch trace messages.
NEXUS.CHAN
Format:
Enable CHAN register write trace messages
NEXUS.CHAN [ON | OFF]
SYStem.Option CHAN [ON | OFF] (deprecated)
Control for the NEXUS channel register write trace messages. CHAN register write tracing requires the
channel being serviced to have program trace enabled.
NEXUS.CLIENT<x>.MODE
Format:
Set data trace mode of nexus client
NEXUS.CLIENT1.MODE [OFF | Read | Write | ReadWrite]
Sets the data trace mode of the selected trace client. Select the trace client using
NEXUS.CLIENT<x>.SELECT before setting the trace mode.
©1989-2015 Lauterbach GmbH
eTPU Debugger and Trace
23
NEXUS specific SYStem Settings
NEXUS.CLIENT<x>.SELECT
Select a nexus client for data tracing
Format:
NEXUS.CLIENT1.SELECT <client>
<client>:
OFF | CDC | CDC2
Select the eTPU Coherent Dual-Parameter Controller’s trace client for data tracing. CDC belongs to eTPU_A
and aTPU_B, CDC2 belongs to eTPU_C and eTPU_D.
NEXUS.DTM
Control for data trace messages
Format:
NEXUS.DTM [OFF | Read | Write | ReadWrite]
SYStem.Option DTM [OFF | Read | Write | ReadWrite] (deprecated)
OFF (default)
No data trace messages are output by NEXUS.
Read
NEXUS outputs data trace messages for read accesses.
Write
NEXUS outputs data trace messages for write accesses.
ReadWrite
NEXUS outputs data trace messages for read and write accesses.
NEXUS.OFF
Format:
Switch the NEXUS trace port off
NEXUS.OFF
If the debugger is used stand-alone, the trace port is disabled by the debugger.
NEXUS.ON
Format:
Switch the NEXUS trace port on
NEXUS.ON
The NEXUS trace port is switched on. All trace registers are configured by debugger.
©1989-2015 Lauterbach GmbH
eTPU Debugger and Trace
24
NEXUS specific SYStem Settings
NEXUS.OTM
Format:
Enable ownership trace messages
NEXUS.OTM [ON | OFF]
SYStem.Option OTM [ON | OFF] (deprecated)
Enables ownership trace messaging. On the eTPU, an OTM is generated each time a channel starts or
ends and contains (amongst others) channel number and HSR ID. The information of OTMs is displayed in
the flow trace and also in trace chart views (e.g. Trace.CHART.TASKSRV)
NEXUS.PortMode
Define MCKO frequency
Format:
NEXUS.PortMode <divider>
SYStem.Option MCKO <divider> (deprecated)
<divider>
1/1 | 1/2 | 1/3 | 1/4 | 1/8
Set the frequency of MCKO relative to the core frequency. The port mode setting must be the same for all
cores (e200 and eTPU).
NEXUS.PortSize
Define the width of MDO
Format:
NEXUS.PortSize <portsize>
SYStem.Option NEXUS <portsize> (deprecated)
<portsize>:
MDO2, MDO4, MDO8, MDO12, MDO16
The width of MDO can only be set if the SYStem mode is DOWN. The port size setting must be the same for
all cores (e200 and eTPU).
©1989-2015 Lauterbach GmbH
eTPU Debugger and Trace
25
NEXUS specific SYStem Settings
NEXUS.PTCE
Program trace enable per channel
Format:
NEXUS.PTCE <value>
SYStem.Option PTCE <value> (deprecated)
<value>:
bit mask [ch31, ch30, ch29 … ch1, ch0]
Enables program trace for channels, which have the regarding bit of the value set to one. e.g. 0x00000009:
enable program trace for channel 0 and 4.
NEXUS.Register
Format:
Display NEXUS trace control registers
NEXUS.Register
This command opens a window which shows the NEXUS configuration and status registers of NPC, core
and other trace clients.
NEXUS.RESet
Format:
Reset NEXUS trace port settings
NEXUS.RESet
Resets NEXUS trace port settings to default settings.
NEXUS.STALL
Format:
Stall the program execution
NEXUS.STALL [OFF | ON]
SYStem.Option STALL [ON | OFF] (deprecated)
Stall the program execution whenever the on-chip NEXUS-FIFO threatens to overflow. If this option is
enabled, the NEXUS port controller will stop the core’s execution pipeline until all messaged in the on-chip
NEXUS FIFO are sent. Enabling this command will affect (delay) the instruction execution timing of the CPU.
This system option, which is a representation of a feature of the processor, will remarkably reduce the
amount FIFO OVERFLOW errors, but can not avoid them completely.
©1989-2015 Lauterbach GmbH
eTPU Debugger and Trace
26
NEXUS specific SYStem Settings
NEXUS.state
Format:
Display NEXUS port configuration window
NEXUS.state
Display NEXUS trace configuration window.
©1989-2015 Lauterbach GmbH
eTPU Debugger and Trace
27
NEXUS specific SYStem Settings
CPU specific TrOnchip Commands
TrOnchip.BusTrigger
Trigger bus on debug event
Format:
TrOnchip.BusTrigger <event> <ON | OFF>
<event>:
CRW
HSR
LINK
MRL
TDL
Channel register write.
Host service request.
Link service request.
Match recognition request.
Transition detect request.
Enables or disables events on which a bus trigger signal will be generated.
Enables or disables events on which the trace will be triggered.
NOTE:
The eTPU implementation for the special events CRW, HSR, LINK, MRL and TDL
allows configuring each event independently to generate a watchpoint or a
breakpoint. It is however not possible to generate a watchpoint and a breakpoint at
the same time for the same event. See TrOnchip.Set for details.
TrOnchip.CBI
Format:
Halt on client breakpoint input
TrOnchip.CBI [ON | OFF]
Enables or disables the “Halt on Client breakpoint” break condition. If enabled, the eTPU will halt and run
synchronized to the master core (e.g. PowerPC).
TrOnchip.CBT
Format:
Select client breakpoint timing condition
TrOnchip.CBT [ON | OFF]
With this setting you can select how the eTPU should react on a client breakpoint input / twin engine
breakpoint. If this setting is OFF (default), the eTPU will stop on completion of the current micro cycle. If ON,
it will stop on completion of the current instruction thread, i.e. the eTPU only stop when it is in IDLE mode.
©1989-2015 Lauterbach GmbH
eTPU Debugger and Trace
28
CPU specific TrOnchip Commands
TrOnchip.CONVert
Format:
Adjust range breakpoint in on-chip resource
TrOnchip.CONVert [ON | OFF]
The on-chip breakpoints can only cover specific ranges. If a range cannot be programmed into the
breakpoint it will automatically be converted into a single address breakpoint when this option is active. This
is the default. Otherwise an error message is generated.
TrOnchip.CONVert ON
Break.Set 0x1000--0x17ff /Write
Break.Set 0x1001--0x17ff /Write
…
; sets breakpoint at range
; 1000--17ff sets single breakpoint
; at address 1001
TrOnchip.CONVert OFF
Break.Set 0x1000--0x17ff /Write
Break.Set 0x1001--0x17ff /Write
; sets breakpoint at range
; 1000--17ff
; gives an error message
TrOnchip.EVTI
Format:
Use EVTI signal to stop the program execution
TrOnchip.EVTI [ON | OFF]
Default: OFF. If enabled, the debugger will use the EVTI signal to break program execution instead of
sending a JTAG command. This will speed up reaction time. If the complex trigger unit is used to stop
program execution, it is recommended to enable this option to achieve a shorter delay. If this option is
disabled, the debugger will drive EVTI permanently high.
NOTE:
•
•
Only enable this option if the EVTI pin of the processor is connected to
the NEXUS connector.
This option has no effect if TrOnchip.EVTEN is disabled in the PowerPC
debugger.
©1989-2015 Lauterbach GmbH
eTPU Debugger and Trace
29
CPU specific TrOnchip Commands
TrOnchip.EXTernal
External signals
Format:
TrOnchip.EXTernal <input>
<input>:
OFF
IN0
IN1
Enables / selects a external input to trigger the trace. The inputs are locates at the TRACE32 Nexus
Adapter.
TrOnchip.HTWIN
Format:
Halt on twin engine breakpoint
TrOnchip.HTWIN [ON | OFF]
Enables or disables the “Halt on Twin Engine” breakpoint. If enabled, the eTPU will halt and run
synchronized to the eTPU connected to the same SCM.
TrOnchip.RESet
Format:
Reset on-chip trigger settings
TrOnchip.RESet
Resets the trigger system to the default state.
TrOnchip.SCM
Select channels for that breakpoints are effective
Format:
TrOnchip.SCM <value / bitmask>
<value/
bitmask>:
A value or bit mask to specify service channels
On-chip instruction and data address breakpoints/watchpoints by default match for any service channel. If
the SCM value is different from “0xxx”, these breakpoints/watchpoints will only be effective for those
channels that match to the used value/bit mask.
©1989-2015 Lauterbach GmbH
eTPU Debugger and Trace
30
CPU specific TrOnchip Commands
TrOnchip.Set
Break on debug event
Format:
TrOnchip.Set <event> <ON | OFF>
TrOnchip.Set SCM <value/bitmask>
SCM
<event>:
CRW
HSR
LINK
MRL
TDL
<value/
bitmask>
Service channel number mask, value or bitmask are allowed.
Channel register write.
Host service request.
Link service request.
Match recognition request.
Transition detect request.
A value or bit mask to specify service channels
Enables or disables events on which the eTPU core will be halted. If the SCM value is different from “0xxx”,
then the events will occur only if the current service channel number matches the SCM setting. Please refer
to the eTPU user’s manual for more information.
NOTE:
The eTPU implementation for the special events CRW, HSR, LINK, MRL and TDL
allows configuring each event independently to generate a watchpoint or a
breakpoint. It is however not possible to generate a watchpoint and a breakpoint at
the same time for the same event.
For example Tronchip.Set HSR ON (breakpoint on HSR) can not be used together with
Tronchip.TraceTrigger HSR ON (trace trigger on HSR) or TrOnchip.BusTrigger HSR ON (bus
trigger on HSR). TraceTrigger and BusTrigger events can be enabled at the same time, because both
configure for watchpoints.
If both breakpoint and watchpoint on a special event are enabled, the resulting action is undefined.
TrOnchip.TEnable
Format:
Set filter for the trace
TrOnchip.TEnable <par>
Obsolete command. Refer to the Break.Set command to set trace filters.
©1989-2015 Lauterbach GmbH
eTPU Debugger and Trace
31
CPU specific TrOnchip Commands
TrOnchip.TOFF
Format:
Switch the sampling to the trace to OFF
TrOnchip.TOFF
Obsolete command. Refer to the Break.Set command to set trace filters.
TrOnchip.TON
Format:
Switch the sampling to the trace to “ON”
TrOnchip.TON EXT | Break
Obsolete command. Refer to the Break.Set command to set trace filters.
TrOnchip.TraceTrigger
Trigger trace on debug event
Format:
TrOnchip.TraceTrigger <event> <ON | OFF>
<event>:
CRW
HSR
LINK
MRL
TDL
Channel register write.
Host service request.
Link service request.
Match recognition request.
Transition detect request.
Enables or disables events on which the trace will be triggered.
NOTE:
The eTPU implementation for the special events CRW, HSR, LINK, MRL and TDL
allows configuring each event independently to generate a watchpoint or a
breakpoint. It is however not possible to generate a watchpoint and a breakpoint at
the same time for the same event. See TrOnchip.Set for details.
©1989-2015 Lauterbach GmbH
eTPU Debugger and Trace
32
CPU specific TrOnchip Commands
TrOnchip.VarCONVert
Format:
Adjust complex breakpoint in on-chip resource
TrOnchip.VarCONVert [ON | OFF]
The on-chip breakpoints can only cover specific ranges. If you want to set a marker or breakpoint to a
complex variable, the on-chip break resources of the CPU may be not powerful enough to cover the whole
structure. If the option TrOnchip.VarCONVert is ON the breakpoint will automatically be converted into a
single address breakpoint. This is the default setting. Otherwise an error message is generated.
TrOnchip.view
Format:
Display on-chip trigger window
TrOnchip.view
Open TrOnchip window.
©1989-2015 Lauterbach GmbH
eTPU Debugger and Trace
33
CPU specific TrOnchip Commands
Complex Trigger Unit
Usage
The Complex Trigger Unit for eTPU is only available for the NEXUS class2/3+ debugger. It is only supported
for NEXUS port sizes MDO8, MDO12 and MDO16
The Complex Trigger Unit for eTPU can not be programmed through the Analyzer.Program dialog in the
eTPU debugger. Use the dialog of the PowerPC debugger instead. In order to declare an event for a eTPU
NEXUS message, add the option /<source> to the event.
Example:
OTME task_count1 0x0900 /ETPU1
OTME task_count2 0x0100 /ETPU2
Complex Trigger programs can handle PowerPC and eTPU events at the same time. It is possible to e.g.
start tracing on a PowerPC action and stop at an eTPU action.
NOTE:
For all events based on NEXUS trace messages, please make sure that the
corresponding message type in enabled in the eTPU SYStem window, e.g. OTMEs
need owner trace messages enabled. See “NEXUS specific SYStem Settings”
for details.
©1989-2015 Lauterbach GmbH
eTPU Debugger and Trace
34
Complex Trigger Unit
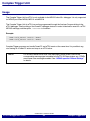
Complex Trigger Examples for eTPU
Here are some examples on eTPU specific complex trigger programs. Please see ”Trace Filtering and
Triggering with Debug Events” (debugger_mpc5500.pdf) for a detailed description and more examples on
general complex trigger features.
Example 1: Break if eTPU executed a task a given number of times
; Example
Trace.Program time_watch
; open a trace programming window to enter
; the trigger program for the CTU
; trigger program
OTME task_start 0x0900 /ETPU1
OTME task_end
0x0000 /ETPU1
; event on eTPU1-OTM (task start)
; event on eTPU1-OTM (task end)
EVENTCOUNTER taskcount 1000.
; task counter for 1000 events
start:
Counter.Increment taskcount, GOTO intask IF task_start
intask:
GOTO start IF task_end
BREAK.PROGRAM IF taskcount
Go
Example 2: Break if eTPU task execution time exceeds a maximum time
; Example
; open a trace programming window to
; enter
; the trigger program for the CTU
Trace.Program time_watch
; trigger program
OTME task_start 0x0900 /ETPU1
OTME task_end
0x0000 /ETPU1
TIMECOUNTER
tasktime 2.400ms
start:
GOTO intask if task_start
intask:
Counter.Increment tasktime
Counter.Restart
tasktime
GOTO start
BREAK.PROGRAM
Go
; event on eTPU1-OTM (task start)
; event on eTPU1-OTM (task end)
; timer 2.4 ms
IF task_end
IF task_end
IF tasktime&&!task_end
©1989-2015 Lauterbach GmbH
eTPU Debugger and Trace
35
Complex Trigger Unit
Keywords for the Complex Trigger Unit
Input Event
Meaning
IN
external input event IN0 or IN1 occurred
CRWM, TCODE_3C, TCODE_CRWM
channel register write message
CSSM, TCODE_3A, TCODE_CSSM
channel start service message
CTEM, TCODE_3B, TCODE_CTEM
channel trace enable message
DRM, TCODE_6, TCODE_DRM
data read message
DRSM, TCODE_E, TCODE_DRSM
data read sync message
DSM, TCODE_0, TCODE_DSM
debug status message
DWM, TCODE_5, TCODE_DWM
data write message
DWSM, TCODE_D, TCODE_DWSM
data write sync message
EM, TCODE_8, TCODE_EM
error message
EM_0, TCODE_8_0
error message 0 - OTM loss
EM_1, TCODE_8_1
error message 1 - BTM loss
EM_2, TCODE_8_2
error message 2 - DTM loss
EM_6, TCODE_8_6
error message 6 - WHM loss
EM_7, TCODE_8_7
error message 7 - BTM/DTM/OTM loss
EM_8, TCODE_8_8
error message 8 - BTM/DTM/OTM/WHM loss
EM_18, TCODE_8_18
error message 18 - DSM loss
EM_19, TCODE_8_19
error message 19 - BTM/DSM/DTM/OTM loss
EM_1A, TCODE_8_1A
error message 1A - BTM/DSM/DTM/OTM/WHM loss
IHM, TCODE_1C, TCODE_IHM
hardware event message
IHSM, TCODE_1D, TCODE_IHSM
hardware event sync message
OTM, TCODE_2, TCODE_OTM
ownership trace message
PTCM, TCODE_21, TCODE_PTCM
repeat branch message
RFM, TCODE_1B, TCODE_RFM
resource full message
WHM, TCODE_F, TCODE_WHM
watchpoint hit message
For not CPU-specific keywords, see non-declarable input variables in ”ICE/FIRE Analyzer Trigger Unit
Programming Guide” (analyzer_prog.pdf).
©1989-2015 Lauterbach GmbH
eTPU Debugger and Trace
36
Complex Trigger Unit
JTAG Connector
Mechanical Description
JTAG Connector MPC55XX (OnCE)
Signal
TDI
TDO
TCK
EVTIRESETJTAG-VTREF
(RDY-)
Pin
Pin
1
3
5
7
9
11
13
2
4
6
8
10
12
14
Signal
GND
GND
GND
N/C
TMS
GND
JCOMP
This is a standard 14 pin double row (two rows of seven pins) connector (pin to pin spacing: 0.100 in.).
(Signals in brackets are not strong necessary for basic debugging, but its recommended to take in
consideration for future designs.)
Connector for COLDFIRE
Signal
N/C
GND
GND
RESET-/RSTI1.8-5.0V
GND
PST2
PST0
DDATA2
DDATA0
N/C
GND
1.8-5.0V
Pin
1
3
5
7
9
11
13
15
17
19
21
23
25
Pin
2
4
6
8
10
12
14
16
18
20
22
24
26
Signal
BKPTDSCLK
N/C
DSI
DSO
PST3
PST1
DDATA3
DDATA1
GND
N/C
PSTCLK/CPUCLK
TEA-/TA-/DTACK-
©1989-2015 Lauterbach GmbH
eTPU Debugger and Trace
37
JTAG Connector
Support
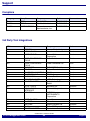
Compilers
Language
Compiler
Company
Option
C
C/ASM
C/ASM
ETEC
ETPUC
CODEWARRIOR
ASH WARE Inc.
ByteCraft Limited
Freescale
Semiconductor, Inc.
ELF/DWARF
ELF/DWARF
ELF/DWARF
Comment
3rd Party Tool Integrations
CPU
Tool
Company
ALL
ALL
ALL
ADENEO
X-TOOLS / X32
CODEWRIGHT
ALL
CODE CONFIDENCE
TOOLS
CODE CONFIDENCE
TOOLS
EASYCODE
ECLIPSE
RHAPSODY IN MICROC
RHAPSODY IN C++
CHRONVIEW
LDRA TOOL SUITE
UML DEBUGGER
Adeneo Embedded
blue river software GmbH
Borland Software
Corporation
Code Confidence Ltd
ALL
ALL
ALL
ALL
ALL
ALL
ALL
ALL
ALL
ALL
ALL
ATTOL TOOLS
VISUAL BASIC
INTERFACE
LABVIEW
ALL
ALL
ALL
ALL
ALL
CODE::BLOCKS
C++TEST
RAPITIME
DA-C
TRACEANALYZER
Host
Windows
Windows
Windows
Code Confidence Ltd
Linux
EASYCODE GmbH
Eclipse Foundation, Inc
IBM Corp.
IBM Corp.
Inchron GmbH
LDRA Technology, Inc.
LieberLieber Software
GmbH
MicroMax Inc.
Microsoft Corporation
Windows
Windows
Windows
Windows
Windows
Windows
Windows
NATIONAL
INSTRUMENTS
Corporation
Open Source
Parasoft
Rapita Systems Ltd.
RistanCASE
Symtavision GmbH
Windows
Windows
Windows
Windows
Windows
Windows
Windows
©1989-2015 Lauterbach GmbH
eTPU Debugger and Trace
38
Support
CPU
Tool
Company
Host
ALL
ALL
ALL
ALL
ALL
SIMULINK
TA INSPECTOR
UNDODB
VECTORCAST
WINDOWS CE PLATF.
BUILDER
The MathWorks Inc.
Timing Architects GmbH
Undo Software
Vector Software
Windows
Windows
Windows
Linux
Windows
Windows
©1989-2015 Lauterbach GmbH
eTPU Debugger and Trace
39
Support
Realtime Operation Systems
No operation systems supported.
©1989-2015 Lauterbach GmbH
eTPU Debugger and Trace
40
Support
Products
Product Information
OrderNo Code
Text
LA-1220
MICTOR Flex Extension Horizontal-Horizontal
FLEXEXT-MICTOR-H-H
70 mm flex extension for MICTOR 38 pin connector
horizontal-horizontal
LA-1221
MICTOR Flex Extension Horizontal-Vertical
FLEXEXT-MICTOR-H-V
60 mm flex extension for MICTOR 38 pin connector
horizontal-vertical
LA-1222
MICTOR Flex Extension Vertical-Vertical
FLEXEXT-MICTOR-V-V
55 mm flex extension for MICTOR 38 pin connector
vertical-vertical
LA-1223
Flex Extension 2.54mm shrouded hor.-hor.
FLEXEXT-100MIL-SHRO
75 mm flex extension for 2.54 mm connector
with shrouded post-stribes horizontal-horizontal
LA-1224
Flex Extension 2.54mm horizontal-horizontal
FLEXEXT-100MIL
75 mm flex extension for 2.54 mm connector
horizontal-horizontal
LA-1225
Flex Extension for BlackOak 64 pin / 32 pin
FLEXEXT-SAM-FTE-CLE
55 mm flex extension SAMTEC FTE-CLE,
only for BlackOak 64 pin / 32 pin
LA-7856, LA-7871, LA-7877, LA-7883
LA-1226
Flex Extension for Tricore with SAMTEC QTH
FLEXEXT-SAM-QTH-QSH
55 mm flex extension SAMTEC QTH-QSH,
only for Tricore with SAMTEC QTH connector
LA-7928
LA-1227
Flex Extension Yamaichi NDP-NDS
FLEXEXT-YAM-NDP-NDS
70 mm flex extension
Yamaichi NDP-NDS
LA-1370
Mictor Flex Extension
MICTOR-FLEXEXT
110 mm flex extension for Mictor 38pin connector
LA-1371
Mictor Flex Extension Long
MICTOR-FLEXEXT-L
200 mm flex extension for Mictor 38pin connector
©1989-2015 Lauterbach GmbH
eTPU Debugger and Trace
41
Products
Order Information
Order No.
Code
Text
LA-1220
LA-1221
LA-1222
LA-1223
LA-1224
LA-1225
LA-1226
LA-1227
LA-1370
LA-1371
FLEXEXT-MICTOR-H-H
FLEXEXT-MICTOR-H-V
FLEXEXT-MICTOR-V-V
FLEXEXT-100MIL-SHRO
FLEXEXT-100MIL
FLEXEXT-SAM-FTE-CLE
FLEXEXT-SAM-QTH-QSH
FLEXEXT-YAM-NDP-NDS
MICTOR-FLEXEXT
MICTOR-FLEXEXT-L
MICTOR Flex Extension Horizontal-Horizontal
MICTOR Flex Extension Horizontal-Vertical
MICTOR Flex Extension Vertical-Vertical
Flex Extension 2.54mm shrouded hor.-hor.
Flex Extension 2.54mm horizontal-horizontal
Flex Extension for BlackOak 64 pin / 32 pin
Flex Extension for Tricore with SAMTEC QTH
Flex Extension Yamaichi NDP-NDS
Mictor Flex Extension
Mictor Flex Extension Long
©1989-2015 Lauterbach GmbH
eTPU Debugger and Trace
42
Products