1
TOOLKIT
Version 6.4.9
April 2013
© Copyright 2013. All Rights Reserved.
Developed by
This Software is Licensed to a Single User.
No part of this manual may be reproduced in any form or by any means without written permission of ICLUBcentral Inc.
© Copyright 2009-2013 ICLUBcentral Inc. All rights reserved.
Printed in the United States of America.
This user manual is provided for use in connection with ICLUB’s TOOLKIT software
and for no other purpose. The use of this manual and TOOLKIT software is governed
by the terms of the accompanying software license agreement. The names and data
appearing in this manual are fictitious unless otherwise noted.
Published by: ICLUBcentral Inc.
711 West 13 Mile Road
Madison Heights, MI 48071
(248)-654-3100
(877) 33-ICLUB
www.iclub.com
©2009-2013 ICLUBcentral Inc. No part of this document may be copied, photocopied,
reproduced, transmitted, translated, or reduced to any electronic medium or machine
readable form by any means, electronic or mechanical, for any purpose other than
the purchaser’s personal use, without the express written permission of ICLUBcentral Inc. (“ICLUBcentral”).
Information in this document is subject to change without notice and does not represent a commitment on the part of ICLUBcentral. The software described in this document is furnished under a license agreement or nondisclosure agreement. The software may be used or copied only in accordance with the terms of the agreement. It is
against the law to copy the software on any medium except as specifically allowed in
the license or nondisclosure agreement. The purchaser may make one copy of the
software for backup purposes.
All programs comprising Toolkit software have been written by ICLUBcentral. Such
program code is the property of ICLUBcentral whose rights to such code are protected
by U.S. copyright laws.
Value Line and Value Line Survey are the registered trademarks of Value Line, Inc.
S&P’s and Standard and Poor’s are the trademarks of Standard and Poor’s Corp.
Other brand names and product names are trademarks or registered trademarks of
their respective companies. None of these forms, trademarks or copyrights may be
duplicated or used without the expressed written permission of ICLUBcentral Inc.
2
Toolkit 6
“Any normal person using the customary three percent
of his brain can pick stocks just as well, if not better,
than the average Wall Street expert.”
— Peter Lynch, One Up on Wall Street
Toolkit 6
3
CONTENTS
CONTENTS ..............................................................................................4
INTRODUCTION ...................................................................................... 10
Overview of Toolkit 6 ................................................................................10
What’s New in Toolkit 6?..........................................................................10
General Enhancements ........................................................................11
About This Manual: A Road Map .............................................................13
Organization of this Manual.................................................................13
Conventions Used in This Manual and in the Program.........................14
About Investing .......................................................................................15
Organization of Toolkit 6 ..........................................................................15
The Company.......................................................................................15
The Portfolio ........................................................................................16
The Stock Library ................................................................................16
Using Toolkit 6 ........................................................................................16
Tools for Acquiring Companies ................................................................17
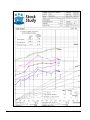
Stock Study .........................................................................................17
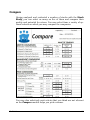
Compare ..............................................................................................19
Tools for Portfolio Management ...............................................................20
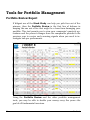
Portfolio Review Report ........................................................................20
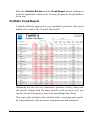
Portfolio Trend Report ..........................................................................21
Further Research .................................................................................22
Portfolio Summary ...............................................................................24
Portfolio Defense ..................................................................................25
Portfolio Offense...................................................................................25
Sector/Industry Diversification ............................................................26
Company Size ......................................................................................26
4
Toolkit 6
Challenger ........................................................................................... 27
Getting Started ....................................................................................... 27
System Requirements .......................................................................... 27
Registering Your Toolkit 6 .................................................................... 28
Installing Toolkit 6 ............................................................................... 29
Starting Toolkit 6 ................................................................................. 29
Setting Preferences .............................................................................. 30
Help in Toolkit ........................................................................................ 40
Technical Support and Customer Service ............................................ 43
ABOUT INVESTING ................................................................................. 45
Terms You Should Understand ............................................................... 45
Like the Sea ............................................................................................ 47
Fundamental Investing Principles ........................................................... 49
Invest Regularly in the Stock Market ................................................... 49
Reinvest all of Your Profits and Dividends............................................ 50
Invest for the Long Term ...................................................................... 50
Invest Only in Good Quality Growth Companies .................................. 50
Diversify Your Portfolio ........................................................................ 51
What Is a Quality Growth Company? ...................................................... 51
Just What Do We Mean by Growth? .................................................... 52
How Do You Find Such Companies? .................................................... 54
Obtaining Data .................................................................................... 56
Benefits of Long-Term Investing .............................................................. 56
80% Successful Stock Selection Record ............................................... 56
Money Can Double Every Five Years .................................................... 56
Tax Benefits ......................................................................................... 56
Simple Procedures ............................................................................... 57
Carefree Portfolio Maintenance ............................................................ 57
USING TOOLKIT 6: WHAT YOU DO AND WHY YOU DO IT ............................ 58
About Data ............................................................................................. 59
Overview .............................................................................................. 59
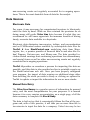
Data Types .......................................................................................... 60
Data Sources ....................................................................................... 62
Toolkit 6
5
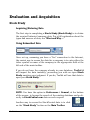
Evaluation and Acquisition .....................................................................64
Stock Study .........................................................................................64
Entering Data ......................................................................................69
Electronic Data ....................................................................................78
Roster of Quality Companies ...................................................................84
Quality Index .......................................................................................85
About “Judgment” ...................................................................................85
The Three Levels of Judgment..............................................................86
Opportunities for Judgment .................................................................87
First Impression...................................................................................88
Toolkit 6’s Default Judgment ................................................................89
Analyzing the Company, Step by Step .....................................................90
The Header ..........................................................................................92
Recent Performance .............................................................................93
The Footer ...........................................................................................94
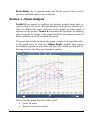
Section 1—Visual Analysis ...................................................................95
Section 2—Quality Analysis ............................................................... 116
Section 3—Price, P/E Ratio and Dividend Analysis ............................ 120
Section 4—Evaluating Reward and Risk over the Next 5 Years........... 126
Section 5—Total Return Analysis ....................................................... 133
To Buy or Not to Buy ......................................................................... 134
The Judgment Audit .......................................................................... 138
Notes and Descriptions ...................................................................... 142
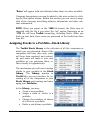
Assigning Stocks to a Portfolio—Stock Library ................................... 143
Updating Your Stock Studies ............................................................. 145
Comparisons ......................................................................................... 149
Portfolio Management............................................................................ 160
Overview ............................................................................................ 160
The Portfolio Management Process ..................................................... 163
The Quarterly Trend Analysis ............................................................ 178
Quarterly Trend Graph ...................................................................... 180
Print a Defense Report ....................................................................... 181
The Portfolio Management Forms ....................................................... 187
Company Forms .................................................................................... 202
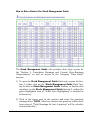
Stock Management Guide .................................................................. 202
6
Toolkit 6
Quarterly Trend Analysis ................................................................... 206
Annual P/E Analysis ......................................................................... 206
Dividends/Share ............................................................................... 207
Printing Your Company Forms........................................................... 208
USING TOOLKIT 6: HOW YOU DO IT ........................................................ 209
Working with the Software .................................................................... 209
A Review of Conventions .................................................................... 209
Data .................................................................................................. 212
Evaluation and Acquisition ................................................................... 217
Stock Study ....................................................................................... 217
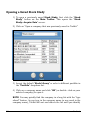
Opening a Saved Stock Study ............................................................ 220
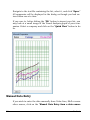
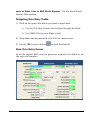
Manual Data Entry ............................................................................ 226
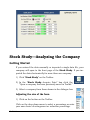
Stock Study—Analyzing the Company................................................... 229
Getting Started .................................................................................. 229
Before You Begin—First Impression ................................................... 230
Section 1—Visual Analysis................................................................. 231
Section 2—Quality Analysis ............................................................... 241
Section 3—Price, Price/Earnings Ratio and Dividend Analysis........... 242
Section 4—Evaluating Risk and Reward over the Next 5 years ........... 244
Section 5—Total Return Analysis ....................................................... 249
The Judgment Audit .......................................................................... 249
Notes and Comments......................................................................... 252
How to Print the Stock Study ................................................................ 253
ASCII Report ...................................................................................... 254
How to Save a Company Stock Study ................................................ 254
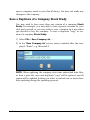
Save a Duplicate of a Company Stock Study ...................................... 255
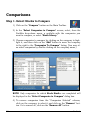
Comparisons ......................................................................................... 256
Step 1. Select Stocks to Compare ...................................................... 256
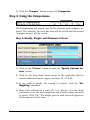
Step 2. Using the Comparisons .......................................................... 257
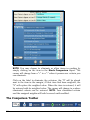
The Comparison Toolbar .................................................................... 258
How to Print the Comparison ............................................................. 259
PORTFOLIO MANAGEMENT .................................................................... 260
The Home Page ..................................................................................... 260
Defense and Offense .......................................................................... 261
Toolkit 6
7
Scheduling ......................................................................................... 262
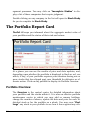
The Portfolio Report Card ...................................................................... 266
Portfolio Overview .............................................................................. 266
Alerts ................................................................................................. 268
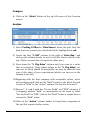
Defense ................................................................................................. 269
Compare, Analyze, Decide Indication: ................................................ 269
Offense .................................................................................................. 273
Check Risk & Reward, Reevaluate, Challenge Indication:................... 273
Challenge ........................................................................................... 274
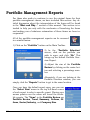
Portfolio Management Reports............................................................... 278
Portfolio Review.................................................................................. 279
Portfolio Trend Report ........................................................................ 282
Portfolio Summary Report .................................................................. 283
Portfolio Defense Report ..................................................................... 284
Portfolio Offense Report ..................................................................... 284
Sector/Industry Diversification .......................................................... 285
Company Size Diversification ............................................................. 286
Quarterly Trend Analysis ................................................................... 287
Quarterly Trend Graph ...................................................................... 289
Annual P/E Analysis.......................................................................... 289
Stock Management Guide .................................................................. 290
The Challenger................................................................................... 292
GETTING THE MOST OUT TOOLKIT 6 ........................................................ 296
Printing ................................................................................................. 296
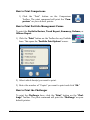
How to Print Company Forms ............................................................ 296
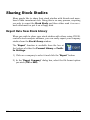
Sharing Stock Studies ........................................................................... 298
Export Data from Stock Library ......................................................... 298
Sending a Stock Study via E-mail ...................................................... 300
Export File Formats ........................................................................... 300
Advanced Data Export ....................................................................... 301
Sharing with the StockCentral Community ........................................ 302
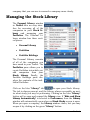
Managing the Stock Library .................................................................. 304
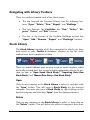
Navigating with Library Toolbars........................................................ 305
Stock Library ..................................................................................... 305
8
Toolkit 6
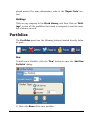
Portfolios ............................................................................................... 307
Portfolio Holdings .............................................................................. 308
Updating Your Stock Studies ............................................................. 312
Splits and Stock Dividends ................................................................ 316
Update Data Manually ....................................................................... 318
Updating Prices Electronically ........................................................... 321
Updating Prices Manually .................................................................. 324
Internet Access ..................................................................................... 325
How to Set Up Web Destinations ....................................................... 326
How to Open “Internet Access” screen ............................................... 327
Company-Specific Sites ..................................................................... 330
For Advanced Users .............................................................................. 333
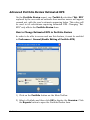
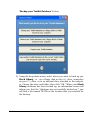
Working with Multiple Stock Libraries ............................................... 333
Advanced Portfolio Review Estimated EPS ......................................... 337
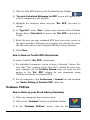
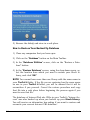
Database Utilities .............................................................................. 338
USER LICENSE AND SUPPORT AGREEMENT ............................................... 342
Toolkit 6
9
INTRODUCTION
Overview of Toolkit 6
ICLUBcentral provides individual investors with tools, data, and insight to help them successfully invest in the stock market. Among
other things, the company is a leading provider of software to help individual investors manage their stock portfolios and investment
clubs. More than 150,000 investors have used ICLUBcentral’s software to help them to analyze long-term investing candidates, a larger
installed base than any other investing software company in this
market. In addition, more investment clubs use ICLUBcentral’s software for club recordkeeping management and tax preparation than
any other product.
This current version of Toolkit is the result of more than 20 years of
experience as the best-selling fundamental investing software available in the U.S., as well as the result of listening and responding to the
requests and desires of thousands of satisfied users. We believe that
it will make investing in common stocks the ICLUBcentral way a simpler and more pleasant activity for you, as well as a much more profitable one.
What’s New in Toolkit 6?
Version six of Toolkit is the result of years of user experience with five
previous versions, and its enhancements have been distilled from the
consolidated input from our users who told us what else they wanted.
The program has been modified in order to take advantage of improvements in technology that would permit us to make life easier
and better for our users. Because the Internet and the World Wide
10
Toolkit 6
Web are now so closely integrated into Toolkit 6, an Internet connection is required for its use.
General Enhancements
Toolkit 6 includes, among others, the following enhancements.
Once again, an updated “look and feel” retains the comfortable familiarity that goes with the older version, but substantially increases
“user friendliness” and ease of use.
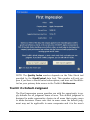
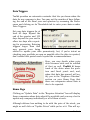
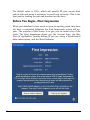
First Impression: When you first import a new company or open a
saved company with an incomplete judgment you are presented with
the new First Impression window. This window is similar to the one
found in ICLUB’s popular Take Stock program (though the results will
be slightly different in most cases), and provides a general assessment of the stock. Important data such as Price, Buy Price, Quality
Rating, and Mood Indicator allow you to quickly determine if the
stock is worth further investigation. If the First Impression is not favorable, the stock is not likely to be a good investment. Of course, as
with all first impressions you may have about a stock, the First Impression is a simplified view, showing only part of the big picture. If
you have reason to believe a stock is worth further investigation despite the First Impression, do not hesitate to continue—you may
prove to be correct! (Note: this feature requires a StockCentral.com
subscription, available separately.)
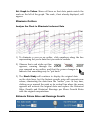
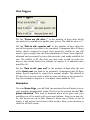
New Graph Items: There are now six additional metrics that you can
choose to graph on the front page of your Stock Study! By opening
the Visual Analysis screen you will see a legend at the top with six
new values next to a check box. Placing a check in the box will display that value on the graph. The new values are: Shares Outstanding, Dividends, Book Value, Net Income, Free Cash Flow/Share,
and Long Term Debt.
“Rogue Keys”: In previous versions of Toolkit there are a number of
advanced options that were not displayed and were activated by special key sequences (i.e., Alt +R). Many of these advanced options, collectively known as “Rogue Keys” are no longer hidden, and can now
Toolkit 6
11
be seen as additional options on the relevant pages. Some have even
been enabled by default, like showing section 2c, Debt/Equity, on the
back page of the Stock Study.
StockCentral Interaction: Toolkit 6 has further integrated web
technologies to enable users to do more than just download data files
from StockCentral.com. Investors can now upload a completed
Stock Study for peer review as well as joining the community of fundamental investors in the message forums—without ever leaving
Toolkit!
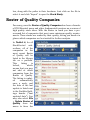
Access to the Roster of Quality Companies: For years the Roster of
Quality Companies has been a favorite of ICLUBcentral users and
other fundamental investors. With the Roster in hand you have a prescreened list of companies that meet minimum quality requirements.
These stocks are ranked by their quality, letting you know at a glance
which companies are best suited for further analysis. In Toolkit 6,
for all StockCentral subscribers, all of the companies in the most recent Roster of Quality will be listed in the library as a portfolio. This
portfolio will be locked, and will be updated automatically once a
week.
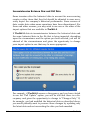
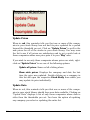
Automatic notification for updated company data: Earlier versions
of Toolkit alerted you on the Home Page when your company data was
out of date. Toolkit 6 takes this a step farther by checking your data
against the latest data online with a “Smart Data Updater”, displaying
a message when you start the program if there is newer data available, allowing you to download it immediately.
Automatic import of Toolkit 5 data: When Toolkit 6 is installed it
will automatically import your database from Toolkit 5, if you have it
installed in the default location on the same machine.
Future Fiscal Year Analysts EPS Estimates: Another feature highly
requested by Toolkit users is the addition of Analyst Estimates to the
historical graph of revenues and earnings. This feature has been added to the Visual Analysis screen of the Stock Study. Clicking on the
button EPS Estimates will bring up a window where you can enter
analysts’ earnings estimates for future fiscal years, and then view
12
Toolkit 6
them on the graph. In this way you can compare your EPS projection
to the near-term projections of Wall Street’s analysts.
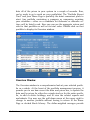
Print Portfolio Overview: It is now possible to print the Portfolio
Overview screen, in addition to the portfolio reports.
Revised error handling: In the event of an error, Toolkit 6 has improved error reporting capabilities.
Navigation throughout the program has become even easier with a
more “Web-like” interface that makes access to the tasks much more
intuitive.
Data access has never been easier. Entering a ticker symbol or name
automatically opens an Stock Study for virtually any company for
which data is available. Users must be subscribed to ICLUBcentral’s
StockCentral.com to use this service.
Automatic program updating: Lets you know when a new version is
available and installs it right away with your permission.
About This Manual: A Road Map
Organization of this Manual
This manual needs to serve two purposes. Of course, it is primarily
an instruction manual written to helpfully guide you through the
steps that you must take to get the most out of Toolkit 6. Secondly,
if you’re new to Toolkit or to investing, we have to provide you with
enough information about the investment methodology so that you
can make sense out of what Toolkit is supposed to do for you. The
trick is to satisfy both needs without imposing on you. Step-by-step
instructions, buried in text, are difficult to find and to follow. Our solution has been to break up the manual into two sections: “What you
do and why you do it,” followed by “How you do it.”
These sections will cover the same ground but from different perspectives. Those who are just interested in finding out what buttons to
Toolkit 6
13
push to accomplish a certain objective can go right to the “How to”
section. Those who want some background information about each of
the things that need doing can consult “What and Why.”
Conventions Used in This Manual and in the Program
Selecting
Buttons and Screen Names appear in bold type.
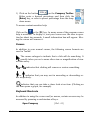
Clicking
Click: Tells you to click the left button on the mouse to select a
command or function.
Double-click: Tells you to click your left button twice, rapidly,
on the selection.
Right-click: Tells you to click using the right mouse button.
Buttons, Keys, Screens, Windows, and Sections of the
Manual
Button names are enclosed in quotes and are in bold type—for
example, click on the “Ok” button.
Keyboard keys are enclosed in brackets as well as being in
bold type—for example, Press the [Enter] key.
Windows or screens are referred to using bold type—for example, “Open the Company window and access the Data
screen.”
References to a section of this manual, the name of a form
or a section of a particular form are written in bold type—for
example, Review the About Investing section of the manual, or
Stock Study.
14
Toolkit 6
Navigating
Navigate between entry boxes using the cursor, pressing the
[Tab] key or pressing [Enter]. To move back, press [Shift] +
[Tab] to move from right to left, bottom to top.
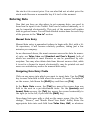
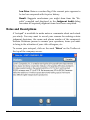
About Investing
About Investing is for the newcomer to fundamental investing. Starting with the few, basic terms you need to know, it explains long-term
investing and why it is successful. It then explains the basic principles, identifies what good quality growth stocks are, and how to find
them, and talks about where to get the data you need to analyze
them.
If you are already familiar with Toolkit and the investment philosophy
used in the program, you may wish to skip this section and go directly to the How to section. If you are new to Toolkit 6’s method of investing, however, we recommend that you read and digest the information in that section to provide you with sufficient background to
make the most of your experience with the program.
Organization of Toolkit 6
Toolkit 6 is comprised of eight forms for stock analysis: the Stock
Study and Stock Comparison, Stock Management Guide, Portfolio
Review, Quarterly Trend Analysis (with graphs), Annual P/E Analysis and the Challenge. New to Toolkit 6 is the First Impression
screen. Toolkit is conveniently oriented around Companies and Portfolios.
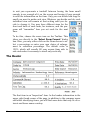
The Company
A company is the primary unit we study. You may view a company
using the SSG button on the Main Toolbar. The primary Stock Study
form is titled Stock Study. Clicking the “SSG” button on the Toolbar
begins the process of acquiring or manually entering data for a Stock
Toolkit 6
15
Study. You can have as many as nine companies open at the same
time. You can update a Stock Study by opening a company currently
in your Stock Library, or you can begin a new study by manually entering data or by importing it electronically.
Once you have completed your stock studies on a number of stocks
with the Stock Study, you may use the Comparison to compare the
quality and potential return of as many as five of these companies. To
begin the comparison, click the “Comparison” button on the Toolbar.
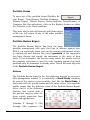
The Portfolio
A portfolio is a collection of companies. You may create and manage
as many portfolios as you wish and use these portfolios to select just
those companies you wish to work with as you go about your investment activity.
Toolkit 6 also includes portfolio management tools and reports that
allow you to track, update and print out details of individual portfolios, or your entire stock library. See the Tools for Portfolio Management below for more on this.
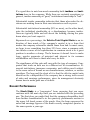
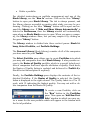
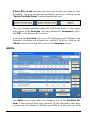
The Stock Library
The Stock Library is the collection of companies for which you have
saved data—whether or not they have been evaluated or assigned to
portfolios. A click on the “Library” tab near the top left-hand corner of
the Toolkit window gives you instant access to your Stock Library, its
companies and portfolios whenever you need it.
Using Toolkit 6
The manual follows the normal pattern of investing activities, with
emphasis on Acquisition—analyzing and evaluating stocks to determine if they are good companies and whether their stock is a good
value, and then comparing them to see which of several would be the
best investment. It goes through each of the tools, step-by-step, dis-
16
Toolkit 6
cussing each of the opportunities for judgment and some of the conclusions that you might draw from what you see.
The What and Why sections for each step give you detailed, simple
guidelines for making your investment decisions as you use the program. You will find that it is not difficult to learn the elegantly simple
ideas behind Toolkit’s investment tools—and the steps required to use
their computerized version. The basic principles are neither elaborate
nor difficult to understand, and they are certainly successful.
Tools for Acquiring Companies
Stock Study
The Stock Study is the primary tool for analyzing, evaluating, and
acquiring good stocks.
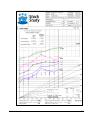
With Toolkit, you may enter data about the company you intend to
study, either manually or electronically. Once entered, this data is
distributed through the Stock Study (and other Toolkit 6 forms) and
plotted on a graph representing up to ten years of history.
The form provides you with the necessary visual evidence and calculations required, to assess the company’s history and predict its future with some degree of confidence. You can challenge the relevance
of the data and omit that which is not useful in forecasting future
trends. The Stock Study also helps you evaluate management’s ability to sustain the company’s profitability.
With information that the program gives you, you can estimate with
remarkable success the future price range into which the stock will
probably fall, judge the measure of risk and reward that you are likely
to encounter, and estimate the potential return on your prospective
investment.
Toolkit 6
17
18
Toolkit 6
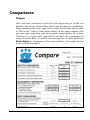
Compare
Having analyzed and evaluated a number of stocks with the Stock
Study, you can select as many as five of them and compare their
quality and potential for return. You may select from a variety of optional criteria on which you may compare the companies.
You may also selectively omit criteria that you think are not relevant
as the Compare module helps you pick a winner.
Toolkit 6
19
Tools for Portfolio Management
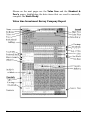
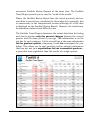
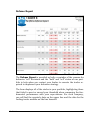
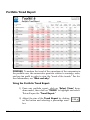
Portfolio Review Report
If diligent use of the Stock Study can help you pick four out of five
winners, then the Portfolio Review is the first line of defense in
keeping the one out of five that might be a loser from damaging your
portfolio. This tool permits you to view your companies’ quarterly operations and the percent changes from the comparable periods in the
previous year to receive early warning signals when you need to investigate sub-par performance.
Using the Portfolio Review and the other portfolio management
tools, you may be able to double your money every five years—the
goal of all fundamental investors.
20
Toolkit 6
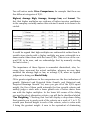
Both the Portfolio Review and the Trend Report permit ranking on
all of the significant criteria so as to bring the good or bad performers
to the top.
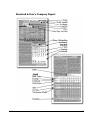
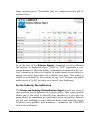
Portfolio Trend Report
A slightly different approach to your portfolio’s potential, this report
affords you a look at the “trend of the trends.”
Displaying not one but two consecutive quarters of data, along with
the percent change from the same periods in the previous year, you
can see trends developing in time to do something about them.
This report also includes some valuable aids to analyzing your portfolio’s diversification, both in terms of company size and industries.
Toolkit 6
21
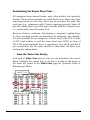
Further Research
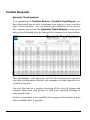
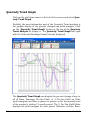
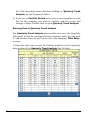
Quarterly Trend Analysis
If, in examining the Portfolio Review or Portfolio Trend Report, you
have discovered one or more companies that appear to have run into
some “heavy weather,” you can double-click anywhere on the line for
the company and access the Quarterly Trend Analysis to view up to
nine years of detailed data for that specific company in a new window.
This information, both quarterly, and for the trailing twelve months,
can help you determine whether the company is acting typically or is
actually in trouble.
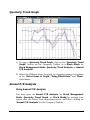
You can also look at a graphic depiction of the rates of change and
compare them with zero growth or with your expected earnings or
sales growth rates.
If some of your data is not available, the program will estimate it from
other available data, if possible.
22
Toolkit 6
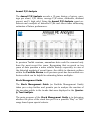
Annual P/E Analysis
The Annual P/E Analysis records a 10-year history of prices, earnings per share, P/E ratios, average P/E ratios, dividends, dividend
payout, and % high yield. Using the Annual P/E Analysis report enhances one’s analysis of historical P/Es and other items influencing
estimates of future performance.
In previous Toolkit versions, anomalous data could be removed only
from the most recent five years. Recognizing that as much as ten
years of data provides a more reliable history—especially in view of
the distorted markets of recent times—the ability to eliminate outliers
within the Portfolio Review in all previous years has been added as a
feature which can be helpful in estimating future multiples.
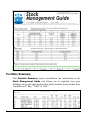
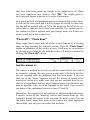
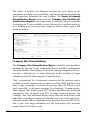
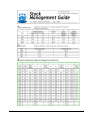
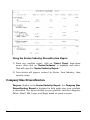
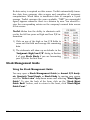
Stock Management Guide
The Stock Management Guide (or Portfolio Management Guide)
takes you a step further and permits you to analyze the reaction of
the investing public to the trends that were displayed in the Quarterly Tend Analysis.
The main purpose of the Stock Management Guide is to determine
whether the price of the stock has put it in a possible “Buy” or “Sell”
range based upon special criteria.
Toolkit 6
23
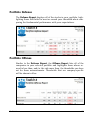
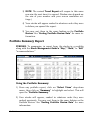
Portfolio Summary
This Portfolio Summary report consolidates the information in the
Stock Management Guide and allows you to regularly view your
holdings along with information that both classifies and justifies their
condition as a “Buy,” “Hold” or “Sell.”
24
Toolkit 6
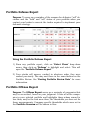
Portfolio Defense
The Defense Report displays all of the stocks in your portfolio, highlighting those that failed to meet or exceed your threshold when comparing the fundamental performance with your expectations.
Portfolio Offense
Similar to the Defense Report, the Offense Report lists all of the
companies in your selected portfolio and highlights those whose reward is less than, and/or the risk more than, the thresholds you have
set for those measurements. Thresholds that are company-specific
will be shown in blue.
Toolkit 6
25
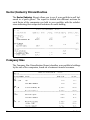
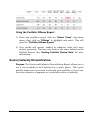
Sector/Industry Diversification
The Sector/Industry Report allows you to see if your portfolio is well balanced in a quick glance. The report is divided into different sections for
each Sector of the companies you hold in your portfolio, with the subdivisions indicating their respective Industries for each holding.
Company Size
The Company Size Diversification Report classifies your portfolio's holdings
by the size of the companies, based on a business's annual revenues.
26
Toolkit 6
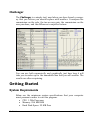
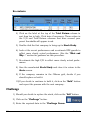
Challenger
The Challenger is a simple tool, used when you have found a company that you believe you should replace with another. It analyzes the
commission on the sale, the tax on any gain, the commission on the
new purchase, and the difference in expected return.
You can see both numerically and graphically just how long it will
take you to make up for the immediate loss that you will sustain. The
results are often surprising.
Getting Started
System Requirements
Below are the minimum system specifications that your computer
must possess in order to run this program.
· CPU: 1 GHz Processor
· Memory: 256 MB RAM
· Hard Disk Space: 20 MB Free
Toolkit 6
27
·
·
·
·
·
Operating System: Microsoft Windows XP or Vista (32-bit)
Monitor Resolution: 1024x768
Disk Drive
CD-ROM drive (If you wish to install Toolkit by Disc)
Internet Access
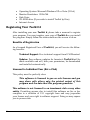
Registering Your Toolkit 6
After installing your new Toolkit 6, please take a moment to register
your program. You must register your copy of Toolkit 6 as you install
the program. Simply follow the instructions on the screen to do so.
Benefits of Registration
As a licensed Registered User of Toolkit 6, you will receive the following benefits:
Technical Support: Free technical support from ICLUBcentral.
Updates: Free software updates for Investor’s Toolkit 6 will be
made available and will, with your permission, be downloaded
and installed automatically.
Licensed to Individual User (Not a Club)
This policy must be perfectly clear:
This software is licensed to you as sole licensee and you
may share with others only the printed output of this
program and the data that this program generates.
This software is not licensed to an investment club or any other
entity. Permitting anyone else to install this software on his or her
computer is a violation of U.S. copyright laws and may jeopardize
your license and your right to software support. Doing so may expose
you to prosecution.
28
Toolkit 6
Installing Toolkit 6
With Windows running, exit all programs. You may need to temporarily disable any anti-virus programs and firewalls that are running
on your computer. Please refer to the installation instructions that
were enclosed with the program.
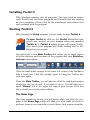
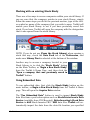
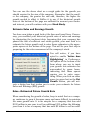
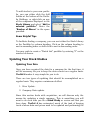
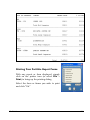
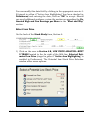
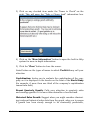
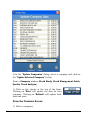
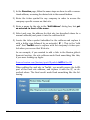
Starting Toolkit 6
After running the Setup program, you are ready to start Toolkit 6.
To start Toolkit 6, click on the Toolkit 6 shortcut icon
(which was created on your desktop when you installed
Toolkit 6). A Toolkit 6 splash screen will appear briefly,
after which your program will finish loading and be displayed on your screen.
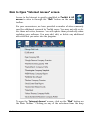
You will notice a new Main Toolbar that allows you to easily access
all of the features and functions of the program and your StockCentral.com subscription.
Click the small white triangle in the lower left corner of the Toolbar to
hide it from view. Click the triangle again to bring the Toolbar into
view once again.
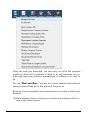
Above the Main Toolbar, you will also see all of the traditional menus
which you can use as well, if you wish to do so. You will also see a
small “Library” tab at the upper left edge of your screen. Click this
tab to reveal your stocks and portfolios.
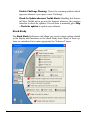
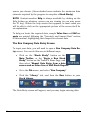
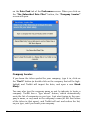
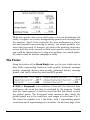
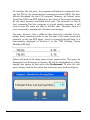
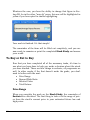
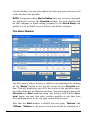
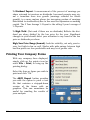
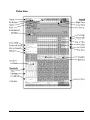
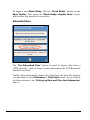
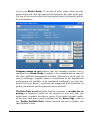
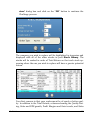
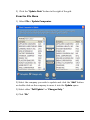
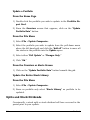
The Home Page
The most prominent feature you will notice when you start the program is the Home Page which will show you what tasks you have to
perform, items in your portfolio or stock library that require attention,
Toolkit 6
29
and a Portfolio Report Card which will give you a status report of
your portfolios.
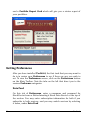
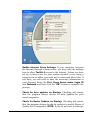
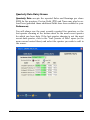
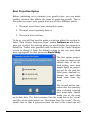
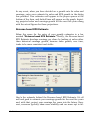
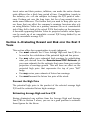
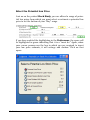
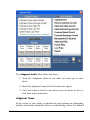
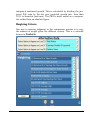
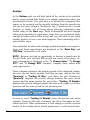
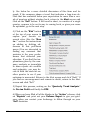
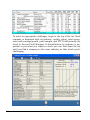
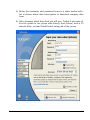
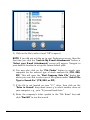
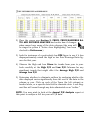
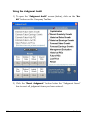
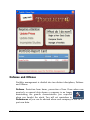
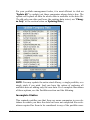
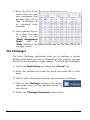
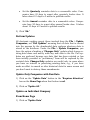
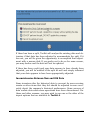
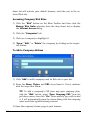
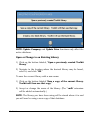
Setting Preferences
After you have installed Toolkit 6, the first task that you may want to
do is to review your Preferences to see if there are any you wish to
set. To view the Preferences screen, click on the Preferences button
on the Main Toolbar. Note the tabs on the left that direct you to the
various Preference categories.
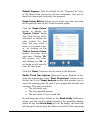
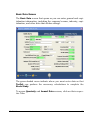
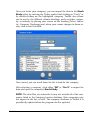
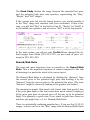
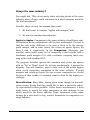
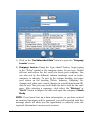
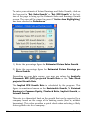
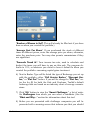
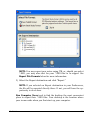
Data Feed
On this tab of Preferences, enter a username and password for
StockCentral.com or BetterInvesting’s Stock Data Service at the top of
the section. You may enter subscription information for both if you
subscribe to both services, and you may switch services by selecting
it below, under Data Feed.
30
Toolkit 6
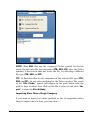
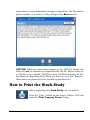
NOTE: The username and password are the ones that you used to set up
your data subscription account when you purchased your subscription
The username and password are the ones that you used to set up
your data subscription account when you purchased your subscription.
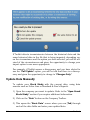
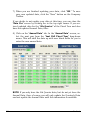
Price feed: Choose which service Toolkit should use when updating prices
for stocks in your library: Yahoo, for prices which have a 20 minute delay
from the market, or ICLUBcentral, for the last closing price.
Toolkit 6
31
Data files on disk: Only use this option if you do not have a separate data
subscription to StockCentral or BetterInvesting, and you will be receiving
SSG data as individual files from another member, service, or source.
Ticker Retrieve Default Data Source: Permits you to have Toolkit 6 first
look in the stock library for company data when a company is requested in
the Main Toolbar and, if not there, import the data from online—or to import the data from online each time you open a new Stock Study.
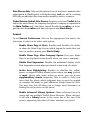
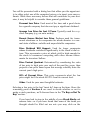
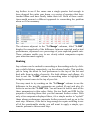
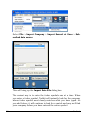
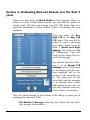
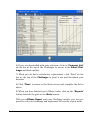
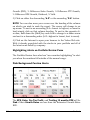
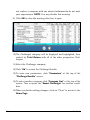
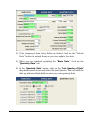
General
To set General Preferences, click on the appropriate box next to the
selections to select or de-select each option.
Enable Home Page at Start: Enables and disables the ability
to show the Home Page Screen which begins the tasks that you
have to perform during your Stock Study.
Enable Home Page After Company Opens: Sets your Home
Page to be displayed automatically when you close a company.
Disable First Impression: Disables the automated display of the
First Impression screen when you launch a new study of a stock.
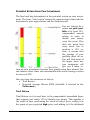
Active Area Highlighting: Enables or disables the yellow,
green, or magenta boxes around areas where you may (yellow)
or must (green) take some action or where you can access
supplementary charts (magenta). This is useful to help new
users find the places where judgment may or must be applied
to complete the study or gain additional insight from the data.
You may turn this off when you no longer need assistance in
finding the active areas on the forms.
Enable Advanced Library Options: Allows advanced users to
create and use multiple Toolkit Stock Libraries. When checked,
it will add a Library menu to the menu bar at the top of the
screen, appearing only when all other windows are closed.
32
Toolkit 6
Enable Editing of Portfolio EPS: Turns on an option that allows you to enter your own earnings estimate rather than use
the computer-generated estimate.
Enable Library Display Automatically: Provides for your Stock
Library to be displayed automatically when you launch Toolkit, and
disappear when you open companies to work on them.
Enable BetterInvesting Terminology on Forms: Resets the
Quarterly and Annual PE Analysis forms to their more traditional PERT-A and PERT-B names.
Toolkit 6
33
Disable Challenge Warning: Closes the warning window which
appears whenever you open a new Challenge.
Check for Update whenever Toolkit Starts: Disabling this feature
will force Toolkit not to go onto the Internet whenever the program
launches to check for updates. You will have to manually go to Help
> Check for updates to update your software.
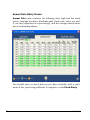
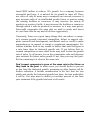
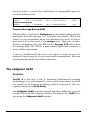
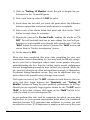
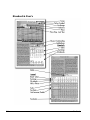
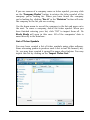
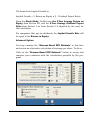
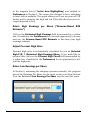
Stock Study
The Stock Study Preferences tab allows you to set various options related
to the display and functions on the Stock Study form. Many of these options are considered to be more appropriate for “Advanced” users.
34
Toolkit 6
Default Preparer: Sets the default for the “Prepared by” entry
in the Basic Data screen for all new companies. You are allowed ten characters to identify the preparer.
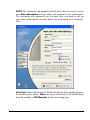
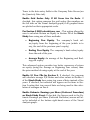
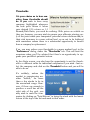
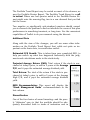
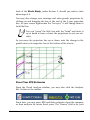
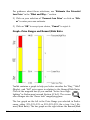
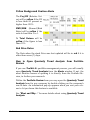
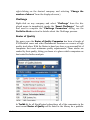
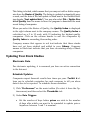
Graph Colors Button: Allows you to select any color you wish
for the plotted lines on the Visual Analysis graph.
Click the “Graph Colors”
button to display the
“System Colors” dialog
box. Click on any of the
selections to display the
color palette for that
item. You may select a
basic or a custom color,
or, by clicking on the
“Define Custom Colors”
button, you may create
your own. Clicking “Ok”
will replace the color,
and clicking on “Ok” after doing so will save the
color for the future.
Click the “Reset” button to set all colors to the defaults.
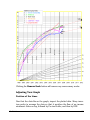
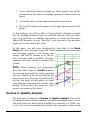
Enable Trend Line Options (Advanced users): Enables or disables the appearance of the “Start Projections” button on the
button bar in the Visual Analysis screen that permits you to
select the starting point for your 5-year projections of sales and
earnings. They may start from:
· The last fiscal year
· The last reported quarter
· The end of the 10-year trend line.
By selecting one of the choices in the Stock Study Preferences
screen, you may set the default position of the projection starting
points for any new Stock Study you do. By design, the trend line
will always be drawn from the darker vertical line that represents
Toolkit 6
35
the last full year; making a change to this setting will adjust the
vertical point that the line starts from, so that it will begin from the
end of the Trend line, end of the last fiscal year, or be drawn so
that it intersects the last quarterly data.
NOTE: Changing this setting will only affect newly opened
stocks. To change the setting for existing stocks, go to the Visual Analysis screen The Visual Analysis screen is accessed by
clicking anywhere in the graph in Section 1 of the Stock Study
or by clicking on the “Adjust Graph” text at the top of the company window.
Select Range Default: Permits changing the “Buy—Hold—Sell”
price ranges in Section 4C of the Stock Study from 25%-50%25% (the default) to 33%-33%-33%. The 33-33-33 is an older
convention that is no longer recommended. Since the 33-33-33
range can indicate a “buy” when the Reward/Risk Ratio is as
low as 2 to 1, the 25-50-25 range is now used by default, thus
reconciling the “Buy” range with a 3 to 1 Reward/Risk Ratio
and providing for a more conservative “Sell” option.
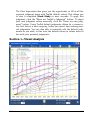
Initially Place Lines: You have two options for how the program displays the items on the Visual Analysis Graph.
Scaled: Will scale the lines (multiply the data for each
line by a percentage) so they may fit on a consistent
number of grids and in a consistent and optimum order
(sales, pre-tax profit, and EPS).
On Values: Will place lines so their values match the
numbers on the left of the graph. (Sometimes requires
additional scales to be able to see lines.)
Enable Projected Average Return on Stock Study Back:
Adds Projected Average Return (PAR) as a measurement of Total Return to Section 5.
Enable Pre-Tax Profit and Tax Entry in Quarterly Data
Screen in Quarterly Trend Analysis: Adds Pre-Tax Profit and
36
Toolkit 6
Taxes to the data entry fields in the Company Data Screen (on
the Quarterly Data tab).
Enable Grid Scales Only If All Lines Are On Scale: If
checked, this option removes the grid scales (the numbers on
the left side on the Visual Analysis graph) if all graphed items
are plotted on their appropriate scale.
For Section 2 ROE calculations, use: : This option allows the
user to calculate Return on Equity in Section 2B of the Stock
Study form using one of three methods:
·
Beginning Year Equity: The company’s book value/equity from the beginning of the year (which is to
say, the end of the previous year’s equity)
·
Ending Year Equity The company’s book value/equity
from the end of the year
·
Average Equity An average of the Beginning and Ending year equity.
This advanced option provides two better measures of return
on equity (using the Average or Beginning Year values) than
the prior method of using equity at the end of the year.
Enable 10 Year PEs for Section 3: If checked, the program
will calculate average P/E Ratios and other values in Section 3
of the Stock Study form using ten years of data instead of five
years. If checked, an indicator will appear on the form in Section 3 noting that ten years of data are being used in the calculation of averages on line 6.
Enable Estimate Earnings per Share (Preferred Procedure)
on Stock Study Front: If checked, the figures used in the Estimate Earnings per Share (Preferred Procedure) screen will also be included at the bottom right-hand corner of the Visual
Analysis graph.
Toolkit 6
37
Enable Growth Rate reference %: If checked, this will display
the % references on the far right margin of the Stock Study
Front.
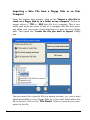
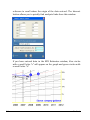
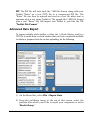
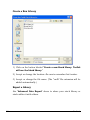
File Locations
The File Locations tab allows you to set defaults for exporting and
importing data.
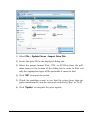
Default Path for Export: Click on Browse to select the path
and destination for your exported files. Click the “Look In”
window’s down arrow to select the drive. Select the directory in
the window below and click “OK.”
Toolkit Stock Library: This data field is here for reference only. You would only need to set this path if you selected Advanced Library Options from the General tab. In that case,
the Library location can be changed in the Library menu that
would appear between Edit and Options.
E-mail Attachments Folder: If you receive data files as e-mail
attachments, enter the location of your email attachments
folder (for example, C:\Program File\Eudora Mail\Attach).
Click on “Browse” to select the path on your computer, and the
“Locate E-mail Attachments” screen will open. After you click
on “OK,” navigate to the location of your e-mail attachments to
set up the future default path, e.g., at C:\Program Files
\Eudora Mail\Attach. Click “OK” to select the path.
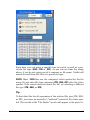
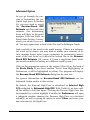
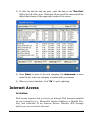
Internet
Since the Internet is no longer only for experts, Toolkit 6 automatically enables all the features. You may add some additional conveniences in this dialog.
38
Toolkit 6
Enable Internet Proxy Settings: If your computer accesses
the Internet through a proxy server, you may enter the settings
here to allow Toolkit 6 access to the Internet. Unless you have
set up a proxy server for your system yourself, or are using a
computer in an office, you need not be concerned about this. If
you have, you will need to have the necessary information at
your disposal. Enter the Port, Proxy Server name, Login ID
and Password and then click the “OK” button to complete the
process.
Check for data updates on Startup: Checking will ensure
that the program always checks for data updates for your
saved companies.
Check for Roster Updates on Startup: Checking will ensure
that the program always checks for updates to weekly Roster of
Quality list of companies. NOTE: If you do not have a subscripToolkit 6
39
tion to the StockCentral.com data service, this update will not
occur.
Enable Alert Before Checking for New Data at Startup: Allows you bypass the confirmation screen for the Smart Data
Updater when starting the program each time.
Enable Club Web Site: Allows you to enter a Club Name and
Internet Address (URL) on this screen, to be displayed along
with the ICLUBcentral and Better Investing access buttons
when you select the “Web” button on the Main Button Bar.
Clicking on your Club button will take you directly to the Club
Web site.
Online Broker Internet Address (URL): Allows you to enter an
Online Broker’s Internet Address. An “On-line Broker” button
will also appear on the Internet Access (“Special”) screen to
provide immediate access to your broker’s site and execute
trades from within Toolkit.
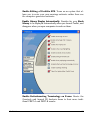
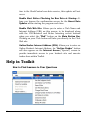
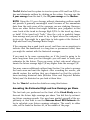
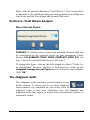
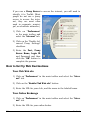
Help in Toolkit
How to Find Answers to Your Questions
40
Toolkit 6
Toolkit 6 includes a built-in help file where you can find answers to
most all of your questions. Context-sensitive help is available for
each screen or dialog box. Press the F1 key or click on the screen’s
“Help” button to access help for the specific screen that you are working on.
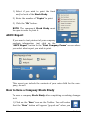
You can also access the general help file’s Table of Contents by clicking on the “Help” button
on the main Toolbar. To see instructions
on common procedures, select How Do I from the Help menu, and
then select a topic from the list menu.
Using On-Screen Help
You can find information on Toolkit tools and commands by clicking
the Contents, Index, and/or Search tabs.
Toolkit 6
41
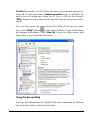
Using the Help Contents Screen
The Contents screen lets you quickly access such information as Investing, Using Toolkit, Glossary, and Menu Commands.
To select a help topic, click one of the help books and then select a
help topic below it.
Returning to the Previous Topic
To return to the previous topic screen, click on the “Back” button at
the top of the Help screen.
Using the Index
An index allows users to quickly get to the information they need and
want. There are two ways users get to topics using the index:
Typing—Users can type a keyword or phrase and go directly to
a topic or to a list of topics containing that keyword or phrase.
Browsing—Users can also browse through the index, and then
select a keyword or phrase. They either go directly to the topic
or to a list of topics containing the selected keyword or phrase.
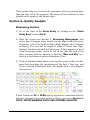
Searching for a Help Topic
To search for a Help topic based on a word or phrase, click the
“Search” tab. The Search dialog box opens to permit you to type in a
word or phrase to search for. After entering a word or phrase, then
click the “List Topics” button. Click to select the topic you want to
view and then click “Display.” Click on the “Back,” “Next,” and “Previous” buttons to navigate through the screens and topics. Or click
on “Search” to select and view another search result. You can refer
back to Toolkit while leaving the “Help” file open. When you are finished using the online “Help,” just close the screen by clicking on the
X in the top right-hand corner.
42
Toolkit 6
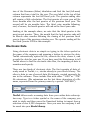
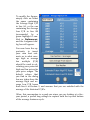
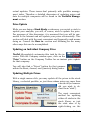
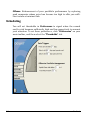
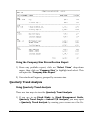
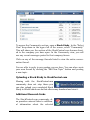
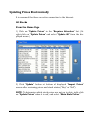
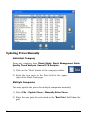
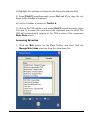
Updating Your Software
In Toolkit 6, at each launch, the software automatically connects to
the Internet and checks to see if you have the latest version of the
software. If there is an update available, it will ask if you would like to
update your software and download the update automatically.
You may turn this feature off within Preferences. Go to the General
tab and deselect Check for Updates when Toolkit Starts, then click
OK. If you have the program open, you can always check to see if an
update is available by going to Help > Check for Updates. You must
have an active connection to the internet to use this feature and
download times may vary.
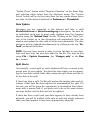
Technical Support and Customer Service
Terms of Support
When you purchase Toolkit, 6th Edition, Customer Support is available from ICLUBcentral’s Support team.
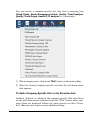
Try This First
The help available from within Toolkit answers many frequentlyasked questions. To get immediate software help:
Select Help > How do I… and click on the option matching
your question. If nothing matches your question, complete help
is available under Help > Help.
Help from ICLUBcentral
Customer support is available through our Web site. To request help
from the ICLUBcentral Support team fill out the brief Support Request Form at www.iclub.com/support/.
The Customer Support team will respond to you directly via email. To
reach our ICLUBcentral Support team by phone, please call (877) 33ICLUB, between 9:30am and 6pm Eastern Time, Monday through
Toolkit 6
43
Friday. Please note that the times and contact information governing
Support Services may change, but our website will always have current Support contact information.
When Requesting Support
Use the following list as a guide to help our experts quickly answer
your questions:
Write down the precise wording of any error message displayed, including the names of any files mentioned in the message.
Be familiar with:
· The version number of Toolkit (Help > About Toolkit).
· The version of Windows you are using (Right click on Computer and select Properties).
· The make, model and amount of memory (RAM) on your computer (Right-click on Computer and select Properties).
· The make and model printer if you have a question or problem
regarding the printing of reports.
· Your Toolkit serial number and date of purchase/installation.
Return Policy
For information on ICLUBcentral’s return policy, please contact
ICLUBcentral Customer Support, at (877)33-ICLUB, between 9:30am
and 6pm Eastern Time, Monday through Friday, or visit the ICLUBcentral website at www.iclub.com.
44
Toolkit 6
ABOUT INVESTING
If you are a newcomer to investing in the stock market, this chapter is
for you! Starting with the few basic terms you need to know, it explains what long-term investing is and why it is successful. It then
identifies basic investing principles, and explains what good quality
growth stocks are and how to find them.
Although Toolkit 6 is a great tool that simplifies stock analysis and
portfolio management, you still must learn about investing to understand and judge the output. The “What you do and why you do it”
sections for each module will give you more specific information. Here
we try to provide you with some background information on such topics as:
· Terms You Should Understand
· What is a Good Quality Growth Company
· Benefits of Long-Term Investing
Terms You Should Understand
Before going too far, it is important to be familiar with the very few
simple terms that are required to understand fundamental, long-term
investment philosophy.
A stock is the registered documentation of the company’s ownership.
Shares of stock are portions of that ownership. They are evidence of a
shareholder’s “piece of the action.” Their significance is in the ownership of a company and not that they can be traded like baseball cards
for some intrinsic value.
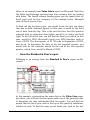
The Balance Sheet is a “snapshot” of a company’s financial status at
a given point in time. There are only three terms on the balance sheet
Toolkit 6
45
that we need to understand to begin with. All of the items on the balance sheet fall into one or another of these three general categories:
Assets are everything that the company owns at that moment.
Liabilities are everything the company owes at that moment.
Equity is the difference between the assets and the liabilities. This is
the net worth of the company at that moment.
Book value (per share) is the company’s equity divided by the number of shares of stock outstanding. This personalizes ownership and
tells you, the shareholder, how much of that company you own.
The Income Statement is a report of the operation of the company
over a period of time. The income statement contains three basic
items that relate to each other much as do assets, liabilities, and equity. These are the items that produce the changes in the equity portion of the balance sheet:
Revenue (Sales) is all of the proceeds from the sale of the
company’s goods or services.
Expense is the costs the company incurred during that period.
Profit is the difference between the revenue and expense.
Revenue, expense, and profit are used to calculate two items which
are particularly important to investors:
Earnings per Share (EPS) are simply the profits divided by the
number of shares in the hands of the shareholders.
The Price/Earnings Ratio (P/E or “Multiple”) expresses the relationship between the price of a company’s stock and its annual earnings and is calculated by simply dividing the current
stock price by the company’s annual earnings per share.
A simple way to grasp this is that, much like the price per pound of
coffee or per gallon of gas is a “rate,” so is the P/E a “rate” one pays
46
Toolkit 6
for a dollar’s worth of a company’s earnings per share. These are all
the terms you need to know to begin with.
Like the Sea
Hardly a traditional investment book lets you read more than a few
chapters without making some reference to the fact that the stock
market is like the sea. This is an excellent metaphor, but most books
just don’t carry it far enough. The stock market is indeed like the
ocean because, as a cork floating upon the surface, the price of a
stock is affected by many compounded influences at once. The broadest influence is, of course, the tide which ebbs and flows regularly
and, in some places, rises as much as fifty feet or more above its low
point. Upon the tide are the broad, rolling waves caused by the various disturbances at the sea bottom. Then there are the large waves
that are caused by the storms and major changes in the atmosphere—all the way down to the various ripples and patterns caused
by the whim of the local breeze that blows this way and that over a
few square yards of the surface. The cork is buoyed by a composite of
all of these—some rising, some falling at the same time. If you were to
try to predict where that cork would be in relation to sea level in the
next moment, you’d have a time of it. What a storm or even an underground earthquake will do to it at any given moment can’t be predicted at all. If you add to that the effects of the winds and the little
breezes, it’s hopeless.
However, over the course of a day instead of a moment, you would be
able to forecast, in general, where your cork would bob. This is because the tides are influenced by the position of the moon, gravity,
Coriolis effect, and a variety of other things that are all scientifically
predictable—so predictable, in fact, that almanacs are published that
forecast the tides, for years ahead, right to the minute.
The stock market is governed by much the same set of influences.
And, just as the sea, it too is predictable over the long term but not
the short term. Over the life of a company, its P/E Ratio—the relationship between its earnings and its price—is virtually constant. It
does, in fact, tend to decline slowly as the company’s earnings
Toolkit 6
47
growth declines, which happens with virtually all successful companies.
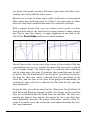
For all practical purposes, however, that relationship is remarkably
constant. For that reason, it is also remarkably predictable. When a
company’s earnings continue to grow and grow, so will the stock’s
price. Conversely, when earnings flatten or go down, the price will follow. The little things that make the Price/Earnings ratio fluctuate
above and below that constant are not so predictable because they
are all caused by investor perception and opinion—just like the winds
that blow across the surface of the sea.
The broader moves are the undulations that are typically caused by
the continuous rising and falling of analysts’ expectations. When a
company first emerges into its explosive growth period, the analysts
expect it to continue to skyrocket. Earnings growth estimates in the
50% range are not uncommon.
As the company continues to meet these expectations, investor confidence booms along with it and more investors pay a higher and higher price for the stock. Of course the P/E rises like a meteor right
along with the price. The faster the growth, the higher the P/E. Then
one fine day, when the analysts’ consensus called for a growth of
45%, the company turns in a “disappointing” growth rate of 38%. The
analysts start wringing their hands because the company has not met
their expectations, and some fund manager will sell.
Next, all of the lemmings on Wall Street will follow suit. And not long
thereafter, you’ll get a call from your broker telling you that you’ve
had a nice ride, you’ve made a lot of money on the stock, and it’s time
to take your profit and get out. In the meantime, he’s made his commission on your purchase, and he’s about to make it on your sale. After a while, when the price and the P/E have plummeted and then sat
there for a while, some analyst will wake up to the fact that a 34%
earnings growth rate is really still pretty darn good. So, he’ll jump in
again. Soon the cycle is reversed. The market will start showing the
company some respect again. And, you’ll get a call from your broker.
Of course, as a good fundamental investor, you didn’t sell the stock in
the first place.
48
Toolkit 6
Because you were watching the fine earnings growth all along, you
chose the opportunity to buy some more. In the meantime, your broker’s clients who were not so savvy took their profits (paid the taxes
on them, by the way), and wished that they had been in there all
along. By the time their broker called them again, the price had already climbed past the point where it made good sense to jump in
again.
These are the kinds of influences that cause the longer-term undulations in the P/E. Shorter-term are the ripples and wavelets. Every little utterance of a government official or company officer, insider buying and selling (which may or may not mean anything), rumor, gossip,
and anything else that can influence the whims of those on the street
will. Many will use these stories to make or break a market in the
stock.
It’s best to assume that any price movement that is not related to the
company’s earnings is transient. If the stories—not the numbers—
cause the price to move, it won’t last. What goes up will come down,
and what goes down will come up. Only when the sales, pre-tax profits or earnings drive the change do you have to be concerned—and
then, only if you expect the performance decay to be a major, longterm problem.
Remember also, a sizable segment of Wall Street doesn’t make its
money on the ocean. They make it on the “ocean motion.” Buying or
selling, it makes little difference to them what you do. They make
their money either way. But it sure makes a difference to you!
Fundamental Investing Principles
History has demonstrated that there are five basic principles that you
should follow if you want to be truly successful
Invest Regularly in the Stock Market
You don’t need a lot of money to start investing in the stock market.
In fact, small amounts, invested regularly, will provide all of the proToolkit 6
49
tection you need against the vagaries of the market. Known as “dollar
cost averaging,” this principle allows you to purchase more shares of
a stock when the price is low (that is, cheap) and fewer shares when
it’s high (expensive). As a result, over the long term you will own more
shares at a lower price than if you had invested a single lump sum in
that stock.
Reinvest all of Your Profits and Dividends
This principle provides for you to enjoy the “magic of compounding”
which means that you earn money on the money you earn. Most of
your gains should be “unrealized” (the appreciation in the market
value of your portfolio without having to sell to “realize” the gains,
known as “paper gains”). However, if you re-invest your dividend income and realized gains, you would double your money in five years
with a portfolio that returns just a little less than 15% a year. If you
“take what you make,” your portfolio would have to return 20% to do
the same.
Invest for the Long Term
“Long-term investing” implies that your fortunes are determined by
the growth of the companies in which you invest, not simply by the
price of the stock. It also means that you don’t need to be considered
about “timing the market,” attempting to gauge if the overall market
or a single stock is high or low before making a purchase or sell. During periods when the overall stock market is down, in fact, can be excellent opportunities to find under-valued stocks, which will increase
your return as the market (and your stocks) rise. Though a “buy and
hold” approach to the market does not mean “never sell,” patience is
a virtue well worth cultivating in when building a portfolio.
Invest Only in Good Quality Growth Companies
Depending upon the size or maturity of the company, you should look
for companies whose “monotonous excellence” produces consistent
annual earnings growth of anywhere from 7% to as much as 20%
50
Toolkit 6
compounded annually. As these companies grow, their share prices
will ultimately follow, and your portfolio will reap the returns.
“Total Return” (the combination of both capital appreciation and dividend yield) is, certainly, the name of the game, but it’s best to invest
in companies whose growth, rather than dividend income, is going to
provide the bulk of the return.
But it’s not enough to simply invest in growing businesses. You
should also set high standards of quality for the companies in which
you invest. Companies of quality will outperform their peers, perform
better in economic downturns, and/or see their share prices take
large tumbles during the occasional stumble.
Diversify Your Portfolio
While the first three are principles that are essential to grow your
capital, this “defensive” principle is important as a means of minimizing risk. Putting all of your eggs in one basket has never been smart,
and we look for diversification in both size (risk/return considerations) and industry.
Strive to build a portfolio that contain approximately 25% small companies, 25% large companies, and the rest in between—divided
among a variety of industries. In this way, you can reduce the overall
risk in your stock portfolio and have a better chance of reaching your
target return.
What Is a Quality Growth Company?
Of the five principles listed above, the fourth is the real “trick” as the
others can be followed more or less mechanically. To invest only in
high quality growth companies, you will have to prospect for good
candidates and then analyze and evaluate each.
Toolkit 6
51
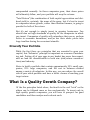
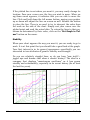
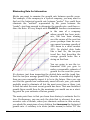
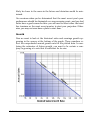
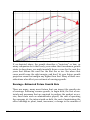
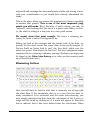
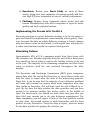
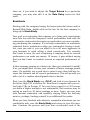
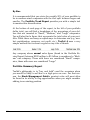
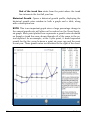
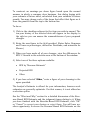
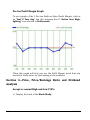
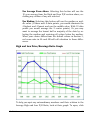
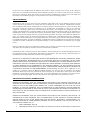
Just What Do We Mean by Growth?
As can be seen in the diagram above, a successful company will pass
through several phases of growth:
· The startup phase when earnings are predictably below the
break-even point.
· A period of explosive growth when the percentage increase in
sales and earnings can be spectacular.
· The mature growth period when revenue becomes so large that
it is difficult to maintain a consistent increase in the percentage of growth.
· The period of stabilization, or decline for companies that do not continue to rejuvenate their product mix or expand their target markets.
You should invest only in companies that have a track record as a public
company for at least five years and for which the data is readily available.
52
Toolkit 6
We are therefore interested in investing in companies that are at least five
years into their explosive growth periods but that have not gone past their
primes. Obviously, the longer the company has had a successful track record—provided its management copes successfully with maturity—the more
stable and risk-free it is apt to be.
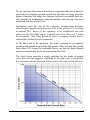
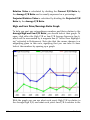
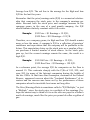
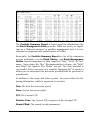
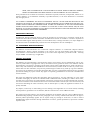
Depending upon the size of the company, fundamental investors
should expect growth rates that vary from a low of about 7% to a high
of around 20%. Hence, if the company is an established one with
sales over the $5 billion mark, a growth rate of as little as 7% might
be acceptable. (The Total Return of such a company should have a
substantial dividend yield component.)
At the other end of the spectrum, the newer company in its explosive
growth period should show double digit growth. While we know that growth
rates above 20% cannot be sustained forever, we look for higher growth
rates as compensation for the increased associated risk.
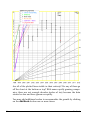
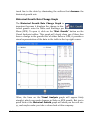
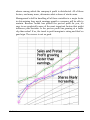
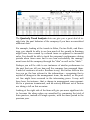
The chart below provides a rough guideline for the kinds of growth
rates that concept suggests. Anything in the light area is acceptable
for companies whose revenues (sales) match the scale on the left side.
Toolkit 6
53
For example, if a company’s sales for the current year are in the
neighborhood of $300 million, we would look for a growth rate of better than 12%. For a company with $1 billion in sales, we would want
at least 8%. These are the standards of growth that we will seek for
investment. Higher risk situations involving companies early in their
life cycles are speculative and not of investment quality.
How Do You Find Such Companies?
There are lots of good ways to prospect for likely candidates to study.
Here are just a few:
· Find out the names of the companies that produce the products and services that you use and think are excellent.
· Ask your broker for a suggestion or two.
· Join an investment club.
· Attend local BetterInvesting chapter meetings, Investor’s Fairs,
the InvestEd or BetterInvesting national investing conferences,
and other events where users of Toolkit 6 may be present.
· Use one of a number of screening programs, such as Stock
Prospector (also available from ICLUBcentral), to filter out
from a large universe of companies only those that meet your
criteria.
· Look in the newspaper for exciting companies.
· Subscribe an investing newsletter such as the Investor Advisory Service published by ICLUBcentral. Each issue features
three recommended stocks with accompanying stock studies
prepared using Toolkit.(www.investoradvisoryservice.com)
The point here is that you can get a good idea from almost anywhere.
There are as many suggestions out there as there are companies, and
one might be just as good as another. But, so long as you clearly understand that you should never, never, never buy a stock as a result
of a “tip,” you’re going to do just fine.
Peter Lynch, one of the nation’s most successful fund managers, said
that one of his greatest picks was “L’Eggs”—the hosiery sold in the
supermarkets. His wife came home one day, extolling the virtues of
the product and the concept and he decided to take a look at the
54
Toolkit 6
company! Notice that we didn’t say “bought the stock.” We said that
he decided to “take a look at” the company. He did buy it, but only after doing a thorough job of homework on it.
Most “tips” fall in the category of either “inside information” or new
product potential. In the case of the former, you must ask yourself, “If
that information is so new, exciting, and/or secret, how come the person
who told me about it knew about it?” (If it was your stockbroker, you
may rest assured that the street has already discounted it.)
In the case of new product information—”ABC Company is about to
introduce a revolutionary new widget”—you must ask yourself, “What
percentage of current revenue could such a new product generate if
that product or service is successful?” Usually the answer will be that
sales of the new product will bring in only a tiny fraction of the current sales figures. If the company is so small that it would have that
much effect on the company’s bottom line, then it is probably still too
small (new) a company to bother with or the introduction of the new
product is too risky to gamble your capital on.
Write down any suggestions you receive, the names of firms that produce the products that you know are winners, or services you think
are particularly important for the times. In short, the best criterion
for finding a company that meets your needs is to find products or
services that are successful.
Read the financial newspapers and newsletters and see what the analysts are saying about some of the “comers.” Be sensitive to information about industries and specific companies in the regular newspapers and other media.
Common sense and a little observation are far better providers of
stock tips than the average broker whose company may have its own
interests at heart when it “suggests” he push a stock! The moral of
the story is that you can find good candidates anywhere.
Once you have a company you are interested in—or a list of them—
you can then go to work.
Toolkit 6
55
Obtaining Data
Once you have selected a candidate for study, you will then need to
obtain the data required for analysis and evaluation using Toolkit 6.
Publicly held companies are required to report their financial results
four times a year, and companies that are large enough to be of interest to you as an investor are also required to report those results to
the Securities and Exchange Commission within a reasonable time after they close their books each quarter.
You may either enter it manually from printed reports or from the Internet, or you may import it electronically from an increasing number
of sources that are currently available. This data comes in different
forms and formats and is described in detail in the “What You Do
and Why You Do It” section of this manual which follows.
Benefits of Long-Term Investing
80% Successful Stock Selection Record
Because long-term trends in the performance of companies are reasonably predictable, it is possible to pick as many as four winners out
of every five stocks that you choose. Put another way, that’s an 80%
success rate
Money Can Double Every Five Years
It is also possible, with reasonable diligence, to replace the one out of
five that may be a loser before it significantly damages your portfolio.
Those who do can enjoy 15% (or even higher) compounded, annual
growth in the value of their holdings—a rate that would double your
money in five years.
Tax Benefits
The best gains are unrealized gains—the increase in the value of your
stock as it sits in your portfolio. You don’t have to pay taxes on your
gains until you sell. Short-term investors tend to sell their winners
56
Toolkit 6
and wait for their losers to grow. (They eventually wind up with a
portfolio full of losers.) That’s why they don’t make out as well as the
average long-term investor who stays with the winners for the long
haul.
Simple Procedures
The fundamental investment methodology is not “rocket science.” Anyone can learn it quickly and use it successfully for a lifetime.
Carefree Portfolio Maintenance
There is no need to anxiously watch your stock prices hourly, daily—
or even weekly—as short-term investors and speculators do. If you
wish to update your prices and watch your progress on a monthly basis, that’s great. But you can do a fine job of managing your investments if you tend to them only every two or three months.
Toolkit 6
57
USING TOOLKIT 6:
WHAT YOU DO AND WHY
YOU DO IT
This section of the manual, “What You Do and Why You Do It” will
walk you through the basic concepts behind your fundamental investing tasks. This section is broken into two distinct areas: the acquisition phase, in which you select, study, and evaluate stocks for
purchase; and the portfolio management phase, in which you perform the tasks required to optimize the performance of the portfolio of
stocks you have purchased.
Starting with an initial, rudimentary analysis using the First Impression, we’ll take you through a more detailed and complete Stock
Study using the Stock Study Form. Then we’ll discuss the rationale
behind comparing stocks using the Comparison module. This acquisition process is the keystone of fundamental investing, and the data
developed in this pursuit is valuable for your portfolio management
chores.
The second part of this section will be of special interest to you, since
it’s concerned with managing your portfolio of stocks after you acquire them. It builds on the information that you’ve assembled in the
acquisition process and offers a different perspective of the same information in a fashion that is indispensable for your portfolio maintenance chores.
58
Toolkit 6
In Toolkit 6, we have harnessed the real power of the computer to
implement a process that eliminates a reliance on the paper forms on
which early versions of Toolkit were dependent. Of course you may
still access those reports as you have in the past if you’re more comfortable doing so. However, you will see how the very same tasks are
now accomplished automatically and with less confusion with the
Portfolio Report Card, Portfolio Overview, and Portfolio Alerts
which tell you all you need to know about the performance of your
portfolios as a whole and the companies in them.
This process separates your urgent, defensive tasks from the less urgent but important offensive tasks. It calls your attention to the companies needing attention, and then allows you to make the “sell” or
“hold” decisions with ease, following a simple and logical, step-by-step
procedure.
The “Smart Challenger” simplifies the job of replacing an overvalued
company with one with more promise, permitting you to see how all of
the stocks in your stock library meet your needs.
This section parallels the last section in the manual, “How you do
it”—the true software manual that tells you what buttons to push
and menus to access to accomplish the things that we discuss in this
section. Both permit you to either execute the step-by-step process
with the computer as you read about it, or refer to the concepts behind the steps as you perform them with aroused curiosity.
About Data
Overview
Until recently, the selection of a source of data required to analyze
companies was somewhat confusing. Favored among fundamental investors for the past two decades was the Value Line Survey, a source
for manual data entry which had the unique benefit of “normalizing”
data—stripping from the reported data those items that were either
infrequent or unusual—so that the remaining data more closely rep-
Toolkit 6
59
resented what one could expect from a company on a regular, continuing basis.
With the advent of the computer, a number of electronic sources of
data emerged and became the most popular source of data. Sources
such as Market Guide/Multex (now Reuters) and Standard & Poor’s
came into popular use by users of ICLUBcentral software because of
the convenience and speed with which it could be imported into that
software, generating a Stock Study ready for judgment in mere seconds.
Today, ICLUBcentral offers its own data for Toolkit 6 (and our other
software programs) through our StockCentral.com web site. Using
data provided by Morningstar, the data files and data reports available in Toolkit 6 and on the StockCentral.com web site are available
at a price all can afford.
Because it is the highest quality data, offers the most desirable configuration for analysts (diluted, normalized earnings from continuing
operations, excluding extraordinary items), because it is so inexpensive, and because it imports so seamlessly into your Toolkit, we now
assume that most who use Toolkit 6 will have access to that data.
Even though manual data entry is still an option, we will no longer
devote much attention to the manual data sources. Regardless of the
source, however, it’s important to understand the differences in the
nature of the data you will use.
Data Types
Data comes in several “flavors,” depending upon who provides it and
what specifications are made by the data vendors who use or sell the
information. All are correct, and, oddly enough, all are different.
Company Reported Data
This is data hot off the company’s presses. It may or may not be filed
with the SEC. It may or may not be audited. It is, nevertheless, what
60
Toolkit 6
the company has said that it is (the balance sheet), and what it says
it has done (the income statement).
Standardized Data
Standardized Data is company-reported data that has been analyzed
by professionals who look at the details of income and expense and
“map” these numbers into standard categories so that companies may
be compared on similar terms. Fiscal year dates are adjusted to a
regular standard. This data is usually taken from SEC filings and has
usually been audited—at least the annual data. Bear in mind that
there is a trade-off between the quality of company reported data and
the timeliness of standardized data.
Normalized Data
Company reported data that has been analyzed and altered to reflect
the deletion or addition of nonrecurring income and expense is referred to as “normalized.” Value Line data is “normalized” but not
standardized.
Other Issues
The most significant difference between the various types of data is in
the manner in which earnings are reported. Some data providers offer
earnings “as reported.” Others offer “earnings from continuing operations,” which implies that any earnings (or losses) from operations
that have been discontinued are expunged from the data.
All of these methods of reporting data are “correct” even though they
are different. All are presented as prepared according to “generally accepted accounting procedures.” The most important point is that you
as an investor, using a particular data source, understand the “differences” and their impact on your judgment, and that you take precautions not to mix your sources.
StockCentral data, of which we assume the great majority of Toolkit
users will avail themselves, provides diluted, normalized earnings
from continuing operation, less extraordinary, special items and other
Toolkit 6
61
non-recurring events not regularly accounted for in ongoing operations. This is the most desirable form of data for the analyst.
Data Sources
Electronic Data
For years, it was necessary for computerized investors to laboriously
enter the data by hand. While we have retained the provision for so
doing—many still prefer Value Line data because it’s what they are
accustomed to—still more appreciate the immense benefits of having
timely, accurate data available in a keystroke.
Electronic data eliminates inaccuracies, tedium, and procrastination
and so ICLUBcentral makes available by subscription data files for
Toolkit 6 from StockCentral.com underlying data from Morningstar, Inc., a premier provider of financial data to web sites like Yahoo! Finance, Fortune.com, and Money.com. The data provided includes diluted earnings from continuing operations less extraordinary
and special items as well as other non-recurring events not regularly
accounted for in ongoing operations.
Toolkit 6 provides as seamless a process for importing this data as
possible, and this data is also provided on-line in printable reports on
the StockCentral.com web site. Once you have properly configured
your program, the import of data requires no additional steps other
than selecting the stock you wish to study or clicking on options for
Toolkit to update or import the information for one or more stocks.
Manual Data Entry
The Value Line Survey is a popular source of information for manual
entry, and the most comprehensive for your purposes. It is favored
because it is a very concise representation, on a single page, of all the
data necessary to complete the Stock Study.
The data is laid out so that it conveniently follows the flow of the program and, with a little practice, it will take you no more than five to
ten minutes to input the data for a company. Value Line may be too
62
Toolkit 6
costly to subscribe to for the average investor, but it is available in
most libraries.
Standard and Poor’s “tear sheets” have been made available to
Toolkit users through some brokers and may be downloaded by their
clients from their Web sites. This data is available in most libraries as
well. It is not quite as concisely laid out (requiring both the front and
back page) nor is the data quite as easy to locate; however, many
Toolkit users have used this source for many years and have become
accustomed to it.
As with the Value Line Survey, the data that you will use for your
Stock Study is highlighted in the figure on the bottom, and is not
nearly so intimidating as is the form at first glance.
At the end of every fiscal year, companies will publish an annual report that is intended to inform the stockholders about what has happened during the past year and what is expected in the future. While
many of these reports make interesting reading and are good sources
of data, there is no standard to which all reports comply.
Companies have a great deal of latitude in determining just how the
data will be presented, how much of it needs to be presented, and
what they say about the reasons for past and future performance. Because the information is not presented in a standardized fashion from
company to company, it is frequently difficult to find all of the required data.
In many cases, there will be insufficient data for you to do your Stock
Study. Some companies, for example, provide only three years of history. Much of the story is hidden in the footnotes to the financial
statements, and it takes a financial “detective” to interpret all that is
there.
All of these things make the annual reports the least desirable source
of data; yet, you shouldn’t overlook them if you are truly interested in
a company. Digging out the data you want is a good exercise and
learning experience, and you might be surprised how much you can
learn about a company just by following the numerical paths and
Toolkit 6
63
reading between the lines. Still, annual reports will most often merely
be a source of additional or supplementary information.
We recommend that beginning investors stick with the first two
sources for manual entry—or the next one.
EDGAR—The SEC
SEC filings contain data that can be used for manual
data entry. EDGAR, an acronym for the Electronic Data
Gathering, Analysis, and Retrieval system, is a database
of forms that are required by law to be filed by companies with the U.S. Securities and Exchange Commission
(SEC). EDGAR can be found at the SEC’s site at
www.sec.gov/edgar.shtml.
Quarterly and Annual SEC fillings—10-Q’s and 10-K’s— are more
useful than annual reports. These reports are required by the SEC
from each public company. They contain all of the same basic information as annual reports, but they are not dressed up with pretty
pictures and self-serving text. And, they are in a more or less standard format. Data is easier to find, and the risks and other negative issues are stated more forthrightly.
Evaluation and Acquisition
Stock Study
Probably the most interesting and exciting part of the investment process is the evaluation and acquisition of a good portfolio of fine companies. Doing your “homework” diligently and conservatively is the
key to success, and the tools that ICLUBcentral provides to do so are
the Stock Study and the Comparisons. With them, you should be
able to pick four winners out of every five stocks selected—assuming
that you use these tools conscientiously and conservatively.
64
Toolkit 6
Toolkit 6
65
Of course, the first step is to prospect for good companies to study.
Whatever your source, you should never purchase a stock until you
have analyzed it using the Stock Study.
Stock Study—Purpose
The Stock Study is the keystone of the fundamental investment discipline. It has two purposes. The first is to determine if the company
under consideration is a strong and healthy company, of good enough
quality to warrant investment interest.
The second is to determine if its stock is selling at a price that would
make it an attractive investment. No matter how good the company
is, if the stock is overpriced, it is not a good investment.
Overview
To satisfy the two purposes described above, the Stock Study is divided into five sections of which the first two deal with the quality issues and the others with value. Just two items are sufficient to judge
the quality of a company. If they are satisfactory, any other quality
measures will usually take care of themselves:
The first is the growth of sales and earnings. These criteria are plotted
on a semi-log graph in Section 1—Visual Analysis, where you can
see if the growth is stable and strong enough to deserve your interest.
The second is, assuming that the growth is satisfactory, whether
management has the capability of sustaining that growth.
Again, there are two questions that need to be answered to determine
management’s ability. These are dealt with in Section 2—Quality
Analysis. Line 2A displays Pre-tax Profit margins and allows you to
see if profit margins are stable, sufficient, and have not been trending
down. Line 2B displays Return on Equity which tells you whether
management is able to earn a steady and substantial return on the
investors’ money. Line 2C displays the debt/equity ratio for the company, a measure of the company’s dependence on borrowed funds.
66
Toolkit 6
If—and only if—you determine from the above that the company is a
good quality company, then the next issue is the price of its stock. Is
it a good value? The objective is to determine if the value of your investment has the potential to double in five years.
Section 3—Price, Price/Earnings Ratio, and Dividend Analysis
deals with the historical relationship between earnings and the price
of the stock. It calculates historical averages that are used to develop
estimates of future price ranges. This section also deals with the
company’s performance in paying dividends. Remember, your increase in value comes from both appreciation and dividends.
While you assess the historical rates of growth for sales and earnings
in Section 1, take the opportunity to make a rough estimate of future
sales and earnings growth based upon what you learned about the
company’s history.
In Section 4—Evaluating Risk and Reward over the next 5 years,
you are now ready to use your evaluation of history and estimates for
the future to determine the value of the investment. You have determined from Section 3 what you believe to be the highest P/E and lowest P/Es that investors would be willing to pay for this company’s
stock. You have also made a conservative forecast of the highest and
lowest earnings per share that this company might make, assuming
the company operates normally.
Multiplying the highest P/E multiple by the highest forecast earnings
and the lowest multiple by the lowest, the program calculates, respectively, the highest and lowest prices the stock might sell for in five
years. This price range, from the highest to the lowest, then permits
you to determine:
· how the current price compares with that range
· how the risk you would take compares with the potential reward
· how the Current P/E multiple compares with the average
Finally, Section 5—Five Year Potential looks at the dividend income. It also calculates the possible total return you might expect to
receive on your investment. With the information made available, you
should be able to make a sound decision as to whether or not to buy
68
Toolkit 6
the stock at its current price. You can also find out at what price the
stock would become a reasonable buy if it isn’t at the moment.
Entering Data
Now that you have an idea where to get company data, you need to
learn how to input it into Toolkit. Data can be entered manually, or it
can be imported electronically. This part of the manual will explain
both in general terms. You will find detailed instructions for each step
of the process in the “How to” section.
Manual Data Entry
Manual data entry is somewhat tedious to begin with. But, with a little experience, it will become relatively painless, taking just a few
minutes per company.
As we discussed above, the most common sources for data for manual entry are Value Line and Standard and Poor’s Report, both of
which are available at most libraries or can be purchased by subscription. You may also obtain data from Internet sources that, while
it is not in a format to import electronically, may be printed out and
serve as a satisfactory source for manual data entry.
Navigating Data Entry Fields
Click on any space into which you want to input data. Use the [Tab]
key to move from field to field about the screen. (To move “backwards”
on the screen, hold down the [Shift] key and then use [Tab].
In the Basic Data screen, the [Tab] key moves the cursor from one
field to the next in a pre-determined order. On the Quarterly and
Annual Data screens, the [Tab] key moves the cursor horizontally to
the right (or to the left, if you hold the [Shift] key).
Drop-down lists open with a click on the menu arrow. (See the “Exchange,” “Source,” and “Month Fiscal Year Ends” fields.) Enter the
appropriate data into each field from Value Line, S&P, or whatever
Toolkit 6
69
source you choose. (Green-shaded areas indicate the minimum data
elements required by the program to complete a Stock Study.)
NOTE: Context-sensitive Help is always available by clicking on the
Help button on whatever screen you are viewing (or you may press
the F1 key). Within the help screen that appears, in most cases you
will be able to click on the appropriate picture of the screen itself for
an explanation.
To help you locate the required data, sample Value Line and S&P reports are printed following the “Quarterly and Annual Data” section
of this manual, highlighting their respective relevant data.
The New Company Data Entry Screen
To input your data, you will need to open a New Company Data Entry screen. You can do this several different ways:
·
Click on the “Stock Study” button on the
Main Toolbar, or the “Begin a New Stock
Study” button on the Toolkit 6 Home Page, and
then select “Manual Data Entry from a data
source such as Value Line of S&P Stock Reports.”
·
Go to the File menu, and select “New Company”
·
Click the “Library” tab, and then the New button in your
Stock Library:
The Data Entry screen will appear, and you may begin entering data.
70
Toolkit 6
Basic Data Screen
The Basic Data screen first opens so you can enter general and capitalization information, including the company’s name, industry, capitalization, and other data that seldom change.
The green-shaded areas indicate where you must enter data so that
Toolkit can perform the necessary calculations to complete the
Stock Study.
To access Quarterly and Annual Data screens, click on their respective Tabs.
Toolkit 6
71
Annual Data Entry Screen
Annual Data entry captures the following data: high and low stock
prices, earnings per share, dividends paid, book value, sales, net profit, tax rate (expressed as a percentage), and the average annual number of outstanding shares.
You should enter as much data as you have available, with a minimum of five years being sufficient to complete a valid Stock Study.
72
Toolkit 6
Quarterly Data Entry Screen
Quarterly Data accepts the reported Sales and Earnings per share
(EPS) for five quarters. Pre-tax Profit (PTP) and Taxes may also be entered here (provided those additional fields have been enabled in your
Preferences).
You will always use the most recently reported five quarters, so the
last quarter showing at the bottom must be the most recent quarter
for which you have data. If the last quarter showing is not the most
recent data quarter, click in the “Last Quarter of Data” space (or the
menu arrow located there) and select the quarter you wish to add to
the screen.
Toolkit 6
73
Shown on the next pages are the Value Line and the Standard &
Poor’s pages, highlighting the data items that are used to manually
complete the Stock Study.
Value Line Investment Survey Company Report
74
Toolkit 6
Standard & Poor’s Company Report
Toolkit 6
75
Determining the Proper Fiscal Year . . .
All companies keep annual books, most often divided into quarterly
periods. These annual periods are called fiscal years. Some vary their
reporting periods so that they don’t end on precisely the same day
each year (e.g., companies with 13-week reporting periods). About 40
percent choose fiscal years that don’t coincide with the calendar year;
i.e., end on other than December 31st.
Because of these variations, determining a company’s ending dates
for their reporting periods can sometimes be confusing. For example,
it is quite possible for one company to end its fiscal year 2013 in June
of 2013 and another to end the same fiscal year (2013) in June of
2014! The most important issue is consistency. You will do just fine if
you consistently use the same method to determine the fiscal year
and quarter ending dates.
. . . from the Value Line Survey
Let’s look at Value Line and see how we can determine the correct
dates. Probably the easiest way to do this is to look at the boxes in
the lower left corner of the Value Line page for Quarterly Sales or
Earnings per Share.
76
Toolkit 6
Above is an example from Value Line’s report on Microsoft. Note that
the Sales and Earnings sections have four columns that are headed
with dates. The fourth column heading gives you the month that all
fiscal year’s end for this company. In the example below, Microsoft
ends its fiscal year in June.
To find out the last fiscal year, you would locate the last row down
that has no bold, italicized figures. In this case, it would be the third
row of data from the top. This is the row that has four full quarters
reported with no estimated data (which would be in italics and bold
type). To the left of this row, you will find the fiscal year which, in this
case, would be 2008. Microsoft’s fiscal year 2008 therefore ends in
June of 2008. The first quarter of FY ‘09 ends in September of 2009,
and so on. To determine the date of the last reported quarter, you
would look for the calendar month for the end of the last reported
quarter, which, here, would be March of 2009.
. . . from the Standard & Poor’s report
Following is an excerpt from the Standard & Poor’s report on Microsoft.
In this example, representing the same date as the Value Line example above, you will note that we again make use of the quarterly data
to determine the date information that we require. You will find the
month that the fiscal year ends at the top of the quarterly tabulation,
labeled as such. To find the most recent fiscal year, look at the botToolkit 6
77
tom of the Revenues (Sales) tabulation and find the last (left-most)
column that has a total for the year. The year label at the top of that
column represents the last full fiscal year. The quarter-ending date
will require a little calculation. The first quarter of a new year will be
three months after the last quarter of the previous fiscal year. The
second will be six months later. The third, nine months following;
and, of course, the fourth quarter will end as the fiscal year ends.
Looking at the example above, we note that the third quarter is the
most recent quarter. Thus, the month that the last quarter ends will
be March—nine months following the closing of the previous fiscal
year in June of the previous calendar year. The quarter ending will be
the third Quarter 2009 in this example.
Electronic Data
Using electronic data is as simple as typing in the ticker symbol or
the name of the company and pressing a button to retrieve the data.
Toolkit automatically opens the file, extracts the data, closes it, and
records the data for your use. If you have used the Preferences to tell
Toolkit where to find the electronic data files, the importing of data is
seamless and speedy.
There are two kinds of electronic data. The first consists of data already saved in Toolkit, i.e., stocks already in your Stock Library. The
other is data in one of several data file formats, created expressly for
use in the software. These include files with either “*.SSG” or “*.ITK”
file extensions. (File extensions are the last three characters of a file
name, separated from the primary name by a period: “ABT.SSG”).
Toolkit 6 has made accessing data from your online data subscription easy. Type in a ticker symbol or the name of the company you
wish to study and then press the Download button to import from a
selection of over 8,000 companies. Once you save the company it will
be saved into your Stock Library.
78
Toolkit 6
Working with an existing Stock Study
There are a few ways to access companies within your stock library. If
you are sure that the company resides in your stock library, simply
follow the same steps you did in the previous section, type in the ticker symbol or name of the company that you wish to open. Toolkit will
search your Stock library to see if you have previously saved this
stock. If you have, Toolkit will open the company with the designation
that it was opened from the stock library.
NOTE: If you do not see (From the Stock Library) when opening a
stock this way, check the Data Feed tab of the Preferences, and
make sure Library First is selected at the bottom of the window.
Another way to access a company located in your
Stock Library is to click the “Stock Study” button
on the Main Toolbar, or “Begin a New Stock Study”
from the Toolkit 6 Home Page, and then click the
“Open a company that was previously saved in
Toolkit” button.
Using Subscribed Data
To use subscribed data, first click the Stock Study button on the
main toolbar, or Begin a New Stock Study from the Toolkit 6 Home
page. This will open the Acquire Data window.
The “Use Subscribed Data” button is used to import Stock Study
data files from a paid subscription such as StockCentral.com’s Data
Service (available from ICLUBcentral), BetterInvesting’s Stock Data
Service or AAII Stock Investor PRO *.SSG data files. Toolkit will automatically import the data from the data file location you specified
Toolkit 6
79
on the Data Feed tab of the Preferences screen. When you click on
the “Use Subscribed Data Files” button, the “Company Locator”
screen will open.
Company Locator
If you know the ticker symbol for your company, type it in, click on
the “Use It” button (or double-click on the company that will be highlighted) and Toolkit will import the data, and open a new Stock
Study.
You may also type the company name or sort by industry to locate a
company. Toolkit has a “type ahead” feature, which automatically
sorts the list of companies as you type. Just start typing in the company’s name, or any word in the company’s name (or the first letters
of the ticker in that space), and Toolkit will sort and reduce the list,
as you type, until you locate your company.
80
Toolkit 6
Once you locate your company, you can import the data to the Stock
Study either by entering the Ticker symbol and clicking on “Use It” or
by double-clicking on the highlighted company. Toolkit also allows
you to sort by the different column headings, such as ticker, company, or industry by placing your cursor on the heading (Ticker, Industry, Company, Exchange) and, when your cursor changes to down arrow, click to sort that field.
Once sorted, you can scroll down the list to look for the company.
After selecting a company, click either “OK” or “Use It” to import the
data and open the company’s Stock Study.
NOTE: The data files you subscribe to may not include all of the companies listed in the Company Locator database. New companies may
not appear in the list, as well. The company database in Toolkit 6 is
periodically updated when the program itself is updated.
Toolkit 6
81
Importing a Data File from a Floppy Disk or on Your
Computer
From the Acquire data window, click on the “Import a data file located on a floppy disk or in a folder on my computer” button to
import either a *.ITK or *.SSG data file for a company. This is normally used when you want to look at a company data file that someone either sent you as an e-mail attachment or gave you on a floppy
disk. This opens the “Locate the file you want to import” dialog
box.
You can search for a specific file in a known location, e.g., your e-mail
attachment folder or on a floppy disk; or, if you don’t know where the
file is located, click on the “File Finder” button to search your computer for the file.
82
Toolkit 6
From here, you can select a specific drive to search, as well as a particular file type (.SSG .ITK or .ZIP). As you can see from the image
above, if you do not enter part of a company or file name, Toolkit will
search for and show ALL files of a particular type.
NOTE: Most *.SSG files use the company’s ticker symbol for the file
name. Do not enter file type extension (ITK, SSG, ZIP) after the ticker
symbol. If the search does not locate the file, try selecting a different
file type (ITK, SSG, or ZIP).
Tip
To find data files for all companies of the selected file type (ITK, SSG,
or ZIP), just enter an asterisk (*) “wildcard” instead of the ticker symbol. The results of the “File Finder” search will appear in the pane be-
Toolkit 6
83
low, along with the paths to their locations. Just click on the file to
select it and click “Import” to open the Stock Study.
Roster of Quality Companies
For many years the Roster of Quality Companies has been a favorite
of ICLUBcentral users and other fundamental investors as a source of
high quality stock ideas. With the Roster in hand you have a prescreened list of companies that meet some minimum quality requirements. These stocks are ranked by their quality, letting you know at a
glance which companies are best suited for further analysis.
In Toolkit 6, for all
StockCentral
subscribers, all of the
companies in the
most recent Roster
of Quality will be
listed in the Library
tab as a portfolio.
This
listing
is
locked,
which
means that you may
not add or delete
companies from the
Roster of Quality.
The listing is updated
automatically
once a week, and
the date of the last
update is listed next
to the Portfolio Holdings header (“Last
updated date”). You
may also select File
> Update Roster of
Quality from the
menu to force the
84
Toolkit 6
program to download the most recent listing of companies.
When you select the Roster of Quality, the Quality Index is displayed
in the right column next to the company names. The Quality Index is
calculated on a 0 to 10 scale, with 10 indicating the highest quality
companies. Click on the column header to sort the companies by
Quality Index in ascending/descending order.
Company names that appear in red text indicate that these stocks have not
yet been studied and added to your Library. Company names in black text
indicate that you have an existing study of those companies.
Quality Index
The concept of the Quality Index (which also appears on the First
Impression screen) comes from ICLUBcentral’s Take Stock software
program, which has been incorporated into StockCentral.com.
The Quality Index rates the quality of a company on a scale of 1 to
10, based upon its capacity for growth and management's efficiency
and effectiveness. A minimum of 3.4 is required, while 6.7 or better is
considered desirable.
To learn more about the Quality Index, please see Take Stock 3rd edition,
by Ellis Traub, published by ICLUBcentral, or visit StockCentral.com.
About “Judgment”
An indispensable ingredient in successful stock evaluation and selection is the application of “judgment.” While not nearly so complicated
as some would have you believe, this is nonetheless more of an art
than a science. It’s a personal skill that you will develop and fine tune
as you gain experience.
However, don’t be intimidated by your lack of experience if you’re new
at it. In fact, because you’re apt to be more conservative than the investor who has been doing it for a while, you could very well have better results.
Toolkit 6
85
The essence of judgment, in this context, is the application of the
wisdom that you gain about industries, the natures and “personalities” of companies within certain industries—or just in and of themselves—and the significance of the factors that contributed to the history that you are studying. Such items as the extent to which acquisitions—rather than increases in sales— contributed to growth, the extent of past and potential competition, the changes in management,
and so on, all contribute to your judgment. Nor are these at all mysterious. They are all common sense issues that you will simply be more
mindful of as you progress.
The approach described below is a very basic approach to help those
of you who may be still learning fundamental investing to make the
crucial judgment decisions. Each of these suggestions is directed toward the most conservative action to take on the basis of the numbers and the pictures that you see, alone. You may very well change
these steps as you grow in experience and gain confidence.
The Three Levels of Judgment
There are three distinct levels of “judgment”:
1. Discounting irrelevant data or “Cleaning up” data to be sure
that only applicable data is used in assessing historical trends
or performance.
2. Estimating future trends or performance based upon the historical assessment.
3. Estimating future price performance based upon those future
trends.
Discounting Irrelevant Data
With respect to the relevancy of data, we know that history cannot be
denied. What has happened has happened, and the only decision that
you can make about an historical event is whether or not it is applicable in your study to influence your vision of the future.
86
Toolkit 6
Eliminating “outliers” is your way of discarding irrelevant data to
make historical information more useful and to guide you toward the
next step.
Estimating Future Trends
Using your conservative historical trends as starting points, you seek
to predict what the future trends in the company’s performance might
be. Here again, you will want to be reasonably modest in your view of
the future.
Analysts are paid to be accurate. You are rewarded for being right.
The more modest your estimates, the more likely you are to be right!
Estimating Future Price Performance
By making careful and conservative estimates of the company’s performance, you can then forecast, within limits, how the stock’s price
will perform—and therefore what kind of return you might expect
your investment to give you. We will go into detail in each case where
judgment needs to be applied. Generally, it pays to accept the conservative alternative in all cases when decisions must be made. Lower
estimates in projected growth rates will result in less optimistic price
predictions. Since Toolkit 6 focuses upon investing rather than
speculating—and since there are many stocks available that can meet
your requirements—it would seem foolish indeed to “fudge” the figures just to justify the purchase of a particular stock.
Opportunities for Judgment
In completing a Stock Study in Toolkit 6 you are required to:
· Estimate the future growth rates of sales
· Estimate the future growth rate of earnings
· Estimate the future high and low P/Es used in the calculation
of potential high and low prices five years in the future, and
· Estimate (or select) the potential low price five years in the future.
Toolkit 6
87
You are permitted to:
· Eliminate outliers by selecting data that you want to be excluded from the calculations
· Estimate (or select) the highest earnings that you believe the
company might achieve over the next five years
· Estimate the lowest earnings that you believe the company
might produce
· Estimate the future percent payout (the percentage of earnings
that is paid out to stockholders in dividends).
We will discuss these options in the order in which they come up as
you go through the Stock Study.
First Impression
When company data is first downloaded, or a company with an incomplete judgment is opened from the library, Toolkit will display the
First Impression screen. This screen will give you the option to automatically fill in the required judgment items on the Stock Study
with Toolkit 6 default values.
The First Impression screen is perfect for those who may still be
learning to take a first look at a new company. Experienced users
may want to enter the judgment data manually.
Tip: To review the First Impression at any other time in your analysis,
return to the front of the Stock Study form and press [Alt+Ctrl+I] on
your keyboard to launch the First Impression window.
88
Toolkit 6
NOTE: The Quality Index number depends on the Take Stock tool
provided by the StockCentral data feed. This number will only appear if you have a StockCentral subscription, and have set StockCentral as your primary data source in the Toolkit 6 Preferences.
Toolkit 6’s Default Judgment
The First Impression screen provides you with the opportunity to apply defaults for all judgment items at once. This default judgment is
designed to make conservative choices in all areas that require users
to make decisions. Please note that in some cases the default judgment may not be applicable to some companies and it is the user’s
Toolkit 6
89
responsibility to review and accept or reject the default judgment
items.
The specific areas where judgment is applied include the following:
·
Projected EPS and Revenue Growth. The program chooses
the lower of the company’s 10-year growth and 1-year growth
of both EPS and Sales, subject to certain revisions to account
for possible outliers. Toolkit 6 will not project growth greater
than 20%, and will not project Earnings per Share growth at a
faster rate than projected Revenue growth in any case.
·
Selected High and Low Price/Earnings Ratios. Toolkit 6
will not select P/E Ratios higher than 30 (High P/E) and 20
(Low P/E) in calculating future prices.
·
Selected Future Low Price. Toolkit 6 prefers the calculated
price in section 4B(a) using the EPS from the Trailing Twelve
Months. In any case, the Selected Future Low Price will be at
least 20% below the Current Price.
Tip: To apply default judgment at any other time in your analysis, return to the front or the back of the Stock Study form and press
[Alt+Ctrl+D] on your keyboard. This will erase all user-entered judgment and apply the program’s defaults instead.
Analyzing the Company, Step by Step
What follows should provide you with all of the basic information necessary to complete the Stock Study. Experience will add to your
judgment skills as will exposure to the experience of others. However,
the information below should be sufficient to offer a novice a good
foundation on which to build.
If you entered the data manually or imported data for a single company, upon completion of the data entry your company will open to
the front page of the Stock Study.
90
Toolkit 6
If you would like to open a company from those located
within your Stock Library, click the “SSG” button on the
Main Toolbar. In the “Stock Study—Acquire Data” box
click the “Open a company that was previously saved in
Toolkit” button. You can now select from any of the companies that are displayed and press the OK button to open the company. The company opens to the front page of the Stock Study.
If you have selected to Show Trend Line Options within Preferences
you will have colored highlights around some of the areas on the
form. The green boxes indicate where you must do something, the
yellow boxes indicate where you may, and the magenta boxes point
out areas where a “closer look”—such as a helpful graph—is available. As you move your cursor around the form, pause it for a moment,
and a little pop-up box will tell you where you are and what you are
supposed to do.
You will find that the program has filled in all of the heading data. It
has calculated the quarterly comparisons of sales and earnings. It
has plotted all of the data points and drawn the lines connecting
them. The program has plotted both of the trend lines for both sales
and earnings, and, at the bottom of the page, it has entered the historical growth rates of sales and earnings represented by those trend
lines. It has also calculated pre-tax profits and plotted them for you.
You may identify the plots of sales, earnings, and pre-tax
profits by the little circles containing “s,” “e,” and “p,” respectively. It has plotted the annual high and low prices
and the high and low prices for the current year as well as
the current price (a short horizontal red line in the current
year’s price bar). You will also find all of the data that is not dependent upon your judgment filled in on the back of the form.
Adjusting the Size of the Form
The first thing that you will wish to do, if this is your first Stock
Study, is to adjust the size of the form on your screen to suit your
needs. Since we have reproduced the forms exactly, you may or may
not wish to be able to see the entire form at once. Changing the size
Toolkit 6
91
to suit you represents a tradeoff between having the form small
enough to see enough of it on the screen and having it large enough
to read the information on the form. Only you can decide how large or
small you want to make each view. Whatever you decide and do, each
individual view will remain at that setting until you decide to change it. You may have different sizes for the
front and back of each form, for instance, and the program will “remember” how you set each for the next
time.
To do this, choose the zoom icon on the Toolbar. This
takes you directly to the “Select Zoom Percent” dialog
box. Here, you may either click on the Down Arrow to select a percentage or enter your own choice of enlargement or reduction percentage. The default value is
100%, which will usually fill your screen from side to
side and make it necessary to scroll only vertically.
The Header
The first item is an “inspection” item. In the header information in the
upper right hand corner of the page, in addition to the company name
and other identifying items, you will find some data that may be of interest and bears some scrutiny.
92
Toolkit 6
It’s a good idea to note how much ownership both insiders and institutions have in the company. While there are certainly exceptions, in
general, insider ownership is “good,” institutional ownership is “bad.”
Substantial insider ownership indicates that those who make the decisions are making them in their own interests as well as yours.
Substantial institutional ownership (50% or more), on the other hand,
puts the individual stockholder at a disadvantage because institutions are typically fickle and will desert the holding, driving the price
down when you least expect it.
Expressed as a percentage, the Debt-to-Total Capital Ratio is an indication of how much of the company’s capital is in a form that
makes the company vulnerable should times turn bad. In most cases,
we hope to see something less than 33% here, since a company with
two thirds or more of its capitalization in common stock is in a great
position to weather a slump. That’s because it doesn’t have to make
large, regular payments of principal and interest to its common
stockholders as it does to those who carry its debt.
The significance of this ratio will vary with the type of company. Companies that trade on debt are in a different set of circumstances. Financial institutions, insurance companies, and utilities aren’t subject
to the same rules of thumb as are manufacturers, retailers, or service
providers. The long and the short of it is that the debt-to-capital ratio
should not be a disqualifier if the company has a strong track record
of sales and earnings performance, since its management obviously
knows how to make good use of its debt.
Recent Performance
The Stock Study is a “progressive” form, meaning that you never
continue with the next step until you are satisfied with the preceding
one. The first place you might find that the company disqualifies itself
from further consideration is in the quarterly performance section in
the upper left hand corner of the graph. Here the form compares the
sales and earnings figures of the most recently completed quarter to
the same quarter a year ago.
Toolkit 6
93
While one quarter does not in itself make a case for abandoning the
study, a negative or severely disappointing quarter will certainly raise
the question, “why?” If the reason for the poor performance is transient and arguably non-recurring in nature, you would probably continue with your work. If, however, you find in the quarterly data entry
screen that this is the second or third such quarter, and/or the reason could be characterized as a long-term problem, you would probably want to look for another company to study.
The Footer
Along the bottom of the Stock Study form are the year labels and six
data fields representing historical sales growth, historical earnings
growth, estimated (future) sales growth, estimated (future) earnings
growth, and the R2 values for sales and EPS growth.
R^2 (R2 or R-squared) is an indicator of how well the historical data
conforms to the trend line that is calculated by the program. Toolkit
uses the “least squares” to find the trend line that lies closest to all of
the plotted points. The R-squared value measures how closely the
plotted points are to the trend line, and ranges in value from 0 to 1.
The closer the number is to 1 the better, with 1 representing perfect
correlation and 0 representing no correlation. On the front page of the
94
Toolkit 6
Stock Study, the R-squared values are for all years of data, even if
you have removed some years as outliers.
Section 1—Visual Analysis
Toolkit 6 has sought to replicate the familiar printed forms that investors used in the past. This has presented a technical drawback in
that it is difficult for users to see the entire graph, in detail, when it
appears on the screen. Toolkit 6 overcomes that problem by allowing
you to magnify the image of the graph itself and providing you with all
of the controls you need to adjust the graph.
To access this screen to adjust the graph, simply click anywhere within the graph area, or click the “Adjust Graph” button. Your screen
will display a graph on top of the one you just clicked on that will allow you to move the lines and eliminate outliers.
Notice that the graph lines are color-coded:
· Green for sales
· Magenta for pre-tax profits
Toolkit 6
95
· Blue for earnings per share
· Black for the annual high and low price bars
NOTE: These are the default colors, which may be changed in Preferences > Stock Study > Graph Colors.
Additional Graph Items
Toolkit 6 has introduced the capability to display additional items on
the Visual Analysis graph. You can choose to display Shares Outstanding, Dividends, Book Value per share, Net Income, Free Cash
flow per share, or Long-term debt on the graph by checking the boxes
next to those items.
If you chose to display the optional items on the graph, these colors
are used:
· Light blue for shares outstanding
· Light green for dividends
· Black for book value per share
· Orange for net income
· Lavender for cash flow per share
· Red for long-term debt
You may change these colors in Preferences > Stock Study > Graph
Colors.
Navigation
At the top of the graph is a Toolbar, which allows further adjustments to the graph.
Growth Estimates: Opens a screen where you can enter your
judgment for the percentage Estimated Future Sales Growth
and Estimated Future Earnings Growth. You may also access
the EPS Estimate to further fine-tune your estimates.
Analysts Est: Opens a screen where you can enter Analyst
EPS estimates for the coming year, and the next five years.
96
Toolkit 6
Add Scale: Adds horizontal scale lines (10 lines) to the semilogarithmic graph to help you adjust the growth lines.
Add Scale / Remove Scale: Adds or removes horizontal scale
lines (10 lines) from the semi-logarithmic graph to help you adjust the growth lines.
Start Projection: Allows you to select where you want your
five-year projection line to start from: Annual data from the
last fiscal year; the Quarterly data from the most recent quarter; or the end of the Trend line. Since this is an “Advanced,”
feature it will be shown only if you made a selection within the
section labeled “Start Future Projection From” within Preferences.
Historical Growth: Opens a historical growth profile window
displaying the historical growth rates in both a graph and a table, along with a description box. At the bottom of the Toolbar
is an “OK” button to return to the full Stock Study, and a
question mark for help. Along the bottom of the graph are your
year labels. Along the right hand side are listings for Percent
Sales Growth, and Percent EPS Growth for the listed number
of years, as well as an overall R-Squared value for the history
of the stock.
Set Graph to Values: Click this button to show the lines on
the graph according to the values they represent, rather than
the default, which is spaced for legibility.
At the bottom of the Toolbar is an “OK” button to return to the full
Stock Study, and a question mark for Help.
Sufficient Scales to Plot the Data
First, look at the following chart.
Toolkit 6
97
Are all of the plotted lines visible in their entirety? Do any of them go
off the chart at the bottom or top? With some rapidly growing companies, there are not enough decades (scales of ten) because the data
started so low and have grown so rapidly.
You may add additional scales to accommodate the growth by clicking
on the Add Scale button one or more times:
98
Toolkit 6
Clicking the Remove Scale button will remove any unnecessary scales.
Adjusting Your Graph
Position of the Lines
Now that the data fits on the graph, inspect the plotted data. Many investors prefer to arrange the data so that it matches the flow of an income
statement: Sales on top, followed by Pre-tax Profits, and then by EPS.
Toolkit 6
99
If the plotted line is not where you want it, you may easily change its
location. Pass your cursor over the line you wish to move. When an
up/down arrow appears, it indicates that you are able to move the
line. Click and hold down the left mouse button; moving your pointer
up or down will adjust the line on screen as well. Release the button
to place the line. There is no need to try to interpret the value from
the scale on the side of the chart. Simply rest your cursor over the
plotted point and read the actual data. To return the lines to their positions as determined by their value, click on the “Set Graph to Values” button on the menu.
Stability
When your chart appears the way you want it, you are ready to go to
work. It is at this point that you should take a good look at the graph.
Your first interest is in its general appearance—specifically you are
interested in two attributes of growth: stability and strength.
Do you see relatively straight lines, or do you have “saw teeth”—
jagged ups and downs—that show a chaotic history? The ideal is a
company that displays “monotonous excellence” as it has grown
steadily and substantially, especially in its recent history (for at least
the last five years).
100
Toolkit 6
In just a glance, can you not tell which of these companies is likely to
be the better investment? The one on the left, while a strong, blue
chip company, is far less attractive than the company on the right.
The instability of the Earnings trend is a giveaway. If you can tell the
difference between a straight and a crooked line, and one that slopes
up rather than down, you can tell most of what you need to know
about a company’s quality.
While you won’t always see companies like Microsoft (MSFT), Abbott
Labs (ABT), or Wal-Mart Stores (WMT) on your screens, the closer we
can come to today’s classic ideals, the better off we are. Your end results are based on a degree of predictability over the long term, and
companies that display extreme variations in performance are certainly not predictable at all. If the company has had one or two deficit
years in the last five years, you should probably look for greener pastures.
Eliminating Outliers
Throughout your analysis, you will study history to help you predict
the future. While you can’t alter what has actually happened in the
past, you can decide if everything that has happened is applicable to
the future, and, if not, eliminate that selected data from consideration.
When Toolkit plots the annual Sales and Earnings points and draws
the lines to connect them, short of actually changing the data, you
can’t do much to change the way the lines are plotted. However, the
trend lines (the straight, red lines) are drawn to “fit” that data, which
means that they are placed with mathematical precision in a unique
position that is the closest to all of the data points plotted.
(NOTE: For the math major, the calculation is a least squares, exponential regression analysis of those points.)
There is little opportunity to change the way the trend lines are drawn
because the computer eliminates the guesswork. There are, however,
some changes you can make that will affect how that data is used. As
Toolkit 6
101
you look at the graph, you may find some years where the data is noticeably out of step with the other years.
Should one or more of those years reflect irrelevant or unacceptable
data—some non-recurring event or “outlier”—you may want to eliminate that data from consideration when the trend line is drawn.
With a simple mouse-click, you can remove such a point or points
from the data and let the trend line be drawn closest to those remaining. This is your first chance to apply judgment as you look at the
front of the Stock Study and do your visual analysis.
You will notice that, as you move your cursor in the vicinity of the line
representing that year, or around the point that you want to get rid
of, it changes shape. The minus sign (—) indicates that something
can be taken away; the plus (+) indicates that something may be added (back). (See the illustration.) If, at this point, you click your mouse,
the data for that year will be removed from the calculation of the
trend line, and the year at the base of the graph will immediately be
crossed out with a red line to indicate that the data for that year has
been eliminated.
As you do this, you will see also that the “Historical Growth Rates” of
both Sales and Earnings change to reflect the change in the trends as
they are recalculated and the trend lines are redrawn. The lines connecting the plotted data bypass the points for the years that have
been eliminated; however, the points, themselves, remain visible because it is useful to see the actual data and understand why the “outlier” was eliminated.
102
Toolkit 6
When your cursor passes over a point for which the data has already
been eliminated, the character in the box on the cursor changes to a
plus (+) sign. This indicates that you may add back the data to “uneliminate” it in the same fashion as you eliminated it. You will also
notice, when you rest your cursor on a data point, that an information Pop-up box appears with the annual figure for that point, for
either Sales, Pre-Tax Profit, EPS, and Price (High and Low).
Non-recurring Events
In some cases, you will find one or two years when the sales—or,
more likely, earnings—will show a severe dip. They may have broken
through the bottom of the graph. You might choose to eliminate some
of the early years of an emerging company when it operated at a deficit because, once it began to make money, it had a consistent record
of healthy earnings growth. (Trend lines drawn with data that commences from too low a point in the early years produce much too
steep a growth rate.)
Suppose a company had, in one year, written off a huge expense that
had long been accumulating, unreported. It is probably a nonrecurring item. That event will not be repeated in the normal course
of business— at least not for a very long time (we would hope). We
would probably want to ignore that event in using the historical data
to predict the future. This information can distort the assessment of
the historical growth trends in Section 1 of the Stock Study, or it can
impact our trends in profit margins or return on equity in Section 2.
If the event occurred during the last five years, it can grossly distort
our high and low P/E’s in Section 3 which will, in most cases, create
an overly optimistic picture of the potential high or low price when we
get to Section 4. When we discuss these sections below, we’ll look at
the opportunities for eliminating the appropriate outliers to overcome
these problems.
For now, eliminating the early bad years will help to give more weight
to the recent performance, and you will notice that the historical
growth rates at the bottom of the page will decrease to a more conservative figure.
Toolkit 6
103
Eliminating Data for Information
Maybe you want to examine the growth rate between specific years.
For example, if the company is a cyclical company, you may want to
find out the historical growth rate between “peaks.” You could then
eliminate the “outliers” represented by the years between the
“peaks”—just long enough to determine the growth rate—and then restore the data. It’s very simple with Toolkit 6. Another circumstance
is the case of a company
whose growth has been meteoric, but has been slowing
over the course of the past ten
years—perhaps from an average annual earnings growth of
45% down to a more modest
30%. Its plotted data looks
like a bow. So, the ten-year
trend line that describes the
average growth looks like a
string on that bow.
You are going to use the information that you gain to
make a reasonable estimate of
growth for the next five years.
It’s obvious, just from inspecting the plotted data and the trend line,
that the ten-year average growth they describe is considerably higher
than you can reasonably expect it to be in the future. Since you can
see that the growth has continuously eased off each year, you would
probably want to eliminate all but the most recent two or three, just
to find out what the most recent growth has been. That new historical
growth figure would then be the maximum you would use as a starting point for your estimate of future growth.
The main point here is that you learn from history to estimate the future. Furthermore, you use only the data that is relevant. As a conservative rule of thumb, when you eliminate outliers in this section,
you should be suspicious of any deletion that increases the historical
growth rate. A corollary is to strive (within reason) to better “fit” the
104
Toolkit 6
trend line to the data by eliminating the outliers that decrease the
historical growth rate.
Historical Growth Rate Change Graph
The Historical Growth Rate Change Graph is
important because it displays the change in historical growth rates for Sales and Earnings per
Share (EPS). To open it, click on the “Hist. Growth” button on the
Visual Analysis toolbar. This graph will clearly show you if there has
been a change in the growth rate of either Sales or EPS; it provides a
visual representation of the data in the table in the top-right corner.
Often, the lines on the Visual Analysis graph will appear fairly
straight, which can mask changes in Sales or EPS growth. But just a
quick look at the Historical Growth graph will show you the real story, and maybe make you take a closer look at this company.
Toolkit 6
105
Start Projection Option
Before continuing on to estimate your growth rates, you can make
another decision that affects the issue of projecting growth. This is
the option to project your growth from one of three different points:
1. The most recent fiscal year annual data point;
2. The most recent quarterly data or;
3. The end of the trend line.
To do so, you will first need to make a selection within the section labeled “Start Future Projection From” within Preferences which permits you to select the starting point you would prefer the program to
default to. Toolkit also provides radio buttons in the Visual Analysis
screen to change it from the default setting to one you may think
more appropriate for that particular Stock Study.
The first option, projecting from the most recent
annual data, is the default setting, since most
people figure on projecting out for the next five
fiscal years. Analysts’ estimates are most often
based upon those figures.
The second option considers that the quarterly
data is already reported
and projections should
make use of the most
up-to-date data. The third assumes that the trend line is the “norm”
and the actual data points are “deviations from the norm.” The rationale here is that a projection from the end of the trend line will
106
Toolkit 6
likely be closer to the norm in the future and deviation would be minimized.
On occasions when you’ve determined that the most recent year’s poor
performance should be eliminated as a non-recurring event—and you had
better have a good reason for this—you will need to select either the trend
line terminus or the most recent quarter to start your projection. Otherwise, you may not even have a place to start from.
Growth
Now we want to look at the historical sales and earnings growth appearing in the spaces at the bottom of the graph. These numbers reflect the compounded annual growth rate for the plotted data. In analyzing the estimates of future growth, you want to be certain a company is growing at a rate that is sufficient for its size.
Toolkit 6
107
You can use the above chart as a rough guide for the growth you
should require for the size of the company. Remember that the smaller the company, the greater the risk and, therefore, the higher the
growth needed to offset it. Suffice it to say, if the historical growth
rates at the bottom of the page are sufficient to warrant your continued interest, you will continue with your Stock Study.
Estimate Sales and Earnings Growth
You have now taken a good look at the lines and trend lines. If necessary, you modified your historical growth rates of sales and earnings
by eliminating the irrelevant data. Assuming that your company has
passed the test of sufficient and stable growth, your next task is to
estimate the future growth and to enter those estimates in the appropriate spaces at the bottom of the page. This will be your first step in
preparing for the value assessment of the company’s stock.
You will notice, if you have
opted to enable “Active Area
Highlighting” in Preferences,
the spaces at the bottom of the
form where you are to input
your growth rate estimates are
surrounded by green boxes,
indicating that these spaces
require you to enter something. When you click on either
space (or green box) or the Est.
Growth button, you will activate a dialog box that invites you to enter your estimate for future
Sales and Earnings (EPS) growth.
Sales—Estimated Future Growth Rate
When considering the growth of sales, keep in mind that as a company continues to grow it becomes more and more difficult to maintain
the same growth rate. It is far simpler for a company that has sold
$100 million in one year to sell an additional $15 million the following
year than it is for a company that has sold $2 billion to sell an addi108
Toolkit 6
tional $300 million to achieve 15% growth. As a company becomes
successful and large, it is natural for its growth to taper off. There
are, after all, only so many ways a company can increase revenues: it
may increase sales of its established product lines or services using
the existing facilities or resources; it may increase the variety of
products or services it sells; it may increase the facilities or resources
through which it sells its products or services; or it may raise prices.
Successful companies—the ones that we wish to study and invest
in—are those that do any and all of these aggressively.
Conversely, there are a great many things that can reduce a company’s revenue growth: increased competition, failure to support adequate research and development, insufficient cash or credit to make
acquisitions or to expand, or simply a complacent management. Determine whether there is any reason to believe that sales will grow at
a rate lower than its historical growth rate. If you believe that increased competition or some other factor may tend to slow the growth
rate of sales, by all means, err on the conservative side and decrease
your estimate for future sales growth. If not, then you may feel justified in continuing it at close to the same rate.
Don’t expect companies to grow at the same rate in the future as
they have in the past. In most cases, you should deduct a percent
or two from the historical growth, assuming no other factors call for
further reduction. A further consideration is the fact that the less
stable and steady the historical growth has been, the less predictable
it will be. You may want to deduct yet another percent or two from
your estimates if the growth has been at all erratic.
Toolkit 6
109
If, as depicted above, the growth describes a “trajectory” or bow, as
many companies do in their early years when their uncommon growth
starts to slow down, you might mentally draw a curve for the next five
years that follows the curve for the first five or ten. See where that
curve would cross the right margin, and don’t let your future growth
projection cross that margin any higher than that. Many of these considerations also affect your estimate of earnings growth.
Earnings—Estimated Future Growth Rate
There are many, many more factors that can impact the growth rate
of earnings: flattening revenue growth, to begin with; the cost of materials and processes that are required to produce the product or service; fixed costs such as administrative payroll, the cost of operating
the company jet, the interest paid on debt, the cost of maintaining the
office buildings or plant, taxes, insurance; a change in the number of
110
Toolkit 6
shares among which the company’s profit is distributed. All of these
factors, and many more, determine what a share of stock earns.
Management’s skill in handling all of these variables is a major factor
in determining how much earnings growth a company will be able to
sustain. Because Toolkit has plotted the pre-tax profit for you, it’s
easy to see graphically some of the most important factors that might
influence your decision. Is the pre-tax profit line growing at a faster
clip than sales? If so, the trend in profit margins is rising and that’s a
good sign. The reverse is not so good.
Toolkit 6
111
If the relationship between the pre-tax profit line and the earnings
line is diverging or converging, you know that the company’s shares
outstanding or its tax rate is influencing its bottom line. For example
if, as above, sales are growing faster than earnings, it’s helpful to see
that the pre-tax profit line more-or-less parallels the sales line. This
suggests that the profit margins are stable and that the cause is
probably an increase in shares outstanding. This pattern is likely to
occur as a company issues shares to acquire other companies. Or,
perhaps the tax rate has punished management by allowing less to go
to the bottom line than would otherwise show up there. Of course, the
information about tax rates and shares outstanding is easily found in
the Annual Data section of the company’s Data screen.
Generally, except for rare exceptions, you should estimate earnings to
grow no faster than sales. This is because the factors that would
permit this kind of performance can’t keep up very long. Obviously,
earnings can’t keep growing at a faster rate than sales without implying that profits can exceed revenues! Some industries seem to have
invented “perpetual motion.” The drug companies, for a long time,
seemed to have found a formula by which the write off of research
and development expense, and the ability to constantly raise the prices of proprietary products, appeared to grant them dispensation to
continually produce earnings growth in excess of sales growth.
To be sure, this is the exception not the rule, and conservative investors, in such cases, might choose to limit the amount by which they
let their estimate of earnings growth exceed that of sales to some consistent percentage of the difference (50%, for example). Thus, if sales
for the past ten years had been growing at 10%, and earnings at 15%,
they might then cap earnings growth at 12.5% for the next 5 years—if
they were going to insist on forecasting earnings to grow faster than
sales at all.
If you have entered or imported analysts’ estimates, an “Analysts’ EPS
Growth Rate Estimate” may be displayed in the dialog box. This represents the average annual growth rate expected for earnings over the
next five years by analysts following the stock. In general, analysts
tend to be optimistic. You might do well, at least in the beginning, to
keep your estimates below those of the professionals.
112
Toolkit 6
In any event, when you have decided on a growth rate for sales and
earnings, enter your estimate for sales and EPS growth in the dialog
box provided. Your estimates will appear in the proper spaces at the
bottom of the form, and dotted lines will appear on the graph, depicting projected sales and earnings growth for the next five years along
with the actual figures for those projections.
Revenue-based EPS Estimate
Below the space for the entry of your growth estimates is a bar
marked “Revenue-based EPS Estimate.” Briefly, the Revenue-based
EPS Estimate develops earnings per share by looking at sales rather
than historical earnings growth, because sales growth, over time,
tends to be more consistent and stable.
Here’s the rationale behind the Revenue-based EPS Estimate. It’s all
well and good to estimate your earnings growth for the next five years
and, with that, project your earnings five years into the future. However, revenues typically show more stability and are more apt to folToolkit 6
113
low projections than are earnings. After all, earnings are derived from
revenues—only after deducting costs, taxes and preferred dividends,
which can vary.
The Revenue-based EPS Estimate starts with your estimated sales
growth and your projection of actual sales five years in the future.
From this figure, the average expenses are deducted; next, the taxes,
then the dividends paid to preferred stockholders (if any). Finally, the
result is divided by the number of shares outstanding to calculate
your earnings per share. This is the way companies do business,
which is therefore the strength of this method. Its weakness is that
while sales are the most predictable of statistics, all of the others are
not. As a result, there are many more variables to be wrong about
than if you were to simply forecast earnings growth.
The best use of the Revenue-based EPS Estimate is as a corroborative
tool—a “second opinion” as to what future earnings might be. Since
we need to be as “accurate” as possible when forecasting future earnings, it’s useful to have this second opinion and the opportunity it
gives you to consider additional judgments. The dialog box you encounter when you click on the “Revenue-based EPS Estimate” bar
may seem complicated, but it’s really not. The top portion of the dialog simply lists the various components of the process that we mentioned above. The figures to the right of the radio buttons represent
the numbers either entered or estimated—or those that were calculated from those numbers. The results are displayed to the right of the
entry boxes. Selecting one of the boxes will alter the figures on the
basis of which the results were calculated.
When you do enter a check in the check box, a table will appear on
the right that gives you all of the historical data available about the
specific item so that you may make an intelligent decision as to what
changes, if any, you may wish to make. For example, the second item
is the profit margin, which is used to calculate expenses. The figure
that the program has used is the average profit margin over the past
five years.
To determine the company’s expenses, the program has calculated
the profit by multiplying the profit margin by the sales figure. Since
114
Toolkit 6
the expense is everything that isn’t profit, the profit is subtracted
from sales to provide the figure for expenses. Looking at the historical
data, you may be convinced that increasing profit margins might prevail and you might expect that, in the next five years, the profit margin will be greater than the historical five-year average. Entering your
higher estimate of the profit margin in the space provided will raise
the value of the “Earnings by Revenue-based EPS Estimate” calculation, accordingly.
After you are satisfied with the components of the Revenue-based
EPS Estimate, you should compare the result with the projection of
earnings already calculated to see if your own projection is reasonable
or to consider changing your future earnings estimate. If you are using electronic data files, you may find a figure labeled “Analysts’ Estimate” at the bottom of the dialog box. This figure is calculated using
the “Analysts’ EPS Growth Rate Estimate” to compound their estimate
of the current fiscal year’s earnings for four more years. If you are not
using electronic data files, the figure there will be that which you entered on the data screen.
Again, before yielding to the temptation to simply plug in that figure,
bear in mind that the professionals are judged by their accuracy. This
means that they have an incentive to neither understate nor overstate
the figure. However, you have an incentive to err on the conservative
side. The more conservative you are, the more likely you are to be
right! The only track record you need think about is your portfolio’s
performance!
In any event, you may accept the “Projected EPS” from your growth
estimate, select the “EPS by Revenue Estimate,” or select “Other” and
enter an earnings figure of your own choosing. You may prefer using
the Value Line’s estimate of earnings, which is found in the right
hand column of the Value Line page. (NOTE: This figure is actually an
estimate of average earnings for the fourth-, fifth- and sixth-year out
and may be a little “aggressive.”)
To do so, click on “Other” and enter your earnings estimate in the
“Other” space. As it does when you select “EPS by Revenue Estimate,”
any time you select any other figure than the “Projected EPS”:
Toolkit 6
115
1. A new estimated future earnings per share growth rate will be
calculated on the basis of earnings growing to achieve the new
figure.
2. A new line will be drawn representing that growth rate.
3. The new E/S figure will appear on the right hand margin of the
graph.
In this fashion, you will be able to “interactively” estimate a growth
rate by working backward from an educated estimate of future earnings. You will have yet another opportunity to revisit the Revenuebased EPS Estimate as you “fine tune” your forecast of the potential
high price on the back of the form.
At this point, you will have completed the front side of the Stock
Study with your estimates of growth. If the company’s historical sales
and earnings appear to be strong and
steady, and look to remain so in the future, you next need to evaluate the management and their ability to sustain this
growth.
NOTE: When starting your projections
from the latest Quarter, Toolkit 6 moves
the starting point and the entire projected
line up or down on the vertical line for the
most recent year, keeping it parallel to the
plot for the most recent quarter to avoid
extending the projection out into the right
margin. This permits the entire five year
growth to remain on the chart.
Section 2—Quality Analysis
The next point of analysis is Section 2—Quality Analysis. This is not
a computer issue, but it is certainly a critical investment issue. It is at
this point that you must decide whether the company is a “good” one
or not. You have presumably decided that the company’s track record
116
Toolkit 6
of growth and earnings has been sufficiently stable and strong to warrant your consideration or you would have already abandoned the
study.
This is the place where you assess the management team’s capability
to sustain that growth. This is one of the most important judgments you will make. Why? Because, if you’re wrong, you may be
“seduced” into thinking that the stock is a great value when, in reality, the stock is selling at a low price for a very good reason.
We cannot stress this point enough: The worse a company performs, the better a value it will appear to be.
Before you look at the averages and the trends, look at the data, especially for the most recent five years. How do the profit margins (%
Pre-tax Profit on Sales) look to you? Are they fairly stable over the
whole ten years? How about the last five? Are they substantial when
compared to the company’s industry average? (Industry averages may
be found in the Value Line Survey or in other on-line sources such
as at StockCentral.com.)
Eliminating Outliers
Here you will want to look for data that is obviously out of step with
the other data. If the anomalous data is in a year that you have already considered to be irrelevant and the event non-recurring, you
may simply eliminate that data from the calculation of the 5-year average and the trend by clicking on it. A mark will appear in that data
box to indicate that it has been deleted from the calculation. When
Toolkit 6
117
you have decided that all of the data is relevant, look at the averages
and the trends.
Suffice it to say that serious downtrends, especially in % Pre-tax Profit on Sales, would, for most fundamental investors, probably disqualify the stock from further consideration.
Pre-tax Profit Margin Graph
To see a graph of the % Pre-tax Profit on Sales (the Profit Margin),
click in its “5 Year Average” box (the magenta box if “Active Area
Highlighting” was selected in Preferences).
Often this graph will help you see a Profit Margin trend that you
would not notice by just looking at the numbers. “If you’re in doubt,
bail out!”—especially if you’re new at this. The chance to be led
astray is too great if you go on with a company that is not up to par—
and there are plenty more good ones out there.
118
Toolkit 6
Return on Equity (ROE) Graph
To see a graph of the % Return on Equity, click in its “5 Year Average”
box (the magenta box if “Active Area Highlighting” was selected in
Preferences).
As noted previously, Return on Equity show whether management is
able to earn a steady and substantial return on the investors’ money.
This graph helps show long-term trends, as well as a quick reference
for the five year average return.
Debt-to-Equity Graph
To see a graph of the Debt-to-Equity, click in its “5 Year Average” box
(the magenta box if “Active Area Highlighting” was selected in Preferences).
This graph helps illustrate the debt/equity ratio for the company, a
measure of the company’s dependence on borrowed funds.
Toolkit 6
119
Section 3—Price, P/E Ratio and Dividend Analysis
The next task is to analyze the historical relationship between the
company’s earnings and the stock’s price—its Price-Earnings History.
Once again, an inspection of the data may reveal anomalies (or “outliers”)—data that stands out as being a departure from the norm.
120
Toolkit 6
If one or more of the years produced figures that were abnormally low
or high, you can click on the offending year and eliminate all of that
year’s data from the calculations. Or, you may select individual items
of information and exclude those by simply clicking on them. (This is
true only of the Year, the Low Price, the High and Low P/E, the Percent Payout, and the High Yield columns. These fields are surrounded
in yellow highlights, if you enabled Active Area Highlights in Preferences.) The averages at the feet of the columns containing the excluded data will be affected by doing so.
Most important are the columns containing the Average High and Low
P/E Ratios. Look carefully for extraordinary numbers. Most often, the
high P/E will be radically inflated by a year with abnormally low earnings per share. This inflated figure, if not eliminated, can skew the
average high P/E so much that, if the figure is accepted as calculated,
it will make your future high price sky high! You’ll think that you’re
really going to make a killing, when you’re seeing only the effect of a
bad year.
Of course, in the next section, you will have to select reasonable
numbers for the average high and low P/E’s; but, it will make it a
good deal easier to be sensible if you have exercised diligence in excluding the irrelevant data here.
There is some additional information provided in the bottom rows of
this table, including the following:
Trailing Twelve Months “TTM EPS” is the sum of the reported EPS
from the last twelve months (four quarters).
Forward Twelve Months “FTM EPS” is calculated by applying your
long-term estimated EPS growth rate to the TTM EPS.
Projected P/E Ratio is calculated by dividing the Current Price by
the FTM EPS.
PEG Ratio is calculated by dividing the Projected P/E Ratio by the
Projected 5 year EPS Growth Rate you chose on the front of the
Stock Study.
Toolkit 6
121
Relative Value is calculated by dividing the Current P/E Ratio by
the Average P/E Ratio and is usually expressed as a percentage.
Projected Relative Value is calculated by dividing the Projected P/E
Ratio by the Average P/E Ratio.
High and Low Price/Earnings Ratio Graph
To help you spot any extraordinary numbers and their relation to the
Average High and Low P/E Ratio, you should look at their graph. To
open, click either the High P/E or Low P/E Average figures in line 6,
which will be surrounded by a magenta box (if “Active Area Highlighting” activated in Preferences). Note also that the cursor changes to a
magnifying glass in this area, signifying that you can take a closer
look at the numbers by opening up a graph.
With the graph you can see what each year’s High P/E is relative to
the Average High P/E, and what each year’s Low P/E is relative to the
122
Toolkit 6
Average Low P/E. The red line is the average for the High and Low
P/E for the last five years.
Remember that the price/earnings ratio (P/E) is a numerical relationship that compares the stock price to the company’s earnings per
share. Because both the stock price and earnings increase as the
company grows, in the case of a good growth company, the P/E
should remain relatively constant since it is a ratio.
Example:
$10 Price ÷ $1 Earnings = 10 P/E;
$100 Price ÷ $10 Earnings = 10 P/E.
Therefore, as a company grows, its High and Low P/E should remain
more or less the same. A company’s P/E is a reflection of investors’
confidence and expectation that the company will be profitable in the
future. This expectation drives up the stock price as a surplus of buyers purchase a limited number of stock shares. As the stock price
goes up, but the current earnings remain the same, the result is a
high P/E.
Example:
$10 Old Price ÷ $1 Earnings = 10 P/E;
$100 New Price ÷ $ 1Earnings = 100 P/E.
As a reference point, the average P/E for companies on the Dow is
around 15. This contrasts sharply with the P/Es of 100, 200, and
even 300, for many of the Internet companies during the bubble of
the late 1990s. At that time Alan Greenspan, chairman of the Federal
Reserve, expressed concern about the “Irrational Exuberance” of investors and his concern was borne out by the performance of those
companies when the inevitable bust came not long after.
The Price/Earnings Ratio is sometimes called a “P/E Multiple,” or just
a “Multiple,” since the stock price is a multiple of the earnings. Perhaps the easiest way to think of it is as the rate one pays for a dollar’s
worth of earnings, much like the price per pound of coffee or gallon of
gas.
Toolkit 6
123
Relative Value and Projected Relative Value
Where Toolkit used to have these figures as an addition at the bottom
of section 4, they are now given more prominent placement in Section
3.
Part studying the history of High and Low P/E’s, eliminating irrelevant data, and determining your historical average High and Low
P/E’s is to find average P/E figures over the past five years, potentially adjusted by the removal of outliers.
Consider this adjusted Average P/E as a sort of “signature P/E”—a
“normal” relationship between earnings and the stock price.
As we’ve discussed before, stock prices are driven, over the long-term,
by earnings. In the shorter term, prices may fluctuate up and down
for a variety of other reasons, all transient and all depending upon
the whim of the investing public.
Perceptions drive short-term stock price movement, and it can be fairly said that what goes up, will go down—and vice versa: what goes
down, will go up. It’s almost a sure thing, in fact, that any deviation
in P/E that is not caused by earnings is only temporary. If this is
true, then you can expect, whatever the P/E of a stock at the moment, it will tend to seek its “normal” or “signature” level.
The closest you can come to estimating that traditional relationship is
the five-year Average P/E, and you will strive to purchase stocks
whose Current P/E is not much above the average—better yet, is
somewhat below it.
You will use a measure called
“Relative Value” (RV) to assess this condition; it means
the relationship between the
Current P/E and the Average P/E. It is calculated by dividing the
Current P/E by the Average P/E and is usually expressed as a percentage. A stock with a Relative Value of more than around 110%
may be overvalued.
124
Toolkit 6
On the other hand, if the RV is only 90% or 85%, it’s an indication
that something might be amiss. The lower it is, the more likely the
possibility that someone knows something that you don’t, and you
had better get some questions answered before you begin thinking
that it is so far undervalued that it’s a great bargain! Is there something going on that will adversely affect earnings over the long term?
You will want to find out just why no one will pay more for the stock.
If the company’s earnings are continuing to grow, and there are no
reports of impending catastrophe, you might be in a position to act
the contrarian and buy some while it’s really low. But, this doesn’t
happen often. Save for the times the entire stock market is down, the
price is not likely to be severely depressed without some valid reason.
Projected Relative Value
“Projected Relative Value” is another measure of the same issue.
Many investors believe that the current P/E should be calculated by
using the earnings for the next twelve months instead of the trailing
twelve. Their logic is that we buy stocks for their future performance
and in the expectation of those future earnings. The program therefore offers this alternative. Projected relative value is calculated by dividing the estimated earnings for the next twelve months (Projected
P/E Ratio), by the Average P/E ratio which Toolkit 6 forecasts by
growing last year’s earnings at your estimated growth rate.
The projected relative value is always a lower number than relative
value (since the P/E using a higher earnings figure will be lower). We
also don’t want to buy a stock with a projected relative value above
100% and are suspicious if it’s below 80%.
Relative value and projected relative value must be used with care. A
variety of circumstances can change the “normal” P/E of the company, and these must be taken into account when you assess them. InToolkit 6
125
terest rates and their partner, inflation, can make the entire climate
quite different for a fairly long period of time. Competition, trends in
the industry, etc.—all can conspire to change the P/E point of reference. Perhaps not over the long term, but for a long enough time to
make some difference. The factors that you need to keep your eye on
are those that can affect the company’s earnings. Investors who rely
on using Relative Value as a primary measure do so at considerable
risk if they fail to look at the actual P/E’s that make up the measure.
A favorable appearing Relative Value or projected relative value figure
can be made up of an unrealistic current P/E being divided by an
equally unrealistic average P/E.
Section 4—Evaluating Reward and Risk over the Next 5
Years
This section offers four opportunities to apply judgment:
· You must estimate the 5-Year Average High and Low P/E’s to
be used in the calculation of the potential high and low prices.
· You may refine your estimated high earnings by substituting
what you derived from the Revenue-based EPS Estimate (or
your own estimate) for the estimate that came from your earlier
projection of earnings growth. This will have an effect on the
projected high price that represents the top of your “Sell”
range.
· You may revise your estimate of future low earnings.
· You must forecast the future low price of the stock.
Forecast the High Price
The potential high price is the product of the selected average high
P/E and the estimated future high earnings.
Estimating Average High and Low P/E
Having eliminated any outliers from the Average High and Average
Low P/E’s in Section 3 above, you are in a good position to estimate
those figures for the future.
126
Toolkit 6
To modify the figures,
simply click on either
the space containing
the Average High P/E
in line 4A, or the one
containing the Average
Low P/E in line 4B
(surrounded
by
a
green highlight if enabled in Preferences),
and the Judgment dialog box will appear.
You now have the opportunity to insert
your own best estimate as to what average high or average
low
multiple (P/E)
should be used in calculating your potential
high and low prices for
your price ranges. The
default values that
you find in the dialog
box are taken from the
average High and average Low P/E boxes
from line 6 in Section 3, and assume that you are satisfied with the
average of the historical P/E’s.
Often, this assumption is a good one since you are looking at a fiveyear period, a period long enough to capture both the top and bottom
of the average business cycle.
Toolkit 6
127
Toolkit 6 also has the option to view ten years of Hi and Low P/E ratios and eliminate outliers by clicking on the values. You may use the
5 year average from Section 3, the 10 year average or the Median.
NOTE: Using the 10 year Average without eliminating outliers would
not provide a generally meaningful result because of the anomalous
data from the early years of the company you are studying. However,
there are other factors that might influence your judgment in this
case. Look at the trend in Average High P/E’s. Is the trend up, down,
or both? If the trend isn’t “both,” then the cycle is probably longer
than average and you will want to try to figure where the company is
in its cycle. Now might be a good time to look again at the Section 3
High and Low Price/Earnings Ratio Graph
If the company has a good track record, and there are no negatives to
indicate that the downtrend is a long-term or permanent trend, then
you might be content with the historical averages.
If you want to be more conservative—or if the trend is going to be
more long-term than you first thought—you will want to lower your
estimates for the future. There are some, in fact, who won’t often estimate the future average high P/E any higher than the average P/E.
You may remove additional outliers from Section 3 in order to average
the lower ones and omit the highest. After recording the results, you
should restore the outliers that you eliminated so that the calculations involving historical data (Relative Value and Projected Relative
Value) won’t be distorted as you look at them later.
See the “How to” section for details on using this feature.
Amending the Estimated High and Low Earnings per Share
The last task you performed on the front of the Stock Study was to
forecast the future high earnings per share. You did this by estimating future earnings growth. You may have availed yourself of the opportunity at that time to use the Revenue-Based EPS Estimate dialog to calculate your future earnings estimates. The result, in either
case, will be found in Section 4A, in the middle of the page.
128
Toolkit 6
Advanced Option
As you go through the process of forecasting the potential high price in Section
4A, you may wish to revisit
the Revenue-Based EPS
Estimate and fine-tune that
estimate. One determining
factor will likely be the profit
margins (%Pre-tax Profit on
Sales) from Section 2 above,
which you should have noted. You may again want to look at the Pre-tax Profit Margin Graph.
Look carefully at the trend in the profit margin. If there is a substantial trend up (or down), you may wish to modify your estimate of future earnings based upon a more optimistic (or pessimistic) assessment of the cost factor as it affects the bottom line in the RevenueBased EPS Estimate. (Of course, if it was a significant down trend,
you would probably be looking at a different stock by now.)
Click on the appropriate space at the center of line 4A on the back of
the Stock Study (If you have enabled “Active Area Highlighting” in
Preferences, it will be highlighted in yellow). The program will display
the Revenue-Based EPS Estimate dialog box for your use.
For general information on Revenue-Based EPS Estimate, see the
Advanced Option earlier in this section.
By default, the Forecast High Price is calculated as Selected High
P/E multiplied by Estimated High EPS. With Toolkit 6, we have added the ability to edit this figure. Clicking the Forecast High Price line
(surrounded by a yellow highlight if enabled in Preferences) will open
a judgment window showing the Forecast High Price as calculated
normally, as well as giving an option to select Other and enter your
own selection for the High Price.
Toolkit 6
129
To calculate the low price, the program multiplies the estimated average low P/E by the estimated low earnings per share (EPS). We have
already discussed the low P/E estimate; however, we haven’t mentioned low EPS. Low EPS defaults to the value of the annual earnings
for the most recently concluded fiscal year. The rationale for this is
that, assuming that the company is a good growth company, it will
earn no less five years out than it did last year. Therefore, this is a
very conservative assessment of future low earnings.
You may, however, have a different idea about the potential. For example, many investors prefer to use the sum of the most recent four
quarters, as the low EPS figure, since it represents factual data. It is
conveniently displayed in Section 3 in the TTM (Trailing Twelve
Months) EPS field.
Others will wish to be either more or less conservative. The space for
Estimated Low Earnings in Section 4B will be highlighted in yellow,
should that option be selected in the Preferences. To alter the estimate, simply click on the yellow box and enter your preferred figure.
130
Toolkit 6
Select the Potential Low Price
Just as on the printed Stock Study, you are offered a range of potential low prices from which you must select or estimate a potential low
price to set the bottom of your “Buy” range.
If you have enabled the highlighting in the Preferences, the space will
be highlighted in green indicating that it is a “must do.” Again, when
your cursor passes over the box in which you are required to insert
your low price estimate, it will enlarge and darken. Click on that
space.
Toolkit 6
131
You will be presented with a dialog box that offers you the opportunity to either select one of the computed prices or to insert your own estimate. While there are many factors that will contribute to your decision, it may be helpful to consider these general guidelines:
Forecast Low Price: Used most of the time and a good choice
for a growth company that does not pay a significant dividend.
Average Low Price for Last 5 Years: Typically used for a cyclical company (e.g. an auto maker).
Recent Severe Market Low Price: Perhaps used for turnaround situations or for companies for whom disaster is a normal state of affairs—volatile and unpredictable companies.
Price Dividend Will Support: Used for larger companies
whose dividends contribute significantly to the stock’s total return. This represents a price at which yield is high enough for
the stock to commence competing with other income instruments for investors’ dollars.
Price Variant Quotient: Determined by considering the ratio
of low price to high price over each of the past five years, then
projects a low price based upon this average volatility from the
current year’s high price.
80% of Current Price: This price represents what the low
price might be if the stock fell 20% from its current level.
Other: Used for your own thoughtful estimate.
Selecting a low price is the last “must do” item on the form. Since the
remaining parts of Section 4 are used to decide whether or not to
make a stock purchase, we’ll discuss them in the “To Buy or Not To
Buy” section.
If you have had to stop in the middle of your Stock Study and
resume later—or if you have found that some of the items you
thought should be filled out are not—you may click on the
132
Toolkit 6
“Audit” button on the Company Toolbar to find out what
judgment items remain to be completed.
Section 5—Total Return Analysis
This section calculates your current and potential dividend yield and
the potential return on your investment.
Percent Payout
The last opportunity you have to apply judgment is in Section 5, line
B. Here, in order to calculate average yield over the next five years,
you must estimate what the average dividend will be. To do so, the
program will divide the average % payout (the averge % payout from
the previous five years, as determined in Section 3) by the Forecast
High P/E (the average of the previous five years’ High P/E figures
from Section 3).
Normally, the figure is simply taken from the calculation of the average in Section 3. However, you may wish to estimate the percent payout as a different figure. Perhaps the company has announced a new
dividend policy, or maybe you’re satisfied that the company is a mature company and will be paying substantially more of its earnings in
dividends in the future.
Toolkit 6
133
Whatever the case, you have the ability to change that figure in Section 5B. As in the other “may do” areas, this one will be highlighted in
yellow if you have opted to enable highlighting.
Your work is finished. It’s that simple!
The remainder of the form will be filled out completely, and you are
now ready to examine or print the completed Stock Study and assess
your result.
To Buy or Not to Buy
Now that you have completed all of the necessary tasks, it’s time to
use what you have done to help you make a decision about the stock
you have studied. There are four things to evaluate, all progressive as
well. In other words, if the first doesn’t make the grade, you don’t
need to bother with the next:
· Price Range
· Reward/Risk Ratio
· Relative Value
· Total Return
Price Range
When you complete the work on the Stock Study, the remainder of
Section 4 is calculated. The first thing to look at is the range of prices from the stock’s current price to your estimated future low and
high prices
134
Toolkit 6
The Stock Study divides the range between the potential low price
and the potential high price into quarters, representing the “Buy,”
“Maybe,” and “Sell” ranges.
If the current price fell into the lowest quarter, you would consider it
in the “Buy” range and continue with your evaluation. If this is the
case, you will find “Buy” in the field on line 4C. “Maybe” (or “Hold”) is
in the middle two quarters, and of course, “Sell” is in the top quarter.
In the next section, you will see why Toolkit 6 has changed the default ranges from thirds (33%-33%-33%, as was used in prior versions) to 25%-50%-25%.
Reward/Risk Ratio
The next and most important item to consider is the Reward/Risk
Ratio. This is the important measure of reward compared to the risk
of investing in a particular stock at its current price.
The Reward/Risk Ratio is calculated by dividing the “distance” from
the current price to the potential high price and dividing it by the
“distance” from the current price to the potential low price. (The term
“distance” might be clearer by looking at the graphic just below.)
The meaning is simple: How much risk I must take (how much I lose
if the price goes down to the low) versus how much reward I might get
(if the price goes from its current price all the way up to its potential
high). It is generally a good value if you stand to gain three times as
much as you might lose: a 3 to 1 Reward/Risk Ratio.
There is a potentially confusing paradox here. If you use the 33-33-33
ranges, a stock can be in the “Buy” range with an Reward/Risk Ratio
Toolkit 6
135
as low as 2 to 1. In fact, a stock whose current price is the same as
the top of the “Buy” range has a 2 to 1 Reward/Risk Ratio. This is because, under these circumstances, you have one third to lose and two
thirds to gain (as the “Buy,” “Hold” and “Sell” ranges are calculated).
It is therefore the preference of some investors to look at the “Buy”
range as the lowest quarter of the low to high range. That way, a
stock cannot be in the “Buy” range without having at least 75% to
gain and 25% to lose (3 to 1).
This is why the default setting in Toolkit 6 is 25%-50%-25% range. If
for some reason you wish to change the default, click the appropriate
selection within the Select Zoning Default section within your Preferences. This setting is global, meaning that these divisions will then
prevail anywhere in Toolkit 6 that these ranges are reported or considered.
NOTE: When the current price is above the top of the “Sell” range,
the Reward/Risk Ratio is shown as “0.0 -” since negative figures are
not meaningful; when the current price is below the bottom of the
“Buy” range, it will appear as “99.9 +.”
Graph of Price Ranges and Reward/Risk Ratio
Toolkit contains a graph to help you better visualize the Buy, Maybe,
and Sell price range zones in relation to the Reward/Risk Ratio.
To open the graph, click in the magenta box (if you enabled “Active
Area Highlighting” in Preferences) around Section 4C & D—the cursor also changes to a magnifying glass in this area, indicating an opportunity to take a closer look.
The bar graph on the left is the Price Range you selected in Preferences, either 25%-50%-25% (the default, for a true 3-to-1 Reward/Risk Ratio) or 33%-33%-33%. The bar graph on the right shows
the Reward/Risk Ratio, with the potential Reward of 3 and a Risk of
1. The Current Price is indicated in the middle, showing its relative
position to the High and Low Prices and the Price Range and Reward/Risk Ratio.
136
Toolkit 6
Potential Return from Your Investment
The final and key determinant is the potential return on your investment. The term, “total return” means the annual return from both the
investment’s price appreciation and the dividend yield.
You are looking for a
return on your portfolio of at least 15%,
compounded annual
return, in order to
double your money
every five years. This
does not mean that
every stock has to
produce a 15% return; it means that
the average of your
portfolio must do so.
You will find most of
the larger, more mature companies will
give you a lower return on your investment because their growth rates have slowed. You
can balance these lower risk investments with stocks having a return
in excess of 20%.
Here you have two measures to look at:
· Total Return
· Projected Average Return (PAR) (Available if selected in the
Preferences.)
Total Return
Total Return, as it is used here, is the compounded, annualized figure
that requires just under 15% to double your money. This number is
the result of your purchasing the stock at today’s price, selling it in
five years at your projected high price, and adding to it the dividends
Toolkit 6
137
that you expect to receive-the combination of compounded appreciation and dividend yield.
Projected Average Return (PAR)
PAR (available if enabled in Preferences) is the compounded, annualized figure that also requires 15% to double your money. PAR is the
return on your investment when you purchase the stock at today’s
price and sell it in five years at an average price. That price is calculated by multiplying the high EPS by the Average P/E rather than
the Average High P/E. This is a more modest figure and, certainly, a
more realistic expectation.
If you are satisfied with the return you expect to make on your investment, based upon all of your conservative assumptions, then you
would probably decide to purchase the stock.
The Judgment Audit
Overview
Toolkit 6 is not only a tool to implement fundamental investing
methodology; it is also intended to be a useful instructional tool that
can assist you in learning to making prudent decisions as they are
required during your Stock Study.
The Judgment Audit combines several functions within the scope of
a single button on the Company Toolbar. Clicking on the “Audit” button opens the Judgment Audit window.
138
Toolkit 6
The Judgment Audit offers three functions:
1. Scan the Judgment Items to see what you have yet to complete.
2. Reset the judgment items (clear all and start again).
3. View the Items to check to see where your decisions or the actual data raises questions.
Judgment Items
In the course of your study, in addition to such options as eliminating
outliers (irrelevant historical data) or substituting values for default
Toolkit 6
139
values, there are five estimates or forecasts you are required to make:
1. Estimate Future Sales Growth.
2. Estimate Future Earnings Growth.
3. Estimate Future High P/E.
4. Estimate Future Low P/E.
5. Select a Low Price.
If you have failed to enter any of these items, Toolkit cannot complete
your study. Should you find that the Stock Study is complete only
through the beginning of Section 4—Evaluating Risk and Reward
over the next 5 years, you may find out what items remain to be estimated to finish the study. Those that remain will be displayed in
“Judgment Items” in bold type. The items that are completed appear
in plain type.
Reset Judgment
The “Reset Judgment” button below the “Judgment Items” list enables you to reset all judgment items you have entered. If you are dissatisfied with some of your decisions, or, if you have accessed a file
that contains someone else’s judgment and want to begin again using
your own—say you imported one from StockCentral’s data feed, for
example—you may do so by clicking on the “Reset Judgment” button.
NOTE: All judgment items will be reset, including any outlier elimination that may have been performed.
Items to Check
This valuable aid keeps an eye on both the basic data and the results
of your judgment, monitoring the critical items to see that they are
within reason or that they follow certain conventions. Should any of
the items listed be outside of the desired values, they will be denoted
140
Toolkit 6
with a red check mark. Clicking on the checked item will open a dialog box, informing you why the item is checked.
NOTE: The purpose of this feature is not to qualify or disqualify the
Stock Study on the basis of these issues. It is merely a device intended to invite your attention to items that may be questionable.
These include:
Capitalization: Invites you to evaluate the capitalization of the
company as it is displayed in the header on the front of the
Stock Study (for example, if more than one third of the company’s capitalization comes from debt).
Recent Quarterly Growth: Calls your attention to quarterly
sales and earnings growth if it is lower than desirable or has
declined.
Historical Sales Growth: Suggests when you might consider
eliminating irrelevant historical sales data from the graph, asks
you to assess if growth has been steady enough to be reasonably predictable, and/or calls your attention to what might be
serious growth deficiencies you should examine.
Historical
Growth.
Earnings
Growth:
Same
as
Historical
Sales
Forecast Sales Growth: Cautions you when your estimates of
future growth might be too optimistic.
Forecast Earnings Growth: Same as Forecast Sales Growth.
Management Evaluation: Calls your attention to possible inefficiency in management.
Historical P/Es: Suggests when you might want to consider
eliminating some historical High or Low P/Es as outliers.
Future P/Es: Cautions you when your estimates of future
P/Es may be too optimistic.
Toolkit 6
141
Low Price: Raises a caution flag if the current price appears to
be too low compared with its price history.
Result: Suggests conclusions you might draw from the “Results” compiled and displayed in the Judgment Audit dialog
box when all required judgment items have been completed.
Notes and Descriptions
A “notepad” is available to make notes or comments about each stock
you study. You may want to record your reasons for making certain
judgment decisions, the name and phone number of the company’s
Investor Relations person to answer your questions, items you want
to bring to the attention of your club colleagues, etc.
To access your notepad, click on the word “Notes” on the Toolbar at
the top of the company screen.
142
Toolkit 6
“Notes” will appear bold and italicized when there are notes available.
Company descriptions can now be added to the note section by clicking the Description button. Within this section you can create a snapshot of the company describing industry information and other relevant information.
NOTE: When you export in the *.SSG file format, the Notes may be
exported with the file if you select the “zip” option. Exporting as an
*.ITK file will keep Toolkit formatting, including Notes. When you
back up your data, these notes are preserved in the backed-up database file.
Assigning Stocks to a Portfolio—Stock Library
The Toolkit Stock Library is the collection of all the companies in
which you are interested. Some of the
companies will have data only; some
will have been analyzed and evaluated; and some will make it into your
portfolios as you purchase them, either actually or hypothetically.
The mechanism you will use to assign
stocks to your portfolio is the Stock
Library. The Library window in
Toolkit 6 is an easy interface for accessing all of the companies in your
Stock Library and creating and managing your Portfolios.
In the Library, you may:
· Create a new portfolio.
· Assign a stock or stocks to a
portfolio.
· Change the numbers of shares
of a stock in a portfolio.
· Delete a stock from a portfolio.
Toolkit 6
143
·
Delete a portfolio.
For detailed instructions on portfolio management and use of the
Stock Library, see the “How to” section. Click on the blue “Library”
button to open your Stock Library. The tab is always present, and
the Library always accessible no matter what study you may be performing. Clicking on the blue “Library” button will re-open and expand the Library view. If “Hide and Show Library Automatically” is
selected in Preferences, then the Library window will automatically
open when no Stock Study screen is open. When you open a company, the Library window closes, but you may reopen it by clicking on
the green “Library” button.
The Library window is divided into three vertical panes: Stock Library, Select Portfolio, and Portfolio Holdings.
The Personal Library (Stock Library) consists of all of the companies
you have saved in your Toolkit.
The Select Portfolio pane allows you to create Portfolios into which
you may add companies from that Stock Library. It also provides access to the Roster of Quality portfolio, which is a special locked portfolio of companies that meet specific attributes of quality. Each week,
the Roster of Quality listing is updated and delivered to Toolkit 6 (a
StockCentral subscription is required).
Finally, the Portfolio Holdings pane displays the contents of the individual Portfolios. If the Roster of Quality is selected, the Quality
Index is displayed in the right column. The Quality Index is a 0 to 10
scale, with 10 indicating the highest quality. You may not add or delete companies from the Roster of Quality.
To create a new Portfolio, click on
the “New” button in the Portfolios
pane. This opens an “Add New Portfolio” window in which you may enter a name for the new portfolio which will appear in the window with
the list of portfolios.
144
Toolkit 6
To add stocks to your new portfolio, you can either click the Add
button at the bottom of the Portfolio Holdings, or right-click on any
of the companies displayed in the
Stock Library and select “Add to
selected portfolio.” Enter the
“Number of Shares” in the space
provided.
Some Helpful Tips
To facilitate finding a company, you can sort either the Stock Library
or the Portfolio by column heading. Click on the column heading to
sort in ascending order or shift-click to sort in descending order.
You may wish to create a “Watch List” portfolio by entering “0” as the
number of shares.
Updating Your Stock Studies
Updating Your Data
Once you have acquired the data for a company for the first time, it
will be necessary for you to keep the data current on a regular basis.
Toolkit 6 makes it very simple for you to do.
There are two types of updating that should be accomplished on a
regular basis. They require a minimum of effort:
1. Price Update.
2. Company Data update.
Since this section deals with acquisition, we will discuss only the
means for updating a single company. This is something you will
want to do each time you do a Stock Study or review one that you
have done. Toolkit 6 has automated much of the task of keeping
track of when data and prices need to be updated and performing the
Toolkit 6
145
actual updates. These issues deal primarily with portfolio management tasks. Therefore a detailed discussion of updating prices and
data for multiple companies will be found in the Portfolio Management section.
Price Update
While you are doing a Stock Study or whenever you revisit a stock to
update your analysis, you will, of course, wish to update the price.
For purposes of this discussion, it is assumed that you will be connected to the Internet and will update your prices electronically. This
section will deal with the most convenient and frequently used means
doing so. Consult the How to.. section and following for the many
other ways this can be accomplished.
Updating an Individual Company Price
Toolkit 6 completely automates this task for the investor. With the Company window open, click on the
“Price” button on the Company Toolbar for an instant price update
for that company.
You will also find a “Prices” button for that purpose
within the Basic, Annual, and Quarterly dialog boxes.
Updating Multiple Prices
With a single mouse-click, you may update all the prices in the stock
library, a selected portfolio, or just those whose prices are more than
a week old (or however
old you wish to declare them “stale”).
The most convenient
method for updating
either all stocks in the
stock library or just
the stale ones is by
right-clicking on the
146
Toolkit 6
“Update Prices” button under “Requires Attention” on the Home Page
and selecting either option from the displayed menu. The “Update
Prices” button will be red any time there are any stocks whose prices
are stale. Set the desired threshold in Preferences > Thresholds.
Data Update
Assuming you are connected to the Internet and have a valid
StockCentral.com or BetterInvesting.org subscription, the data for
an individual stock may be most easily updated from the Company
window using the “Refresh Data” button. Clicking on the “Data” portion of the button as in this illustration will momentarily close the
window and update the data with all of the new information. The data
and price may be updated simultaneously by clicking on the top, “Refresh” portion of the button.
NOTE: You may have reason to want to retain the data in your database and have only the new data added to the file. You may do this
using File > Update Companies. See “Changes only” in the How
to... section.
Split Alerts
Occasionally, a stock split or stock dividend will have occurred in the
period prior to your update. The data files from which you are importing the new data include fields that contain the split factor and the effective date of the split.
If there has been a split, Toolkit will analyze the existing data and determine if that data has been adjusted to accommodate the split. If it
has not, you will be given the opportunity to accomplish that adjustment with a mouse-click. If you prefer not to do so for some reason,
you may decline and the data will not be updated.
If there has been a split and your data appears to have already been
adjusted, you will be notified of the split as well and simply informed
that your data appears to have been appropriately adjusted.
Toolkit 6
147
Inconsistencies Between New and Old Data
Some investors alter the historical data to account for non-recurring
events or other items that they feel should be adjusted to more accurately depict the company’s historical performance. Some sources of
data restate data when some operations have been discontinued. For
these and other reasons, you may wish to use one or the other of the
import options that are available in Toolkit 6.
If Toolkit 6 detects inconsistencies between the historical data and
the same historical data in the file that is being imported, depending
upon the circumstance and the option you have selected, you will be
advised of the circumstances and given the opportunity to change
your import option to one that may be more appropriate.
For example, if Toolkit 6 senses a discrepancy and you have elected
to use the “Full Update” option, you will be told that there is a discrepancy and given the opportunity to change to “Changes Only.” If,
for example, you had modified the historical data as described above,
you would probably want to preserve those changes by updating only
the latest data and not overwriting the data you had amended.
148
Toolkit 6
Comparisons
Purpose
Once you have evaluated a stock the next logical step is to find out
whether that stock is better than others that you may be considering.
Many investors who have been led to study a particular stock—even
to “fall in love” with it—have found others in the same industry that
are even more appealing and show greater opportunities for return.
Therefore, it’s a good idea, especially if you have the convenience of
using electronic data, to quickly run through two or three additional
Stock Study for companies in the same industry. You might just be
in for a pleasant surprise.
Toolkit 6
149
One important function of the Comparison is to identify Growth Industries. Often, investors will complete a Stock Study, see that the
company’s stock is in the “buy” range, and rush out and purchase
stock. Before doing that, it is important to compare that company to
others in that industry. If the company is in a growth industry, typically all of the companies in that industry will appear to be attractive
candidates and good investments. However, in a growth industry, you
should invest only in the “best of the breed”–the company that has
the best profit margins, the best management.
Because there might someday be a “shake out” in the industry with
only the best companies remaining standing, you will want to own the
best of the best. The Comparison will help you do that.
Overview
Comparison is the tool that you will use to compare up to five
stocks—preferably, but not necessarily, in the same industry—to see
which company would be the most desirable to own on the basis of a
number of important criteria.
These criteria are grouped into four basic categories:
1. Growth Comparisons: Comparing both the historical and the
forecast growth rates of revenues and earnings.
2. Management Comparisons: Looking at profit margins as a
measure of management’s ability to control costs, return on
equity as a measure of its ability to make money on invested
capital, and insider ownership as an indication of management’s incentive to produce.
3. Price Comparisons: Comparing such items as the historical
and Current P/E multiples, price ranges, Reward/Risk ratios,
yield and forecast appreciation as indications of value.
4. Other Comparisons: Providing a potpourri of informational
and comparative data as well as room for your choice of comparative items.
150
Toolkit 6
The Comparison lists these twenty-eight to thirty different criteria for
each stock, most of the information coming directly from the Stock
Study. The Comparison analyzes each row, determining which stock
was the best in each category that can be judged competitively, and
circles each winning entry. It then counts up the marks for each
company to determine the winner.
A close look at the form, however, reveals that some of the items are
not competitive. For example, the exchange on which the stock is
traded or the various price ranges listed cannot be considered better
for one than another.
Also, other items may be considered of varying importance. As a case
in point, the several measures of the historical P/E ratios, while saying something about investor confidence in a stock, cannot be given
the same weight as the growth of earnings or revenues.
Toolkit 6 enables you to attach whatever weight you feel is appropriate to each of the criteria. In this fashion, the “winner” takes into account the importance of each item as it “grades” your selections.
It is important to note that, as in the Stock Study process, judgment
is also important in performing the comparison. Although a convenient place to start, the Comparison must be used with care. You must
resist the temptation to allow it to draw conclusions for you too mechanically. Only you will know which of the many factors is most important to you.
Starting the Comparison & Selecting the Companies
1) Click on the “Comparison” button on the Main Tool
Bar, or the Compare Stocks button on the Toolkit 6
Home Page.
2) In the “Select Companies to Compare” screen, use
the Portfolio drop-down menu to select a portfolio containing the
companies you want to compare or select “Stock Library.”
Toolkit 6
151
3) Choose companies to compare by clicking on the company to highlight it and then clicking on the “Select” button (or double-clicking
on the company name) to move the company to the right to the
“Companies Selected” listing.
Note: Only companies whose Stock Studies have been completed with
all judgments can be displayed in the “Select Companies to Compare”
dialog box and can be viewed in the Comparison.
To remove companies from the “Companies Selected” column, click on
the company to select it and click on the “Remove” button, or to remove all, click on the “Clear Selected List” button.
4) Click the “OK” button to open the Comparison. Assuming that
you have already done Stock Studies on several other companies
in the same industry, you should then use those companies for
comparison.
152
Toolkit 6
Always the same industry?
You might ask, “Why do we worry about selecting stocks in the same
industry when all we’re really interested in is what company would be
the best investment?”
Actually, there are only two reasons that count:
1. We don’t want to compare “apples with oranges,” and
2. We want to consider diversification.
Apples to Apples: Companies in the same industry should have similar statistics so the comparisons will be more meaningful. The fact is
that the only major difference to be seen is likely to be the average
profit margin, and to some extent the return on equity figures, on
lines 5 and 6, respectively, in the Comparison. Obviously, you
wouldn’t make much sense out of comparing a food retailer with a
handsome profit margin of 4% with a software company that’s running with a sub-standard 25%.
The program therefore ignores the numbers and circles the spaces
with an “Up” or “Even” trend. So, at least mechanically, it ignores the
disparity. You will, however, want to take note of the actual figures
when you’re comparing companies in the same industry. If profit
margins and return on equity for two or more companies are circled
because of their trends, it’s certainly smart to look for the higher percentages.
Diversification: Many folks, having given some thought to diversification issues, decide that they would like to have a particular industry represented in their portfolio. Under those circumstances, it does
make sense to search for other companies in that industry to see
which would be the better addition. Some investment clubs, when
looking for a new stock to buy, restrict themselves to companies in a
single industry.
Toolkit 6
153
When all is said and done, if you’re comparing companies and the only issue is which company represents the greatest potential, then, by
all means, use the Comparison regardless of the industry.
Using the Comparison
It makes sense for all of the stocks under consideration to be displayed side-by-side to assist the user in comparing the more important issues. After selecting two or more companies, (you may select up to five,) click on the “Compare” button to look at the Comparison.
Accessing a Stock Study
You may access the Stock Study for any company displayed by rightclicking on the company name at the top of the Comparison column.
Also, if you left click on the company name, a “quick-view” Stock
Analysis Graph will open so that you may quickly reexamine the
sales, profits, and earnings trend lines.
To switch back to the Comparison just close the Stock Study.
Applying Judgment
As with the Stock Study, there are opportunities for applying your
own judgment to the comparison process. It’s not a good idea to allow
the computer to substitute for your own good thinking. Each of us
has a different idea about what’s important and what isn’t, and it’s up
to us to apply this judgment to our work. Accordingly, Toolkit 6 offers you two such opportunities.
Customizing your Criteria Options
In order to make the process as flexible as possible without altering
the traditional form in any way, we have automated some of the
things that you may already have been doing with a pencil.
154
Toolkit 6
Clicking on the Criteria button, on the Comparison Toolbar, opens a
“Specify Optional Criteria” window. Here, you can easily add or
change data in lines 23, 27, or 28.
Line 23—Combined Estimated Yield
Line 23 calls for the “Combined Estimated Yield.” This is actually
another name for “Average Total Annual Return.” It represents the
linear or simple total average annual return. In other words, it does
not include compounding. For a company whose stock price had
doubled in 5 years (appreciation is 100%), the result would be 20%
plus the dividend yield. We recommend that you do not use this option.
“Total Return” as it is used here, on the other hand, is the compounded annual growth rate plus the expected dividend yield. The
Total Return calculation assumes that you sell the stock, five years
out, at the high P/E.
For the same company, Total Return would be just under 15% in
compounded annual growth plus the dividend yield. (The “magic of
compounding” can be clearly seen here since less than three fourths
of the simple interest rate is required to double your investment—
thanks to the interest paid on the interest.)
Projected Average Return: Total Return assumed that the stock sold
at its High P/E. Projected average return instead uses the average
P/E (selling the stock at its average price instead of its less likely high
price). Assuming you can sell your stock at the same fair multiple of
Toolkit 6
155
earnings as that at which you bought it, this is a more conservative
estimate of your hypothetical return that doesn’t rely upon your having to sell your stock at a high P/E.
Lines 27 & 28—Using the Blank Lines
You may select any two of the options listed below or elect to leave the
line(s) blank. This allows some flexibility and additional judgment to
enter the process as you decide which criteria are most important to
you.
Debt/Capital: Less than 33% Total Debt (25% Long Term debt) is desirable in most cases. (Financial institutions whose “inventory” is borrowed money are, of course, excluded.) This is particularly important
during bad times when creditors’ demands upon the company’s cash
can impair its ability to survive.
Earnings Stability (R-Squared): An indicator of how well the data
conforms to the trend line that appears on the front of the Stock
Study (The line calculated by the “least squares” equation to be the
one line that lies closest to all of the plotted points.) It compares how
closely the plotted points are to the trend line and ranges in value
from 0 to 1. The closer the number is to 1 the better, with 1 representing perfect correlation and 0 representing no correlation.
Relative Value: Ratio of Current P/E to Average P/E. Less than
110% is desirable. (Less than 90% could mean that the market may
know something that you don’t know—beware.)
Total Sales: A measure of company size for considerations of diversification. $400 million or less is considered a small company; $4 billion or more, a large company.
Projected Relative Value: Ratio of projected P/E to Average P/E.
Less than 100% is desirable. (Less than 80% could mean that the
market may know something that you don’t know—beware.)
P/E: Projected Growth Rate (PEG): Recognizes the relationship between the rapidity of growth and the investor’s confidence in the
156
Toolkit 6
company’s continued growth. This is calculated by dividing the projected P/E ratio by the five year projected growth rate. Less than
110% is desirable (and rare). The PEG is more useful as a comparative rather than an absolute figure.
Weighting Criteria
One way to exercise judgment in the comparison process is to vary
the amount of weight given the different criteria. This is a valuable
feature in Toolkit 6.
Toolkit 6
157
You will notice under Price Comparisons, for example that there are
five different categories of P/E:
Highest, Average High, Average, Average Low, and Lowest. The
fact that higher multiples are evidence of higher investor confidence
in the company certainly makes this criterion a mark in its favor to be
circled.
It could be argued that high multiples are unfavorable rather than favorable since stocks with a higher multiple are more vulnerable in a
down market than those with the lower P/E’s. (This is true of the current P/E, to be sure, and we acknowledge that by normally circling
the lower value.)
The importance of these figures is somewhat diminished, also, because these represent the actual multiples, whereas we may have
modified the average high or low, or average P/E, when we applied
judgment in doing our Stock Study.
Of far greater significance in the comparison are the four indicators of
growth: Historical and Projected Sales Growth, and Historical and
Projected Earnings Growth. Yet, were you give all of the P/E’s equal
weight, the five of them could outweigh the four growth criteria and
unduly judge a stock with a lower growth rate a better choice than
one with the higher multiples. In the lower left corner of the dialog
you used to select alternative criteria, you will find a checkbox labeled
“Use Weighting.” Checking that box will display a drop-down dialog
that permits you to grade each of the criteria on a scale of 1 to 5. To
accord your desired weight to each of the criteria, select a value with
5 being the greatest weight. A zero is the equivalent of eliminating
158
Toolkit 6
that item from being given any weight in the judgment at all. When
you have completed your choices, click “OK.” The weight given to
each item will appear adjacent to it on the Comparison.
As a quick method of eliminating items you deem of little value, simply click on the item itself and it will no longer be circled. In this case,
the line will be marked with an “X” in the margin to the left of the criterion label to indicate that it has been removed. The options you select remain as default options until you change them—for future sessions as well as for the current one.
“Circle All” / “Circle None”
Many users like to start with all of the circles eliminated, activating
them as they examine the relevant criteria. Click the “Circle None”
button to eliminate all the circles at once. Each may be re-activated
by clicking in the label for the individual item. All may be restored by
clicking the “Circle All” button.
And the winner is…
The winner is marked by a circle around the name field at the head of
its respective column. We urge you to review each criterion to see that
you are satisfied with the judgment that has been made. If you see
that one of the “losers” appears to rival the winner in terms of the
number of circles in it, make sure that you are satisfied that the circles are all significant and see what happens when you eliminate any
item in question. Also, see what happens to the result if you were to
use some of the customized criteria in lines 27 and 28.
Remember, the computer is not making an intellectual decision here.
It merely circles all the “winning” entries and counts them up. The
computer thinks the winner is the one with the most circles. You, on
the other hand, know that some of the factors are more important
than others, and only you can make that decision.
Toolkit 6
159
If, in the final analysis, you are left with two companies that are very
close, you can probably draw two conclusions:
1) Your subjective judgment (Which one do you like better?) might be
the next appropriate criterion to decide the issue;
2) They are so close that it won’t much matter which you select!
Portfolio Management
Overview
The Stock Study and the Comparison are the only tools you will
probably need for stock selection. With them, you should be able to
pick four winners out of every five stocks selected assuming that you
use these tools conscientiously and conservatively.
However, selecting the right stocks isn’t all there is to successful investing. The job is only half done. It’s now time to look at the “Sell”
side-or at least to consider what happens after you own your stocks.
This is where many investors begin to lose interest and fall by the
wayside in their discipline. This is also the place where their track
record can easily suffer.
Portfolio Management is the art of continually improving the quality
of your portfolio to maximize your return.
You do this by:
· Watching the performance of the company rather than the
stock.
· Selling a stock only when the company shows significant signs
that it will not produce the sales and/or earnings growth that
you expected when you bought it, and
· Replacing the stock you’ve sold or intend to sell with one of
equal or better quality having a better potential for return.
It is not:
160
Toolkit 6
·
·
Selling stocks that perform well, while keeping those that don’t,
in the hopes that they will. (Why sell your winners in hopes
your losers will turn into winners? You’ll wind up with a portfolio full of losers!)
Letting the price influence your selling decisions. Portfolio
tracking, performance measurement, or record keeping are often misconstrued as portfolio management. They are, in fact,
merely ways of measuring how well you have managed your
portfolio.
When and Why to sell
There is really no “time” to sell; however, there are certainly reasons
to do so. Most investors, less successful than you will be, believe that
you should watch for the price to rise “high enough”—whatever that
means—and then sell it to take your profit. Successful fundamental
investors know that “profit taking is often profit-losing.”
“Rules” for Selling a Stock
The first rule for selling is . . . don’t! . . . unless:
1) The company has had an adverse management change.
2) Profit margins are declining or the financial structure is deteriorating.
3) Direct or indirect competition stands to affect the company’s
long-term prosperity.
4) A company’s success is too dependent upon a single product
whose cycle is running out.
5) The company is in a cyclical industry and the cycle is about to
start down.
6) You must, in order to maintain adequate diversification.
Toolkit 6
161
7) An issue of equal or greater quality offers more gain prospects
on the upside and less risk on the downside.
8) The stock is way overpriced (at least 150% of the five-year Average P/E) and the company’s earnings are growing at 12% or
less. Even then, you might consider holding-or selling only
some of it.
Note that, of the eight reasons for selling listed above, only the eighth
suggests that you might sell to take a profit-and then only if: a) the
price is way above average; and b) the company is growing relatively
slowly.
The first five of the rules call for chucking losers. The sixth suggests
“weeding and feeding” in order not to be grossly over weighted in any
particular industry or market sector. The seventh and eighth call for
replacing a stock with a low potential only when you can find one as
good or better with a greater possible return.
Toolkit 6 provides you with a complete arsenal of tools for evaluating
the performance of the companies in your portfolio and helping you
manage it effectively. These include:
Portfolio Review Report, Portfolio Trend Report, Quarterly
Trend Analysis, Annual P/E Analysis, the Stock Management Guide, and the Challenger.
However, Investor’s Toolkit 5 took a giant step forward, and turned
these forms into a byproduct of a portfolio management process–
rather than having the forms drive that process. This process allows
you to perform all the steps involved in both your defensive strategy,
which deals with protecting your portfolio from harm and preventing
loss, and your offensive strategy, which deals with enhancing the return on your portfolio.
In earlier versions of Toolkit, portfolio management began with a version of the Portfolio Review Report and continued progressively
through the various forms, leaving it to the user to translate what appears to be a very complex form into an action plan. Because the
162
Toolkit 6
Portfolio Review Report will always be a significant tool in the portfolio
management practice, and because investment clubs will want to
study this report for their club meetings, etc., Toolkit 6 will continue
to produce that form and the others as output. However, the important functions of those forms have been abstracted and are now a
part of the process.
The Portfolio Management Process
The portfolio management process consists of two distinct strategies,
Defense and Offense.
Defense
No matter how diligently and conservatively you may have done your
homework in selecting and following the stocks in your portfolio, conventional wisdom and history tell us that one out of every five stock
you select will do poorly. The good news is that the other four will
make money for you, with one of them usually surpassing your expectations. Known as the “Rule of Five,” this statistical wisdom
should give you some comfort when you’re tempted to be too critical
of yourself as those companies invariably fall by the wayside.
Such failures occur most often for reasons well beyond anyone’s ability to predict them. Such unforeseen events range from the collapse of
the Enron’s and WorldCom’s of the world, companies whose unscrupulous corporate governance surfaced and brought them down, to the
likes of Bruno’s, a flourishing food chain that fell when its entire corporate staff perished in an airplane accident. Usually, the conditions
that cause the decline of companies you expected to be winners are
so unpredictable they take company managements, analysts, and
other financial professional by surprise as well. You certainly can’t
blame yourself for failing to foresee something that people whose every waking hour is devoted to running or following those companies
couldn’t predict and compensate for!
As the word implies, defense is the process of protecting your portfolio
from the damage that can be inflicted on your portfolio’s performance
by that one out of five companies whose actual, fundamental perforToolkit 6
163
mance fails to live up to the expectations you had when you purchased the stock. It is not at all related to the price of your stock. Declining prices are sometimes, but certainly not always, a result of declining fundamentals.
Once you have selected the portfolios that require your attention and
updated the company data and prices, continue with these steps:
1) Compare: Determine the percent of change between the current values of Sales, Pre-tax Profits, and Earnings per share
and the values for the same period the previous year, selecting
for further analysis those companies whose growth has not
met the expectations you had when you bought the stock.
2) Analyze: Examine additional history to further refine your selection of companies that may be candidates for sale, determining if there has been a marked trend.
3) Decide: For those companies that remain of concern, use the
resources available on the Internet to determine why performance has declined, selling as soon as possible those whose
prospects for returning to the strong and steady growth that
attracted you are remote.
Offense
Offense is the strategy of proactively improving the performance of
your portfolio by replacing the fine companies whose stock prices
have been bid up by investors to the point where they no longer can
produce a desirable return. Of course, this discipline relates strictly
to the price.
Once you’ve determined that the stocks in your portfolio are all companies with sound quality attributes:
1) Check Risk and Reward: Select those companies whose Relative Value, Reward/Risk Ratio, and Total Return indicate that
they are overpriced and offer insufficient return, and at too
great a risk.
164
Toolkit 6
2) Reevaluate: Review your Stock Study for each of those
stocks, being sure your estimates of earnings growth and forecast high P/Es are reasonable in view of current performance.
3) Challenge: Replace those companies whose return and risk
remain unsatisfactory with other companies of equal or better
quality and better potential returns
Implementing the Process with Toolkit 6
Because protection is crucial, defensive strategy is by far the most urgent and should be implemented conscientiously and regularly. However, because the data on which defensive strategy is based changes
only four times a year for each stock, it will require your attention only when new financial results are reported each quarter.
Scheduling Defense
Approximately 60% of U.S. companies match their fiscal years with
the calendar year. Retailers typically delay the end of their fiscal years
for a month or two in order to capture the holiday activity at the end
of the year. The majority of the remaining companies end their fiscal
years at midyear, with the rest scattered throughout the other
months.
The Securities and Exchange Commission (SEC) gives companies
ninety days after the end of the fiscal year to report their results and
forty-five days to report after the close of the intervening quarters.
From this, it can be seen that the majority of your defensive workload
will come right around tax season when most companies who close
their books on December 31st will have until the end of March to report. By the time the data reaches the data providers and you have
access to it—perhaps another two weeks—you’re in the middle of
April. For this reason, you should set aside some time just after you
have filed your income tax to do your defensive management. For
those companies, you will expect to look at the first quarter’s results
in early June, the second quarter in early September, and the third
quarter in early December— forty-five days to report, plus two weeks
for the data providers to prepare the data for you.
Toolkit 6
165
Data Triggers
Toolkit provides an automatic reminder that lets you know when the
data for any company is due. You may set the number of days following the end of the fiscal year and quarters by accessing the Preferences and clicking on its Thresholds tab to enter your choices under
Data Triggers:
Set your data triggers for at
least 60 days beyond the
end of the quarter and 105
days beyond the year end to
allow ten days after reporting for processing. Entering
triggers larger than that
may prevent your being
alerted to update your data prematurely; but, if you’re intent on
checking your portfolio as soon as possible after the data is reported,
don’t extend that period much beyond the recommendations.
Here, you may decide when price
data becomes stale and be notified
of that as well. Toolkit 6 keeps
track of the dates when the quarters and fiscal year’s end; and,
when that date has passed, will notify you in the “Requires Attention”
section on your Home Page that
there are companies whose data is
due to be reported.
Home Page
Clicking on “Update Data” in the “Requires Attention” box will display
those companies whose data should be available and you may elect to
update any company individually or all of them at once.
Although defense has nothing to do with the price of the stock, you
might as well click on “Update Prices” while you’re at it. This will up166
Toolkit 6
date all of the prices in your system in a couple of seconds. Now,
you’re ready to go to work on your portfolio(s). The “Portfolio Report
Card” and your Home Page is probably the most convenient place to
start. Any portfolio containing a company or companies requiring
your attention— either as a candidate for defensive or offensive action—will be listed in red. Here you can see the aggregate return and
risk for that portfolio as well as its total value. Double-click on that
portfolio to display its Overview window.
Overview Window
The Overview window is a comprehensive look at your selected portfolio as a whole. At the heart of the portfolio management process, it
permits you to see how recent the data and prices are, to update the
data and/or prices for either for a single stock or for the entire portfolio, to add or delete holdings, and to view the related reports and
worksheets. You may use the pull-down menu at the upper right to
change to another portfolio without having to return to the Home
Page or docked Stock Library. The dollar-weighted averages provide
Toolkit 6
167
you with the portfolio’s important aggregated and dollar-averaged criteria (based on dollars invested rather than number of shares).
Total Return
Total Return for each stock in your portfolio is the annualized, compounded return you might expect on that investment, based on purchasing it at the current price, selling it after five years at its forecast
high price, and receiving any dividends expected to be paid in the intervening years. It is expressed as a percentage. The portfolio’s average Total Return is the dollar-weighted average of all of the stocks in
your portfolio. Since your goal is to produce or exceed an average
portfolio return of 14.9%, this is a valuable measure of whether or not
your portfolio is in a position to give you that desired hypothetical return. When you make any changes in the composition of your portfolio, the result will show up here, giving you guidance as to how those
changes might affect its performance. (See the Glossary for the calculation.)
Projected Average Return.
This is a value calculated in the same way as Total Return but the
calculation uses the forecast Average P/E rather than the forecast
High P/E to determine the price at which the stock would be hypothetically sold. While P/E expansion is an important part of investment return, it is useful to determine what kind of return you might
expect should there be little or no increase in the price investors
would pay for a dollar’s worth of your companies’ earnings. (See the
Glossary.)
Reward/Risk Ratio
This is the standard measure of risk versus reward. Applied to the
portfolio as a whole, it can provide you with a check on the portfolio’s
vulnerability. You will strive for a continuing ratio of reward to risk of
three to one and, should that value decline substantially, you will
want to ferret out those stocks whose Reward/Risk Ratio erodes the
portfolio’s average. (See the Glossary.)
168
Toolkit 6
Relative Value (RV)
The dollar-weighted average Relative Value of the portfolio tells you
how the aggregate prices of all your stocks—expressed as a multiple
of their earnings—compare with the prices investors have historically
paid for those shares. The assumption is that, barring any specific
reasons to the contrary, the Price Earnings ratios of all stocks will
tend to gravitate toward their average value or “signature P/E.” (See
the Glossary.)
A RV of more than 110% for your portfolio indicates that some shares
in your portfolio are probably overpriced at the moment, compared
with what they have been historically. A low RV, below 85% or lower,
indicates shares in your portfolio are selling at a lower P/E than they
have historically.
You might wish to investigate whether one or more holdings is selling
for an especially low multiple indicating that there may be some problem with the company that bears further research.
Rational Value
This value is the “flip side” of RV. If Relative Value tells you how the
current P/E of your holdings compares with the average P/E of those
holdings, Rational Value goes one step further and tells you what
your holdings would be worth if investors were paying the average
P/E for them. The aggregate Rational Value shows you what your
portfolio would be worth if your shares were selling for their “normal”
price based on the earnings of the underlying companies. This is especially useful to you when the market is either extremely overpriced
or undervalued. It can tell you the real value of your portfolio were it
not to be influenced by the vagaries of the marketplace, keeping your
feet on the ground during a “bubble” and your head high in a “bust.”
In the “Holdings” grid beneath, you can see the contribution each
company makes to the portfolio you’re working on. Here you may
analyze each company’s data and price for timeliness, view or alter
the number of shares, and look at the risk, reward, and relative value
Toolkit 6
169
of each holding. You can also update the data and prices for one or all
of the stocks in the portfolio.
NOTE: Companies whose Stock Studies have not yet been completed
are displayed in red in the Overview window. You may double-click
on that company to finish adding judgment to the Stock Study and
permit it to be included in your defense and offense analyses.
The Alerts Window
The first step in either defense or offense is accomplished by clicking
on the “Alerts” button at the top left corner of your Overview window. This will display for you all of the stocks in the portfolio requiring either defensive or offensive attention. You may toggle between the
Overview and Alert windows using that button, now labeled Overview. Again, you may also select another portfolio at any time from
the pull-down menu in the top right corner of this screen.
Note that the Alert window is divided into two grids, “Defense” and
“Offense.” Defense is the most critical and should be handled on a
170
Toolkit 6
regularly scheduled basis. The schedule for your offense task is not
so critical, but should be addressed only when you’re satisfied that all
of the stocks in your portfolio would survive your defensive scrutiny
and remain in your portfolio. In most cases, a company that is a prospect for sale for defensive considerations (i.e., whose fundamental
performance has declined) will show a decline in price because its
performance will induce investors to sell. This reduction in price will
tend to elevate the hypothetical return and reduce apparent risk. For
this reason, it is unlikely that companies that are marginal will appear on both of the Alert grids at the same time.
Occasionally, however, a favored company whose fundamental performance has foundered will enjoy a slow reaction from investors. In
such a case, investors will continue to pay too high a price for the
stock in view of its apparent future earnings capability. Should this
reduction in forecast earnings result in a reduction in the future high
price—and the hypothetical return be reduced accordingly—it is possible for the stock to show up both in both the Defense and Offense
grid. In such cases, you should be aware of this dichotomy when you
perform your defensive review and sell the stock if you can’t justify
holding it on the basis of future return. If you should decide to hold
the stock because you believe management will turn around a short
term problem, you should make certain that your Stock Study reflects the return you would expect from the turn-around and does not
stay in your portfolio despite its unacceptable forecast return.
Defense: Compare, Analyze, Decide
Toolkit 6 provides you with a simple mechanism to easily implement
the three basic steps for your defensive strategy.
Compare
Toolkit 6 saves you all the trouble of scrutinizing the Portfolio Review Report to find the problem companies. In the Alerts screen, it
abstracts from your portfolio and displays only those companies that
should claim your attention. Thus the “Compare” step is completed
automatically just by clicking on the Alerts button.
Toolkit 6
171
Analyze
In the Defense grid you will find listed all the stocks in the portfolio
whose recent growth falls below your original expectation when you
purchased the stock. Your goal here is to identify the companies that
appear to be seriously and/or steadily declining from the growth rate
you used as your estimate. Needless to say, it would not be a sound
decision to simply sell all those whose faltering performance has
landed them on the Alert page. While all displayed will have slipped
below your threshold of expectation, some have not performed badly
enough to bother with further action and you will want to give them
another quarter or two to see what happens. Those remaining will require further steps.
Your estimates for sales and earnings growth determine your expectations, and those expectations are displayed in the “Sales Exp” and
“EPS Exp” columns for each stock.
NOTE : Because you had no opportunity to forecast a growth rate for
Pre-tax Profit, your selected EPS growth rate serves as its proxy. Actual performance is displayed in the “% Change Sales,” “% Change
PTP,” and “% Change EPS” columns. Compare these values with
your expectations.
These columns represent the annual growth of the displayed companies over the last twelve months. Note that you may click on the text,
“Quarterly” or “Trailing 12 Mos.”, just above the grid. Clicking on
“Quarterly” displays the percent change between the most recent
quarter and the same quarter the year before. “Trailing 12 Months”
displays the percent change between the sum of the most recent four
quarters and the same period for the previous year.
It’s best to select “Trailing 12 Months” above the grid for your initial
analysis. Doing so will tend to dampen the effect of changes in individual quarters. When performance is bad enough to cause a serious
decline in the trailing twelve month performance, it will warrant look172
Toolkit 6
ing further to see if the cause was a single quarter bad enough to
have dragged the entire year down, or a series of quarters that have
trended down and have finally taken their toll. Each of these conditions would warrant a different approach to researching the problem
when or if it’s necessary.
The columns adjacent to the “% Change” columns, titled “% Diff”,
display the magnitude of the difference between expected and actual
performance, expressed as a percentage of your expected growth rate.
These columns enable you to see clearly which companies require
your attention most urgently.
Ranking
Any column can be ranked in ascending or descending order by clicking or shift-clicking, respectively, on the column header. This enables
you to bring the worst or best performers to the top of the list and
deal with them in order of severity. For both defense and offense, it’s
best to sort the “% Diff” column in ascending order to highlight and
bring the worst cases to the top of your list.
You may want to try ranking on the “% Change” column to see the
difference in the way the companies are ranked (if any) and why it’s
better to sort on the “% Diff” field. You will want to look at each of the
three parameters in this order: Sales, Pre-tax Profit and EPS for the
purpose of selecting those that you feel warrant further action. With
only a few companies displayed there, it’s a simple matter to “eyeball”
those whose performance warrants further research and go on to the
next step. However, if the list is long enough to require scrolling to see
all of the questionable stocks, you will want to apply a simple, systematic process to this second step:
Toolkit 6
173
1) Click on “Trailing 12 Months” above the grid to display the performance for the 12-month figures.
2) Next, rank them in order of % Diff for sales.
3) Scroll down the list until you reach the point where the difference
between expectation and actual performance is acceptable.
4) Select each of the stocks below that point and click on the “Hold”
button to mark them for retention.
5) Repeat the process for Pre-tax Profit, ranking the stocks on “%
Diff.” You will probably find one or more whose Pre-tax Profit performance is unacceptable even though sales growth was. Click the
“Hold” button for any such stocks to remove the “Hold” action and
return them to “further investigation” status.
6) Do the same for EPS.
When you have completed this step—time permitting (or your own
conservative nature demanding it)—you may wish to add any companies to your list to investigate whose most recent quarter was poor,
notwithstanding the fact that the trailing twelve month performance
was not disappointing enough to have caused you concern. While single, quarterly changes are often not significant enough, in themselves,
to warrant taking immediate action, they can be significant alert signals to detect the possible onset of longer-term trends.
Click again on each of the “% Diff” columns to rank them by their severity and then toggle between the “Quarterly” and “Trailing 12
Months” buttons to bring the poor quarterly performance to the top.
Should you see especially large negative values for the “% Diff” and a
“Hold” in the action column, click again on the “Hold” button to include the stock in your investigation list.
As you perform this task, look for companies for which you may have
deliberately set your growth expectations below what you considered
desirable because P/E expansion was sufficient to present you with
an attractive return. (P/E expansion is simply an increase in the price
174
Toolkit 6
people are willing to pay for a dollar’s worth of earnings and, as positive fundamental performance influences investors, that price can increase, especially if it’s low to begin with.)
Challenge any such stocks during this process. P/E expansion can
offer the required return in the absence of adequate earnings growth
only when the price is well below a reasonable price. You will want to
investigate to find out why the price is as low as it is before you can
be comfortable about keeping this stock in your portfolio. If the new
data doesn’t give you reason to be as optimistic as you were when you
first accepted the less-than-desirable growth, you should probably get
rid of it. At the very least, you should confirm your quality assessment.
When you have systematically combed through your Defense list in
this fashion, all companies that require a decision will show a blank
in the “Action” column and you are ready to complete the last phase
of the Defense process.
Decide
Now that you’ve assembled the companies you want to investigate, it’s
time to research each of them to decide whether the problems call for
dumping it or giving management a further chance to correct the
problem. This is a structured process as well:
1) Rank on the “% Diff” for Sales.
2) Select each company at a time that has a blank action line and
click on the “Check Trends” button to the right of the grid (or doubleclick on the grid line). This will bring up the Quarterly Trend Graph.
It tabulates as much quarterly information as you have in your database, up to nine years.
3) Examine the quarterly and trailing twelve months’ data, looking for
trends. You may do this using the tabulation displayed on the Quarterly Trend Analysis form, or you may find it more meaningful to select “Quarterly Trend Graph” from the pull-down menu on the upper
left of the window and see the same information displayed graphicalToolkit 6
175
ly. See below for a more detailed discussion of this form and its
graph. If the company shows a trend that indicates a long-term decline that has remained below your expectation for more than a couple of quarters without starting back, return to the Alert screen and
click on the “Sell” button. If the trend is short, is a matter of a single
quarter, appears to be on its way to coming back, or gives you cause
for optimism, go to the next step.
4) Click on the “Web” button
at the top of your screen to
explore your favorite research sites. (See the “How
to...” section for instructions
on adding or deleting addresses in this pull-down
menu.) You are interested in
finding any comment that
pertains to the poor performance that attracted your
attention. If you find that explanations given by the company, analysts, or journalists
in news reports are credible
and optimistic, you may decide to Hold the stock for another quarter to see if your
optimism is warranted. Return to the Alert screen and click “Hold.” If
you find no encouragement and remain in doubt, return to the Alert
screen and click “Sell.”
5) Repeat this process, sorting on the “Quarterly Trend Analysis.”
for Pre-tax Profit and finally for EPS.
6) When you have filled all of the blanks in the “Action” column, click
on “Reports” and print out your Defense Report to give you guidance when you contact your brokerage to follow through on your
“Sell” decisions.
176
Toolkit 6
The basis for making such a decision is the nature of the problem
that has caused the disappointing performance. The question that
must be answered is whether the problem is a transient one that is
within management’s capacity to handle, whether it’s a longer-term
issue that management is likely to be helpless to resolve, or whether
the problem is likely to last long enough that your money would be
better utilized elsewhere.
To Sell or Not To Sell
Toolkit 6 gives you all the tools you might require to learn what you
need to learn and make the final decision for the current quarter. The
mechanical steps are simple, but the judgments that result from
them are somewhat more subjective and a bit less intuitive. You do
not want to sell capriciously the stocks you worked so hard to select.
So long as it makes sense to do so, you will want to give them the
chance to correct problems that arise in the course of business. However, your own common sense is good enough to tell you whether the
problems besetting the company are serious.
If, after looking at what the company, analysts covering the company,
and the news reports and releases have to say about the problems,
you are still uncertain, the best advice is, “When in doubt, throw it
out!” Look at Sales first for two reasons. First, a downturn in revenue
will ultimately result in a downturn in profits and ultimately in earnings. If you can catch a trend before it reaches the bottom line, you
may be able to sell the company before other investors have reacted
to the decline in earnings that will follow and save yourself some
money.
Secondly, like a huge ship under way, it takes a strong force and a lot
of time to change direction. Sales are generally the most stable statistics, and the market for a product or service doesn’t drastically
change overnight unless there’s a significant reason. The impact of
the introduction of a competitive product or service—one that makes
the product suddenly obsolete—is the kind of thing that can cause a
dip in sales with long-term implications. Marketing gaffes, large-scale
catastrophes, a demoralized sales force—all can impact sales and
Toolkit 6
177
need to be analyzed to determine how well management may handle
them.
There are some things peculiar to various industries, of course. Companies whose businesses depend upon the weather or other unpredictable conditions are an example. Gas or oil sales can be off because of a mild winter, for instance. Next in importance is the percent
change of Pre-tax Profit, which would be the first indicator of a future
downtrend in earnings. More than a quarter period of decline in profits will nearly always result in a downtrend in both earnings and in
the stock price. It may well be a harbinger of things to come in terms
of the ability of the company’s management to sustain its previous
rosy rate of earnings growth.
The 12-months trailing earnings, and then the quarterly earnings, are
last in priority because it’s likely that the investing public will have
already reacted to that decline. By the time the problems have hit the
bottom line, it’s probably already too late to do anything but cut your
losses and get out.
The Quarterly Trend Analysis
When you first did your Stock Study you looked critically at the Pretax Profit as a percent of Sales (profit margins) in Section 2A. You
did so to see if the company’s management was managing its costs in
a fashion that would enable its growth in sales to be paralleled or exceeded by its earnings growth.
Now that you own stock in this company, your interest in the same
factors should be even keener since your money is now in the care of
that management team. The Quarterly Trend Analysis allows you to
see subtle, insidious downtrends that may not have alarmed you on a
quarter-to-quarter basis, but that, over time, might have aggregated
into a substantial decay in performance.
178
Toolkit 6
The Quarterly Trend Analysis data can give you a great deal of insight into the past behavior of the company if you have accumulated
sufficient data.
For example, looking at the trends in Sales, Pre-tax Profit, and Earnings, you should be able to see how much of the growth in Earnings
might have been caused by reduced taxes as opposed to increased
sales. You should be able to track the company’s performance during
periods when times were bad to see how successfully the management team led the company through the “thin” as well as the “thick.”
Perhaps you will be able to see instances of similar performance in
the past that can tell you how well the company has managed them.
A word of caution is in order. Needless to say, the further back in history you go, the less relevant is the information— recognizing that a
myriad of changes in the management team, the market, or the product line might have occurred in the intervening years. It may well
have been, for instance, that a change in management was responsible for a previous turnaround, and an entirely different set of factors
are taking a toll on this occasion.
Looking at the right side of the form will give you more significant data, because the sharp edges are smoothed by comparing the total of
four quarters, instead of a single quarter, with the same period in the
previous year.
Toolkit 6
179
Quarterly Trend Graph
Click on the pull-down menu to the left of the screen and select Quarterly Trend Graph.
Probably the most informative part of the Quarterly Trend analysis is
the graphic display of the percent changes and profit margins. Click
on the “Quarterly Trend Graph” button at the top of the Quarterly
Trend Analysis to display it. The Quarterly Trend Graph will open
with the Sales and Earnings Growth already displayed.
The Quarterly Trend Graph can display the percent change of any or
all of Sales, Earnings, Pre-tax Profit, or % Pre-tax Profit on Sales
(profit margins) on either a quarter to quarter or for the (annual) sum
of the quarterly trailing 12 month period. The % Pre-Tax Profit/Sales
displays the profit margins for each period. Selection of Sales, Earn180
Toolkit 6
ings or Zero Growth Lines permits you to compare actual performance with your expectations.
“Limit 50% Growth” restricts the display to 50% above or below zero
in order to make the graph more meaningful when wide variations occur. You may overlay a zero growth line or, better still, your expected
earnings and/or sales growth lines. This provides you with a graphic
depiction of the percent changes relative to the growth you had anticipated, and you can clearly see if, when, and how severely the actual
performance fell below your expectations.
Percent Change
This chart has been the source of considerable confusion for those
who compare it with charts showing the raw data. Remember, the
points on this graph represent percentages and are either the percent
change for a single quarter compared with its counterpart the previous year, or for the sum of four quarters, compared with a similar period the year before. You are analyzing the trends in those percentages and not in the data itself.
Print a Defense Report
On completion of the defensive process, you may print out a “Defense
Report” to chronicle the reasons for your decisions and to serve as a
reminder should you need to sell any of your holdings. You may access this as well as any of the other forms by clicking the “Reports”
button on the Alerts screen. For a more detailed description of the
Defense Report, see below.
Offense: Check Risk & Reward, Re-evaluate, Challenge
The offensive strategy may be applied at any time the spirit moves
you. It’s not nearly so urgent as is the need for defensive strategy because the companies in question not only are good companies that
are presumed to be performing at or close to your expectation, they
are those that the investing public is or has been rewarding by paying
a higher and higher price for their stock.
Toolkit 6
181
The consequence of leaving such companies in your portfolio is not all
that dire because they are fine companies and you aren’t likely to lose
money on them. The point is, however, you’re not likely to make money on them either! You should be especially alert for the need for this
strategy when the stock market is acknowledged to be in overvalued
territory. This is when that “rising tide that lifts all boats” is most
likely to produce companies whose stock prices are so overvalued as
to give you an excellent opportunity to capture the excessive gains
and put the money into as good companies whose stock prices have
yet to be pushed into overvalued territory.
If you follow this strategy diligently, you’ll never be caught in a bursting “bubble,” and your portfolio will be able to deliver its maximum
performance.
NOTE: Offensive strategy should not be implemented unless all of the
stocks in the portfolio have been subjected to and survived defensive
scrutiny. As with the Stock Study, decisions based on price are of no
value unless the Quality criteria are met. Companies whose fundamentals are sub-par will usually sell at lower prices and exhibit risk
and return values that appear seductively favorable. For this reason,
they will rarely appear as candidates for offense.
As with Defensive strategy, the portal to the offensive portfolio management process is the Overview window. This is best accessed by
double-clicking on the desired portfolio displayed on the Home Page.
Any portfolio requiring either offensive or defensive attention will be
shown in red in the Portfolio Report Card.
While you can readily analyze the “Total Return and “Reward/Risk
Ratio columns and see if any of your companies are approaching an
overvalued state, again, the easiest way to segregate those that exceed
your thresholds for risk and reward is to click on the Alerts button at
the top, left of the screen. As it did with defense, this automatically
takes care of the first step, “Check Risk and Reward,” when you do
so. All of the companies whose return is below and/or whose risk is
above your thresholds will be abstracted from your portfolio and displayed in the Offense grid.
182
Toolkit 6
Thresholds
It’s your choice as to how sensitive these thresholds should
be. If you wish to have every
company highlighted whenever
the new price drives it below
your desired 15% return or 1:1
Reward/Risk Ratio, you need do nothing. With prices as volatile as
they are, however, you may wish to pursue your offensive strategy only at the point when your companies’ potential return declines and/or
their risk increases to a more critical level, so as not to be bothered
with reminders unless there is a substantial opportunity to benefit
from a company’s replacement.
If so, you may reduce your thresholds to a more modest level in the
“Preferences” dialog, under the “Thresholds” tab. This will limit the
occasions when you’ll be advised that there’s an opportunity to upgrade your portfolio’s potential return.
In the Alerts screen, you also have the opportunity to set the threshold to a different value for individual companies if you wish. Just select the company and click on the Threshold button and you will be
able to do so.
It’s unlikely, unless the
market is experiencing another “bubble,” for more
than a few stocks to be in
the overvalued range. However, if there are enough to
produce a scroll bar on the
right side of the grid, you
may wish to rank the companies by clicking on “Total Return” to bring the stock with the lowest
return to the top of the list and work in that order.
Toolkit 6
183
Later on, if you wish to adjust the Target Return for a particular
company, you may also edit it in the Data Entry screen for that
stock.
Reevaluate
Starting with the company having the lowest potential return and/or
Reward/Risk Ratio, double-click on the line for the first company to
bring up its Stock Study.
Your goal in reevaluating this company is to bring your expectations
more into line with the company’s actual performance than with the
conservative and modest forecasts you made when you were considering purchasing the company. It’s certainly conservative to understate
estimated future performance when you contemplate buying a stock;
but, once you own it, you can afford to be a bit more aggressive in
your forecasts to avoid selling a stock prematurely. You certainly
don’t want to incur the cost of replacing a company when its current
performance can make you money. Of course, it goes without saying
that you don’t want to overstate current or expected performance either.
Is this company growing at a faster rate than you estimated it would?
If so, you might want to raise your estimate of future earnings growth
some. It’s probably not a good idea to raise it more than half-way between the estimate and its current performance. This will provide you
with a bit of a cushion should growth start to decline.
Next, turn the Stock Study over [Ctl+F] and look at your forecast for
the future High P/E in Section 4A. How does it compare with your actual high P/Es in Section 3? You may have capped it at 30 because
you know a higher multiple is not sustainable; but investors may be
paying as much as 40 times earnings or more. Again, you can raise
your forecast reasonably and modestly staying below the half-way
point or, perhaps, limiting yourself to an additional five points.
When you have finished with whatever reasonable alterations you are
comfortable with, save the Stock Study and return to your Alert window. Continue the process until you have reevaluated each of the
184
Toolkit 6
companies displayed. Some or all may have disappeared, in which
case the revised return and risk now meet your threshold requirements. If any Companies remain in the Offense grid, go on to the next
step.
Challenge
One of the most difficult tasks has been to select a worthy replacement for an overvalued company. You are admonished to pick a company to replace the overvalued one with one that is of equal or better
quality and that has a better potential return. This means its growth
and efficiency characteristics must be as good or better. In the past,
you had to maintain a watch list of stocks that might be suitable and
select one or another from that list to compare with the challenged
stock. This process has now been made simpler with the “Smart
Challenger”
Smart Challenger
To activate the Smart Challenger in
your Offense grid simply select the
stock you wish to replace and click
the “Challenge” button. (You can also invoke the Smart Challenger by
selecting a stock in the Portfolio
section of the Stock Library and
clicking on the Challenge button at
the bottom.)
In the dialog that appears, enter the
price you paid for the stock when you purchased it. (You may have to
answer some other questions if you didn’t do so when you created the
portfolio initially.)
You will now find the challenged stock listed and highlighted with all
of the other stocks in your stock library. Those stocks are ranked in
order of return so that all that appear above the challenged stock will
have greater return while those below will offer less.
Toolkit 6
185
To select an appropriate challenger, begin at the top of the list. Each
company is displayed with its industry, quality rating, total return,
sales and earnings growth, profit margin, and PTP Trend (actually the
trend in Pre-tax Profit Margins). If diversification by industry is important to you when you replace a stock, you can look down the list
until you find a company in the same industry as that which you’re
challenging.
186
Toolkit 6
Then check out the growth and other quality statistics to make sure
it’s of as good quality. If not, keep coming down the list until you satisfy that requirement. When you come to a company that looks promising and displays both superior, or at least similar, quality criteria
and has a better hypothetical return (which it will, so long as it is
above the challenged stock in the list), you may double- click on that
company to reveal the individual Challenger.
Here is where you can see the detail of your proposed replacement
transaction. Check out the Quality criteria at the top of the page.
Then note how long it will take for the replacement to outdistance the
return on the stock you are challenging. If the lines cross sometime
within the first couple of years, the chances are it would be a sensible
replacement.
Print an Offense Report
On completion of the offensive process, you may print out a “Offense
Report” to chronicle the reasons for your decisions and to serve as a
reminder should you need to replace any of your holdings. You may
access this as well as any of the other forms by clicking the “Reports”
button on the Alerts screen. For a more detailed description of the
Offense Report, see below.
The Portfolio Management Forms
Toolkit 6 provides all of the forms of the earlier versions and more.
These forms may be printed as a by-product of the process described
above. Below, you will find descriptions of the forms and of the portfolio management process using those forms.
Some will still prefer to continue to go directly to those forms to do
their work as they have in the past. We would not wish to take anything away from those that do. Whether you are one of those, or are
one who prefers to take advantage of the new processes in Toolkit 6,
you may still find something of interest in the following.
Toolkit 6
187
Portfolio Forms
To open any of the portfolio forms (Portfolio Review Report, Trend Report, Portfolio Summary ,
Defense Report, Offense Report, Sector/Industry Diversification, or
Company Size Diversification), click on the Reports button on either
the Overview or the Alerts windows.
They may also be selected from the pull-down menu
at the top, left corner of any of the other portfolio
management forms.
Portfolio Review Report
The Portfolio Review Report has been the basic
portfolio management tool—your first line of defense against loss.
With it, on a quarterly basis, you can do as many professional security analysts do and monitor the actual operation of the companies
you have chosen—not simply the movement of the price of their
stock. To be successful, the investor must watch the trends in all of
his company selections to spot the early warning signals that such
problems may be imminent or already exist. This is the main objective
of the Portfolio Review Report.
Defense
The Portfolio Review report is the first defensive weapon in your portfolio management arsenal. It is essentially a Stock Study summary
for each of the stocks in your portfolio. And, like the Stock Study, it
deals with both the quality issues and the value issues. It is upon the
quality issues that the defensive value of the Portfolio Review Report
relies. And it is the defensive
function that carries with it
the greatest urgency since defense entails protection from
harm and against loss.
Columns F through O (5th
through 8th) represent the
188
Toolkit 6
heart of the Portfolio Review Report. They reveal, respectively, the
percentage difference in quarterly earnings per share, quarterly pretax profits, quarterly sales, and the trailing 12-months’ (TTM) earnings per share over the same figures for a year ago.
Offense
Where defense is required to prevent loss, offense is the part of the
game that wins it. So it is with the offensive side of portfolio management.
Offensive portfolio management deals with the value side of the Stock
Study--the right side of the Portfolio Review Report. Remember, when
we discussed the Stock Study, we made the point that “the worse a
company performs, the better a value it will appear to be.”
So it is with the Portfolio Review Report. Again, don’t be seduced by
what you see on the right side of the form if the left side, which deals
with the quality issues, has revealed less than desirable performance.
The key columns to look at here are the columns labeled “Reward/Risk Ratio” and “% Compounded Annual Return.” These will
tell you if an otherwise good quality company continues to show the
potential you looked for when you bought the stock and if the risk
you must take to realize it is realistic.
You have presumably taken the trouble to set up portfolios and to assign your stocks to them. If not, see the “Managing the Stock Library”
section for detailed instructions on setting up your portfolios. The
Portfolio Review alerts you when the numbers fall outside of the normal range:
Toolkit 6
·
The EPS, Sales, Pre-Tax Profit and Trailing 12 months EPS will
be pink if their growth rates are less than the estimated
growth rates EPS.
·
The Rwd/Rsk (Reward/Risk) Ratio will be pink if the ratio is
less than 3 to 1.
189
·
The RV (Relative Value) will be yellow if the RV is less than 80
percent or higher than 150%.
·
% Compounded Annual Rate of Return (Total Return) will be
yellow if it falls below 10%.
The date when the stock price was last updated will be in red if it is
more than seven days old.
View the Big Picture
Each company should be viewed in the context of the entire portfolio,
for slight downturns in quarterly performance are far less significant
when most of the companies have had a similar story, as might happen in a recession. Companies that stand out among the rest should
be noted— whether their performance is more or less favorable than
the others.
It follows, then, that the Portfolio Review Report is also useful as a
tool to assess the economic climate as well as to look for individual
companies whose performance is noteworthy.
Be a Contrarian
A third and no less important function of this tool is the converse of
its primary job. That is to confirm your contrarian judgment when the
market is giving one of your companies a bad time. When all of the
Portfolio Review indicators tell you that the company continues to be
strong, to perform as you expected, but the price is going down, you
can smile smugly and buy some more.
Portfolio Trend Report
The Portfolio Trend Report was developed to serve a particular purpose not contemplated before the arrival of the computer on the fundamental investment scene.
Because the value of the Portfolio Review Report lies in analyzing
trends, it stands to reason that it would be most valuable to view two
190
Toolkit 6
successive Portfolio Review Reports at the same time. The Portfolio
Trend Report permits you to view the “trend of the trends.”
Where the Portfolio Review Report lists the actual quarterly and annual data to permit easy calculation by those who do it manually, this
is unnecessary in the computerized version (although all of the data
is displayed on the Portfolio Review Report). However, the results may
be somewhat cluttered and difficult to see.
The Portfolio Trend Report eliminates the actual data from the listing
and clearly displays only the percent changes between the current
quarter and the same period a year ago. This information is on the
top line for each company. On the second line is the same information
for the previous quarter, comparing it with its counterpart the year
before. This allows you to spot quarterly and/or annual performance
that has not met your expectations for two consecutive quarters—
a great deal more significant than the results of a single quarter.
Toolkit 6
191
The Portfolio Trend Report may be sorted on most of its columns, as
may the Portfolio Review Report. The Portfolio Trend Report is a call
to action! Where one bad quarter noted in the Portfolio Review Report might raise the warning flag, two in a row demand that you find
out the cause.
Two negative or significantly sub-standard quarters should compel
you to research the problem to find out whether the cause of this poor
performance is something transient, or long-term. Use the convenient
capabilities of Toolkit to do your research using the Internet.
Additional Data
Along with the view of the changes, you will see some other information on the Portfolio Trend Report that, while not quite so important as the basic data, is nevertheless useful:
Estimated E/S Growth: This is taken from your completed SSG, to
help you match up what has happened historically with the judgments and calculations made in the stock study.
Projected Average Return (PAR): Total return if the stock is purchased at today’s price, is sold in 5 years at the Average
P/E, and it pays the estimated average dividend yield.
Total Return: The total of the return if the stock is purchased at today’s price, is sold in 5 years at the Average
High P/E, and it pays the estimated average dividend
yield.
SMG Recommendation: This report will display the
“Stock Management Guide” recommendations in the
last column.
Diversification
One of the four basics of sound investing—and the purely “defensive” one—is that the portfolio should be adequately diversified both in terms of industries and in
192
Toolkit 6
terms of size of companies. Toolkit 6 provides a helpful tool for analyzing that aspect of your portfolio. The Portfolio Trend Report displays columns for the number of shares of each stock held in the
portfolio, the dollar value of each holding (for current and previous
quarters), and the dollar-weighted percentage of the total portfolio
represented by each.
Where in the past, many have tried to appraise their portfolios’ diversification by looking at the stock list and counting only how many
stocks are in a particular category, you may now measure true diversification. By that we mean the percentage of your portfolio’s total
dollar value that is devoted to each holding.
By Industry
To take a good look at your diversification by industry, “Sort Down”
your report on the “% of Portfolio” column and see which positions
occupy the largest percentage of your portfolio. There are a number of
industry sector breakdowns that may be used to group the host of industries represented in the stock market. Many brokerages and data
providers use broad category breakdowns that you could adopt. Or,
you may come up with yet another that pleases you. Generally, the
most effective groupings are those that segregate the industries by
groups that are not similarly affected by the business cycle, or the
ups and downs of the economy. Suffice it to say that you should select a sector breakdown that makes sense to you.
Theoretically, you should have a roughly equal percentage of your investment in each of the industry sectors. If you are heavily overloaded
in any single industry or sector—no matter how well it appears to be
behaving at the moment— you are probably vulnerable. It may pay
you to explore more aggressively the possibility of selling a portion of
a holding whose great success has already caused it to represent a
very lopsided portion of your portfolio. In any event, by ranking your
percentage of portfolio column from largest to smallest, you can get a
much clearer picture of your diversification situation and act accordingly.
Toolkit 6
193
By Size
It is recommended that you strive for roughly 50% of your portfolio to
be in medium sized companies with the rest split between larger and
smaller. The Portfolio Trend Report provides you with a simple tool
to monitor this diversification.
At the bottom of each page of the report, to the left of your portfolio
dollar total, you will find a breakdown of the percentage of your dollars that are invested in “Small,” “Medium,” and “Large” companies.
You will also find a figure that represents the total value of your portfolio. While there are many accepted ways to determine size (e.g. market capitalization, revenues, net profit, etc.), Toolkit 6 uses a very
simple method that is about as good as any rule of thumb.
Any company whose annual sales figure (found in the Portfolio Review Report) between $500 million to $5 billion is considered a “Medium” size company. Those with fewer are considered “Small” companies, those with more are considered “Large.”
Portfolio Summary Report
Toolkit’s philosophy is to “buy and hold”—and the occasions when
you would be likely to sell due to a high price are rare. For that reason, the Stock Management Guide’s greatest value will most often
be found in its ability to flag opportunities when you might consider
adding to an existing position.
194
Toolkit 6
The Portfolio Summary Report is based upon the information that
the Stock Management Guide provides. While not nearly so significant as a “defensive weapon” or portfolio management tool, it is nevertheless an important and useful feature of Toolkit.
Essentially, the Portfolio Summary Report is a list of the companies
in your portfolio(s)—or your Stock Library—and Stock Management
Guides current assignment to their respective “Buy,” “Hold,” or “Sell”
zones. Going down the “Rec” (Recommendation) column, the “Sells”
and “Buys” are marked. The “Holds” are not. The data provided is
very useful. And it can serve as a veritable “shopping list” of stocks in
which you are interested that meets the qualifications for purchase or
possible sale.
In addition to the name and ticker symbol, the report offers the following information, which is important to consider:
Date: The date the stock was priced
Price: At your last price update
P/E: The Current P/E
Relative Value: the Current P/E compares to the Average P/E
Reward/Risk: The reward to risk assessment
Toolkit 6
195
Buy Below: The top of the “Buy” range
Sell Above: The bottom of the “Sell” range
Recommendation (Rec): An assessment of whether the price and
P/E qualify the stock for possible addition to your portfolio or an
overvalued condition that might suggest selling. (See the discussion of
these criteria in the Stock Management Guide section.)
A “Buy” recommendation is flagged (*) when the Reward/Risk ratio is
less than 3 to 1. (This source of confusion will only appear if you
override the default in the Preferences > Stock Study tab and use
33-33-33 ranges.)
The Portfolio Summary is an especially popular and useful report for
an investment club. Extremely versatile, it can be edited in Toolkit,
then copied and pasted into any number of writing or email programs
for distribution.
196
Toolkit 6
Defense Report
The Defense Report is provided as both a reminder of the reasons for
defensive “sell” decisions and the “hold” and “sell” status of our portfolio to help when you contact your broker to execute the trades required to implement your defensive strategy.
The form displays all of the stocks in your portfolio, highlighting those
that failed to meet or exceed your threshold when comparing the fundamental performance with your expectations. For each company,
you will find the quarterly data on the upper line and the data for the
trailing twelve months on the line beneath.
Toolkit 6
197
Displayed with the name, company ticker symbol, and quarter ending
date, are the same items displayed on the Defense grid in the Alerts
window:
·
forecast sales growth.
·
actual percent change between sales this year and last.
·
the percent by which actual sales growth differs from expected
growth.
·
forecast earnings growth.
·
actual percent change between pre-tax profit this year and last.
·
the percent by which actual pre-tax profit growth differs from
expected earnings growth.
·
actual percent change between earnings this year and last.
·
the percent by which actual earnings growth differs from expected growth.
·
Action: “sell” or “hold”—If the “Action” is blank, it means the
stock did not fall below the defensive threshold and is a “hold”
by default. “Hold” or “Sell” represents a conscious decision to
do either.
Offense Report
The Offense Report is, like the Defense Report, an abstract of the
Value parameters on which you base your judgment that a stock is
overvalued. With the company name, company ticker symbol, and
quarter end date, there are columns for Relative Value, Projected Relative Value, Reward/Risk Ratio, Total Return, the Target Return, and
the Action to be taken, if any. Again, it lists all of the companies in
your selected portfolio and highlights those whose reward is less
than, and/or the risk more than, the thresholds you have set for
198
Toolkit 6
those measurements. Thresholds that are company-specific will be
shown in blue.
As in the case of the Defense Report, Assuming you have followed
the process as described above, “Hold” or “Sell” represents a conscious decision to take that action. Companies not marked in the “Action” column were either not eligible for replacement as overvalued or
simply not acted upon when they should have been. This report is
useful as a reminder of the reasons for any “sell” decision you might
make and as a “to do” list when you contact your brokerage.
Sector/Industry Diversification
The Sector and Industry Diversification Report allows you to see if
your portfolio is well balanced in a quick glance. This report quickly
shows you if you need to diversify your portfolio or if you own too
many shares or companies in a particular sector or industry. Spreading out your holdings in many different sectors and industries helps
to protect your portfolio from disasters -- remember the 1999-2000
tech sector meltdown?
Toolkit 6
199
The report is divided into different sections for each Sector of the
companies you hold in your portfolio, with the subdivisions indicating
their respective Industries for each holding. The Sector & Industry
Diversification Report, along with the Company Size Portfolio Diversification Reports, are a great way to analyze how your portfolio
is shaping up. If your portfolio is over-balanced in a certain industry,
or is holding way too many large company stocks, these reports will
make it obvious.
Company Size Diversification
The Company Size Diversification Report classifies your portfolio's
holdings by the size of the companies. Sound portfolio management
practices include diversifying your portfolio among companies of varying sizes, allowing you to take advantage of the stability of larger
companies with the faster growth of smaller firms.
"Size" is measured by a business's revenues for the previous twelve
months. A small company has revenues less than $500 million a year
and a large company's revenues are greater than $5 billion a year
(and, naturally, a mid-sized company is in between). Common guidelines suggest that people invest 50% of their portfolios into mid-sized
companies, 25% in small, and 25% in large company stocks. The
Company Size Diversification Report takes this one step further and
adds Micro and Mega categories to further help you refine your diversification target. Micro companies have revenues less than $100 million a year, and mega companies are the behemoths with revenues
greater than $15 billion a year.
200
Toolkit 6
Printing Your Portfolio Report Forms
With any report or form displayed, simply
click on the printer icon (or select File >
Print) to bring up the printing dialog.
Select the form or forms you wish to print
and click “Ok.”
Toolkit 6
201
Company Forms
All company forms may be accessed by selecting them from the pull-down menu at the
top of any other company form (Stock Study,
Stock Management Guide, Quarterly Trend,
or Annual P/E Analysis) or by doubleclicking on the company’s line on the Portfolio Review Report, Trend Report, Defense, or
Offense Report.
Stock Management Guide
The information on the Stock Management Guide was originally
conceived to serve a single, simple purpose. It was to tell an investor,
after he or she had posted a new stock price, whether that stock
might be considered a “Buy,” a “Sell,” or simply a “Hold.”
With the advent of the computer, it is no longer necessary to examine
the graph on the back of the form to see whether the stock, with the
latest price update, meets the Stock Management Guide’s criteria to
be considered a possible “Buy,” “Hold” or “Sell.” The calculations are
done automatically, as soon as the price is entered, and the results
are accessible in several places in Toolkit.
A secondary purpose was the graphical display of the historical
trends in the stock’s price and P/E movement. Investors should not
consider the movement of prices and/or P/E Ratios when making a
decision to buy or sell. Nevertheless, the fact is that, on rare occasions, a stock may be so overvalued that it might make sense to sell
some of the position.
202
Toolkit 6
Toolkit 6
203
204
Toolkit 6
Once again, the computer has added value to what was once a secondary purpose, and the ability to study the graph of P/E and price
movement in conjunction with the Quarterly Trend Analysis has
made this tool much more useful.
Specifically, the Stock Management Guide criteria for considering
selling are three in number:
·
The price is in the Stock Study’s “Sell” range,
·
The P/E is at least 150% of the 5-Yr Average P/E (a Relative
Value of 150%)
·
The Projected EPS Growth Rate is less than 12%
The two criteria for considering buying more are:
·
The price is in the Stock Study ‘s “Buy” range, and
·
The P/E is at or below the 5-Yr Average P/E (relative value of
100% or less). Otherwise, barring some adverse change in the
fortunes of the company, it is probably prudent to continue to
hold the stock.
Note that there is no mention of Reward/Risk Ratio in the “Buy” criteria. Yet we know that one of the most important issues in considering
a “Buy” is the risk versus reward.
If you have changed the price ranges to default to thirds, this form
can signal a “Buy” with the Reward/Risk Ratio as low as 2 to 1. By
retaining the default ranges in Preferences to 25%-50%-25%, you will
have assured yourself that any stock that shows in the “Buy” range
does indeed have a Reward/Risk Ratio of 3 to 1 or better.
The computer not only takes all of the drudgery out of performing the
calculations and plotting the data on the form, it provides new ways
for the results to be displayed. Whenever a price is updated—whether
manually or electronically—Toolkit 6 does all of the calculations nec-
Toolkit 6
205
essary to determine if a stock fits in either the “Buy,” “Hold,” or “Sell”
category according to the SMG.
The moment the price is updated, the Stock Management Guide
recommendation, based upon the criteria above, is posted in three
places:
1) Price Update Screen (where you update the prices manually or electronically),
2) Portfolio Trend Report, and
3) Portfolio Summary Report (“Summary” in the Portfolio
Review—Portfolio screen).
Quarterly Trend Analysis
Because the Quarterly Trend Analysis and its companion graph are
included as an integral part of the portfolio management process, it
has already been discussed earlier. Its utility in discerning longer
term trends, especially when viewed graphically, makes the job of
identifying potential long-term problems easier.
Annual P/E Analysis
Annual P/E Analysis records the past fundamental data in exactly
the same way as Section 3 of the Stock Study, only it provides a tenyear history of EPS, Price Ranges, P/E Ratios, Dividends per Share, %
Payout, and % High Yield.
This is a valuable form because it is the only form on which ten years
of Price Earnings Ratios may be viewed. The bubble and bust around
the end of the twentieth century illustrated dramatically that business cycles don’t necessarily hold to five years, give or take a year or
two. The Stock Study provides only five years of recent history on
which to base a determination of what a “normal” or “signature” P/E
should be; and, given the aberrations during the market upheaval, it’s
obvious that you can get a better “feel” for the average price of a dollar’s worth of earnings by looking at a ten-year span.
206
Toolkit 6
Toolkit 6 now permits you to eliminate P/E Ratio outliers reaching
back ten years to see the relevant averages of the remaining data. You
may do so by clicking in the appropriate boxes. No entries are required on this screen. The Toolkit automatically transfers data from
Company Data screens and completes all necessary computations.
When there is insufficient data to compute a 5-yr average, Toolkit averages the years available.
Annual P/E Analysis is useful in looking for significant changes in:
EPS: The amount of net income (after taxes) attributable to each
share of common stock outstanding. A low or declining figure could
signal problems with inefficient management, too many fixed obligations, or heavy investment in research and development. Negative
earnings indicate a company is losing money; shareholder equity is
being used to keep the company operational. Declining earnings per
share can signal a decline in profitability or an increase in the number of shares outstanding.
P/E Ratios: The relationship between earnings and the price that
people are willing to pay for every one dollar of earnings that a company has. They are a measure of investor confidence (or overconfidence) in a company. Past P/Es may provide clues as to what can be
expected in future P/Es. Also referred to as the multiple, it is the
price divided by the common stock earnings per share. Typically, the
higher the price-earnings ratio, the riskier, more volatile the investment. Older, safer, more mature companies have lower price-earnings
ratios than do young, faster-growing, riskier companies, since investors are willing to pay a higher premium for faster growth rates.
5 Year Average P/E Ratios: The rolling five years’ average of
High/Low P/E Ratios. When there is insufficient data to compute a 5year average, Toolkit averages the years available. Elimination of outliers will affect these values.
Dividends/Share
Dividends are the per share distribution made, out of retained earnings, to stockholders in the form of cash or stock.
Toolkit 6
207
% Dividend Payout: A measurement of the percent of earnings per
share returned to investors as dividends. Increased payouts may signal a transition from true growth (earnings retained for future
growth), to a more mature phase (an increasing portion of earnings
distributed to stockholders) due to less need for expansion or working
capital. The 5 Year Average % Payout is the rolling 5 years’ average of
% Payouts.
% High Yield: (Not used if there are no dividends) Reflects the dividend per share divided by the low price for the year. Significant
changes in yield should direct your attention to any trend in the low
price or dividends per share.
High/Low Price Range (Annual): Look for volatility, not only year-toyear, but high-to-low as well. Stocks with wide swings between high
and low prices are less predictable and may be of greater risk.
Printing Your Company Forms
With any company form displayed,
simply click on the printer icon (or
select File > Print) to bring up the
printing dialog:
Select the form or forms you wish to
print and click “Ok.”
The ASCII Report button provides
you with the option to print a text
file that contains a stripped-down
version of the forms with no
graphics. This can sometimes be
useful for emailing the results of
your analysis.
208
Toolkit 6
USING TOOLKIT 6: HOW
YOU DO IT
Working with the Software
The following sections deal exclusively with how to use Toolkit 6 and
contain little information concerning the “what’s” and “why’s.” As you
make use of the following information, should you find that you are
interested in more detail about making the decisions that these steps
implement, you will find references to the sections in the “What and
Why” portion of the manual where you may find further information.
These “How to” steps are recommended for the first time user, but
others will wish to use this section as a reference. Those upgrading
from Toolkit Version 5 may wish to review the “What’s New” listing of
new features and functions. (See “There’s Lots New in Version 6” located within the Introduction).
A Review of Conventions
Click: Tells you to click the left button on the mouse to select a command or function.
Double-click: Tells you to click your left button twice, rapidly, on the
selection.
Right-click: Tells you to click using the right mouse button.
Toolkit 6
209
Buttons, Keys, Screens, Windows, and Sections of the
Manual
Button names are enclosed in quotes and are in bold type—for example, click on the “Ok” button.
Keyboard keys are enclosed in brackets as well as being in bold
type—for example, Press the [Enter] key.
Windows or screens are referred to using bold type—for example,
open the Company window and access the Data screen.
References to a section of this manual, the name of a form or a
section of a particular form are written in bold type—for example, Review the About Investing or the Stock Study section of the manual.
Navigating
Navigate between entry boxes using the cursor, pressing the [Tab]
key. To move back, press [Shift] + [Tab] to move from right to left,
bottom to top.
Basic Navigation
The Stock Study is the primary view of a company and is found on a
company screen. In the company screen, you may also look at the
company’s Data.
To access the other forms/views, select the
form from the drop down list.
NOTE: When viewing a form, move your
cursor over the form navigation drop down
list to select that form’s alternative view
(e.g., “Stock Study Back”).
To change the size of your display:
210
Toolkit 6
1) Click on the button
on the Company Toolbar.
Either enter a desired percentage and then click the
[Enter] key, or select a preset percentage from the dropdown menu.
To access context-sensitive help:
or the [F1] key. In many areas of the program cursor
Click on the
help is available. To display it, rest your cursor over the area in question for about two seconds. A small information box will appear. Moving the cursor will remove it.
Cursors
In addition to your normal cursor, the following cursor formats are
used in Toolkit:
The cursor enlarges to indicate that a click will do something. It
usually takes you on to some other view or magnification of view
for data entry.
or
indicates that clicking will remove or restore something.
or
indicates that you may sort in ascending or descending order respectively.
indicates that you can take a closer look at an item. (Clicking on
the item opens a graph, for example).
Keyboard Shortcuts
In addition to using the cursor and/or mouse, certain screens may be
accessed by pressing a combination of keys.
Open Company
Toolkit 6
[Ctrl + O]
211
Flip the page
[Ctrl + F]
Company Data
[Ctrl + D]
Stock Study (Front)
[Ctrl + F1]
Save
[Ctrl + S]
Print
[Ctrl + P]
Data
With the availability of data services from BetterInvesting and
StockCentral.com, computerized stock analysis is easier than ever.
But the ability to access up-to-date, quality data from the Internet
with the click of a button, and at a price that all could afford, has
brought out the best in the software.
Setting Up Data and Price feed information
Properly set up in Toolkit 6, a simple mouse-click will import or update the data without your even being aware that you are accessing
the Internet.
1) Subscribe to the StockCentral.com service from ICLUBcentral at
www.stockcentral.com, or the BetterInvesting Stock Data Service at www.betterinvesting.org While there are some differences
in price and web site features, both services use the same data,
and will give the same results in Toolkit 6.
2) Regardless of which service you choose, make certain to note your
user name and password.
3) In Toolkit 6, select Preferences > Data Feed.
4) Enter your username and password for your StockCentral.com
or BetterInvesting data feed subscription. If you subscribe to
both data feeds, you may enter your username and password for
both in the boxes provided.
212
Toolkit 6
5) Below the username and password boxes is a radio button selector to choose which data subscription to download company data
from.
6) After choosing which data feed you will use, Toolkit 6 also now offers the option to use prices take directly from Yahoo!, with a 20
minute delay, or from StockCentral using end of day prices.
Toolkit 6
213
Note: Only one data feed can be active at a time. Some Toolkit 6 extras (such as the Roster of Quality portfolio) are only available to subscribers to StockCentral.com.
Manual Data Entry
With Version 6 of Toolkit, we recommend that you subscribe to and
use ICLUBcentral’s StockCentral.com Data feed. Many advanced
features of the new Toolkit assume its use. However, what follows is
for those who wish to enter their data manually from some source
such as Value Line or Standard & Poor’s tear sheets. Details for data
entry are provided under “Stock Study” below, however the information to be gathered for both is essentially the same.
Shown below are the Value Line and the Standard & Poor’s pages
showing the data items used to manually complete the Stock Study.
(See the “What and Why” section for a discussion of the differences in
data and data sources.)
214
Toolkit 6
Value Line
Toolkit 6
215
Standard & Poor’s
216
Toolkit 6
Evaluation and Acquisition
Stock Study
Acquiring/Entering Data
The first step in completing a Stock Study (Stock Study) is to obtain
the required historical company data. For a full explanation about the
types and sources of data, see “What and Why....”
Using Subscribed Data
Once set up, assuming you have a “live” connection to the Internet,
the easiest way to access the data for a company is to enter either the
ticker symbol or name of the company in the appropriate field at the
left end of the main toolbar.
If you do not have the company already in your database, Toolkit 6
will import the data instantly, presenting you with an open Stock
Study awaiting your judgment. If you do, Toolkit will use that data to
open your Stock Study.
NOTE: You have the option in Preferences > General, at the bottom
of the screen, to bypass the search of the existing database and go directly to StockCentral.com data on each request.
Another way to access the StockCentral data is to click
on the “Stock Study” button on the Main Toolbar.
Toolkit 6
217
To begin a new Stock Study click the “Stock Study” button on the
Main Toolbar. This opens the “Stock Study—Acquire Data” screen,
which offers five sources for your data.
Subscribed Data
The “Use Subscribed Data” button is used to import data from a
*.SSG data file, such as from a paid subscription for ICLUBcentral’s
StockCentral.com).
Toolkit will automatically import the data from the data file location
you specified in your Preferences > Data Feed screen. (If you did not
set this preference, see “Setting up Data and Price feed infomation”
above.)
218
Toolkit 6
1) Click on the “Use Subscribed Data” button to open the “Company
Locator” screen.
2) Company Locator—Using the “type ahead” feature, begin typing
in the “Ticker” symbol or the company name. As you type, Toolkit
will sort and reduce the list, until you locate your company. You
can also sort by the different column headings, such as ticker,
company, or industry. To sort by the column heading, just place
your cursor on the heading (Ticker, Industry, Company, Exchange) and, when your cursor changes to a small down arrow (È),
click to sort. Then you can scroll down the list to look for the company. After selecting a company, click either the “Retrieve” or
“Use It” button to import the data and open the company’s Stock
Study.
NOTE: If you haven’t set up a data subscription, or you have entered
an incorrect username and/or password, you will be greeted with this
message which will allow you the opportunity to correctly enter the
required information to access your account.
Toolkit 6
219
Opening a Saved Stock Study
1) To open a previously saved Stock Study, first click the “Stock
Study” button on the Main Toolbar. This opens the “Stock
Study—Acquire Data” screen.
2) Click on “Open a company that was previously saved in Toolkit.”
3) Accept the default “Stock Library” or select a different portfolio in
the “Portfolio” dropdown list.
4) Click on a company name and click “OK” (or double- click on your
selected company) to open it.
NOTE: You may quickly find the company in a long list with the “type
ahead” feature. As you type in the company name (or any word in the
company name), Toolkit will sort and reduce the list until you identify
220
Toolkit 6
your company. Or, you may scroll down the list by clicking on the
scroll bar.
Importing Data from a Floppy Disk or Folder
1) To open an existing Stock Study that isn’t already in Toolkit, first
click the “Stock Study” button on the Main Toolbar. This opens
the “Stock Study—Acquire Data” screen.
2) Click on the “Import a data file located on a floppy disk or in a
folder on my computer” button to import either an ITK, SSG or
ICF data file for a company. This is normally used when you want
to look at a company data file that someone either sent you as an
e-mail attachment, or gave you on a floppy disk. This opens the
“Locate the file you want to import” dialog box.
zz
3) Select the type of file (ITK [Toolkit 4—6], SSG, or ZIP [contains
both a *.SSG file and a *.TXT file of your “Notes”].
4) If you know where on your system the file is located, navigate to
that location, e.g., an ITK file on your Desktop. The type of file you
select will appear in the right pane if that type of file is at the location you navigated to. If the file was e-mailed to you as an attachment, click on the “Look in My E-mail Attachments” button to locate the selected type of file you received as an e-mail attachment.
Toolkit will automatically go to your email’s attachment folder at
the location you specified in your Preferences screen, e.g., a *.SSG
file in your Eudora Mail\Attach folder, or AOL\Downloads folder.
The type of file you selected will appear on the right if that type of
file is in your e-mail attachment folder.
Toolkit 6
221
5) Click on the file to select it and “OK” to open it.
NOTE: If you did not set this up in your Preferences screen, then the
first time you click the “Look in My E-mail Attachments” button, a
“Select your E-mail Attachments” screen will appear. Navigate to
your data file location to set up the future default path.
6) You may also click on the “File Finder” button to search your
computer for the selected type of stock analysis file (ITK, SSG,
ZIP). This will open the “Find Company Data File” dialog box
where you can click to select one of the options under “Select File
Type to Search For” (ITK, SSG, or ZIP).
7) If the file is not located on your “C:\” drive, then click on the
“Drive to Search” drop-down arrow q to select another drive on
your computer, e.g., your “D:\second hard drive.”
8) Enter the company’s ticker symbol in the “File Name” box and
click “Find All” to run the search.
222
Toolkit 6
NOTE: Most SSG files use the company’s Ticker symbol for the file
name. Do not enter file type extension (ITK, SSG, ZIP) after the Ticker
symbol.) If the search does not locate the file, try selecting a different
file type (ITK, SSG, or ZIP).
TIP: To find data files for all companies of the selected file type (ITK,
SSG, or ZIP), do not enter anything for the Ticker symbol. The result
of the “File Finder” search will appear in the pane below with the
path to their location. Just click on the file to select it and click “Import” to open the Stock Study.
Importing More Than a Single Company
If you want to import an entire portfolio or list of companies rather
than to import one at a time, you may do so.
Toolkit 6
223
Select File > Import Company > Import Several at Once > Subscribed data source.
This will bring up the Import Data File dialog box.
The easiest way is to enter the ticker symbols one at a time. When
you enter a ticker symbol, Toolkit will instantly look for the company
whose ticker symbol most closely matches what you have typed. As
you add letters, it will continue to look for a match and may well find
your company before you have entered the entire symbol.
224
Toolkit 6
If you are unsure of a company name or ticker symbol, you may click
on the “Company Finder” button to retrieve the ticker symbol of the
company you’re looking for. When you have found the company
you’re looking for, clicking “Use it” or the “Retrieve” button will enter
the company in the list you are creating.
Use the down-arrow to record the company in the list and move on to
the next. To erase a company, delete the ticker symbol. When you
have finished entering your list, click “OK” to import them all. No
Stock Study will open in this case. All of the companies’ data is
saved directly in the database.
List of Ticker Symbols
You may have created a list of ticker symbols using other software.
Some screening products produce such a list in text file format (.txt).
Or, you may have created it yourself in some other fashion. You may
import this list by clicking on the “Import Ticker List.”
Toolkit 6
225
Navigate to the text file containing the list, select it, and click “Open.”
All companies will be displayed in the dialog as though you had entered them one at a time.
If you care to, before hitting the “Ok” button to import your list, you
may look at a small image of the Visual Analysis graph of your companies. Select a company and click on the “Quick View” button to do
so.
Manual Data Entry
If you wish to enter the data manually from Value Line, S&P or some
other source, click on the “Manual Data Entry from a data source
226
Toolkit 6
such as Value Line or S&P Stock Reports.” On the Stock Study Acquire Data window
Navigating Data Entry Fields:
1) Click on the space into which you want to input data.
a. Use the [Tab] key to move Left to Right through the fields
b. Use [Shift+Tab] to move Right to Left.
2) Drop-down menus open with a click on the menu arrow.
3) Use the [F1] key (or click on
to open the Help file
Basic Data Entry Screen
As on the regular SSG, areas in green are required to be filled in, for
the ssg to be complete.
Toolkit 6
227
Annual Data Entry Screen
Click on the “Annual Data” tab to access the Annual data entry
screen and continue to enter the data from your data source.
Quarterly Data Entry Screen
Click on the “Quarterly Data” tab to complete the data entry.
228
Toolkit 6
Stock Study—Analyzing the Company
Getting Started
If you entered the data manually or imported a single data file, your
company will open to the front page of the Stock Study. If you imported the data electronically for more than one company:
1) Click “Stock Study” on the Toolbar.
2) In the “Stock Study—Acquire Data” box click the
“Open a company that was previously saved in Toolkit.”
3) Select a company from those shown in the dialogue box.
Adjusting the size of the form
1) Click on the button on the Toolbar.
Click on the drop-down menu to select a percentage or enter
your own choice of enlargement or reduction percentage.
Toolkit 6
229
The default value is 110%, which will usually fill your screen from
side to side and make it necessary to scroll only vertically. This is the
best size for reading the text and numbers on the form.
Before You Begin—First Impression
When you download a new stock or open an existing stock that does
not have a completed judgment the First Impression screen will appear. The purpose of this screen is to give you an initial view of the
stock. The First Impression shows you the Current Price, the Buy
Price (if applicable), Quality Rating (If you are using a StockCentral
data subscription), and the Mood Indicator.
230
Toolkit 6
The First Impression also gives you the opportunity to fill in all the
required judgment items with Toolkit default values. This allows you
to view a completed Stock Study in mere seconds. To apply this
judgment, click the “Show me Toolkit’s Judgment” button. To input
your own judgment values manually, click the “Enter my own judgment” button. Using Toolkit default judgments allows for a conservative first look at a new company, before you invest time making manual judgments. You are also able to manually edit the default judgments as you wish, to fine tune the default values to values more in
line with your personal judgments.
Section 1—Visual Analysis
Toolkit 6
231
Customizing the Chart
The Section 1 graph may be customized by using the Visual Analysis
screen. To access the Visual Analysis screen, click the “Adj. Graph”
button on the Toolbar or click anywhere within the graph area. The
graph area will “zoom” to allow you to see the full screen with the
graphic depiction of up to ten years of your company’s historical data
and five years for your sales and earnings projections. You may move
the window by clicking in the title bar and dragging it wherever you
wish. You may also size the window by clicking and dragging any corner or edge of the window. You have a great deal of flexibility with this
window. Once having set it, it will always take the same shape and
position until you change it once again.
Cursor Pop-up box: A pop-up information box, containing the actual
value for each point, appears when you rest your cursor over a data
point.
Arranging Lines: To arrange the growth lines on the graph, click and
hold the mouse button to drag the line up or down. The lines are color coded to match the colors of the growth lines:
S = Sales (Green line)
P = Pre-Tax Profit (Magenta line)
E = EPS [Earnings per Share] (Red line)
The Black vertical bars are the Price Bars.
In addition to the values listed above, Toolkit 6 now adds the ability
to display additional metrics on the Stock Study front page. At the
top left of the Visual Analysis is a new legend labeled “Additional
Graph Data” that shows six additional data points that are relevant
when viewed on a semi-log graph. Place a check mark in the box next
to any item you would like to display on the front of the Stock Study.
(NOTE: This will only affect the currently viewed company.) The additional items that can be added are:
232
Toolkit 6
O = Shares Outstanding (Light blue line)
D = Dividends (Light green line)
B = Book Value (Black line)
N = Net Income (Orange line)
C = Free Cash Flow/Share (Lavender line)
L = Long-Term Debt (Red line)
At the top of the “Visual Analysis” screen are buttons for:
Growth Estimates: Opens a dialog box where you can enter your estimates of future sales and earnings growth and access the RevenueBased EPS Estimate to further corroborate your estimates.
Analysts Est.: Opens a dialog box where you can enter Analyst EPS
Estimates for future fiscal years. Values entered will be plotted on the
graph.
Add Scale: Adds one horizontal scale to the semi-log graph to help
you adjust the growth lines. You may add additional scales to handle
the growth by clicking on the “Add Scale” button.
Remove Scale: Removes horizontal scale lines from the semilogarithmic graph to help you adjust the growth lines.
Start Projection: Shown only if you have enabled it in Preferences >
Stock Study > Enable Trend Line Options. This allows you to select
where you want your five-year projection line to start from:
Annual data starts from the last, full fiscal year.
Quarterly data starts from the most recent quarter.
Toolkit 6
233
End of the trend line starts from the point where the trend
line intersects the last full year line.
Historical Growth: Opens a historical growth profile, displaying the
historical growth rates window in both a graph and a table, along
with a description box.
NOTE: This is an important graph since a large percentage change in
the annual growth rate will often not be noticed on the Visual Analysis graph. Each point plotted here represents a growth rate calculated
as though a trend line were drawn through all of the years in the period depicted. As an example, at the 5-year point, it would represent
growth for the five years between a point six years ago and the most
recent year. Those growth rates are tabulated to the right of the chart.
234
Toolkit 6
Set Graph to Values: Moves all lines so that data points match the
scale on the left of the graph. The scale, if not already displayed, will
appear.
Eliminate Outliers
Analyze the Chart to Eliminate Irrelevant Data
1) To eliminate a year as an outlier, click anywhere along the line
representing the year’s data that you wish to exclude.
2) Observe that a red strike out line
appears, running through the
year removed as an outlier, and that the cursor changes to
indicate that something may be “put back.”
3) The Stock Study will continue to display the original data
on the data lines, but the historic growth rates will compute new
values, eliminating the data from the “outlier” year. At any time,
clicking on or around the point or its vertical line where the arrow
appears will activate the original data and replace the Historical
Sales Growth and Historical Earnings per Share Growth Rates
with the original computations.
Estimate Future Sales and Earnings Growth
Toolkit 6
235
To enter your estimate of future Earnings and Sales Growth, click on
the box next to “Est. Sales Growth” or “Est. EPS Growth” at the bottom of the page to bring up the Estimate Sales and Earnings Growth
screen. The area will be ringed in green if “Active Area Highlighting”
has been checked in Preferences.
1) Enter the percentage figure for Estimated Future Sales Growth.
2) Enter the percentage figure for Estimated Future Earnings per
Share Growth.
Depending on your data source, you may see values for Analyst’s
Consensus EPS (ACE) projected Growth Rate or the Take Stock
projected Growth Rate.
The Implied EPS Growth Rate is calculated by the program. This
figure is sometimes known as the Sustainable Growth, % Retained
Earnings to Common Equity, Plowback Ratio, Implicit Growth, or
Internal Growth.
This rate is a theoretical limit on the growth that can be expected by a
company based on the usage of its existing assets (that is, without
borrowing). This value provides a quick check when selecting a likely
future growth rate for a company.
236
Toolkit 6
The formula for Implied Growth is:
Implied Growth = % Return on Equity x (1 - Dividend Payout Ratio)
From the Stock Study, Toolkit uses the 5-Year Average Return on
Equity from Section 2B, and the 5-Year Average Dividend Payout
Ratio from Section 3 (or from Section 5 if adjusted by the user) for
this calculation.
For companies that pay no dividends, the Implied Growth Rate will
be equal to the Return on Equity.
Advanced Option
You may examine the “Revenue-Based EPS Estimate” at this time
and review an alternative calculation of earnings per share. To do so:
Click on the “Revenue-Based EPS Estimate” button to accept and
compare your estimates with the calculations provided by the program.
Toolkit 6
237
To construct an earnings per share figure based upon the normal
manner in which a company does business, this dialog begins with
your estimate of future sales, calculated from your estimate of future
growth. You may change each of the items that affect that figure as it
runs the gauntlet from the top to the bottom line.
To do so:
1) Click in the checkbox adjacent to the item you wish to amend. The
ten-year history of the selected data will appear in the display to
the right so you can assess the reasonableness of your proposed
changes.
2) Enter the new figure in the field provided. (Enter Sales, Expenses
and Taxes as percentages, dollars for Dividends, and numerals for
Shares.)
3) When you have made all of your changes, view the differences for
EPS % Growth in the selection area at the bottom of the window.
4) Select one of the three options available:
·
EPS by “Revenue Estimate”
·
Projected EPS
·
Other
5) If you have selected “Other,” enter a figure of your choosing in the
space provided.
The Analyst’s Estimate is offered for your information; however such
estimates are generally optimistic. For that reason, it is not offered as
a selection option.
See the “What and Why” section for a detailed discussion of the Revenue-Based EPS Estimate and the judgment items relating to it. When
you have finished with the Revenue-Based EPS Estimate, click “OK”
or “Cancel” to accept your choices or reject them. You will have another opportunity to access the Revenue-Based EPS Estimate on the
238
Toolkit 6
back of the Stock Study, under Section 3, should you wish to take
advantage of it.
You may also change your earnings and sales growth projections by
clicking on and dragging the box at the end of the 5-year projection
line. As your cursor approaches the “hot spot,” it will change form to
look like this:
You can “grasp” the little box with the “hand” and move it
up or down to raise or lower the projections to suit you visually.
As you move the projection line up or down, note the change in the
growth rate in its respective box at the bottom of the screen.
Fiscal Year EPS Estimates
From the Visual Analysis window, you may also click the Analysts
Est. button on the toolbar.
From here, you may enter EPS and Sales estimates from the company
or from analysts for future fiscal years. The “Source” field is for your
Toolkit 6
239
reference to recall where the origin of the data entered. The Internet
button allows you to quickly find analysts links from this window.
If you have entered data in the EPS Estimates window, blue circles
with a small letter “e” will appear on the graph and green circles with
a small letter “s”:
240
Toolkit 6
These points help you evaluate the placement of the projection lines
that you have set in the program. The source of the estimates is also
printed on the graph in the bottom right.
Section 2—Quality Analysis
Eliminating Outliers
1) Go to the back of the Stock Study by clicking on the “Stock
Study Back” button [Ctl+F].
2) Place the cursor over Section 2, Evaluating Management, and
notice how it changes when moved into the most recent five years
of data for % Pre-Tax Profit on Sales (Profit Margin) and % Earned
on Equity. The area will be ringed in yellow if “Active Area Highlighting” has been checked in Preferences. If data appears to be of
a non-recurring nature and to be out of line with the rest of the
data, you may wish to eliminate it. (See the “What and Why” section for a discussion of outlier elimination.) If so:
3) Click on individual data boxes in the last five years of data to eliminate that data from the calculations of the Last 5 Year Avg. and
Trend columns. Eliminated data will appear with a red diagonal
line across it.
If both Trends are UP or EVEN and the figures are consistent with the
industry averages (if you have access to them), proceed to Section 3,
PRICE, PRICE/EARNINGS RATIO AND DIVIDEND ANALYSIS.
Toolkit 6
241
Pre-tax Profit Margin Graph
To see a graph of the % Pre-tax Profit on Sales (Profit Margin), click in
its “Last 5 Year Avg” box (the magenta box if “Active Area Highlighting” was selected in Preferences).
Often this graph will help you see the Profit Margin trend that you
would not really notice by just looking at the numbers.
Section 3—Price, Price/Earnings Ratio and Dividend
Analysis
Accept or amend High and Low P/E’s.
1) Display the back of the Stock Study.
242
Toolkit 6
2) Place the cursor over Section 3, PRICE, PRICE/EARNINGS RATIO AND DIVIDEND ANALYSIS and notice how it changes
when moved over some of the data columns (the area will
be ringed in yellow if “Active Area Highlighting” has been
checked in Preferences.)
3) Look for instances of a particularly low EPS figure to see if it has
disproportionately raised the high or low Price Earnings Ratio figures for that year.
4) Observe the High and Low Prices for trends from year to year.
Look carefully at the High P/E and Low P/E Columns for any
significant trends that might affect the Average High P/E and
Average Low P/E.
5) Determine whether to eliminate outliers by analyzing whether the
data displayed varies significantly from the rest of the data in the
column or row. Click on each of the Years (far left column) or
header labels, or a specific data field to eliminate data. A red diagonal line will cross through any data eliminated as an “outlier.”
NOTE: You may wish to look at the Annual P/E Analysis report at
this point to analyze a full ten years of P/E data.
Toolkit 6
243
Section 4—Evaluating Risk and Reward over the Next 5
years
Unless you have done an Stock Study for this company before, or
chosen to accept Toolkit default values, you will find the spaces for
Average High P/E (4A) and Average Low P/E (4B) blank. This is to
avoid the temptation to allow default values to substitute for your
judgment.
Click on either the Avg.
High P/E or the Avg. Low
P/E boxes. (The area will be
ringed in green, indicating
that these fields must be
filled, if “Active Area Highlighting” has been checked
in Preferences). This will
bring up the dialog box pictured on this page.
Any outliers selected in Section 3, or in Annual P/E
Analysis, will be crossed out
in this dialog and the averages displayed will be the
average of the remaining data. You may elect to use
those high and low averages
or to override those values
and substitute your own. Or
you may eliminate more data to be more conservative.
There are three buttons at the bottom of the dialog to assist you in
analyzing the historical P/Es:
Use Section 3 Averages: Selecting this button will use the 5
year average from section 3.
244
Toolkit 6
Use Average From Above: Selecting this button will use the
10 year average from the High and Low P/E section above, excluding any outliers if any are selected.
Use Median: Selecting this button will use the median or middle value. (If there were 9 data points, you would eliminate the
4 highest and 4 lowest and use the middle value. With 10 data
points you would average the 2 center points.) Or you may
want to average the lowest half or majority of the data by selecting the median and restoring all values below the median.
When your choice differs from the default values in Section 3,
red cross-outs in 4A and 4B will call attention to those differences.
High and Low Price/Earnings Ratio Graph
To help you spot any extraordinary numbers and their relation to the
Average High and Low P/E Ratio, look at their graph. To open, click
Toolkit 6
245
in the magenta box (if “Active Area Highlighting” was enabled in
Preferences) in Section 3. The cursor also changes to here, indicating
a closer look is available. The graph allows you to see ten years of P/E
history and to compare the high and low P/Es with their five year averages (depicted in red).
Select High Earnings per Share (“Revenue-Based EPS
Estimate”)
Click on the Estimated High Earnings field (surrounded by a yellow
box, if enabled in the Preferences) for a second opportunity to access
and use the Revenue-Based EPS Estimate to fine-tune your high
earnings estimate.
Adjust Forecast High Price
Forecast High price is automatically calculated for you as [Selected
High P/E] X [Estimated High Earnings/Share]. If you would like to
override this, click on the Forecast High Price$ field (surrounded by
a yellow box, if enabled in the Preferences) for an opportunity to adjust the high price.
Select Low Earnings per Share
In Section 4, assuming the company operates normally, the program
places the Earnings Per Share for the most recent year (from Section
3) as the Estimated Low Earnings Per Share over the next five years.
246
Toolkit 6
You can modify this data field by clicking in the appropriate area in 4B (ringed in yellow if “Active Area Highlighting” has been checked in
Preferences) and entering the data; click on “OK” to accept. Should
you need additional guidance, review the section on amending the Estimated High and Low Earnings per Share in the “What and Why”
section.
Select Low Price
On the back of the Stock Study form, Section 4:
1) Click on the area in Section 4-B, LOW PRICE ANALYSIS—NEXT
5 YEARS located to the far right of the fifth line, Selected Estimated Low Price (ringed in green if “Active Area Highlighting” is
enabled in Preferences). The Potential Low Stock Price Selection
window offers seven options:
Toolkit 6
247
For guidance about these selections, see “Estimate the Potential
Low Price” in the “What and Why...” section.
2) Click on your selection of “Forecast Low Price” or click on “Other” to enter your own estimate.
3) Click on “OK” to accept your choice, “Cancel” to reject it.
Graph—Price Ranges and Reward/Risk Ratio
Toolkit contains a graph to help you better visualize the “Buy,” “Hold”
(Maybe), and “Sell” price zones in relation to the Reward/Risk Ratio.
Click in the magenta box (if you enabled “Active Area Highlighting” in Preferences) around Section 4C & D. The cursor
also changes into the “closer look” magnifying glass.
The bar graph on the left is the Price Range you selected in Preferences, either 33%-33%-33% or 25%-50%-25% (for a true 3-to-1 Reward/Risk Ratio). The bar graph on the right shows the Reward/Risk
248
Toolkit 6
Ratio, with the potential Reward of 3 and Risk of 1. The Current Price
is indicated in the middle showing its relative position to the High and
Low Prices and the Price Range and Reward/Risk ratio.
Section 5—Total Return Analysis
Select Percent Payout
PURPOSE: To calculate your current and potential dividend yield and
its contribution to the potential return on your investment. Under
Section 5-B AVERAGE YIELD USING FORECAST HIGH P/E, the
Avg. % Payout is obtained from Section 3(G)-Line 7.
To change this figure, click on the field (ringed in yellow if “Active Area Highlighting” has been checked in Preferences) to bring up the
Judgment–Average Percent Payout screen and insert your estimate.
Click “OK.”
The Judgment Audit
The Judgment audit combines several features in one
handy window. It allows you to see what judgment
items remain to be completed for your study, reset all
judgment items to start your evaluation over, and highlight any
judgment items that appear to depart from conventional, normal, or
reasonable values.
Toolkit 6
249
Using the Judgment Audit
1) To open the “Judgment Audit” screen (below), click on the “Audit” button on the Company Toolbar.
2) Click the “Reset Judgment” button below the “Judgment Items”
box to reset all judgment items you have entered.
250
Toolkit 6
3) Click on any checked item under the “Items to Check” on the
right. This will open the “Take a Closer Look” information box.
4) Click on the “More Information” button to open the built in Help
system for more in-depth information.
5) Click the “Close” button to close the screen.
Listed below are the types of issues to which Toolkit 6 may call your
attention.
Capitalization: Invites you to evaluate the capitalization of the company as it is displayed in the header on the front of the Stock Study
(for example, if more than one third of the company’s capitalization
comes from debt).
Recent Quarterly Growth: Calls your attention to quarterly sales
and earnings growth if it is lower than desirable or has declined.
Historical Sales Growth: Suggest when you might consider eliminating irrelevant historical sales data from the graph, asks you to assess
if growth has been steady enough to be reasonably predictable,
Toolkit 6
251
and/or calls your attention to what might be serious growth deficiencies you should examine.
Historical Earnings Growth: Same as Historical Sales Growth.
Forecast Sales Growth: Cautions you when your estimates of future
growth might be too optimistic.
Forecast Earnings Growth Same as Forecast Sales Growth. Management Evaluation—calls your attention to possible management inefficiency.
Management Evaluation Suggests when you might want to reexamine the Pretax Profit, ROE and Debt To Equity figures in section
2 of the SSG, because they have a downward trend.
Historical P/Es: Suggest when you might want to consider eliminating some historical High or Low P/Es as outliers.
Future P/Es: Cautions you when your estimates of future P/Es may
be too optimistic.
Low Price: Raises a caution flag if the current price appears to be too
low compared with its price history.
Result: Suggest conclusions you might draw from the compiled “Results” displayed in the Judgment Audit dialog box when all required
judgment items have been completed.
Notes and Comments
Toolkit 6 provides separate notepad sections for a description of the
company and for other information.
To access your Notepad, click on “Notes” on the
Toolbar at the top of the company screen.
You can select, copy, and paste a business description from any of a
number of Web sites into the Description area.You can enter your
252
Toolkit 6
notes about recent fundamental changes, competition, the IR person’s
phone number, or a variety of other things in the Notes section.
CAUTION: When you export (and import) in the .SSG file format, the
Notes will not be exported (or imported) with the file. Export either as
a *.ITK file or as a zipped *.SSG file to keep Toolkit formatting, including Notes (see Exporting files). When you back up your data, however,
these notes are preserved in the backed-up database file.
How to Print the Stock Study
After completing your Stock Study you can print it.
Click the “Print” button on the form’s Toolbar. This will
open the “Print Company Forms” dialog.
Toolkit 6
253
1) Select if you wish to print the front
and/or back of the Stock Study.
2) Enter the number of “Copies” to print.
3) Click the “Ok” button.
NOTE: The company’s Stock Study must
be open in order to print it.
ASCII Report
If you want a text printout of your company
analysis information, just click on the
“ASCII Report” button in the “Print Company Forms” screen where
you select what report you wish to print.
This report can include the contents of your notes field for the company, as well.
How to Save a Company Stock Study
To save a company Stock Study after completing or making changes
to it:
1) Click on the “Save” icon on the Toolbar. You will notice
that the “Save” button will appear “grayed out” when you
254
Toolkit 6
open a company saved in your Stock Library, but have not made any
changes to the company.
Save a Duplicate of a Company Stock Study
You may wish to have more than one version of a company Stock
Study. For example, you may wish to have separate versions for your
club and yourself; or you may wish to save a version as it was when
you decided to buy the company. To save a duplicate “copy” or version of a company Stock Study:
1) Select File > Save Company As....
2) In the “Save Company As” screen, enter a number after the company’s “Name”, e.g. Microsoft 2.
NOTE: When updating the company data from subscribed data files,
or from a price file, any such duplicate “copy” will be ignored, and all
copies will be updated (unless you select to exclude one or more them
from updating during the updating process).
Toolkit 6
255
Comparisons
Step 1. Select Stocks to Compare
1) Click on the “Compare” button on the Main Toolbar.
2) In the “Select Companies to Compare” screen, select, from the
Portfolio drop-down menu, a portfolio with the companies you
want to compare, or select “Stock Library.”
3) Choose companies to compare by clicking on the company to highlight it, and then click on the “Add” button to move the company
to the right to the “Companies To Compare” listing. (You may also select companies by double-clicking on the company name.)
NOTE: Only companies for which Stock Studies are completed will
be displayed in the “Select Companies to Compare” dialog box.
4) To remove companies from the “Companies Selected” column,
click on the company to select it and click on the “Remove” button. Or to remove all, click on the “Remove All” button.
256
Toolkit 6
5) Click the “Compare” button to open the Comparison.
Step 2. Using the Comparisons
The Comparisons will import and list the data for each company selected. The “winners” for each line item will be circled and the overall
“company winner” will be circled.
Step 3: Modify, Weight, and Eliminate Criteria
1) Click on the “Criteria” button to open the “Specify Optional Criteria” screen.
2) Click on the drop-down menu arrow in the applicable field to
choose additional items to appear on Lines 23, 27 & 28.
3) If you wish to weight the scoring of criteria, click the “Use
Weighting” checkbox.
4) Score each criterion on a scale of 1 to 5, giving a 5 to the items
you believe to be the most important and a zero to those you wish
to ignore. Click “Ok.” The weight given to each item will appear in
the margin next to the item.
Toolkit 6
257
NOTE: You may choose to eliminate or allow items in grading by
simply clicking on the item in the Stock Comparison report. The
cursor will change from a “+” to a “-” when it passes over criteria you
can eliminate.
Click on the label to eliminate the criterion. (An “X” will be placed
next to the item in the margin.) If that item had been weighted, the
“X” will replace the weighted value. When the item is restored, it will
be restored with its weighted value. The cursor will change to a where
eliminated criteria can be restored. NOTE: Your eliminated criteria
and the assigned weights will both be saved until modified.
The Comparison Toolbar
258
Toolkit 6
To add additional companies or change those selected to appear in
your Comparison, click on the “Companies” button to return to the
“Select Companies to Compare” screen, where you may add companies to, or remove them from, the “Companies Selected” column.
Click on the “Circle All” button to circle all criteria. Or, click on “Circle None” to remove all circled criteria.
To see a quick view Stock Analysis Graph of the company, click on
the company name. To close the Graph, click on the “Close” button.
To open a company’s Stock Study directly from the Comparison,
right-click on a company’s name.
To return to the Comparison, select Windows from the Menu Bar and
from the drop-down list select the Comparison.
To adjust the size of the Comparison to fit your screen, click on the
“Zoom” button. Select a percentage amount from the drop-down
menu, or type in your own number.
For context-sensitive Help, click on the help button on the Comparison screen Toolbar.
How to Print the Comparison
To print the Comparison, click the “Print” button on the Comparison Toolbar. Toolkit will print the Comparison on your default printer.
Toolkit 6
259
PORTFOLIO
MANAGEMENT
Toolkit 6 adds a new dimension to fundamental portfolio management. It has abstracted the concepts behind the printed forms that
investors have used for this task for more than a half century and has
created a process that implements those concepts, producing the traditional forms as a by-product of that process.
For those purists who are accustomed to, and who prefer to use those
forms, automated as they have been in the previous version, you may
still do so. We have preserved the information about them and continue to include it here, after we deal with the “How to...” of the process. For a detailed discussion of Toolkit’s portfolio management process, see the “What we do...” section of this manual.
The Home Page
The Home Page is where your portfolio management tasks begin. You
may initiate your portfolio management tasks by clicking on the
“Manage a Portfolio” text under “What do I do now?” but more often,
you will merely wait to be reminded that it’s time for them.
260
Toolkit 6
Defense and Offense
Portfolio management is divided into two distinct disciplines, Defense
and Offense.
Defense. Protection from harm, prevention of loss. Done when new
quarterly or annual data shows a company is no longer
maintaining the growth characteristics you expected
when you bought the stock. You will set reminders in
Preferences so you can be advised when each company is due to report new data.
Toolkit 6
261
Offense. Enhancement of your portfolio’s performance by replacing
good companies whose price has become too high to offer you sufficient return at minimal risk.
Scheduling
You will set thresholds in Preferences to signal when the reward
and/or risk becomes sufficiently high and low respectively to warrant
your attention. To set these preferences, click “Preferences” on your
main toolbar, and then select the “Thresholds” tab.
262
Toolkit 6
Data Triggers
Set the “Prices are old after...” to the number of days after which
you wish to be reminded to update your prices. The default value is 7.
Set the “Data is old...quarter end” to the number of days after the
end of the quarter you wish to be reminded. Companies have 45 days
before they’re required to report their quarterly results so you will
want to give enough time for that information to have been reported,
obtained and processed by your data provider, and made available for
use. The default is 45 days but you may wish to add an extra ten
days or two weeks before you attempt to acquire it. A nominal value
would be 60.
Set the “Data is old...year end” to the number of days after the end
of the fiscal year you wish to be reminded. Companies have 90 days
before they’re required to report their annual results. The default is
90 days but you may wish to add an extra ten days or two weeks before you attempt to acquire it. A nominal value would be 115.
Reminders
On your Home Page, you will find two sections that will assist you in
your portfolio management tasks. The first is the section labeled “Requires Attention” This area is dormant when all is quiet and your
portfolios are all in synch with your expectations, there is no new data, and prices are up to date. However, when any of those is out of
synch, it will appear in red text in that section. Here, your attention is
called to all three areas:
Toolkit 6
263
Update Prices
When in red, this reminder tells you that one or more of the companies in your stock library has not had its price updated for a period
beyond the threshold you set. Click on “Update Prices” to pull in the
new prices for all of the stocks in your stock library. You may scan
the list to see if all prices are satisfactory and to get a quick look at
those companies whose new price puts it in your “Buy” zone.
If you wish to see only those companies whose prices are stale, rightclick on “Update Prices” to see one of the following options:
Update all prices. Same as left-clicking above.
Show stale prices. Displays the company and date the last
time the price was updated. Double-clicking on a company in
this list will open the respective Stock Study from which you
may update its price individually.
Update Data
When in red, this reminder tells you that one or more of the companies in your stock library should have new data available. Clicking on
“Update Data” displays a list of only those companies whose data is
older than the thresholds you set. You have the option of updating
any company you select or updating the entire list.
264
Toolkit 6
For your portfolio management tasks, it is most efficient to click on
“Update All,” to update just those companies whose data is due. The
update will replace all data for which data is available in the data file.
(To add only new data and leave the existing data intact, see “Changes Only” in the section below on Updating Data.)
NOTE: You may update the entire stock library, a single portfolio, or a
single stock if you wish. And you have the option of replacing all
available data or adding only the new data. For a complete discussion
of these options, see the Portfolios section and the following.
Incomplete Studies
This reminder notifies you that there are some companies in your database for which you have the data but have not completed the evaluations required for them to be considered in any of the portfolio manToolkit 6
265
agement processes. You may click on “Incomplete Studies” to display a list of those companies that require judgment.
Double-clicking on any company in the list will open its Stock Study
for you to complete its Stock Study.
The Portfolio Report Card
Toolkit 6 keeps you informed about the aggregate market value of
your portfolios and the status of their risk and return.
At a glance you can see the results of price and data updates, and,
depending upon whether the portfolio is displayed in black or red, see
which, if any, of your portfolios requires your attention having one or
more stocks that has slipped past your threshold for defensive or offensive action. Click on any portfolio to display its Portfolio Overview.
Portfolio Overview
The Overview is the control center for detailed information about
your portfolio and the stocks within it. It is also an effective portfolio
maintenance center in which you may add or remove holdings,
change the number of shares, update the data and price for each individual stock or for the portfolio as a whole. You may even “Challenge” any stock in your portfolio to see how it fares against any oth266
Toolkit 6
ers in your Stock Library. To do any of these tasks, select an individual stock and click the appropriate button to the right of the grid.
The top of the screen offers you more detail about the specific portfolio’s performance.
Company names in red indicate that the company requires you to
complete your Stock Study to qualify it for consideration in some of
the other portfolio management activities. Obviously a stock can’t be
used to challenge, compare, make a contribution to the hypothetical
performance of a portfolio, or be considered intelligently as a part of a
watch list if you haven’t completed the judgments that determine its
quality parameters and its potential return and risk.
The Data Date in red indicates that the company is overdue for reporting its financial results for the quarter or year and that you
might want to update the data or prices. If you hadn’t already updated the data and prices when reminded on the Home Page, click on
the “Update Portfolio Data” button beneath the grid to update just
that portfolio’s data.
Toolkit 6
267
A Price Date in red indicates that the price is stale according to your
threshold. You may update that portfolio’s prices by clicking on the
“Update Portfolio Prices” button beneath the grid.
You may change portfolios using the pull-down menu in the upper
right corner of the Overview. You may dismiss the Overview by clicking “OK” at the bottom of the screen.
It is from the Overview that you will implement your Offensive and
Defensive strategies when desired or required. To do so, click on the
“Alerts” button at the top left corner of the Overview screen.
Alerts
The Alerts screen has taken the drudgery out of the Portfolio Review. It has selected from your portfolio all the companies that have
crossed your thresholds for Defense and Offense. It presents you with
268
Toolkit 6
all of the information necessary to make your initial “hold” or “look
further” decisions. And it gives you access to all of the tools necessary
for making your final decisions.
As with the Overview, you may toggle back and forth between the
Overview and the Alerts screens using the button in the upper left
corner; and you can select another portfolio using the pull-down
menu in the upper right. Common to this screen also are the buttons
allowing you to update your portfolio’s data and prices and access the
printed reports.
Defense
Compare, Analyze, Decide Indication:
If the “Update Data” text on Home Page is red, then follow these
steps.
Action:
1) Click on “Update Data” to see which companies are due to have
new data.
2) Click on “Update All.”
3) Click on Update Prices (not necessary for Defense; but might affect Offense thresholds).
4) Double-click on the portfolio displayed in red that requires attention.
5) All companies displayed in Overview should be displayed in black.
All dates should be black. If any company is red, double-click it to
complete the Stock Study, then return to Overview.
Toolkit 6
269
Compare
6) Click on the “Alerts” button at the top left corner of the Overview
screen.
Analyze
7) Select Trailing 12 Mos for “Data Source” above the grid. Only the
data that has crossed your threshold will be highlighted in red.
8) Locate the first “% Diff” column to the right of “Sales Exp.” and
click on the column header to sort it with the lowest values at the
top. (Click a second time if it sorts the other way.)
9) Scan down the “% Chg Sales” column until you come to a value
that is acceptable. Those whose values in the “% Chg Sales” column are in black should be acceptable—as may be some that are
just a little short of your expectations (which you can see in the
column to the left).
10) Beginning with the first company with acceptable values, select
each company and click on the “Hold” button to the left of the grid
to place a “Hold” in the “Action” column. Do that for all below it.
11) Repeat 7, 8, and 9 with the “Pre-tax Profit” and “EPS” columns. If
a company marked “Hold” is unacceptable on the basis of either
“Pre-tax Profit” or “EPS,” click on the “Hold” button a second time to
reverse the “Hold” action.
12) Click on the “Action” column header to bring those companies to
the top that require further action.
270
Toolkit 6
Decide
13) Click on the “Check Trends” button to the right of the grid. Once
there, you may wish to go directly to the…
Quarterly Trend Graph.
The rest of the individual company forms
(Stock Study, Comparison, Stock Management Guide, and Annual P/E Analysis)
are all available from a pull-down menu at
the upper left corner of your Quarterly
Trend Analysis or the other company forms.
You also have all of the portfolio forms to
work with (Portfolio Review, Trend, Summary, Defense, and Offense) by clicking on the “Reports” button beneath the Offense grid in the Alerts screen.
A similar pull-down menu for portfolio forms is at
the upper left corner of all portfolio forms.
Assuming you have an active connection to the
Internet running, you may access it at any time
by clicking on the “Web” button on the main
toolbar. If you have a company selected, you may
select any Internet destination you may wish to visit for your research. Those that are company-specific will appear as will those generic sites you may have selected. You have full control over the sites
that populate that menu (see the following).
Toolkit 6
271
Using the tools just described, you can carry out all of the research
required to find out if a problem is likely to be only transient or a serious and long-term situation management is unlikely to be able to
fix.
See the “What and Why...” section for a more detailed discussion of
what you should look for in this phase of the process.
When you have completed your research and are ready to make your
decision:
14) Close whatever form or browser you have been working with to return to the Alerts screen.
272
Toolkit 6
15) Record your decision by clicking either on either the “Hold” or
“Sell” buttons to the right of the grid.
16) Click on the “Reports” button to view your Portfolio Review Report.
You can switch to the Defense Report from here and use it as a
worksheet when you call your brokerage to sell any stock you may
have decided to sell, or close the report, and continue to check your
Offense stocks.
Offense
Check Risk & Reward, Reevaluate, Challenge Indication:
After updating prices in your portfolio(s), if there are any companies
listed in the Offense section, follow these steps.
Action:
1) Double-click on the portfolio displayed in red that requires attention.
2) All companies displayed in Overview should be displayed in
black. All dates should be black. If any company is red, doubleclick it to complete the Stock Study, then return to Overview.
Check Risk & Reward
3) Click on the “Alerts” button at the top left corner of the Overview
screen.
Toolkit 6
273
Re-evaluate
4) Click on the label at the top of the Total Return column to
sort from low to high. Click twice if necessary. Those values in
the U/D and Total Return columns that have crossed your
preset thresholds will appear in red.
5) Double-click the first company to bring up its Stock Study.
6) Look at the recent performance and re-estimate EPS growth to
reflect more closely actual performance. (See the “What and
Why...” section for guidance on this procedure.
7) Re-estimate the high P/E to reflect more closely actual performance.
8) Save the reevaluated Stock Study and close it to return to the
Alerts screen.
9) If the company remains in the Offense grid, decide if you
should replace or hold it.
10) If you decide to continue to hold it, click on the “Hold” button
and repeat the process with the next company.
Challenge
1) Should you decide to replace the stock, click on the “Sell” button.
2) Click on the “Challenge” button.
3) Enter the required data in the “Challenge Param-
274
Toolkit 6
eters” dialog box and click on the “OK” button to continue the
Challenge process.
The company you wish to replace will be highlighted in turquoise and
displayed with all of the other stocks in your Stock Library. The
stocks will be ranked in order of Total Return so that each stock appearing above the one you wish to replace will have a greater potential
return.
Your first concern is that your replacement be of equal or better quality. In addition to the Total Return, columns showing the Quality Rating, Sales and EPS growth, Profit Margins and their trends, and Sales
Toolkit 6
275
and EPS stability (R-squared) are displayed. You must compare those
quality measures with those of the stock you want to replace in order
to be certain that the Total Return is not the result of poor fundamental performance and the attendant lower price.
A column showing the companies’ industries is displayed to assist
you if diversification by industry is important to you in seeking a replacement.
4) Beginning at the top of the list, work your way down until you find
a company that appears to be a good candidate for replacing the
one you have decided to sell. (See “What we do...” for a discussion
of this process.
5) When you find a promising candidate, select it and click “Ok” to
display the detailed
Challenger
At the top of the left side of the Challenger are the quality parameters,
side by side for comparison. Beneath those are displayed the financial
details of the proposed transaction. On the right is a graphic comparison of the growth of your investment should you hold the stock you
are considering challenging or decide to replace it.
276
Toolkit 6
6) If you are dissatisfied with your selection, click on “Company List”
on the bar at the top of the Challenger to return to the Smart Challenger and find another.
7) When you do find a satisfactory replacement, click “Print” on the
bar at the top of the Challenger to print it out and document your
decision.
8) Click “Close” to return to the Alerts screen and complete the list as
above.
9) When you have finished your Offense tasks, click on the “Reports”
button beneath the grid on the Alerts screen.
With your Offense Report and your Challenge results, you are prepared to call your brokerage and implement the results of your work.
Toolkit 6
277
Portfolio Management Reports
For those who prefer to continue to use the original forms for their
portfolio management chores, we have included this section. Any detailed discussion about the interpretation of the forms will be found
in the “What and Why...” section of this manual. This section is intended to help you only with the mechanics of launching the forms
and making use of whatever automation of those forms we have incorporated.
All of the portfolio management reports can be accessed
in a similar fasion:
1) Click on the “Portfolio” button on the Main Toolbar.
2) In the “Portfolio Selection”
screen, click on the portfolio you
wish to open, and click “Ok.” This
brings up the default Portfolio Overview Report.
4) Adjust the size of the Portfolio
Review by clicking on the resize button and selecting a percentage number.
Alternately, if you are looking at the
Portfolio Overview window, you can
simply click the “Reports” button to get to the same location.
Once you have the default report open, you can use
the “Select View” menu in the top left-hand corner
of each report to select a specific report. Placing your
mouse pointer over the menu will reveal the available reports. The “Views” in the Portfolio Review are
Portfolio Review, Trend, Summary, Defense, Offense, Sector/Industry, and Company Size.
278
Toolkit 6
Portfolio Review
PURPOSE: To monitor the performance of the companies in your
portfolio or Stock Library to determine whether they are living up to
your expectations.
Navigating
Use the scroll bars to move the Portfolio Review form by clicking on
the arrows on the side, and the arrows on the bottom.
“Next” and “Previous” buttons at the bottom of the Portfolio Review
are to go to the Next or Previous Page.
Sorting Portfolio Review Data
You may sort many of the columns in your Portfolio data in the Portfolio Review by using “Sort On” on the Portfolio Review Toolbar.
1) On the Portfolio Review Toolbar, click on the “Sort On” dropdown menu arrow.
2) Select from the list. You may sort on: Name, Ticker, % Chg. EPS, %
Chg. Sales, % Chg. PTP, % Chg 12-month EPS, Relative Value, Est.
Growth EPS, Reward/Risk (Upside- Downside ratio), Rate of Return,
Projected Average Return, Total Return, % of Portfolio, % P/E /
Toolkit 6
279
Growth (PEG), % Difference Sales Growth, % Difference PTP Growth,
% Difference EPS Growth, Dividend, % Yield.
3) Click on either the descending “A-Z” or the ascending “Z-A” button.
NOTE: You can also move your cursor over the heading of the column
on which you wish to rank the report. The cursor will change to an
up-arrow. To sort in an ascending (Z-A—lowest to highest, or worst to
best) simply click on that column heading. To sort in the opposite direction, hold down the [Shift] key and click to change to a down-arrow
and sort in a descending order (A-Z—highest to lowest, best to worst).
4) Click on the Internet to open your browser to the Yahoo Web site.
With it already populated with the stocks in your portfolio and all of
the latest news listed by company.
Highlighting Alerts on Portfolio Review Form
The Portfolio Review form also has “area number highlighting” to alert
you when the numbers fall outside of the normal range.
Pink Background Caution Alerts
The EPS, Sales, Pre-Tax Profit, and Trailing 12 months EPS will be
Pink if their Growth Rates are less than the Estimated Growth Rates
EPS.
280
Toolkit 6
Yellow Background Caution Alerts
The Proj RV (Relative Value) will be yellow if the RV
is less than 80 percent or
higher than 150%.
RWD/RSK (Reward/Risk
Ratio) will be yellow if the
ratio is less than 3 to 1.
% Total Return will be
yellow if the figure is less
than 10%.
Red Price Dates
The Date when the stock Price was last updated will be in red if it is
older than seven (7) days.
How to Open Quarterly Trend Analysis from Portfolio
Review
If you use Toolkit 6’s portfolio management process, you will usually
open Quarterly Trend Analysis from the Alerts window. If not, the
most intuitive means of opening it is directly from the Portfolio Review, to further your research.
Within the Portfolio Review form you may open the Quarterly Trend
Analysis form for any company by double-clicking on the company’s
row of data. An information pop-up appears when you rest your cursor to let you know this feature is available.
See “What and Why...” for more details about using Quarterly Trend
Analysis.
Toolkit 6
281
Portfolio Trend Report
PURPOSE: To analyze the trend of the operations of the companies in
the portfolio over two consecutive quarters relative to earnings, sales,
and pre-tax profit in order to view the “trend of the trends.” For further information, see “What and why.”
Using the Portfolio Trend Report:
1) From any portfolio report, click on “Select Views” dropdown menu, then click on “TREND” to highlight and select.
This will open the “Trend Report.”
2) Adjust the size of the Trend Report by clicking
on the button and selecting a percentage number.
282
Toolkit 6
3) NOTE: The resized Trend Report will reopen to this same
new size the next time it is opened. Window size depends on
the size of your monitor and your screen resolution settings.)
4) Your stocks will appear ranked in whatever order they were
in before you opened the report.
5) You may sort them in the same fashion as the Portfolio
Review. See “Sorting Portfolio Review Data” for more information.
Portfolio Summary Report
PURPOSE: To summarize, in report form, the stocks in a portfolio
along with the Stock Management Guide’s “Buy,” “Hold,” or “Sell”
“recommendations.”
Using the Portfolio Summary:
1) From any portfolio report, click on “Select Views” drop-down
menu, then click on “Summary” to highlight and select. This will
open the “Portfolio Summary.”
2) Your stocks will appear, ranked in whatever order they were
ranked previously. You may sort them in the same fashion as the
Portfolio Review. See “Sorting Portfolio Review Data” for more
information.
Toolkit 6
283
Portfolio Defense Report
Purpose: To serve as a reminder of the reasons for defensive “sell” decisions and the “hold” and “sell” status of your portfolio when you
contact your broker to execute the trades required to implement your
defensive strategy.
Using the Portfolio Defense Report
1) From any portfolio report, click on “Select Views” drop-down
menu, then click on “Defense” to highlight and select. This will
open the “Portfolio Defense Report.”
2) Your stocks will appear, ranked in whatever order they were
ranked previously. You may sort them in the same fashion as the
Portfolio Review. See “Sorting Portfolio Review Data” for more
information.
Portfolio Offense Report
Purpose: The Offense Report serves as a reminder of companies that
may be overvalued, based on your judgment. It lists all of the companies in your selected portfolio and highlights those whose reward is
less than, and/or the risk more than, the thresholds you have set for
those measurements. Company-specific thresholds which were set in
the Portfolio Overview will be shown in blue.
284
Toolkit 6
Using the Portfolio Offense Report
1) From any portfolio report, click on “Select Views” drop-down
menu, then click on “Offense” to highlight and select. This will
open the “Portfolio Offense Report.”
2) Your stocks will appear, ranked in whatever order they were
ranked previously. You may sort them in the same fashion as the
Portfolio Review. See “Sorting Portfolio Review Data” for more
information.
Sector/Industry Diversification
Purpose: The Sector and Industry Diversification Report allows you to
see if your portfolio is well balanced in a quick glance. This report
quickly shows you if you need to diversify your portfolio or if you own
too many shares or companies in a particular sector or industry.
Toolkit 6
285
Using the Sector/Industry Diversification Report
1) From any portfolio report, click on “Select Views” drop-down
menu, then click on “Sector/Industry” to highlight and select.
This will open the “Sector/Industry Report.”
2) Your stocks will appear, ordered by Sector, then Industry, then
security name.
Company Size Diversification
Purpose: Similar to the Sector/Industry Report, the Company Size
Diversification Report is designed to help make sure your portfolio
is diversified. The report divides up your portfolio into five categories
(Micro, Small, Mid, Large, and Mega) based on yearly revenue.
286
Toolkit 6
Using the Company Size Diversification Report
1) From any portfolio report, click on “Select Views” drop-down
menu, then click on “Company Size” to highlight and select. This
will open the “Company Size Report.”
2) Your stocks will appear, grouped by revenue size.
Quarterly Trend Analysis
Using Quarterly Trend Analysis
There are two ways to view the Quarterly Trend Analysis:
1) If you are in an Stock Study (or Stock Management Guide,
Quarterly Trend Graph or Annual P/E Analysis), you may open
a Quarterly Trend Analysis by moving your cursor over the Se-
Toolkit 6
287
lect View drop-down menu and then clicking on “Quarterly Trend
Analysis” on the Company Toolbar.
2) If you are in Portfolio Review, move your cursor anywhere on the
line for the company you wish to analyze, and the cursor will
change to black. Double-click to open Quarterly Trend Analysis.
Entering Data in Quarterly Trend Analysis
The Quarterly Trend Analysis also provides access to the Quarterly
Data entry screen for entering quarterly earnings, sales, pre-tax profit, and income taxes, as well as access to the company “Data Entry”
screens.
1) Open the data entry screen by clicking anywhere on the quarterly
data portion of the Quarterly Trend Analysis (the left side).
288
Toolkit 6
Quarterly Trend Graph
1) To open a Quarterly Trend Graph, click on the “Quarterly Trend
Graph” button on the Company Toolbar in a Stock Study (or
Stock Management Guide, Quarterly Trend Analysis, or Annual
P/E Analysis).
2) Select the different items to graph, by choosing among the options
in the “Select Items to Graph, “Using Which Data,” and “Show”
checkboxes.
Annual P/E Analysis
Using Annual P/E Analysis
You may open an Annual P/E Analysis (or Stock Management
Guide, Quarterly Trend Graph, or Stock Study),by moving your
cursor over the Select View drop-down menu, and then clicking on
“Annual P/E Analysis” on the Company Toolbar.
Toolkit 6
289
No data entry is required on this screen. Toolkit automatically transfers data from company data screens and completes all necessary
computations. When there is insufficient data to compute a 5-year
average, Toolkit averages the years available. “NMF” (no meaningful
figure) appears whenever there is a division by zero. You should review the corresponding entries on the company’s annual data screen
if this occurs.
Toolkit 6 also has the ability to eliminate outliers for the full ten years or High and Low P/E information.
1) Click on any of the high or low P/E fields to
cross out that field and average the remaining
data.
2) The strikeouts will show up as defaults in the
“Judgment: High/Low P/E” dialog in Section
4 of your Stock Study if you are forecasting
your P/Es for the first time.
Stock Management Guide
Using the Stock Management Guide
You may open a Stock Management Guide (or Annual P/E Analysis, Quarterly Trend Graph, or Stock Study by moving your cursor
over the “Select view” drop-down menu and selecting “Stock Mgmt
Guide.” To view the back of the form, click on the “Stock Mgmt
Guide Back” button, and to return to the front, click “Stock Mgmt
Guide Front.”
290
Toolkit 6
How to Enter Data in the Stock Management Guide
The Stock Management Guide also provides data entry access for
the “Section 3: Cumulative Earnings and Current Price-Earnings
Computations,” as well as access to the Company “Data Entry”
screens.
1) To open the Stock Management Guide Data entry screen for Section 3, either click on the “Stock Management Guide Data” button located on Stock Management Guide Toolbar, or double-click
anywhere on the Stock Management Guide Section 3, within the
green highlighted area (if “Active Area Highlighting” is enabled in
Preferences).
2) Click in the space next to the quarter and enter the quarterly
earnings data. (NOTE: After four consecutive quarters of data have
been entered, “Total Earnings for last 4 quarters” will be calculated automatically.)
Toolkit 6
291
3) Enter the Price of the
stock when you had
your investment club
meeting. The P/E at
Time of Meeting will
be calculated automatically.
4) After updating the data or when you want
to return to the
“Stock Management
Guide”
click
the
“Close” button at the bottom of the page (or the close “X” in the
top-right corner).
The Challenger
The Stock Challenger application helps you to challenge a current
holding with which you may be dissatisfied with another company
that has better prospects or higher quality. To launch the Challenger:
1) Open your Stock Library by clicking the “Library” tab.
2) Select the portfolio that holds the stock you would like to challenge.
3) Click to select the specific company that you wish to challenge
4) Click on the “Challenge” button at the bottom
right-hand corner of the Portfolio section of
your library.
5) Within the “Challenge Parameters” screen enter:
292
Toolkit 6
“Number of Shares to Sell” (This will already be filled out if you have
done so when you created the portfolio.)
“Average Cost Per Share”: If you purchased the stock at different
times at different prices, enter the average price per share; otherwise,
enter the purchase price. You may also prorate commissions if they
are significant.
“Proceeds Taxed At”: Your income tax rate, used to calculate and
deduct the taxes you will have to pay on this sale. The program defaults to 15%, or whatever you chose to have it default to when you
created the portfolio—assuming capital gains treatment.
6) Next to Broker Type will be listed the type of Brokerage you set up
with the portfolio, either “Full Service Broker,” “Discount Broker,” or “Flat Fee” broker. If you will be charged a “Flat Fee,” enter the fee ($) for both the Sale and Purchase. Toolkit’s default
brokerage fees are based on an industry chart of average commissions.
7) Click “Ok” button to view the “Smart Challenger,” a list of suitable Challengers from which you can select a candidate. (See the
“What and Why...” section for information about this tool.
8) Before you are presented with challenger companies you will be
presented with a warning screen that informs you that you should
Toolkit 6
293
not replace a company with one whose fundamentals do not meet
your expectations. NOTE: You may disable this warning.
9) Click OK to close the warning alert box, if open.
10) The Challenged company will be displayed and highlighted, then
ranked by Total Return with all of the other prospective Challengers.
11) Select the Challenger company
12) Click “Ok” to review the Challenge Results.
13) To enter new parameters, click “Parameters” at the top of the
“Challenge Results” screen.
14) To select another company click “Company List” at the top of the
screen. This re-opens the “Smart Challenger” for another candidate.
15) When you finish making changes, click on “Close” to return to the
Home Page.
294
Toolkit 6
Toolkit 6
295
GETTING THE MOST OUT
TOOLKIT 6
Printing
The following describes the procedure for printing the various company and portfolio management forms in Toolkit 6. The printing procedure may vary slightly depending on the form you wish to print.
How to Print Company Forms
The procedure is the same to print any of the following forms: Stock
Study, Stock Management Guide (Stock Management Guide),
Quarterly Trend Analysis, Quarterly Trend Graph, and Annual P/E
Analysis.
·
Click the “Print” button on the Toolbar for any
form. This will open the “Print Company
Forms” screen.
·
Select the forms you wish to print.
·
Enter the number of “Copies” to print.
ASCII Report
If you want a text printout of your company analysis information or
the underlying data, click on the “ASCII Report” button in the “Print
Company Forms” screen.
296
Toolkit 6
How to Print Comparisons
1) Click the “Print” button on the Comparison
Toolbar. The print command will print the “Comparison” on your default printer.
How to Print Portfolio Management Forms
To print the Portfolio Review, Trend Report, Summary, Defense, or
Offense Report:
1) Click the “Print” button on the Toolbar for any Portfolio
form. This opens the “Portfolio Print Options” screen.
2) Select which form(s) you want to print.
3) Enter the number of “Copies” you want to print and click “Ok.”
How to Print the Challenger
To print the Challenge form, click the “Print” button on the “Challenge” Toolbar. The print command will print the “Challenge” on your
default printer.
Toolkit 6
297
Sharing Stock Studies
Many people like to share their stock studies with friends and members of their investment club. Doing this is an easy process, requiring
you only to export the Stock Study and then either send it as an email attachment or put it on a floppy disk.
Export Data from Stock Library
When you wish to share your stock studies with others using ICLUBcentral’s stock analysis software, you can easily export your company
studies from the Stock Library window.
The “Export” function is available from the bar at
the bottom of either the Personal Library or Portfolio Holdings.
1) Click on a company to select it and click the “Export” button.
2) In the “Export Company” dialog box, select the file format option
you wish (ITK or SSG).
298
Toolkit 6
NOTE: You may export your notes using ITK, or, should you select
*.SSG, you may also elect for your *.SSG files to be zipped. See
Export File Formats below for more information.
3) Select the Export destination and click “Export.”
NOTE: If you selected an Export destination in your Preferences,
the file will be exported directly there. If not, you will have the opportunity to do so here.
New Computer Users tend to find the desktop the most convenient
place to export their *.SSG files. Your desktop is the location where
your icons reside when you first start up your computer.
Toolkit 6
299
Sending a Stock Study via E-mail
1) Open your e-mail program.
2) Address your message and fill in the subject as you would
normally do.
3) Follow the prescribed procedure for sending attachments
using your email program or web site.
a. Usually this will mean clicking an attach button, navigating to the directory to which you exported your *.SSG
file, and then Double-clicking the Stock Study file(s)
that you exported.
4) Press Send to transmit the message and file.
Export File Formats
Files may be exported in three different formats:
Save in Toolkit Format: The
“Toolkit format” ITK file will preserve your Notes and additional
judgment, including the location of
the lines in the Visual Analysis. It
is not compatible with other analysis software. This file can only be
opened in Toolkit 6.
Save
300
Toolkit 6
ZIP: The ZIP file will save both the *.SSG file format along with your
Toolkit “Notes” as a text (TXT) file in a compressed ZIP file. The
“Notes” file can then be opened and read as a text file when sent to
someone who is not using Toolkit 6. The zipped file (*.SSG file format
plus a text “Notes” file) will import into Toolkit 6, just like the ITK
“Toolkit File Format.”
Advanced Data Export
To export multiple stock studies, a ticker list, a Stock Library, and/or a
CSV file to make data or stock studies that you have completed available
to others or prepare them for on-line uploading, do the following.
1) On the Menu Bar, select File > Export Data.
2) From the pull-down menu at the top of this screen, select the
portfolio from which you’d like to export your companies or select
“Stock Library.”
Toolkit 6
301
3) To select companies to export, highlight the name of the company
and then click the “Add” button to move the company to the Companies Selected list or double-click on the company name. You
may select companies individually or “Add all.”
4) To select your export format click on the pull down menu beneath
the left grid labeled “Export Format”—choose “Toolkit Format”
“SSG Files,” “CSV Price File,” “ASCII Ticker List,” or “Toolkit
Stock Library.”
·
“CSV Price Files” contains only ticker symbol, latest price and
dates for use in updating prices.
·
“ASCII Ticker List” is a file containing only the ticker symbols
for use when using one of the on-line services, perhaps, for
price updating.
·
“Toolkit Stock Library”: Exports selected stocks to a newly
created Toolkit Library database. This option is only available if
“Show Advanced Library Options” has been checked. This
may be done by clicking the “Preferences” button on the main
Toolbar, clicking the General tab, and then clicking the box labeled “Enable Advanced Library Options.”
NOTE: Toolkit’s default database will not change to this new exported
library database.
5) Click “Ok” to export your files.
6) If you haven’t already provided in the Preferences for a destination
folder for your exported files, you will be asked to do so at this point.
Sharing with the StockCentral Community
Toolkit 6 offers a new way to share your Stock Studies. You can upload a completed Stock Study to the StockCentral.com community
for comparison, peer review, or comments.
302
Toolkit 6
To access the Community section, open a Stock Study. In the “Select
View” drop-down in the upper left of the screen, select “Community”
This will show you the section of the StockCentral.com forums devoted to the company you have open. In the Community view, you will
see any recent messages posted to that company forum.
Click on any of the message threads listed to view the entire conversation thread.
You are able to reply to any posting you see here. You can also create
your own thread by clicking the “Add New Topic” button and posting
a new topic.
Uploading a Stock Study to StockCentral.com
Sharing with the StockCentral.com
community does not stop there—you
can also upload your completed Stock
Study to StockCentral.com so that others may download and view it.
Additional Research Links
The StockCentral.com community also provides external links to additional information about the selected
Toolkit 6
303
company that you can use to research a company more closely.
Managing the Stock Library
The Personal Library window
in Toolkit 6 is an easy interface for accessing all of the
companies in your Stock Library and managing your
Portfolios. The Personal Library window has three vertical panes:
·
Personal Library
·
Portfolios
·
Portfolio Holdings
The Personal Library consists
of all of the companies you
have saved in your Toolkit. The
Portfolios pane allows you to
create Portfolios into which you
add companies from your
Stock Library. Finally, the
Portfolio Holdings pane displays the contents of the individual Portfolios.
Click on the blue “Library” tab
to open your Stock Library.
The tab is always present, and the Library always accessible no matter what study you may be performing. Clicking on the blue “Library”
button will re-open and expand the Library view. If “Hide and Show
Library Automatically” is selected in Preferences, then the Library
window will automatically open when no Stock Study screen is open.
When you open a company, the Library window closes, but you may
reopen it by clicking on the green “Library” button.
304
Toolkit 6
Navigating with Library Toolbars
There is a toolbar beneath each of the three panes.
·
The bar beneath the Personal Library has the following buttons: “Open,” “Delete,” “New,” “Export,” and “Holdings.”
·
The bar beneath the Portfolios has “New,” “Delete,” “Reports,” “Prices,” and “Edit” buttons.
·
The bar at the bottom of the Portfolio Holdings section has
“Open,” “Add,” “Remove,” “Export,” and “Challenge” buttons.
Stock Library
The Stock Library consists of all the companies for which you have
data saved in your Toolkit 6 database, whether or not the stock
studies have been completed on them.
There are several different ways to open a new or saved company, which
are briefly reviewed here. For a more in-depth explanation, refer to the sections on how to “Open Saved Stock Study,” “Importing Data—New
Stock Study,” and “Manual Data Entry—New Stock Study.”
Open
Click on any company in the Stock Library to select it, and then click
the “Open” button. This will open a Stock Study for the selected
company. (You may also open a Stock Study by right-clicking on the
desired company and selecting “Open” from the displayed menu.)
Delete
Click on any company in the Stock Library to select it, then click on
the “Delete” button. This will delete the selected company’s data from
Toolkit 6
305
Toolkit 6 database, removing it from the Stock Library listing and,
of course, from any and all Portfolios to which it may have been assigned. (You may also delete a company by right-clicking on the company and selecting “Delete” from the displayed menu.)
New
Click to create a new Stock Study (Stock Study). The “Stock Study Acquire Data” screen will open with the following button options from
which to select. (NOTE: “New” performs the same function as the
“Stock Study” button on the main toolbar.) See the following for more
information about this function.
·
Open a company that was previously saved in Toolkit. – This
will open the “Select Company Record to Open” window,
which will allow you to select a company from the library of
files you have already worked on.
·
Manual Data Entry from a data source such as Value Line or
S&P Stock Reports. – This will open a blank Data window,
which you can fill in using data from an outside source.
·
Use Subscribed Data Files. – This will open the Company Locator window, where you can type in a company name or ticker,
and download data for that company from either the StockCentral or BetterInvesting data service.
·
Import a data file located on a floppy disk or in a folder on my
computer. This will open a window with the option to locate a
.ITK, .SSG or .ZIP file on your computer. You will be able to
choose the type of file, and the location.
Export
Click on any company in the Stock Library you wish to export, and
then click the “Export” button to export a company file to a location
you specify or have specified. (You may also export a company by
right-clicking on the company and selecting “Export” from the dis-
306
Toolkit 6
played menu.) For more information, refer to the “Export Data” section.
Holdings
Click on any company in the Stock Library, and then Click on “Holdings” to view all the portfolios that stock is assigned to and the number of shares in each.
Portfolios
The Portfolios pane has the following buttons located directly below
its pane:
New
To add a new Portfolio, click the “New” button to open the “Add New
Portfolio” dialog.
1) Enter the Name of the new portfolio.
Toolkit 6
307
2) Enter or accept the typical Tax Rate that would apply on your
gains. (20% is the default value).
3) Select the customary commission paid to the brokerage holding
this portfolio account on your transactions.
4) Click “Ok” to add the new portfolio to the pull down menu listing
the portfolio selections. (See “Portfolio Holdings” below to add
companies to a Portfolio.)
Delete
Select the portfolio you wish to delete from the Portfolio pull-down
menu, and then click the “Delete” button to remove it from the list. If
that portfolio is currently open in the pane below, it will be replaced
with another.
Reports
Select a portfolio, and then click on the “Reports” button to open the
Overview window for that portfolio.
Prices
Assuming you are actively connected to the Internet, clicking on
“Prices” will generate an immediate update to all the prices in the selected portfolio. If the prices displayed in the Update Prices dialog are
satisfactory, click “Ok” to update the prices in your database.
Edit
Click this button to change the name, tax information, and/or brokerage fees for the selected portfolio.
Portfolio Holdings
The Portfolio Holdings pane of the Stock Library allows you to
manage the stocks in selected Portfolio. Selecting the desired portfo-
308
Toolkit 6
lio from the pull-down menu in the Portfolios pane will display it in
the Portfolio Holdings pane below.
Adding companies
The most convenient way to add a company to a selected portfolio is
to right-click the company in the Stock Library and select “Add to
selected portfolio” from the displayed menu. See “Add,” below for
another way to do it.
The Portfolio Holdings pane has the following buttons located directly below it:
Open
Click on any company in the Portfolio Holdings pane, and then click the
“Open” button to open a Stock Study for the highlighted company.
(TIP: Double-clicking the company name is a shortcut to changing
the number of shares of that company in the selected portfolio. It
opens a window to “Change Shares for...” where you can enter the
new number of shares.)
Add
Clicking on the “Add” button opens a “Select Company to Add to
Portfolio” screen, which lists all of the companies in the Toolkit
Stock Library.
You can sort the list by column heading by placing your cursor on the
heading (Company, Ticker, Exchange) and when the cursor changes
to a small down arrow click to sort.
To locate a company in the list, either scroll down to locate it, or you
may quickly type the first few letters of its name. You will be taken di-
Toolkit 6
309
rectly to the company. Click on a company to select it and then enter
the “Number of Shares” you wish to put in the selected portfolio.
If this company is a first-time purchase, it and the number of shares
entered will be placed into the portfolio immediately. If the company
is already in the portfolio, a dialog box will open asking to confirm the
additional shares.
A “Watch List” portfolio can be created by entering “0” as the number of
shares.
Remove
Click on a company in the Portfolio Holdings list to select it, and
then click to on “Remove” to remove a company from the selected
Portfolio. (You may also remove a company from the portfolio by
right-clicking on the desired company and selecting “Remove” from
the displayed menu.)
NOTE: This will remove the selected company from the selected portfolio only. It will not remove it from Toolkit 6 database, the Stock
Library listing, or any other Portfolio. A dialog box opens to confirm
that you wish to remove the stock.
Export
Click on a company to select it then click on “Export” to export a
company to a folder you specify. (You may also export a company
from the portfolio by right clicking on the desired company and selecting “Export” from the displayed menu.) For more information, refer to the “How to Export Data” section.
Change Share Holdings
To amend the number of shares of a company in the selected portfolio, double-click the company listed in the Portfolio Holding. This will
open a “Change Shares for...” window, where you can enter the new
number of shares. (You may also change the number of shares by
310
Toolkit 6
right-clicking on the desired company and selecting “Change the
number of shares” from the displayed menu.)
Challenge
Right-click on any company and select “Challenge” from the displayed menu to immediately invoke the “Smart Challenger.” You will
first need to complete the “Challenge Parameters” dialog, see the
Portfolio Alerts section for details about the Challenge process.
Roster of Quality
For many years the Roster of Quality Companies has been a favorite of
ICLUBcentral users and other fundamental investors as a source of high
quality stock ideas. With the Roster in hand you have a pre-screened list of
companies that meet minimum quality requirements. These stocks are
ranked by their quality, letting you know at a glance which companies are
best suited for further analysis.
In Toolkit 6, for all StockCentral subscribers, all of the companies in the
most recent Roster of Quality will be listed in the Library as a portfolio.
Toolkit 6
311
This listing is locked, which means that you may not add or delete companies from the Roster of Quality. The listing is updated automatically once
a week, and the date of the last update is listed next to the Portfolio Holdings header (“Last updated date”). You may also select File > Update Roster of Quality from the menu to force the program to download the most
recent listing of companies.
When you select the Roster of Quality, the Quality Index is displayed
in the right column next to the company names. The Quality Index is
calculated on a 0 to 10 scale, with 10 indicating the highest quality
companies. Click on the column header to sort the companies by
Quality Index in ascending/descending order.
Company names that appear in red text indicate that these stocks
have not yet been studied and added to your Library. Company
names in black text indicate that you have an existing study of those
companies.
Updating Your Stock Studies
Electronic Data
For electronic updating, it is assumed you have an active connection
to the Internet.
Schedule Updates
Companies report financial results four times per year. Toolkit 6 allows you to schedule reminders for each company to tell you when
data is due to be reported. To schedule these reminders:
1) Click “Preferences” on the main toolbar (Or select it from the Options menu) and then select the Thresholds tab.
2) Under Data Triggers:
·
312
Set the number of days before prices are stale to the number
of days after which you want to be reminded to update prices.
Anywhere between 1 and 7 is nominal.
Toolkit 6
·
Set the Quarterly reminder date to a reasonable value. Companies have 45 days to report after quarterly books close. It
takes about 10 days to 2 weeks to publish results.
·
Set the Annual reminder date to a reasonable value. Companies have 90 days to report after annual books close. It takes
about 10 days to 2 weeks to publish results.
3) Click “Ok.”
Perform Updates
All electronic updates except those invoked from the File > Update
Companies, are “Full Updates” meaning that all data that is carried
into the process by the downloaded data replaces whatever data is
stored in the database. Under the File > Update Companies, you
have the option of making a “Changes Only” update which leaves existing data alone and merely adds any new data to the file. Full updates are preferred because any data that has been restated or has
been initially provided in “preliminary” form will be replaced by the
restated data. Changes Only updates are useful only in cases where
you have an interest in preserving existing data; e.g., if you have
made an effort to amend or alter historical data for some reason and
you don’t want to destroy those amendments.
Update Only Companies with New Data
1) Click on the “Update Data” button in the “Requires Attention”
box on the Home Page when that button is red.
2) Click on “Update All.”
Update an Individual Company
From Home Page
1) Click on “Update Data”
Toolkit 6
313
2) In the “Update Companies” dialog, select a company and click on
the “Update Selected Company” button.
From a Company window (Stock Study, Stock Management Guide,
Quality Trend Analysis):
1) Click on the cluster at the top of the form.
Clicking on “Data” will update the data for that
company. Clicking on “Refresh” will update both
data and price.
From the Overview Screen
1) Select a company.
314
Toolkit 6
2) Click the “Update Data” button to the right of the grid.
From the File Menu
1) Select File > Update Companies.
2) Select the company you wish to update and click the “Add” button
or double-click on the company to move it into the Update space.
3) Select either “Full Update” or “Changes Only.”
4) Click “Ok.”
Toolkit 6
315
Update a Portfolio
From the Home Page
1) Double-click the portfolio you wish to update in the Portfolio Report Card.
2) From the Overview screen that appears, click on the “Update
Portfolio Data” button.
From the File Menu
1) Select File > Update Companies.
2) Select the portfolio you wish to update from the pull-down menu
above the left-hand grid and click the “Add all” button to move all
the stocks in the portfolio into the Update space.
3) Select either “Full Update” or “Changes Only.”
4) Click “Ok.”
From the Overview or Alerts Screen
1) Click on the “Update Portfolio Data” button beneath the grid.
Update the Entire Stock Library.
From the File Menu
1) Select File > Update Companies.
2) Same as portfolio only select “Stock Library” as portfolio to be
updated.
Splits and Stock Dividends
Occasionally, a stock split or stock dividend will have occurred in the
period prior to your update.
316
Toolkit 6
If there has been a split, Toolkit will analyze the existing data and determine if that data has been adjusted to accommodate the split. If it
has not, you will be given the opportunity to accomplish that adjustment with a mouse-click. If you prefer not to do so for some reason,
you may decline and the data will not be updated.
If there has been a split and your data appears to have already been
adjusted, you will be notified of the split as well and simply informed
that your data appears to have been appropriately adjusted.
Inconsistencies Between New and Old Data
Some investors alter the historical data to account for non-recurring
events or other items that they feel should be adjusted to more accurately depict the company’s historical performance. Some sources of
data restate data when some operations have been discontinued. For
these and other reasons, you may wish to use one or the other of the
import options that are available in Toolkit 6.
Toolkit 6
317
If Toolkit detects inconsistencies between the historical data and the
same historical data in the file that is being imported, depending upon the circumstance and the option you have selected, you will be advised of the circumstances and given the opportunity to change your
import option to one more appropriate.
For example, if Toolkit senses a discrepancy and you have elected to
use the “Full Update” option, you will be told that there is a discrepancy and given the opportunity to change to “Changes Only.”
Update Data Manually
To update your Stock Study with the current data, using data
sources such as Value Line or Standard & Poor’s Reports.
1) Open the company you want to update. Refer to the “Open Saved
Stock Study” section if you require additional information.
2) Click on the “Data” button on the Company Toolbar.
3) This opens the “Basic Data” screen where you can [Tab] through
each of the data fields and enter your updated data.
318
Toolkit 6
4) If the company’s data entry fields are locked, click on the “Unlock
Data” button to unlock them so you can update the data.
5) When you are finished updating the “Basic Data,” click on the
“Quarterly Data” tab.
6) In the “Quarterly Data” screen, click on the “Last Quarter of Data”
drop-down menu arrow and select the next Quarter. This will shift the
data up with new blank fields to enter your new quarterly data.
Toolkit 6
319
7) When you are finished updating your data, click “OK.” To save
your new updated data, click the “Save” button on the Company
Toolbar.
If you decide to not update your data at this time, you can close the
“Data For” screen by clicking the in the top right corner. If you entered updated data for the “4th Quarter” of the Fiscal Year and also
have the updated Annual Data, then:
8) Click on the “Annual Data” tab. In the “Annual Data” screen, select the next year from the “Last Full Fiscal Year” drop-down
menu. This will shift the data up with new blank fields for you to
enter the new annual data.
NOTE: If you only have the 4th Quarter data, but do not yet have the
Annual Data, then of course you will only update the Quarterly Data
and not update the Annual Data until this information is available.
320
Toolkit 6
Updating Prices Electronically
It is assumed that have an active connection to the Internet.
All Stocks
From the Home Page
1) Click on “Update Prices” in the “Requires Attention” list. (Or
right-click on “Update Prices” and select “Update All” from the displayed menu.)
2) Click “Update” button at bottom of displayed “Import Prices”
screen after reviewing prices and stock status (“Buy” or “Sell”).
NOTE: To determine which stock prices are not up to date, right-click
on “Update Prices” when it is red, and select “Show Stale Prices.”
Toolkit 6
321
Portfolio
From the Stock Library
1) Click on “Prices” in the toolbar beneath the Portfolio pane.
2) Click “Update” button at bottom of displayed “Import Prices”
screen after reviewing prices and stock status (“Buy” or “Sell”).
From the Overview or Alerts windows
1) Click the “Update Portfolio Prices” button beneath the grid.
Individual Stocks
From any company window (Stock Study, Stock Management
Guide, Quality Trend Analysis, Quality Trend Graph, Annual P/E
Analysis)
1) Click on “Price” in the “Refresh” cluster at the top of the page.
Click on “Refresh” to update both price and data.
From the Overview
1) Click on any company in the grid to select it.
2) Click on the “Update price” button to the right of the grid.
Using a Price File
You may use a price file from Yahoo, Quicken, or some other source to
update your stock prices. (Consult the software product or source for
information about how to export prices from their products.)
322
Toolkit 6
1) Select File > Update Prices > Import Price File.
2) Locate the price file in the displayed dialog box.
3) Select the proper format (Text, CSV, or All Files) from the pulldown menu at the bottom of the dialog box in order to filter out
only the appropriate types of file and make it easier to find.
4) Click “OK” to import the prices.
5) Check the resulting screen to see that the prices have been imported satisfactorily, and the status of each stock (“Buy” or “Sell”).
6) Click “Update” to complete the price update.
Toolkit 6
323
Updating Prices Manually
Individual Company
From any company form (Stock Study, Stock Management Guide,
Quality Trend Analysis, Annual P/E Analysis):
1) Click on the “Data” button in the company toolbar.
2) Enter the new price in the Price field in the upper
right of the Basic Data page.
Multiple Companies
You may update the prices for multiple companies manually
1) Select File > Update Prices > Manually Enter Prices.
2) Enter the new price for each stock in the “New Price” field below the
grid.
324
Toolkit 6
3) To alter the date for any one price, enter the date in the “New Date”
field to the left of the price. Otherwise all prices will be entered with the
default date shown in the upper right corner of the screen.
4) Press {Enter} to move to the next company, the down-arrow to move
down the list, select any company to update with your mouse.
5) When you have finished, click “Ok” to quit updating.
Internet Access
Activation
Web access requires that you have an Internet Web browser installed
on your computer (e.g., Microsoft’s Internet Explorer or Mozilla Firefox), and subscribe to an Internet Service Provider (ISP) through
which you can access the Internet.
Toolkit 6
325
If you use a Proxy Server to access the internet, you will need to
identify it to Toolkit. (Most
people do not use a proxy
server to access the internet, they are most often
used in corporate, municipal, or scholastic networks.)
1) Click on “Preferences”
in the main toolbar and
select the “Internet” tab.
2) Click on the “Enable Advanced Proxy Settings”
checkbox.
3) Enter the Port, Proxy
Server Name, Login ID
and Password and then
click the “OK” button to
complete the process.
How to Set Up Web Destinations
Your Club Web site
1) Click on “Preferences” in the main toolbar and select the “Internet” tab.
2) Click on the “Enable Club Web site” button.
3) Enter the URL for your club, and the name in the labeled boxes.
Your Online Brokerage
1) Click on “Preferences” in the main toolbar and select the “Internet” tab.
2) Enter the URL for your online broker
326
Toolkit 6
How to Open “Internet Access” screen
Access to the Internet is greatly simplified in Toolkit 6. All
access to sites is through the “Web” button on the main
toolbar.
For your convenience, we have provided a number of sites commonly
used for additional research by Toolkit users. You may not edit or delete these web sites, however – we will update them periodically when
updating your software. You may add, edit, or delete any additional
web sites that you enter into the program.
To open the “Internet Access” screen, click on the “Web” button on
the Main Toolbar.” Clicking on any of the selections from the drop
Toolkit 6
327
down list will activate your default browser, and take you to the selected Web site.
Accessing Company Web Sites
1) Click the “Web” button on the Main Toolbar and then click the
Manage Web Links selection from the drop down list to display
the Internet Access dialog.
2) Click the “Companies” tab.
3) Click on a company to highlight it.
4) “Open,” “Edit,” or “Delete” the company by clicking on the respective button.
To Add a Company Address
1) Click “Add” to add a company and its Web site to your list.
2) Enter the Name, Ticker, and URL if you know it. If not, continue
with the steps that follow.
TIP: To add a company’s URL from any open company form,
click the “Web” button, select “Open Company URL” from the
pull-down menu, then click “Yes” when asked if you wish to add
it. It will automatically open the above dialog with the company
name and ticker symbol already entered.
3) Open the company’s home page in your browser.
328
Toolkit 6
4) Highlight the address as shown on the browser’s address field.
5) Press [Ctrl+C] (simultaneously press Ctrl and C) to copy the address to the Window’s clipboard.
6) Use the Taskbar to switch to Toolkit 6.
7) Click in the URL window and press [Ctrl+V] (simultaneously press
Ctrl and V) to paste the contents of the clipboard into the field. The
URL will automatically appear in the URL section of the company’s
Basic Data screen.
Accessing Favorites
1) Click the Web button on the Main Toolbar and then click the
Manage Web Links selection from the drop down list.
Toolkit 6
329
2) Click on the “Favorites” tab.
3) Highlight a Web site and click the “Open” button (or double-click
on the site) to activate your browser.
NOTE: Sites listed with an asterisk (*) are company specific sites and
cannot be accessed from this list. With any company form open, they
will appear on the drop-down list when the “Web” button is clicked.
See below for a discussion of company-specific sites.
How to Add a Favorite Web site
1) Click “Add” to add a Web site to your list of Favorites.
2) Select a name and type the name into the name field.
3) Within the URL field type into the web site address. (e.g.,
www.iclub.com)
How to Edit a Favorite Address
1) Select the company that you wish to edit.
2) Click the “Edit” button.
3) Change the web site address (URL) and/or company name within
the screen that appears.
4) Click the “Ok” button when you are finished.
Company-Specific Sites
How to Access “Company-Specific” Web Sites
NOTE: A company-specific site refers to a Web page on a destination
site that requires you to first access the site and then— usually by
entering a ticker symbol—navigate to the page on that site that is of
interest to you. Toolkit 6 permits you to go directly to that page on
that site from the company you are studying.
330
Toolkit 6
You can access a company-specific site only from a company form
(Stock Study, Stock Management Guide, Quality Trend Analysis,
Quality Trend Graph, Annual P/E Analysis, or Community).
1) With a company open, click on the “Web” button on the main toolbar.
2) Select the desired company-specific site from the pull down menu
that appears.
To Add a Company-Specific Site to the Favorites List:
Addition, deletion, or editing of the company-specific Web sites listed
on the pull-down menu associated with the “Web” button when company forms are displayed follows the same process as other “Favorites” addresses but requires some additional steps.
Toolkit 6
331
1) In the Favorites page, follow the same steps as above to add a conventional address, accessing the desired site in the normal fashion.
2) Enter the ticker symbol for any company in order to access the
company-specific screen on that site.
3) Enter a name for the site in the “Add Address” dialog box, but put
an asterisk in front of the name.
4) Select and copy the address for that site (as described above for a
normal address) and paste it into the address field.
5) Locate the ticker symbol imbedded in the address and replace it
with a dollar sign followed by an asterisk ( $* ). This is the “wild
card” that Toolkit uses to replace with the company’s ticker symbol when you access that Web site.
As an example, if you wanted to add a link to the Boston globe’s
financial section, the site address would look something like this,
if you were looking up Apple:
finance.boston.com/boston/quote?Symbol=AAPL&Go=GO
When adding the web site in Toolkit, you would remove the AAPL
part of that web site address, and replace it with the $*, as described above. The final result would look something like the following:
332
Toolkit 6
To Edit or Delete an address you have added, select that address
from the “Favorites” screen, and click on the appropriate button.
Note that Toolkit will not delete an address until you verify that you
intended that action.
For Advanced Users
Working with Multiple Stock Libraries
Advanced users can use this feature to maintain several Stock Libraries (databases). A Toolkit Library is an individual database file
consisting of:
·
companies and their data
·
judgment
·
notes
·
portfolio assignments
A Library should not be confused with a Portfolio. A Stock Library
may have as many portfolios as the user wishes. These might include
your personal holdings, your spouse’s, your investment club, a hypothetical “watch list” portfolio, etc. Each of these portfolios may have
one or many stocks in common with any other portfolios. When the
data or price is updated for that stock, the update will appear in each
portfolio sharing that stock.
The Library Manager feature permits the use of more than one
Stock Library with its attendant portfolios, where you may wish to
separate stock studies entirely for one or another purpose. For example, you may wish to set up a library for your investment club alone,
with a portfolio of those companies that the club owns, a portfolio
which consists of the club’s “watch list,” and another which consists
of stocks that have been sold.
Toolkit 6
333
You may name Libraries so they are easily identified, e.g., club.mdb.
Note: “.mdb” extension will automatically be added to any club library
file, you do not need to enter it yourself . You may store Libraries in
any location on your hard drive. The location and name of the library
currently in use may be found by clicking on the Preferences button
on the Main Toolbar and then on the File Locations tab.
NOTE: The program’s Update Company and Update Price functions
will affect only the library currently in use. For each library, the
Stock Library represents all of the companies contained within that
particular database.
Activation and Use of Toolkit Databases
This option is for advanced users with a need for multiple Toolkit Databases.
Toolkit 6 is shipped with the tk.mdb library active. It contains some
sample companies that you can practice with. Or, you can add new
libraries for your use as described below.
Activate the Library Manager
1) Click on the Preferences button on the Main Toolbar (Or from the
Options menu).
2) Selecting the General tab.
3) Click on “Enable Advanced Library Options.”
4) Click “OK” to close the Preferences window; you will now see a Library menu between the Edit and Options menus.
5) Select Library > Library Manager to make use of the functions
described below.
334
Toolkit 6
NOTE: Update Company and Update Price functions only affect the
active database.
Open or Change to an Existing Library
1) Click on the button labeled, “Open a previously created Toolkit
library.”
2) Navigate to the location where the desired library may be found,
select it, and click “OK.”
To save the current library with a new name:
1) Click on the button labeled “Save a copy of the current library.
Toolkit will then use that copy.”
2) Accept or change the name of the library. (The “.mdb” extension
will be added automatically.)
NOTE: The library you have been using will be stored where it is and
you will now be using a new copy of that database.
Toolkit 6
335
Create a New Library
1) Click on the button labeled “Create a new blank library. Toolkit
will use the blank library.”
2) Accept or change the location. Be sure to remember this location.
3) Accept or change the file name. (The “.mdb” file extension will be
added automatically.)
Export a Library
See “Advanced Data Export” above to share your stock library or
stock within it with others.
336
Toolkit 6
Advanced Portfolio Review Estimated EPS
On the Portfolio Review report, any Toolkit 6 calculated “Est. EPS”
replaced by the user with an estimate from another source will appear
crossed out, with the user’s estimate appearing below. This value will
be used in all calculations requiring estimated EPS. Changing “Est.
EPS” only affects the Portfolio Review form.
How to Change Estimated EPS in Portfolio Review
In order to be able to access and use this feature, it must be enabled
in Preferences > General (Enable Editing of Portfolio EPS).
1) Click on the Portfolio button on the Main Toolbar.
2) Select a Portfolio and then click OK to display the Overview. Click
the Reports button to open the Portfolio Review form.
Toolkit 6
337
3) Click the Edit EPS button on the Portfolio Review Toolbar.
4) “Override Calculated Estimates for EPS” screen will appear with
a list of companies in the portfolio.
5) Highlight the company who’s one-year “Est. EPS” you want to
change.
6) At “Type Est.” select “User” to place your estimate in the Portfolio
Review. Select “Calculated” to restore the “Est. EPS” calculated by
Toolkit.
7) Enter the new one-year estimated EPS from your other source in
the space provided. Although not required, you should also enter
the date and source of your estimated EPS for future reference.
8) Click Close.
How to Restore Toolkit EPS Calculations
To restore Toolkit’s “Est. EPS” calculations:
1) For individual companies, return to steps 3 through 7 above. Ensure that “Calc” appears in the “Type Est.” column for each company changed. On the Portfolio Review form, no cross out will
appear in the “Est. EPS” column for any companies using
Toolkit’s calculation of estimated EPS.
2) For all companies, click Preferences > General tab and uncheck
the “Enable Editing of Portfolio EPS” check box.
Database Utilities
How to Back up your Stock Library (Database)
1) Close any companies that you have open.
2) Click on the “Database” button on the Main Toolbar.
3) In the “Database Utilities” screen, click on the
338
Toolkit 6
“Backup your Toolkit Database” button.
4) Using the drop-down menu, select where you want to back up you
Stock Library, i.e., on a floppy disk on the A:\ drive, someplace
on your C:\ drive, or to an external drive attached to the computer. Choose the drive and folder, then click “OK.” When your Stock
Library database has been backed up, an information screen will
inform you that the “database was successfully backed up.”; you
will find a file named TK.ITB in the location that you selected for
the backup.
Toolkit 6
339
5) Remove the disk(s) and store in a safe place.
How to Restore Your Backed-Up Database
1) Close any companies that you have open.
2) Click on the “Database” button on the Main Toolbar.
3) In the “Database Utilities” screen, click on the “Restore a Database” button.
4) In the “Restore Database” screen, using the drop-down menu, select the location from which you want to restore your Stock Library, and click “OK.”
NOTE: You cannot have more than one library with the same name in
your Toolkit 6 folder. If the file you are restoring has the same name
as one in your Toolkit 6 folder, you will be warned that it will be
overwritten if you proceed. Cancel the restore procedure and copy
that file into a safe place before beginning the process again if you
want to save that file.
The database of Internet Web site URLs in your Toolkit’s “Internet Access” was also backed up when you backed up your Stock Library.
You will receive an information box asking if you want to restore and
overwrite your current Internet URL database.
340
Toolkit 6
Compacting your Stock Library Database
As the size of your Stock Library increases, you should compact it periodically in order to help increase the speed of opening companies.
To compact a Stock Library:
1) Close any companies that you have open.
2) Click on the “Database” button on the Main Toolbar
3) Click on the “Compact Database” button.
4) The database will quickly be compacted and you will see a “database compacted successfully” information box.
Toolkit 6
341
USER LICENSE AND
SUPPORT AGREEMENT
Use of this product is governed by terms of a User License and support Agreement or ULSA. The User License
and Support Agreement that appears during installation is reproduced below for your convenience. References to clicking on “Accept” are to an installation procedure. The text below is the same as the text seen at
installation. Some formatting is different here to make it easier to read on a printed page.
User License and Support Agreement or ULSA (Applicable to ICLUBcentral TOOLKIT 6 Software)
Important: By clicking on “Accept”, you indicate your acceptance of the terms and conditions set forth below.
THIS LICENSE AND SUPPORT AGREEMENT (THE “AGREEMENT”) IS A LEGAL CONTRACT BETWEEN YOU
IN YOUR INDIVIDUAL CAPACITY, AS (“YOU”) AND ICLUBCENTRAL, INC. (“ICLUBCENTRAL”). BY CLICKING
ON “ACCEPT”, YOU ARE AGREEING TO BE BOUND BY THE TERMS AND CONDITIONS OF THIS AGREEMENT, INCLUDING WITHOUT LIMITATION THE CUSTOMER SUPPORT PROVISIONS SET OUT BELOW. IF
YOU DO NOT AGREE TO SUCH TERMS AND CONDITIONS, YOU MUST PROMPTLY RETURN THE SOFTWARE AND THE DOCUMENTATION TO ICLUBCENTRAL’S SOFTWARE DISTRIBUTOR, IN ORDER TO RECEIVE A FULL REFUND OF THE LICENSE AND CUSTOMER SUPPORT FEES THAT YOU HAVE PAID. If You
should have any difficulty in obtaining such refund, please contact ICLUBcentral at 1430 Massachusetts Avenue, 3rd Floor, Cambridge, MA 02138.
THE ENCLOSED COPY OF ICLUBCENTRAL TOOLKIT 6 SOFTWARE, INCLUSIVE OF ALL ADD-ONS AND FUTURE RELEASES (the “SOFTWARE”), AND THE RELATED DOCUMENTATION, INCLUSIVE OF ALL FUTURE
RELEASES (the “DOCUMENTATION”), ARE EACH LICENSED TO YOU WITH A PERSONAL, NON-EXCLUSIVE
AND NON-TRANSFERABLE RIGHT, EXCEPT AS ALLOWED BELOW UNDER ‘PERMITTED USES’, TO USE
ONLY UNDER THE FOLLOWING TERMS AND CONDITIONS:
PERMITTED USES
You MAY:
Install the Software on a storage device in Your computer, as set forth in the instructions contained in the
Documentation. Note: The Software has been designed to only allow it to be used for a single individual on up
to two personal computers. You may make only one (1) copy of the Software, provided that
i.
such copy is used only for back-up purposes;
ii.
You retain possession of the back-up copy; and
iii.
all of the information appearing in the copyright notice on the label of the storage medium in the
sealed package is copied onto the label of the storage medium for the back-up copy.
NON-PERMITTED USES
You MAY NOT:
·
Make any copies of the Software, except as permitted above with respect to the one (1) back-up
copy, or allow transfer of the Software to another individual.
342
Toolkit 6
·
·
·
·
·
·
Make any copies of the Documentation.
Disclose, rent, license, sublicense, lease, sell, lend, disseminate or otherwise distribute the Software or the Documentation.
Network the Software or otherwise use it on more than one computer or computer terminal at the
same time.
Use the Software to conduct a service bureau, application service provider (“ASP”) business or similar business for the benefit of third parties.
Transfer Your rights under this Agreement.
Alter, enhance, supplement, create derivative work therefrom, translate, decompile, disassemble,
reverse engineer or otherwise reduce the Software to human readable form.
Remove or obscure the copyright and trademark notice on the label of the storage medium containing the
Software or in the Documentation.
TERMINATION / DURATION
This Agreement and Your license to use the Software and the Documentation will automatically terminate
without notice from ICLUBcentral and without any pro rata abatement of the license and customer support
fees You have paid if You fail to comply with any term or condition of this Agreement or upon your giving written notice of termination to ICLUBcentral.
This Agreement is effective from the day upon which You indicate acceptance of this Agreement. In order to be
granted license to use this Software, you must register this Software fully and accurately with ICLUBcentral
and receive a valid confirmation of registration from ICLUBcentral. The license then granted will continue until either
(i)
You terminate this Agreement by giving written notice of termination to ICLUBcentral; or this
Agreement is terminated by ICLUBcentral, as provided in the immediately preceding paragraph.
TECHNICAL SUPPORT PROVISIONS
Included in the total fee that You have paid for the Software and the Documentation is an amount that covers
the customer support services described in this Agreement (the “Technical Support Services”). (You can reference the information on accessing Technical Support Services and the term and duration of Technical Support Services provided with the Documentation.) The terms of these Technical Support Services are subject to
change without notice. Technical Support Services cover technical questions about operation of the Software
only.
Technical Support Obligations of ICLUBcentral:
Provide customer support for the Software only if (i) You have performed the online Product Registration as
provided by ICLUBcentral in order to register the Software; and (ii) Your copy of the Software is identified with
a valid serial number, and Registration Code.
Investigate and identify any problem reported by You to ICLUBcentral that is related to the then current release of the Software, and correct or provide within an appropriate time, as determined by ICLUBcentral, either (i) a workaround for any programming error in the then current release of the Software which You have
identified, provided that the error is directly attributable to ICLUBcentral, or (ii) a resolution to the problem
which You have identified (collectively the “Code Correction Services”).
Related Obligations of End-User:
Use only the then current release of the Software during the initial and any renewal term of this Agreement.
Toolkit 6
343
In the event of (i) a problem with the Software that results in either a system crash or loop; or (ii) a situation
where You can reasonably demonstrate that the Software produces an erroneous result that is not a function
of incorrect or improper input data, then You must submit to ICLUBcentral a written report of all input and
keystrokes to the Software giving rise to the problem to the extent reasonably practical.
LIMITED WARRANTY
ICLUBcentral does not have control over the conditions under which You use the Software and does not and
cannot warrant the performance or results that may be obtained by its use. However, ICLUBcentral warrants
that the Software will perform substantially in accordance with the Documentation for a period of ninety (90)
days from the date the product was shipped to You, provided that the Software is used on the computer
equipment, operating system and in the environment for which it was designed and configured. Your sole
remedy and ICLUBcentral ‘s exclusive liability under the foregoing limited warranty will be the furnishing by
ICLUBcentral, within a reasonable period of time and without charge, of the Technical Support Services pursuant to the Technical Support Services provisions of this Agreement. To bring a claim under this limited warranty, You should contact the Technical Department at ICLUBcentral, 1430 Massachusetts Ave, Cambridge,
MA 02138 to obtain information on warranty performance; You must be given a Return Authorization Number
by ICLUBcentral before returning the Software to ICLUBcentral. Some jurisdictions do not allow the exclusion
or limitation of relief, incidental or consequential damages, so the above limitation or exclusion may not apply
to You.
Because computer programs are inherently complex, You are advised to always verify Your work and periodically (after each use) back up the data You have created with the Software.
ICLUBcentral does not warrant that any of the Software, the Documentation or Technical Support Services to
be provided pursuant to this Agreement will meet Your requirements. The only warranty made with respect to
the Software is the limited warranty set forth in this Agreement.
EXCEPT AS SO SPECIFICALLY PROVIDED ABOVE IN THE IMMEDIATELY PRECEDING PARAGRAPH, THERE
ARE NO WARRANTIES, REPRESENTATIONS, OR CONDITIONS MADE BY ICLUBCENTRAL OR ANY OTHER
PERSON INVOLVED IN THE CREATION, PRODUCTION OR DISTRIBUTION OF THE SOFTWARE, THE DOCUMENTATION OR THE CUSTOMER SUPPORT SERVICES, EITHER EXPRESS OR IMPLIED, WITH RESPECT
TO THE SOFTWARE, THE DOCUMENTATION, ANY RELEASES THERETO, OR THE CUSTOMER SUPPORT
SERVICES INCLUDING THEIR RESPECTIVE QUALITY, PERFORMANCE, MERCHANTABILITY, FITNESS FOR
A PARTICULAR PURPOSE OR NON-INFRINGEMENT. Notwithstanding the above, where applicable, if You
qualify as a “consumer” under the Magnuson-Moss Warranty Act, then You may be entitled to any implied
warranties allowed by law for the period of the express warranty as set forth above. Some states do not allow
limitations on how long an implied warranty lasts, so the above limitation may not apply to You. This warranty gives You specific legal rights, and You may also have other rights which vary from state to state.
LIMITATIONS OF LIABILITY; INDEMNIFICATION
NEITHER ICLUBCENTRAL, NOR ANY OTHER PERSON INVOLVED IN THE CREATION, PRODUCTION, OR
SUPPORT OF THE SOFTWARE, THE DOCUMENTATION OR THE TECHNICAL SUPPORT SERVICES WILL BE
LIABLE TO YOU OR ANY THIRD PARTY ARISING OUT OF THIS AGREEMENT AND/OR YOUR USE OF OR
INABILITY TO USE THE SOFTWARE, THE DOCUMENTATION OR THE TECHNICAL SUPPORT SERVICES,
REGARDLESS OF THE FORM OF THE CLAIM OR ACTION, THAT EXCEEDS THE PORTION OF THE FEE YOU
HAVE PAID FOR THE SOFTWARE, THE DOCUMENTATION OR THE TECHNICAL SUPPORT SERVICES, AS
THE CASE MAY BE.
NEITHER ICLUBCENTRAL, NOR ANY OTHER PERSON INVOLVED IN THE CREATION, PRODUCTION, OR
DISTRIBUTION OF THE SOFTWARE, THE DOCUMENTATION OR THE TECHNICAL SUPPORT SERVICES
WILL BE LIABLE TO YOU OR ANY THIRD PARTY FOR ANY SPECIAL, INCIDENTAL, CONSEQUENTIAL, EXEMPLARY DAMAGES OR OTHER INDIRECT DAMAGES OR LOSS OF PROFITS, LOSS OF DATA OR LOSS OF
USE DAMAGES ARISING OUT OF
i.
ii.
344
THIS AGREEMENT; AND/OR
THE MANUFACTURE, SALE, SUPPLYING OR FAILURE OR DELAY IN SUPPLYING OF THE SOFT-
Toolkit 6
WARE, THE DOCUMENTATION OR THE TECHNICAL SUPPORT SERVICES RELATED THERETO,
EVEN IF ICLUBCENTRAL HAS BEEN ADVISED OF THE POSSIBILITY OF SUCH DAMAGES.
Some jurisdictions do not allow the exclusion or limitation of special, incidental, consequential, indirect or exemplary damages, or the limitation of liability to specified amounts, so the above limitations or exclusions
may not apply to You.
YOU AGREE TO INDEMNIFY AND HOLD ICLUBCENTRAL AND ALL OF THE PERSONS INVOLVED IN THE
CREATION, PRODUCTION, OR DISTRIBUTION OF THE SOFTWARE, THE DOCUMENTATION AND THE CUSTOMER SUPPORT SERVICES HARMLESS FROM CLAIMS AND DAMAGES OF ANY TYPE WHATSOEVER
ARISING FROM ANY THIRD PARTY AS A RESULT OF YOUR USE OF THE OUTPUT FROM, AND/OR YOUR
INABILITY TO USE THE SOFTWARE OR AS A RESULT OF ANY TECHNICAL SUPPORT SERVICES PROVIDED
OR TO BE PROVIDED UNDER THIS AGREEMENT.
GEOGRAPHIC LIMITATION
ICLUBcentral Technical Support Services cannot be provided at the same level to customers outside of the
continental United States, Hawaii and Alaska. ICLUBcentral’s website is available to customers anywhere in
the world. Email support will be provided, on a best efforts basis, to foreign customers, but only in English. It
is understood that the ICLUBcentral products have been developed for the U.S. marketplace.
U.S. GOVERNMENT RESTRICTED RIGHTS
The Software and Documentation are “commercial computer software” or “commercial computer software
documentation.” Absent a written agreement to the contrary, the U.S. Government’s rights with respect to
such Software or Documentation are limited by the terms of this Agreement, pursuant to FAR ‘ 12.212(a)
and/or DFARS ‘ 227.7202-1(a), as applicable.
GENERAL PROVISIONS
The Software, the Documentation, and all releases thereto are licensed to You by ICLUBcentral, and are protected by United States copyright laws and by international treaty provisions. Title to the Software and the
Documentation, and patents, copyrights and all other property rights applicable thereto, shall at all times remain solely and exclusively with ICLUBcentral and its licensors, and You shall not take any action inconsistent with such title. Therefore, except for the permitted right to make one (1) back up copy of the Software,
You must treat the Software and the Documentation like any other copyrightable material and are precluded
by law from making any copies of them. Any rights not expressly granted herein are reserved to ICLUBcentral
and its licensors.
The rights and obligations under this Agreement will be governed by, and any arbitration or court action
hereunder shall apply, the laws of the Commonwealth of Massachusetts, excluding its conflicts of law rules,
and will not be governed by the United Nations Convention of Contracts for the International Sale of Goods,
the 1974 Convention on the Limitation Period in the International Sale of Goods (the “1974 Convention”) and
the Protocol amending the 1974 Convention, done at Vienna April 11, 1980, the application of which is expressly excluded.
Any dispute, controversy or claim arising out of or relating to this Agreement or to a breach hereof, including
its interpretation, performance or termination, shall be resolved in the courts of Massachusetts.
The parties irrevocably submit to the exclusive jurisdiction of the federal and state courts of Massachusetts.
Notwithstanding anything contained in this paragraph to the contrary, ICLUBcentral shall have the right to
institute judicial proceedings against You or anyone acting by, through or under You, in order to enforce
ICLUBcentral’s rights hereunder through reformation of contract, specific performance, injunction or similar
equitable relief.
Toolkit 6
345
If any term or condition in this Agreement is invalid or unenforceable in any respect under any applicable
statute or rule of law, then such term or condition is modified to have the most nearly similar permissible
economic or other effect in order to be valid and enforceable under such applicable statute or rule of law.
YOU ACKNOWLEDGE THAT YOU HAVE READ THIS AGREEMENT, UNDERSTAND IT, AND AGREE TO BE
BOUND BY ITS TERMS AND CONDITIONS. YOU FURTHER AGREE THAT THIS AGREEMENT IS THE COMPLETE AND EXCLUSIVE STATEMENT OF THE RELATIONSHIP BETWEEN YOU AND ICLUBCENTRAL, AND
SUPERSEDES ALL PRIOR OR CONTEMPORANEOUS PROPOSALS, ORAL OR WRITTEN, UNDERSTANDINGS,
REPRESENTATIONS, CONDITIONS, WARRANTIES, AND ALL OTHER COMMUNICATIONS BETWEEN YOU
AND ICLUBCENTRAL OR BETWEEN YOU ANY OTHER PERSON INVOLVED IN THE CREATION, PRODUCTION OR DISTRIBUTION OF THE SOFTWARE, THE DOCUMENTATION OR THE CUSTOMER SUPPORT SERVICES; AND THIS AGREEMENT MAY NOT BE EXPLAINED OR SUPPLEMENTED BY CUSTOM OR USAGE OF
TRADE OR ANY PRIOR COURSE OF DEALINGS BETWEEN YOU AND ANY OTHER PERSON.
IF THERE ARE ANY CONCERNS REGARDING THIS AGREEMENT, PLEASE CONTACT: ICLUBCENTRAL, 1430
MASSACHUSETTS AVE, 3rd FLOOR, CAMBRIDGE, MA 02138.
346
Toolkit 6