1
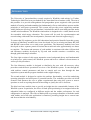
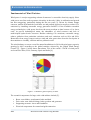
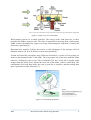
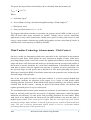
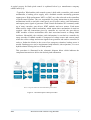
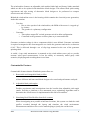
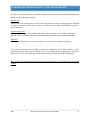
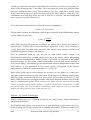
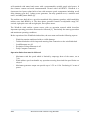
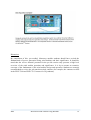
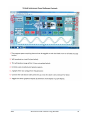
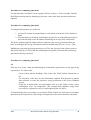
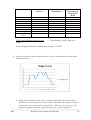
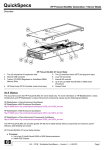
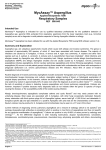
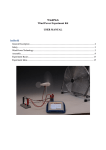
LABORATORY MODULES FOR WIND TURBINE EXPERIMENTS USING THE WINDLAB FACILITY AT THE UNIVERSITY OF QUEENSLAND Mike Evrat and Rahul Sharma School of Information Technology and Electrical Engineering Power and Energy System The University of Queensland St Lucia, QLD Copyright Statement: These experiments are prepared based on the WindLab manual for their facility and as such the copyright remains with Turbine Technologies, USA. To run these experiments the user needs access to a WindLab facility. This module cannot be made publicly available. 2015 Wind turbine lab modules using WindLab 1 TABLE OF CONTENTS Introduction .............................................................................................................................. 3 Background Information .......................................................................................................... 4 Fundamentals of Wind Turbines .............................................................................................. 4 Wind turbine technology advancements – Pitch control .......................................................... 6 WindLab by Turbine Technologies .......................................................................................... 8 Overview ................................................................................................................... 8 WindLab Components ............................................................................................... 8 Customisable Features .............................................................................................. 9 Calibration of WindLab meters ...............................................................................................10 Laboratory Modules Structure and Overview .........................................................................11 Pre-Lab ....................................................................................................................................13 Laboratory Module #1: System Familiarisation ......................................................................18 Worksheet .................................................................................................................19 Step through guide ....................................................................................................21 Sample Solutions .......................................................................................................29 Laboratory Module #2: System Analysis ................................................................................35 Worksheet .................................................................................................................36 Step through guide ....................................................................................................39 Sample Solutions ........................................................................................................42 Laboratory Module #3: Blade Pitch Positioning Analysis ......................................................46 Worksheet .................................................................................................................47 Step through guide .....................................................................................................49 Sample Solutions .............................................................................................................................. 52 References .......................................................................................................................................... 56 2015 Wind turbine lab modules using WindLab 2 INTRODUCTION The University of Queensland has recently acquired a WindLab wind turbine by Turbine Technologies which has been part funded by the Australian Power Institute (API). The aim of this purchase is to provide undergraduate and postgraduate power engineers with a practical method of learning and understanding the fundamentals of how wind turbines operate and the principals of wind power generation. This system will provide power engineering students with a platform to develop, test and simulate a wind turbine and its associated generator under variable wind conditions. The WindLab wind turbine is designed to be a viable, hands-on tool for renewable wind energy education. The system will be used for experimentation and research along with studies into aerodynamics, structures and electrical engineering [1]. To ensure that UQ engineers get the full educational and practical benefits from this system, six hours of laboratory modules have been developed for use in existing and future BE, ME and BE/ME courses that cover wind power generation. The laboratory modules have been developed as three separate practical sessions that would each take approximately two hours to complete. The format and structure of each module is consistent with other API practical and laboratory modules developed by UQ and each module contains a worksheet, step through guide and sample solutions. The first eight sections of this report summarise some background theory and fundamentals on wind power, pitch control, the WindLab system and how to calibrate relevant meters as well as pre-lab procedures. The first laboratory module is designed to familiarise the user with all necessary safety procedures and the basic operational overview of the WindLab system. It runs through the wind turbines control parameters and how to sample and save data through the data acquisition system and the program installed on the supplied laptop. The second module is designed to explore the turbines functionality, reveal the underlying operating principles and wind power’s potential benefits. The worksheet provides real world scenarios and instructs the user to gather experimental data using this system to answer questions as well as requiring theoretical knowledge to justify the user’s decisions. The third two hour module aims to provide an insight into the customisable features of the WindLab system. In particular, the effect of blade pitch positioning is investigated where the adjustable blades are configured at different angles and the turbine performance for each configuration is analysed. The effect of blade pitch on system performance of both the model wind turbine and a full scale application is examined, providing insight into a current issue and focus within the wind industry. 2015 Wind turbine lab modules using WindLab 3 BACKGROUND INFORMATION Fundamentals of Wind Turbines Wind power is a major supporting column of tomorrow’s renewable electricity supply. Since wind power was first used to generate electricity in the early 1900s, its utilisation and growth has been staggering, particularly during the last ten years [2]. Driven by climate change concerns, nations all around the world have set and pursued aggressive targets to reduce CO2e emissions by installing renewable energy generation facilities. Of the available renewable energy technologies, wind power has been the most prevalent to date because of its lower costs, its proven technological status, the abundance of wind resources and lack of undeveloped hydro-electric resources. Besides reducing CO2 emissions, renewable energy reduces pollution from particulate emissions and toxic emissions such as SOx and NOx. Renewable clean energy sources such as wind and solar power have been the focal point in the transition to a healthy, efficient and less polluted world. The wind industry set a new record for annual installations in 2014 with wind power capacity growing by 44% according to the global statistics released by the Global Wind Energy Council [3]. Figure 1 below shows that almost 70% of the world’s 370GW of wind power are located in China, USA, Germany, Spain and India [4]. Figure 1- Cumulative global capacity in 2014. The essential components for large scale wind turbines include [5]: • • • • 2015 Rotor: rotor blades, aerodynamic brake and hub. Drive train: rotor shaft, bearings, brake, gearbox and generator. Supporting structure: tower and foundation. Electrical components for control and grid connection. Wind turbine lab modules using WindLab 4 Source: http://www.alternative-energy-tutorials.com/wind-energy/wind-turbine-design.html Figure 2- Inside view of a wind turbine Wind turbines operate on a simple principle. The energy in the wind turns two or three propeller-like blades around a rotor. The rotor is connected to the main shaft, which rotates within a stator surrounded by copper wire loops. Electromagnetic induction is created and electricity is generated [6]. Horizontal axis turbines sit high atop towers to take advantage of the stronger and less turbulent wind at 100 feet (30 meters) or more aboveground [4]. A blade acts much like an airplane wing. When the wind blows, a pocket of low-pressure air forms on the downwind side of the blade. The low-pressure air pocket then pulls the blade toward it, causing the rotor to turn. This is called lift. The force of the lift is actually much stronger than the wind's force against the front side of the blade, which is called drag. The combination of lift and drag causes the rotor to spin like a propeller, and the turning shaft spins a generator to make electricity [7]. Source: http://science.howstuffworks.com /environmental/green-‐ science/wind-‐power3.htm Figure 3- Lift and drag illustration 2015 Wind turbine lab modules using WindLab 5 The power developed from a wind turbine can be calculated from the formulae [8]: ! 𝑃!"!#$ = ! . ρ.Av3Cp Where, ρ – Air density, kg/m2 A – Area of blade coverage, determine through knowledge of blade length, m2 v – Wind speed, m/sec Cp - Power coefficient where Cp,max = 0.59. The largest wind turbine currently in operation can generate around 3MW on land or up to 5 MW off shore where larger structures are feasible. Turbines can be used as stand-alone applications, or they can be connected to a utility power grid. For utility-scale sources of wind energy, a large number of turbines are usually built together to form a wind farm [4] which, in Australia, have a total capacity of 60MW to 300MW. Wind Turbine Technology Advancements – Pitch Control One key variable for determining wind power generation is the wind speed at the locations chosen for wind farms. Wind speeds are more consistent at heights of some 100m above prevailing hilltops which is one of the reasons for sighting wind turbines on tall towers along ridges and above cliffs. Research and studies are performed into the average wind profiles of the location to test the feasibility for a wind farm establishment. If determined suitable, this wind data is used to select the optimal size generator to optimise its power generation over the expected range of wind speeds and to maximise its time spent generating rated power. Wind speed controls the RPM of the blades connected to the generator rotor and thereby the electrical output of the generator. One of the focal points of today’s wind power industry is to devise control methods that automatically moderate the generator power output, over a range of wind speeds whilst ensuring generator protection. Wind turbine blade pitch positioning is the primary method currently used for this control. Altering the pitch of the turbine blades, can optimise and regulate generated power for a given wind speed. The wind turbine pitch control system changes the incidence of rotor blades in a wind turbine based on real-time wind speed for the purpose of adjusting output power, achieving higher utilization and efficiency of wind power and providing protection for rotor blades. When wind speed is not higher than the rated speed, the blade incidence stay near the angle 0° (highest power point). When wind speed is higher than the rated speed, the pitch control mechanism changes blade incidence so that the generated power remains within the allowed range. This acts as both an optimisation control feature as well as a protection method preventing runaway states of the generator [14]. 2015 Wind turbine lab modules using WindLab 6 A typical process for blade pitch control is explained below by a manufacturer company called Farnell [14]: “Typically a Wind turbine pitch control system is built with a controller, pitch control mechanisms, a backup power supply, and a feedback module monitoring generator output power. High performance MCUs or DSCs are often selected as the controllers of pitch control systems. They are responsible for giving instructions to pitch control mechanisms based on real-time wind speed, pre-set power rating, pitch information, and output power signal of generator. Pitch control mechanisms are commonly made up of rotary encoders, gate drivers, IGBT modules and servo motors. Each motor blade needs a single control mechanism, which means three mechanisms in total are required. After the instructions given by controller are received, the gate drivers, IGBT modules of these mechanisms drive their associated motors to change blade incidence. Meanwhile, the real-time pitch information is sent back to controller by rotary encoders. Feedback module is composed of voltage sensor and current sensor which the collect voltage and current signals from generator and send to controller. In order to feather the blades in the event of an emergency situation, backup power is needed. Backup power can be implemented with batteries, ultra-capacitors, or even a hybrid solution offering the best of both options.” This procedure is illustrated in the schematic diagram below which indicates the component interaction to deliver the desired pitch automation. Source: http://au.element14.com/wind-turbine-pitch-control Figure 4- Automated pitch control procedure 2015 Wind turbine lab modules using WindLab 7 WINDLAB BY TURBINE TECHNOLOGIES Overview Turbine Technologies is a company located in the United States which manufactures educational laboratory products. As explained on its website [9], “The WindLab wind turbine is an electrical power plant generation system which serves as a perfect learning tool for any research lab or learning environment. WindLab is housed in a self-contained wind tunnel and comes with a programmable variable speed wind source. It also features custom on-board instrumentation created with LabVIEW™. WindLab is a classroom-sized power plant built to last with aerospace grade components including an all alloy planetary gear box, 3-phase power generator, cut-away gondola cover, a stainless steel tower, and ABS plastic blades.” The WindLab wind turbine system comes with an operation manual which describes important operating procedures that must be followed. Particularly the start-up procedure and maximum operating conditions. Before operation of the WindLab wind turbine, the user must confirm the following aspects: -‐ -‐ -‐ -‐ -‐ Wind fan remains unadjusted with no visible damage. Turbine blades have been inspected ensuring firm connection to the wind blade hub. Load Rheostats are off. Excitation Voltage Rheostat is off. DAQ Computer connected. Operation limits that must be followed: -‐ -‐ -‐ Maximum wind fan speed is limited by amperage draw of the motor, which is 7.8A. Wind turbine speed can handle any operation assuring that wind fan speed limits are obeyed. Maximum generator output can provide up to 2.5V at 0.12 A. Producing 0.5 watts of power. WindLab Components The following components description has been adapted from the Operational user manual supplied with the WindLab Turbine [1]. 2015 Wind turbine lab modules using WindLab 8 The wind turbine features an adjustable pitch turbine blade hub and factory blades attached which are able to be replaced with alternative blade designs. This allows blade pitch setting experiments and also testing of alternative blade designs to be performed to compare effectiveness and efficiency. Behind the wind turbine rotor is the housing which contains the electrical power generation, inside this contains: -‐ -‐ Gear box o Due to slow speeds of the wind turbine, the RPM of the motor is ‘stepped up’ by 4 times. o The gearbox is a planetary configuration. Generator o Three-phase output DC excited generator wired in delta configuration. o Connected to the generator are three-phase wye connected loads. Generator excitation voltage is also a component which is user defined. Generator excitation is required to magnetise the electromagnetic core inside the generator and can be set between 0-14V. This is delivered through a set of slip rings mounted at the rear of the generator spinning shaft. A scaled, 4 cup wind anemometer is mounted on the wind turbine tower pole to provide accurate wind speed measurements. It has the ability to accurately model gusty wind scenarios, displaying and recording them in real time. Customisable Features Customisable features that the WindLab system offers are: 1. Removable and changeable blade profiles Allows different and innovated blade designs to be tested and performance analysed. 2. Adjustable blade pitch angles Enables experiments and investigations into the benefits that adjustable pitch angle entails. Provides a platform to test automated power optimising algorithms and to determine the effectiveness for implementation into full scale turbines. 3. Simulating Real Wind Profiles from Set Locations When investigating new possible wind farm locations, this system can load the wind profiles recorded through the laptop and simulate the wind environment. Measurements and discoveries can be made helping to justify the end decision. 2015 Wind turbine lab modules using WindLab 9 CALIBRATION OF WINDLAB METERS The settings of voltmeters and the ammeters installed on WindLab can be adjusted by following the following steps: Press the P and up arrow at the same time CAL should start flashing Press the P again bhi should start flashing press and hold the down arrow till it reads 0.500 Press the P button blo will appear press the down arrow till it reads 0.000 Press the P button dp will appear press the down arrow until it reads 0.000 Press the P button br will appear Press the P button An hi will appear press the up arrow until it reads 9.999 Press the P button An lo will appear press the down arrow until it reads 0.000 Press the P button until it resets itself *All the meters are on default in a locked position. To unlock, the jumped wire located on the back must first be removed* 2015 Wind turbine lab modules using WindLab 10 LABORATORY MODULES STRUCTURE AND OVERVIEW The three, two-hour laboratory modules developed each contain three individual documents which has the following purposes: Worksheet: Outlines the aims and objectives of the following practical session. Asks questions designed to engage interaction between the student’s theoretical knowledge and WindLab system to derive solutions. Step through Guide: Indicates all the required procedures and safety steps necessary for a complete guided run through of the worksheet and operational instructions needed to operate the wind turbine. Solutions: Provides detailed answers to questions asked for marking and comparison purposes. To provide the theoretical knowledge required for completion of the three modules, a ‘Prelab’ document has been supplied for the user’s pre reading before beginning the practicals which covers basic wind power principles and an analysis of the WindLab components. The ‘pre-lab’ document and the three laboratory modules have been attached in the following section. 2015 Wind turbine lab modules using WindLab 11 PRE-LAB 2015 Wind turbine lab modules using WindLab 12 PRE-LAB Laboratory Module: Preparation Aim: After completing the pre-lab students should acquire necessary theoretical information required to complete the succeeding laboratory modules on the WindLab wind turbine System. Objectives: Students should be able to demonstrate the understanding of the operational details of the WindLab laboratory equipment, the interfaces that will be controlled and the theory supplied in this pre-lab. Lab Requirements: -‐ Operational Manual - WindLab Wind Turbine Electrical Generation System Background Information - Wind Energy: Wind power is a major pillar of tomorrow’s energy supply. Since the first developments of using wind power for electricity generation in the early 1900s, the utilisation and growth in this field has been flourishing [2]. Due to nations all around the world suffering from pollution and toxic emissions, renewable clean energy sources such as wind has been the focal point to convert to a healthy, efficient and less polluted world. The wind industry set a new record for annual installations in 2014 with increasing market growth by 44% according to the global wind market statistics released by the Global Wind Energy Council [3]. A global net capacity roughly 370GW is the current statistic [4]. The essential components for large-scale wind turbines incorporating grid connection include [5]: • • • • Rotor: rotor blades, aerodynamic brake and hub. Drive train: rotor shaft, bearings, brake, gearbox and generator. Supporting structure: tower and foundation. Electrical components for control and grid connection. Wind turbines operate on a simple principle. The energy in the wind turns two or three propeller-like blades around a rotor. The rotor is connected to the main shaft, which spins a generator to create electricity [6]. 2015 Wind turbine lab modules using WindLab 13 A blade acts much like an airplane wing. When the wind blows, a pocket of low-pressure air forms on the downwind side of the blade. The low-pressure air pocket then pulls the blade toward it, causing the rotor to turn. This is called lift. The force of the lift is actually much stronger than the wind's force against the front side of the blade, which is called drag. The combination of lift and drag causes the rotor to spin like a propeller, and the turning shaft spins a generator to make electricity [7]. The 3-phase power generated from a balanced system is calculated by: 𝑃! !!!"# = 3 . 𝑉!!!"# 𝐼!!!"# The theoretical equation for calculation of the frequency depends on the RPM and the number of poles within the generator: 𝑓(ℎ𝑧) = 𝑅𝑃𝑀. 𝑃 120 where RPM represents the generator revolutions per minute and P denotes the number of generator poles. Turbines can be used as stand-alone applications, or they can be connected to a utility power grid. For utility-scale sources of wind energy, a large number of turbines are usually built together to form a wind farm [4]. From an operational point of view, the task of wind turbine control system is to simultaneously deliver best possible output power up to the turbine ratings and prolong turbine lifetime. Prolongation of turbine lifetime is governed by reductions in the turbine structural loading. For this reason, control methods have been devised and are currently a focal point of today’s wind industry for development and effective management of large-scale wind turbines. A key mechanism in the control systems development is the effective management of wind turbine blade pitch angles (e.g. [10]-[12]). Wind turbine pitch control system changes the incidence of rotor blades in a wind power generation system based on real-time wind speed for the purpose of adjusting output power, achieving higher utilization efficiency of wind power and providing protection for rotor blades. When wind speed is not higher than the rated speed, the blade incidence stays near the angle 0° (highest power point). When wind speed is higher than the rated speed, the pitch control mechanism changes blade incidence so that the output power of generator is within the allowed range. This acts as both an optimisation control feature as well as a protection method preventing runaway states of the generator [13]. WindLab – By Turbine Technologies: Turbine technologies are a company located in the United States, which manufactures educational lab products. The WindLab wind turbine is an electrical power plant generation system which serves as a perfect learning tool for any research lab or learning environment. WindLab is housed in a 2015 Wind turbine lab modules using WindLab 14 self-contained wind tunnel and comes with a programmable variable speed wind source. It also features custom on-board instrumentation created with LabVIEW™. WindLab is a classroom-sized power plant built to last with aerospace grade components including an all alloy planetary gear box, 3-phase power generator, cut-away gondola cover, a stainless steel tower, and ABS plastic blades [9]. The turbine rotor shaft drives a precision machined alloy planetary gearbox, which multiplies turbine rotor shaft RPM by 4. The three-phase generator features an adjustable range, DC excited, eight-pole rotor and an eight-pole, three-phase stator. The WindLab wind turbine system comes with an operation manual which describes important operating procedures that must be followed [2]. Particularly the start-up procedure and maximum operating conditions. Before operation of the WindLab wind turbine, the user must confirm the following aspects: -‐ -‐ -‐ -‐ -‐ Wind fan remains unadjusted with no visible damage. Turbine blades have been inspected ensuring firm connection to the wind blade hub. Load Rheostats are off. Excitation Voltage Rheostat is off. DAQ Computer connected. Operation limits that must be followed: -‐ -‐ -‐ 2015 Maximum wind fan speed which is limited by amperage draw of the motor, set at 7.8A. Wind turbine speed can handle any operation assuring that wind fan speed limits are obeyed. Maximum generator output can provide up to 2.5V at 0.12A. Producing 0.5 watts of power. Wind turbine lab modules using WindLab 15 WindLab - Basic Component Overview [2]: 2015 Wind turbine lab modules using WindLab 16 Discussion: By completion of this ‘pre-reading’ laboratory module students should have revised the fundamentals of power generation using wind turbines and their significance. It should be noted that the review material presented in the pre-lab section only presents a high level overview of the wind turbine operation and significance. It is by no means an extensive coverage of the fundaments of the wind turbine design and operation. Students are strongly recommended to review the relevant theoretical contents (for example, the contents covered in the ELEC3300 and ELEC7313 lectures for UQ students). 2015 Wind turbine lab modules using WindLab 17 Module 1 2015 Wind turbine lab modules using WindLab 18 LABORATORY MODULE #1 (SYSTEM FAMILIARISATION): WORKSHEET Aims: After completing this module students should have the ability to safely and independently operate the WindLab facility to obtain accurate usable experimental data and be able to correlate theoretical calculations with practical results. Objectives: After completion of this module students should be able to 1. Independently conduct pre-start up, start up, operation and shutdown of WindLab Wind Turbine Power System. 2. Utilise the data acquisition system to capture the operational values returned from experiments outlined. 3. Evaluate the operation of WindLab wind turbine system under wide range of operating conditions. System Requirements: -‐ -‐ -‐ -‐ WindLab Wind Turbine Data Acquisition Computer WindLab 1.0 software USB cable General Lab Procedure: I. Utilise WindLab operator’s manual and follow section 4 to perform system pre-start, operation and shut down steps of the system. II. Use section 6.5.1 Virtual Instrument (VI) display/data collection in operator’s menu for data collection. Specific Lab Procedure: Refer to the ‘LAB Module #1 - Step through Guide’ for detailed steps for completion of the following worksheet. Questions: 1. Conditions: Safely turn on the WindLab Wind Turbine system with balanced no load conditions with 5V DC excitation. Slowly adjust the wind speed up to 6 m/s and then back to a stop. 2015 Wind turbine lab modules using WindLab 19 i. Through utilizing the Data Collection software ‘WindLab1.0’ save the conditions described and produce a plot of ‘Wind Speed (m/s) vs Time (s)’. HINT- Use the Sample rate to obtain time. ii. Document the speed in which the turbine engages. iii. At 5 m/s, use the theoretical equations to calculate the following quantities: a. Total Power (W) b. Frequency (Hz) iv. Compare the theoretical values calculated to the practical values returned through graphical analysis. 2. Conditions: Set the rotor RPM to a constant 150 RPM and Excitation to 50%. Sample data for 50 seconds at 0%, 50%, 70% and 90% load. I. II. 2015 Plot the following quantities against Time(s). A) Wind Speed (m/s) B) Rotor RPM C) Generator RPM D) Frequency (Hz) E) RMS Voltage A (V) F) Current A (A) G) RMS Voltage B (V) H) Current B (A) I) RMS Voltage C (V) J) Current C (A) K) Power (W) Give two real life examples of what loads might be connected to Wind Turbines? Wind turbine lab modules using WindLab 20 LABORATORY MODULE #1 (SYSTEM FAMILIARISATION): STEP THROUGH GUIDE The following steps are required in order to gather the required information to complete Module #1 Worksheet. Safely turning on the WindLab Wind Turbine and Connecting to Laptop 1. Verify that all the rheostats are set at no load (zero) for each phase and excitations. (phase C shown) 2. Turn MASTER Power on at the wall, followed by the key to position ON. 3. Start system and choose a low wind speed. When wind anemometer starts to spin, the WIND SPEED meter will start to display data. 4. At this stage, you will need to connect the system to the laptop supplied and open the data acquisition program named WindLAB1.0 in order to view and capture data results. *For individual Steps on Connecting to the laptop, Refer to ‘Data Collection & Importing to Excel from WindLab 1.0’ on page 23* Visually confirm that the system is connected by adjusting wind speeds and noticing replica changes displayed on the laptop and meters. 2015 Wind turbine lab modules using WindLab 21 Collecting data: Ensure that the saving data process is known through the data acquisition program and that a successful test run has been completed for confirmation. Operating Steps for Question 1. 1. Set the initial operating conditions: -‐ 3 phases to no-load conditions. -‐ DC excitation level to 5 V. 2. Start saving data to a new file utilising the Data Acquisition Software. 3. With each passing second, increase the Wind Speed Control by pushing once. -‐ This will slowly increment the wind speed from 0 m/s to 6 m/s while capturing the entire systems response. 4. Make note of the Wind Speed in which the turbine engages. 5. Once the wind speed has reached 6 m/s, stop saving data through the laptop interface and reduce the windspeed back to 0 m/s and return all meter dials to 0 and shut down the system. Now follow the “Importing Acquisition Data into an MS-Excel Spreadsheet” section for data analysis and steps on how to produce important graphs. Operating Steps for Question 2. 1. Set the initial conditions: -‐ 150 RPM at the rotor. -‐ DC Excitation at 50% (7 V). -‐ All 3 phases at no load conditions (0%). 2. Start saving data to a new file utilising the Data Acquisition System and also set a stop watch simultaneously. 3. Sample data for each of the loads described for 50 seconds each ensuring that the rotor RPM stays constant at 150 RPM. 4. Once all data has been collected, stop saving to the file through the laptop interface and reduce the 3-phase loads to 0% and the wind speed back to 0 m/s. Safetly shut the system down. Now follow the “Importing Acquisition Data into an MS-Excel Spreadsheet” section for data analysis and steps on how to produce important graphs. 2015 Wind turbine lab modules using WindLab 22 Data Collection & Importing to Excel from WindLab 1.0 [2]: 2015 Wind turbine lab modules using WindLab 23 2015 Wind turbine lab modules using WindLab 24 2015 Wind turbine lab modules using WindLab 25 2015 Wind turbine lab modules using WindLab 26 2015 Wind turbine lab modules using WindLab 27 2015 Wind turbine lab modules using WindLab 28 LABORATORY MODULE #1 (SYSTEM FAMILIARISATION): SAMPLE SOLUTIONS 1. Conditions: Safely turn on the WindLab Wind Turbine system with balanced no Load conditions and a 5V DC excitation. Slowly adjust the wind speed up to 6 m/s and then back to a stop. i. Through utilizing the Data Collection software ‘WindLab1.0’ save the conditions described and produce a plot of ‘Wind Speed (m/s) vs Time (s)’. HINT- Use the Sample rate to obtain time. Sample Time used: 1 data point each second. Wind Speed (m/s) 8 7 6 5 4 3 2 0 -‐1 ii. Time(sec) 12 24 36 48 60 72 84 96 108 120 132 144 156 168 180 192 204 216 228 240 252 264 276 288 300 312 324 336 1 Document the speed in which the turbine engages. The wind turbine under the described conditions engages at 2m/s. iii. At 5 m/s, use the theoretical equations to calculate the following quantities: a. Total Power (W) Power P = 3 V!"#$ I!"#$% Balanced conditions, therefore any phase can used: Power P = 2015 V! I! + V! I! + V! I! 3 Wind turbine lab modules using WindLab 29 6.19 ∗ 0.0335 + 6.37 ∗ 0.0333 + 6.31 ∗ 0.0313 3 𝑃 = 0.356 𝑊𝑎𝑡𝑡𝑠 𝑃= b. Frequency Frequency 𝑓 = 𝐺𝑒𝑛𝑒𝑟𝑎𝑡𝑜𝑟 𝑅𝑃𝑀 (𝑁) ∗ 𝑁𝑢𝑚𝑏𝑒𝑟 𝑜𝑓 𝑃𝑜𝑙𝑒𝑠 (𝑃) 120 𝐹 = 1046 ∗ 4 120 𝐹 = 34.86𝐻𝑧 iv. Compare the theoretical values calculated to the practical values returned through graphical analysis. Practical Results: Frequency (Hz) 40 30 20 0 -‐10 Time(sec) 21 42 63 84 105 126 147 168 189 210 231 252 273 294 315 336 10 Practical frequency = 34.88Hz As evident, the theoretical frequency calculation matches perfectly the practical value returned. Validation of the power calculations can be performed along the same lines. 2015 Wind turbine lab modules using WindLab 30 2. Conditions: 150 RPM on turbine at 4V excitation. Sample for 50 seconds at 0%, 50%, 70% and 90% balanced load. I. Plot the following quantities against Time(s). A) Wind Speed (m/s) B) Rotor RPM C) Generator RPM 2015 Wind turbine lab modules using WindLab 31 D) Frequency (Hz) E) RMS Voltage A F) Current A 2015 Wind turbine lab modules using WindLab 32 G) RMS Voltage B H) Current B I) RMS Voltage C 2015 Wind turbine lab modules using WindLab 33 J) Current C K) Power EXERCISE: Compare the theoretical values of frequency and power with those obtained in experiments in this part of the lab module. Comment on any mismatches in the two values that you might observe. II. Give two real life examples of what loads might be connected to Wind Turbines? 1. Energy Storage systems 2. Power grid 2015 Wind turbine lab modules using WindLab 34 Module 2 2015 Wind turbine lab modules using WindLab 35 LABORATORY MODULE #2 (SYSTEM ANALYSIS): WORKSHEET Aim: To have the ability to evaluate and establish economic viability of wind generation systems for a given wind and load demand profile. Objectives: 1. To develop and apply analysis skills to prove the relevance and intended benefits that this WindLab system provides for modelling and estimating wind power generation. 2. To analyse the technical and financial effects of wind energy generation on the load profiles. System Requirements: -‐ -‐ -‐ -‐ WindLab Wind Turbine Data Acquisition Computer WindLab 1.0 software USB cable General Lab Procedure: 1. Using operational and theoretical knowledge learnt in the previous laboratory module, utilise the wind turbine to complete the following tasks. Specific Lab Procedure: Refer to the ‘Module #2 - Step through Guide’ for detailed steps for completion of the following worksheet. 2015 Wind turbine lab modules using WindLab 36 Questions: Conditions: Collect data for each whole wind speed 1 m/s to 7 m/s at 50% balanced load conditions with 4V DC excitation. 1. Create a table in excel with all the data, using the conditions outlined. Display the power curve wind generation graph. Indicate the wind turbine power output (W) on different wind speeds. 2. Based upon your power curve wind generation graph and an average loading of 50%, what would be the total watt-hours of power generated for the 24 hour period if recorded wind data is as shown. 3. If your facilities have an average daily hourly electric power consumption curve that looks like the following: 2015 Wind turbine lab modules using WindLab 37 A. Based on the conditions cited earlier, what portion of that requirement will be handled by the wind turbine (if you have both wind turbine and commercial power distribution service connected to your facilities)? Show an overlay plot of wind turbine performance onto the typical usual curve for visual comparison. B. If billed electric service cost the facility property owner $0.30/w-hr, what saving will wind turbine owner realize for this day? C. If this pattern of usage and generation were to be steady for a year, what is the average saving for a year? D. If the system being used had an acquisition cost of $10,000.00, what would be calculated payback in years for the unit? 2015 Wind turbine lab modules using WindLab 38 LABORATORY MODULE #2 (SYSTEM ANALYSIS): STEP THROUGH GUIDE The following steps are required in order to gather the required information to complete Worksheet Laboratory Module #2. Refer to ‘Step through Guide: Laboratory Module #1’ for the following procedures when necessary: 1. 2. 3. 4. Safely turning the WindLab system on Connecting to the Laptop Saving data to files using Data Acquisition program Creating excel graphs Collecting data Operating Steps: 1. Set the initial operating conditions: -‐ 50% to all loads -‐ 1 m/s wind speed -‐ 4 V DC excitation 2. Start saving to a new file utilising the Data Acquisition Software. 3. Sampling for 30 seconds on each whole wind speed, obtain data up until 7 m/s while keeping all other conditions constant. 4. Once completed, stop saving data through the laptop interface and reduce all dials back to no-load, no wind speed conditions and shut down the system. Now, by recalling the “Importing Acquisition Data into an MS-Excel Spreadsheet” steps found in ‘Step though Guide – Laboratory Module #1’ complete a data analysis and produce important graphs as required. 2015 Wind turbine lab modules using WindLab 39 Procedure for completing Question 1 Use the imported excel data to create a graph of Power (watts) vs. Time (seconds). Identify the different wind speeds by matching up the time values when each speed increment was adjusted. Procedure for completing Question 2 To complete this question you will need: 1. At least 30 seconds of sampled data for each whole wind speed at 50% balanced loads. 2. The total hours in which the wind turbine operates for at each wind speed. Derive this from the table on the Worksheet illustrating an average daily wind profile. The power reading supplied within each time segment is the power generated within one hour. Accordingly, the energy calculation can be performed using E(w-hr) = P(w) x T(hr). Multiplying each wind speed generation power (W) by the respective time (hours) spent at that speed using P(w) x T(hr) and then summing these together will return the total energy generated in the day portrayed. Procedure for completing Question 3 (A) First step is to create a data plot illustrating the wind turbine generation over the typical day as portrayed. To achieve this, -‐ -‐ -‐ Create a table with the headings: Time of day (hr), Wind Turbine Generation (whr). For each hour of the day, use the information supplied from Question 2 and the data collected, to enter the respective energy generation (w-hr) of the WindLab system. Graph the resultant table and superimpose this over the ‘Daily electric power consumption curve’ for comparison. (The example daily appliance usage curve can easily be replicated in excel for superimposing the two plots.) To find the daily power percentage covered by the Wind Turbine, the total sum of watt-hours generated can be expressed as a percentage in comparison to the total watt-hours consumed. 2015 Wind turbine lab modules using WindLab 40 (B) The question provides a fixed price dollar rate of $0.3/w-hr which represents the owners cost per Watt-hour consumed. As we know the total watt-hours consumed each day, we can find the total cost for the owner firstly without the wind turbine included. 𝑇𝑜𝑡𝑎𝑙 𝐶𝑜𝑠𝑡 𝑤𝑖𝑡ℎ𝑜𝑢𝑡 𝑇𝑢𝑟𝑏𝑖𝑛𝑒 = 𝑇𝑜𝑡𝑎𝑙 𝑤 − ℎ𝑟 𝑐𝑜𝑛𝑠𝑢𝑚𝑒𝑑 ∗ $0.30 The solution from Question A discovered the percentage of power covered by the wind turbine. The savings for the wind turbine owner can be formulated by multiplying this percentage by the total daily cost (without the wind turbine). (C) Simply multiply the saving per day that the WindLab system would provide by the total number of days in a year. (D) Using the solution from part C, the total repayment time if the system costs $10,000 can be found by: 𝑇𝑜𝑡𝑎𝑙 𝑅𝑒𝑝𝑎𝑦𝑚𝑒𝑛𝑡 𝑇𝑖𝑚𝑒 = 2015 $10000.00 𝑆𝑎𝑣𝑖𝑛𝑔 𝑝𝑒𝑟 𝑦𝑒𝑎𝑟 Wind turbine lab modules using WindLab 41 LABORATORY MODULE #2 (SYSTEM ANALYSIS): SAMPLE SOLUTIONS 1. Create a table in excel with all the data, using the conditions outlined. Display the wind power curve wind generation graph. Indicate the wind turbine power output (W) on different wind speeds. Wind Power Curve 0.8 7m/s 0.7 6m/s 0.6 0.5 5m/s 0.4 0.3 4m/s 0.2 3m/s 0.1 -‐0.1 1m/s 2m/s Time (sec) 11 22 33 44 55 66 77 88 99 110 121 132 143 154 165 176 187 198 209 220 231 242 253 264 275 286 297 0 2. Based upon your power curve wind generation graph and an average loading of 50%, what would be the total watt-hours of power generated for the 24 hour period if recorded wind data is as shown. Midnight to 1:00AM: CALM 1:00 to 2:00 AM: CALM 2:00 to 3:00 AM: Steady at 1 m/s 3:00 to 4:00 AM: Steady at 2 m/s 4:00 to 5:00 AM: Steady at 4 m/s 5:00 to 6:00 AM: Steady at 4 m/s 6:00 to 7:00 AM: Steady at 4 m/s 7:00 to 8:00 AM: Steady at 4 m/s 8:00 to 9:00 AM: steady at 4-6 m/s 9:00 to 10:00 AM: steady at 4-6 m/s 10:00 to 11:00 AM: Heavy at 6-7 m/s 11:00 to 12:00 Noon: Heavy at 6-7 m/s 12:00 Noon to 1:00 PM: steady at 4-6 m/s 1:00 to 2:00 PM: steady at 4-6 m/s 2:00 to 3:00 PM: Steady at 6 m/s 3:00 to 4:00 PM: Steady at 6 m/s 4:00 to 5:00 PM: Steady at 5 m/s 5:00 to 6:00 PM: Steady at 4 m/s 6:00 to 7:00 PM: Steady at 2 m/s 7:00 to 8:00 PM: CALM 8:00 to 9:00 PM: CALM 9:00 to 10:00 PM: CALM 10:00 to 11:00 PM: CALM 11:00 to Midnight: CALM 2015 Wind turbine lab modules using WindLab 42 Wind Speed (m/s) Time at that speed (hours) Power Gen (Watts/hour) 1 2 3 4 5 6 7 4-6 (average of 5) 6-7 (average of 6.5) 1 2 0 5 1 2 0 4 2 0 0 0.115 0.245 0.397 0.547 0.715 0.397 0.629 Total Time breakdown during the day: wind) Total Power Generation @ wind speeds (Watt) 0 0 0 1.225 0.397 1.094 0 1.588 1.258 17hrs operating, 7 hours ‘calm’ (no Total w-hr generated by the wind turbine in the day = 5.562 W 3. If your facilities have an average daily electric power consumption curve that looks like the following: A. Based on the conditions cited earlier, what portion of that requirement will be handled by the wind turbine (if you have both wind turbine and commercial power distribution service connected to your facilities)? Show an overlay plot of wind turbine performance onto the typical usual curve for visual comparison. 2015 Wind turbine lab modules using WindLab 43 Total Watt hours supplied by Wind Turbine = 5.562 Total Watt hours consumed by daily energy usage = 74 % 𝑃𝑜𝑤𝑒𝑟 𝐶𝑜𝑣𝑒𝑟𝑒𝑑 𝑏𝑦 𝑊𝑖𝑛𝑑 𝑇𝑢𝑟𝑏𝑖𝑛𝑒 = 5.562 ∗ 100 74 Therefore, the Wind Turbine provides 7.5 % of the power required in the outlined period. B. If billed electric service cost the facility property owner $0.30/w-hr, what saving will wind turbine owner realize for this day? 𝑇𝑜𝑡𝑎𝑙 𝐶𝑜𝑠𝑡 𝑤𝑖𝑡ℎ𝑜𝑢𝑡 𝑇𝑢𝑟𝑏𝑖𝑛𝑒 = 74 ∗ $0.30 𝑇𝑜𝑡𝑎𝑙 𝐶𝑜𝑠𝑡 𝑤𝑖𝑡ℎ𝑜𝑢𝑡 𝑇𝑢𝑟𝑏𝑖𝑛𝑒 = $22.20 The Wind Turbine covers 7.5 percent of the total power consumed, therefore 𝑇𝑜𝑡𝑎𝑙 𝐷𝑎𝑖𝑙𝑦 𝑆𝑎𝑣𝑖𝑛𝑔𝑠 = $22.20 ∗ 0.075 𝑇𝑜𝑡𝑎𝑙 𝐷𝑎𝑖𝑙𝑦 𝑆𝑎𝑣𝑖𝑛𝑔𝑠 = $1.70 C. If this pattern of usage and generation were to be steady for a year, what is the average saving for a year? 2015 Wind turbine lab modules using WindLab 44 Extrapolating the daily saving to year long period, $1.70 ∗ 365 = $620.50 D. If the system being used had an acquisition cost of $10,000.00, what would be calculated payback in years for the unit? 𝑇𝑜𝑡𝑎𝑙 𝑅𝑒𝑝𝑎𝑦𝑚𝑒𝑛𝑡 𝑇𝑖𝑚𝑒 = $10000.00 $620.50 𝑇𝑜𝑡𝑎𝑙 𝑅𝑒𝑝𝑎𝑦𝑚𝑒𝑛𝑡 𝑇𝑖𝑚𝑒 = 16.11 𝑦𝑒𝑎𝑟𝑠 EXERCISE: Repeat part D using the Net Present Value analysis and assuming a discount rate of 5%. 2015 Wind turbine lab modules using WindLab 45 Module 3 2015 Wind turbine lab modules using WindLab 46 LABORATORY MODULE #3 (BLADE PITCH POSITIONING): WORKSHEET Aim: 1. To gain an understanding of the significance and acquire basic skills in adjusting blade pitch angles to control the operation of wind turbines. Objectives: 1. To determine the effect that pitch positioning has on power, voltage, current, rotor RPM and frequency on the wind turbine throughout its operational range. 2. To be able to demonstrate understanding of the relevance and necessity the automated pitch control contains for utility-scale wind turbines. System Requirements: -‐ -‐ -‐ -‐ -‐ WindLab Wind Turbine Data Acquisition Computer WindLab 1.0 software USB cable Allen key for blade pitch positioning alterations General Lab Procedure: 1. Complete the following exercises by safely collecting the required data through experimenting with the blade pitch positioning on the WindLab wind turbine. Specific Lab Procedure: Refer to the ‘LAB Module #3 – Step through Guide’ for detailed steps for completion of the following worksheet. Experimental Procedure: Conditions: Perform the following experiment through implementing the procedure outlined below. Analyse the systems response with the turbines blade pitch positioning set at 0, 5, 10 and 15 degrees. 1. Set and record the blade pitch angle on all three blades to 0 degrees. 2. With balanced, unloaded conditions and 5V DC excitation, ramp adjust the wind speed to 2 m/s. 3. Notice that the turbine will begin to spin. Upon stabilization, record unloaded power RPM. 4. Begin saving and sample data for 30 seconds on each whole wind speed value up until the threshold current is reached. Note the voltage, current, rotor RPM, power output and frequency change. 5. Using the rheostat, slowly add load to all three phases in 20% increases and repeat steps 2, 3 and 4. 6. Repeat steps 1 to 5, adjusting the blade pitch angle to the next increment on each of the three blades. To adjust the blade pitch angle, refer to the ‘Step through guide – Lab Module #3’ for the safe and clear procedure. Questions: 1. Plot graphs to illustrate the relationship between the following quantities and pitch angle: a. Voltage b. Current c. Frequency d. Rotor RPM e. Power 2. Create a graph of Power (W) verses Wind Speed (m/s) for each of the pitch angles where the effect of changing loads is illustrated. Four separate graphs should be created. 3. From your results, comment on how automated pitch control is essential in management of the operation of wind turbines. 2015 Wind turbine lab modules using WindLab 48 LABORATORY MODULE #3 (BLADE PITCH POSITIONING): STEP THROUGH GUIDE The following steps are required in order to gather the information needed to complete Worksheet Lab Module #3. Pitch Angle Statement: The blade angles as indicated on the WindLab wind turbine hub are as displayed in Figure 5.0. This indicates the angle that the bottom of the blade creates with the hub and NOT the actual pitch angle of the blade. The blade pitch angle is meaured from the outmost point of the blade and when the blade’s face is perpendicular to the wind, correlates to zero degrees. See Figure 6.0 below for visual interpretation. The table below shows the correlation between the indicated angle as displayed on the wind turbine hub vs. the resulting pitch angle of the blade. Wind Turbine Hub Angle (degrees) Blade Pitch Angle (degrees) 60 0 55 5 50 10 45 15 Figure 5.0 -‐ WindLab Wind turbine blade angle Figure 6.0 -‐ Blade pitch angle taken from outmost point 2015 Wind turbine lab modules using WindLab 49 Changing WindLab wind turbine blade pitch angles: The following steps when followed will result in successful adjustment of the blade pitch positioning of the WindLab wind turbine blades: 1. Before touching the cage and inside the wind turbine, it is essential to ensure that the machine is turned off and power disabled. 2. First step - the protection cage must be taken off. This can be achieved by rotating the cage in a clockwise direction until the clamps are released. The structure of the clamps is shown in Figures 7.0 and 8.0. Figure 7.0 -‐ Safety cage Figure 8.0 -‐ Exploded view of clamps locking cage into position 3. Once the cage is removed, use an Allen key to loosen the three screws but do not remove these completely. The location of these screws is indicated on Figure 9.0. This will allow the blades to be rotated and angle adjusted without falling out or deconstructing the turbine hub. 4. Once at the desired angle, tighten all three screws and double check they are tight before putting the cage back on. Figure 9.0 -‐ Location of screws locking blades into position 2015 Wind turbine lab modules using WindLab 50 Question 1 This question requires significant data to be collected and analysed. For each blade pitch angle (0, 5, 10 and15 degrees), a constant balanced load must be selected and then data needs to be collected for each whole wind speed from 2-7 m/s for this load. By utilising techniques learnt through previous modules, the data acquisition system can be used to import the results into excel. Once in excel multiple worksheets can be created, one for each pitch angle in which the respective data can be organised. From the excel workbook, the respective quantities requiring commenting on can be grouped and graphed using the scatter plot against wind speed. Using a scatter plot in excel allows you to graph more than one plot on the same axis with corresponding x and y values. One graph should be created for each section with four plots within indicating the different pitch angles used. Question 2 The experimental procedure outlined on worksheet 3 is the process required to gather the required data to answer this question. There are two underlying learning goals of this question and aspects to keep in mind: Firstly when graphing, notice and understand the effect that increasing load has on the wind turbine power output. Secondly, clearly determine and compare the power profiles amongst changing pitch angles. Question 3 Sources relevant and informational of wind turbine blade pitch control: http://machinedesign.com/news/wind-turbine-blades-change-pitch-boost-wind-powerefficiency https://www.google.com/patents/US4584486 http://uk.farnell.com/wind-turbine-pitch-control-applications www.nrel.gov/electricity/transmission/pdfs/wind_workshop2_16shao.pdf https://www.dnvgl.com/services/wind-turbine-control-system-design-5668 2015 Wind turbine lab modules using WindLab 51 LABORATORY MODULE #3 (BLADE PITCH POSITIONING): SAMPLE SOLUTIONS 1. Comment on the following quantities and display a graph which indicates how they change dependent on pitch angle: The following graphs have been created using data from balanced, 60% loading. a. Voltage This graph compares the voltage profile of phase A for a range of different pitch angles. A decrease in voltage is illustrated with an increase in pitch angle on all three blades. This is expected because a reduction total power output with increasing pitch, hence resulting in lower voltage to each phase. b. Current Similar to the phase A voltage, a decrease in phase current is noticed with increasing blade pitch angles. This was also expected as the power is directly proportional to current. c. Frequency The frequency illustrates an interesting effect with various pitch angles. It evidently starts off lower at higher pitch angles and as wind speed increases, all angles results in frequency eventually capped at 35 Hz by the internal safety features of WindLab. 2015 Wind turbine lab modules using WindLab 52 d. Rotor RPM The influence that pitch positioning has on rotor RPM is similar to that of frequency. With an expected increase in rotor RPM with increasing wind speeds, the higher pitch angles start with lower initial RPM. All eventually reach an RPM, which is at a capped value of 260. It is clear that pitch angle control is essential to ensure that rotor RPM remains within its permissible limits. e. Power The figure demonstrates that for a given wind speed power output reduces as the pitch angle is increased. Hence, pitch control system is crucial in smoothing the wind power output. 2. Create a graph of “Power (W) vs. Wind Speed (m/s) for each of the pitch angles where the effect of changing loads is illustrated. Four separate graphs should be created. Pitch Angle Power Graphs: 0 Degrees: 2015 Wind turbine lab modules using WindLab 53 5 Degrees: 10 Degrees: 15 Degrees: 2015 Wind turbine lab modules using WindLab 54 3. From the discoveries made throughout this modules, comment on how automated pitch control is essential to full scale wind turbines and what benefits it entails. Wind turbine pitch control systems are implemented to control and change the incidence of rotor blades based on real-time wind speed. The purpose is to adjust the output power, achieving higher utilisation efficiency of wind power and ensure rotor blades continue to operate in safe operating limits. From the discoveries of this module, it is evident that as long as the wind speed is below the rated wind speed the pitch is set at 0 degrees to maximise the power capture through maximisation of the aerodynamic efficiency (although the maximisation of aerodynamic efficiency is not demonstrated in this module). When wind speed is higher than the rated speed, the pitch control mechanism changes blade incidence so that the output power of generator is within the allowed range. The benefits of having an effective and efficient pitch control method will enhance turbine safety and efficiency by preventing runaway speeds, while ensuring best possible power yield from available wind. ADDITIONAL RECOMMENDED OUT-OF-LAB EXERCISE: Propose and discuss two potential methods that may be used to limit the variability of wind turbine power output. Using the data obtained in Module #3, demonstrate the application of your proposed methods in mitigate intermittency of WindLab power output. State any assumptions that you make in performing this analysis. 2015 Wind turbine lab modules using WindLab 55 REFERENCES [1] R. Repas. (2011, 31/03/2015). Wind turbine blades that change pitch boost wind power efficiency. Available: http://machinedesign.com/news/wind-turbine-bladeschange-pitch-boost-wind-power-efficiency [2] T. Technologies, "Operation Manual," in Wind turbine Electrical Generation system, ed. USA, p. 47. [3] E. Hau and H. v. Renouard, Wind Turbines. DE: Springer Verlag, 2013. [4] GWEC, "Global Wind Statistics," vol. 10.2.2015, ed. Belgium: GWEC, 2014. [5] Energy.gov. (2002, 18/03). Wind turbine basics. Available: http://energy.gov/eere/wind/how-do-wind-turbines-work [6] R. Gasch and J. Twele, "Wind turbines - design and components," ed Berlin, Heidelberg: Springer Berlin Heidelberg, 2012, pp. 46-113. [7] Energy.gov. (2002, 18/03). How do wind turbines http://energy.gov/eere/wind/how-do-wind-turbines-work. [8] NREL, "Wind Energy Basics," vol. 2015, 2014. [9] T. R. A. o. Engineering, "Wind turbine Power Calculations," Educational Laboratory Report 30, March 2015. [10] K. Selvam, S. Kanev, J. W. van Wingerden, T. van Engelen, and M. Verhaegen, "Feedback–feedforward individual pitch control for wind turbine load reduction," International Journal of Robust and Nonlinear Control, 2008. [11] A. Stotsky, B. Egardt, T. Chalmers University of, h. Chalmers tekniska, R. Institutionen för signaler och system, S. Department of, et al., "Individual pitch control of wind turbines: Model-based approach," Proceedings of the Institution of Mechanical Engineers, Part I: Journal of Systems and Control Engineering, vol. 227, pp. 602-609, 2013. [12] D. Zhang, P. Cross, X. Ma, and W. Li, "Improved control of individual blade pitch for wind turbines," Sensors & Actuators: A.Physical, vol. 198, p. 8-14, 2013. [13] P. F. Company. (2015, 1/11). Alternative Energy. Available: http://uk.farnell.com/wind-turbine-pitch-control-applications. 2015 Wind turbine lab modules using WindLab work. Available: 56