1
EASY Documentation Series
CCFE-R(10)03
L.W. Packer and
R.A. Forrest
SAFEPAQ-11: User manual
Enquiries about copyright and reproduction should in the first instance be addressed to the Culham Publications
Officer, Culham Centre for Fusion Energy (CCFE), Library, Culham Science Centre, Abingdon, Oxfordshire,
OX14 3DB, UK. CCFE is the fusion research arm of the United Kingdom Atomic Energy Authority, which is the
copyright holder.
EASY Documentation Series
CCFE-R-(10 )03
SAFEPAQ-II:
User manual
L. W. Packer
R. A. Forrest*
EURATOM/CCFE Fusion Association, Culham Science Centre,
Abingdon, Oxfordshire OX14 3DB, UK
* IAEA Nuclear Data Section, Wagramer Strasse 5, PO Box 100,
1400 Vienna, Austria
Abstract
SAFEPAQ-II is the software tool that has been developed to enable efficient
production of the EAF nuclear data libraries that are required as input to the FISPACT
activation code. It forms part of the European Activation System (EASY), and
replaces SAFEPAQ and SYMPAL that were used previously.
SAFEPAQ-II enables all the nuclear data to be stored in relational databases (Access)
and by using an interactive user interface allows the data to be viewed, modified,
analysed, validated and then produced in the required EAF format as text files. It was
originally written in Visual Basic 5 running under the Windows NT4 operating
system. The current release (Issue 8) has been updated to use Visual Basic.NET
running under the Windows XP operating system. The Windows operating system has
the great advantage of portability and SAFEPAQ-II has been successfully installed at
three external sites for use by CCFE’s international collaborators. It has been used in
the production of the EAF-2001, EAF-2003, EAF-2005, EAF-2007 and EAF-2010
data libraries.
Significant changes and enhancements were made to SAFEPAQ-II for the production
of the data libraries produced for and after EAF-2007. The main reasons for the
changes were the need to be able to treat data for deuteron- and proton-induced
reactions with an upper energy of 60 MeV and to include the method of Statistical
Analysis of Cross Sections (SACS). Issue 8 has further extended the analysis tools
with several new features.
Contents
Introduction................................................................................................1
Objectives....................................................................................................2
Organising data ....................................................................................................... 2
Viewing data ............................................................................................................ 2
Altering data ............................................................................................................ 2
Processing data ........................................................................................................ 3
Analysing data ......................................................................................................... 3
Logging changes ...................................................................................................... 3
Getting started ............................................................................................ 4
Decay data ................................................................................................ 12
Source libraries ........................................................................................ 19
Experimental data.................................................................................... 24
EXFOR data ............................................................................................. 35
Visualisation............................................................................................. 47
Integral data ............................................................................................. 67
Reaction data............................................................................................ 78
Find all branching modifications......................................................................... 99
Find all experimental modifications .................................................................. 101
Find all systematics modifications ..................................................................... 101
Find all repeated zero modifications ................................................................. 101
Find all greater than 60 MeV modifications..................................................... 101
Find all threshold modifications using Wapstra .............................................. 101
Find all > 1 E-5 eV non-threshold modifications ............................................. 101
Find all non-threshold first point modifications .............................................. 101
Analysis................................................................................................... 129
Miscellaneous tools................................................................................ 142
Updating databases ................................................................................ 153
Summary of menu items........................................................................ 168
References .............................................................................................. 175
Appendix 1. SAFEPAQ-II design ......................................................... 176
1.
Overall structure......................................................................................... 176
2.
Database design........................................................................................... 176
3.
The definition of the generic.mdb database tables .................................. 177
4.
The definition of the library.mdb database tables .................................. 179
5.
The definition of the parameter.mdb database tables............................. 180
6.
The definition of the master.mdb database tables................................... 190
7.
The definition of the cache.mdb database tables ..................................... 190
8.
The definition of the final.mdb database tables....................................... 191
9.
The definition of the EXFOR.mdb database tables ................................ 194
Appendix 2. Practical details ................................................................. 196
File locations ........................................................................................................ 196
Linked tables ....................................................................................................... 196
x4s file format ...................................................................................................... 197
XY table file format ............................................................................................ 198
Scrap file format.................................................................................................. 199
XML files ............................................................................................................. 199
Appendix 3. Multi-group cross sections ................................................ 199
Introduction ......................................................................................................... 199
Interpolation laws ............................................................................................... 200
Law 1, constant....................................................................................................... 200
Law 2, linear-linear................................................................................................. 200
Law 3, log-linear..................................................................................................... 200
Law 4, linear-log..................................................................................................... 201
Law 5, log-log......................................................................................................... 201
Flat weighting ...................................................................................................... 201
Law 1 ...................................................................................................................... 201
Law 2 ...................................................................................................................... 201
Law 3 ...................................................................................................................... 201
Law 4 ...................................................................................................................... 202
Law 5 ...................................................................................................................... 202
1/E weighting ....................................................................................................... 202
Law 1 ...................................................................................................................... 202
Law 2 ...................................................................................................................... 202
Law 3 ...................................................................................................................... 202
Law 4 ...................................................................................................................... 203
Law 5 ...................................................................................................................... 203
Maxwellian thermal weighting .......................................................................... 203
Law 1 ...................................................................................................................... 203
Law 2 ...................................................................................................................... 203
Law 3 ...................................................................................................................... 204
Law 4 ...................................................................................................................... 204
Law 5 ...................................................................................................................... 204
Fission spectrum weighting ................................................................................ 205
Law 1 ...................................................................................................................... 205
Law 2 ...................................................................................................................... 206
Law 3 ...................................................................................................................... 206
Law 4 ...................................................................................................................... 206
Law 5 ...................................................................................................................... 206
Velocity exponential fusion ................................................................................ 207
Law 1 ...................................................................................................................... 207
Law 2 ...................................................................................................................... 207
Law 3 ...................................................................................................................... 208
Law 4 ...................................................................................................................... 208
Law 5 ...................................................................................................................... 208
Summary .............................................................................................................. 210
Annex: Standard integrals ................................................................................. 210
Appendix 4. Branching ratios ............................................................... 212
Appendix 5. Single Resonance Approximation.................................... 214
Appendix 6. Low Energy Approximation ............................................. 216
Acknowledgements................................................................................. 219
Disclaimer .............................................................................................. 219
Contact person ....................................................................................... 219
SAFEPAQ-II
1
Introduction
The European Activation System (EASY) is the complete
package of data, inventory code and processing system for
activation calculations that is maintained by the Euratom/CCFE
Fusion Association at Culham Science Centre. Maintenance of
the EAF nuclear data libraries is a complex procedure; the cross
section files need to be evaluated (including choosing from
several sources and adjustment of data), processed (conversion
to a common format), compiled into a library, validated (against
experimental data and systematics) and documented. Similarly,
the decay data files need to be compiled and documented, and
all the subsidiary files required as input to the inventory code
FISPACT [1] need to be generated in a consistent manner.
The SYMPAL processing system, which originated at ECN
Petten, has been used previously to carry out the task of cross
section library processing. Details of the usage of SYMPAL are
covered in the User Manual [2] and the guide to the Utilities
[3]. However, the tasks of evaluation and visualisation of the
cross section libraries and the maintenance of the decay data
library were not covered by SYMPAL. Usage of SYMPAL was
complicated, and because it was not written at Culham,
maintenance, improvement and quality assurance proved
difficult. A first step to try and improve this was the
development of the SAFEPAQ application.
SAFEPAQ (System for Activation File Evaluation, Processing
And Quality assurance) was developed and used for parts of the
processing of EAF-97 and EAF-99 [4,5,6]. The user manual [7]
describes the version developed in 1997. SAFEPAQ and
SYMPAL were UNIX applications and the visualisation used
PV-WAVE [8]. Since then many changes have occurred in the
computer facilities at Culham, and it was judged necessary to
reconsider the whole philosophy of nuclear data work. The
main decision was to store all nuclear data in relational
databases. The second was the decision to construct the User
Interface to run on a Windows PC rather than under UNIX;
experience with the development of such interfaces on both
UNIX and PC environments had shown that the PC route was
much quicker and more flexible.
The application that has been produced is named SAFEPAQ-II,
it was developed from scratch initially using Visual Basic 5
with the data stored in Access-97 databases and accessed by the
DAO API. The version described in this issue (8) has been
upgraded to use Visual Basic.NET, Access-2003 databases and
the ADO.NET API. Both the VB5 and VB.NET versions run
User manual: Issue 8, March 2010
CCFE Fusion
SAFEPAQ-II
2
under Windows XP, on a PC with large enough hard disks to
enable all data files to be stored on-line.
Objectives
There are six main objectives of the SAFEPAQ-II application:
•
•
•
•
•
•
Organising data
Viewing data
Altering data
Processing data
Analysing data
Logging modifications
Organising data
For both the cross section and decay data libraries many sources
of data are required to compile the final libraries. In both cases
each source library is stored in a separate folder, containing
both the raw data in the native format and the Access database
(for cross sections). The SAFEPAQ-II databases are stored in a
separate folder that may be on a different hard disk. Although
the amount of data is substantial it is possible to write all of it
to DVDs which can be used to install the system on other PCs.
Viewing data
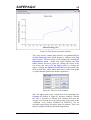
Visualisation of cross section data is a very important part of
the evaluation and validation process. Data from several
sources for a particular reaction can be plotted together, and to
this plot can be added experimental data, either from the
internal SAFEPAQ-II databases (equivalent to the ‘ASCII
tables’ used by SYMPAL) or from the EXFOR database. As
well as viewing on screen, options for printing and the
production of ‘books’ of plots can also be selected.
The decay data can be viewed in a graphical form, including the
γ- and X-ray lines of each of the radionuclides. The decay data
viewer shows all decay properties such as half-life and decay
modes as well as the biological hazards and other subsidiary
data used by FISPACT.
Altering data
The cross section data from a particular data source usually
require modification before incorporation in the final EAF
library. This is handled by constructing a series of basic
modifications, which are stored in a database. These can be
viewed, added to and their effects tested prior to using them all
to construct the final library. This modular approach of
CCFE Fusion
User manual: Issue 8, March 2010
SAFEPAQ-II
3
separating the data and the modifications makes checking and
quality assurance very efficient.
Processing data
The basic steps of building a new EAF cross section library
entail:
• Compiling all sources of data into separate databases, with
details of all these sources held in the Library database.
• The selection of the data source for each reaction and the
creation of the Master database containing these data.
• Improvement of the experimental data that are used in the
construction of the modifications, which include branching,
renormalisation, addition and merging of data. These are
stored in the Parameter database.
• Apply the modifications to produce the Final database.
• Write data from Final in the standard EAF format as text
files which can be used by EASY.
• In order to carry out these steps there is a need to visualise
data, test the results of modifications, and compare with
experiments to iterate the processes.
Analysing data
The means to analyse the databases using the method of
Statistical Analysis of Cross Sections has been implemented in
recent versions of SAFEPAQ-II. This is rather sophisticated
and now allows cross sections to be generated from the fitted
trend lines. In addition the importance of reactions as
established by analyses with EASY-2003 and EASY-2007 can
now be analysed using SAFEPAQ-II.
Logging changes
In the process of the production of a new version of the EAF
library many thousands of modifications need to be made.
These include use of new data sources, changes to experimental
data, new nuclides, new reactions and changes to cross section
data. Many iterations of visualisation, modification and
processing will be required and it is essential that all permanent
changes to data are automatically recorded. SAFEPAQ-II
contains a comprehensive logging system that records the
changes that were made. The log can be viewed and printed,
and if necessary additional comments can be added. No log
entries can be removed, only new ones added. The automatic
logging gives a complete record and is superior to hand written
records since nothing is omitted.
User manual: Issue 8, March 2010
CCFE Fusion
SAFEPAQ-II
4
Getting started
This and the following sections give a ‘hands-on’ guide to
using the application. Appendix 1 gives some design details.
When started for the first time the Settings window will open,
it is essential that the user fills in the correct location of files,
especially the SAFEPAQ-II databases, because the application
needs to open these immediately, and an error will be caused if
they are not available. Note that if this happens, i.e. that as soon
as SAFEPAQ-II opens it crashes, then enter safepaq2 /S on
the command line to enable it to start in safe mode (/S) so that
the settings can be corrected. The option /D can be used to give
debugging information (progress prior to a crash) in the file
C:\safepaq_debug.
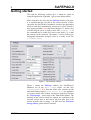
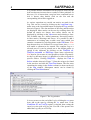
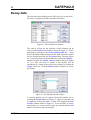
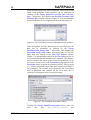
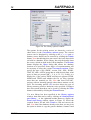
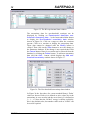
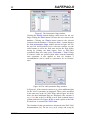
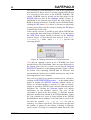
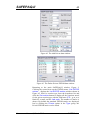
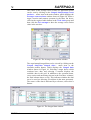
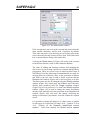
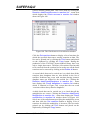
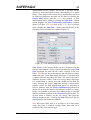
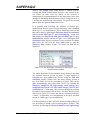
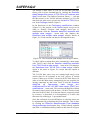
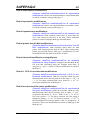
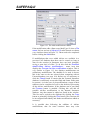
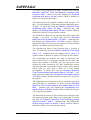
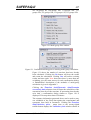
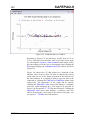
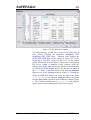
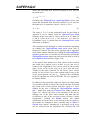
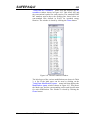
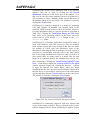
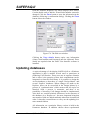
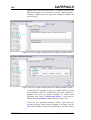
Figure 1. The Settings window.
Figure 1 shows the Settings window; the SAFEPAQ-II
databases are in the Extra Folder folder (in this case
Safepaq_DotNet). Note that this folder also contains all the
other data folders such as Cross section data; see Appendix
2 for more details. The window can also be opened by clicking
the File|Settings… menu item or the fifth toolbar button. The
meaning of the various check box options are explained in the
relevant section later in this report, but note here that if the
project includes data at energy > 20 MeV then the Extended
energy library option must be checked.
CCFE Fusion
User manual: Issue 8, March 2010
SAFEPAQ-II
5
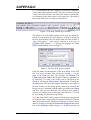
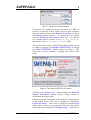
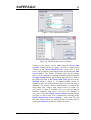
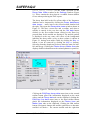
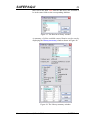
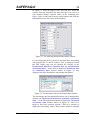
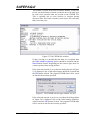
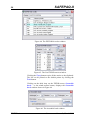
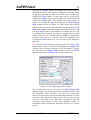
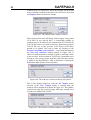
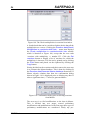
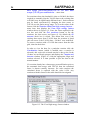
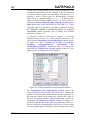
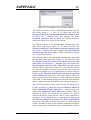
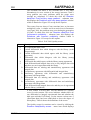
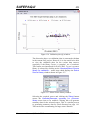
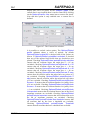
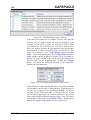
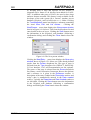
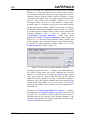
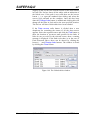
It is recommended that the supplied SAFEPAQ-II databases
remain untouched, and that a new EAF project is started. Figure
2 shows the main window, note that it has menus, a toolbar (the
set of buttons each with a picture) and a status bar. The name of
the current EAF project is shown in the title bar.
Figure 2. The main SAFEPAQ-II window.
The purpose of each toolbar button can be seen by resting the
cursor over the button, this will display a ToolTip. Clicking on
the File menu displays the File menu items, the first of these is
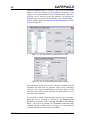
‘New EAF project…’ (this will be referred to in the text as
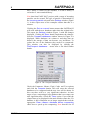
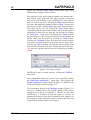
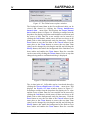
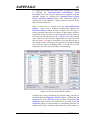
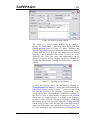
File|New EAF project…). Clicking this displays the New
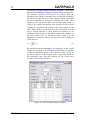
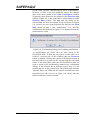
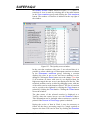
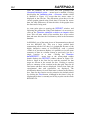
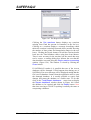
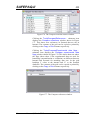
EAF project window shown in Figure 3.
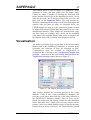
Figure 3. The New EAF project window.
Enter the name and description of the new library in the first
two text boxes and then click the browse button (…) to the
right of the Path text box. This displays the Browse For
Folder dialog that enables the location of the new databases to
be specified. Note that a new folder can be specified in the
dialog by clicking the Make New Folder button. Clicking the
Create button will cause the original databases to be copied to
the new location, all the library specific data to be removed and
the project to be renamed with the name specified in the Name
text box. This process (basically file copying) takes about 2
minutes; all timings given in this report are based on a 3.2 GHz
PC processing an extended energy library.
Note that from EASY-2005, projects with an upper energy limit
of 20 and 60 MeV can be treated. In many cases details of menu
items and windows will depend on which type is chosen; this is
done by clearing or ticking the Extended energy library check
box in the Settings window (Figure 1). In this report the 60
User manual: Issue 8, March 2010
CCFE Fusion
6
SAFEPAQ-II
MeV library is treated as the standard, a 20 MeV library is
referred to a ‘non-extended library’.
Note that from EASY-2007, projects with a range of incoming
particles can be created. The type of particle is determined by
the Incoming particle selected in the Settings window (Figure
1). In this report most of the examples assume that this is a
neutron.
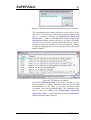
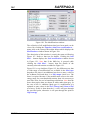
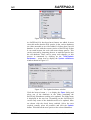
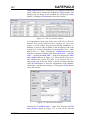
Clicking the Set as current button means that SAFEPAQ-II
will work with the new databases rather than the original ones.
This opens the Settings window (Figure 1) with the changes
displayed. Clicking the Save button implements the changes.
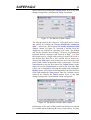
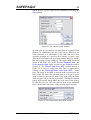
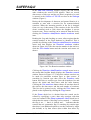
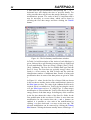
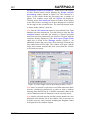
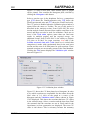
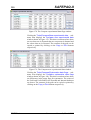
Next the Compact databases window shown in Figure 4 is
displayed. When databases are written to and then data are
deleted, the storage of data can become very inefficient. To
reduce the size of the databases they need to be compacted.
This window can also be displayed by clicking the
File|Compact databases… menu item or the third toolbar
button.
Figure 4. The Compact databases window.
Check the Parameter, Master, Final, Cache and Test options
and click the Compact button. This will cause the selected
databases to be compacted and the new sizes will be shown. In
this case there will be a very significant reduction. At later
stages of use, compacting a large database that is not empty can
take significant time. Check the Timer option if you want the
elapsed time to be displayed in the main window status bar. If a
database is full of data that are no longer required then tick the
appropriate Clear <Name> database before compacting
check box to speed up the compacting. Note that the size of
CCFE Fusion
User manual: Issue 8, March 2010
SAFEPAQ-II
7
Final includes both final.mdb and (if it exists) final_add.mdb,
see Appendix 2 for database details.
If it is required to switch to a different (existing) EAF project
then this can be done by changing the location of the
SAFEPAQ-II databases in the SAFEPAQ folder text box in
the Settings window (Figure 1).
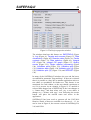
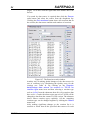
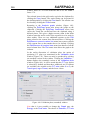
The status of progress towards creating a new EAF library can
be monitored by displaying the Status window. This is done by
clicking on File|Status… or the fourth toolbar button to
display the Status window shown in Figure 5.
Note that the name of the current EAF project is given in the
title bar. The Status window shows the various steps that have
been completed by a red tick. On a new project there will be no
ticks displayed.
Figure 5. The Status window.
User manual: Issue 8, March 2010
CCFE Fusion
8
SAFEPAQ-II
It is possible that the information on the progress shown by the
ticks can become incorrect due to crashes or other problems. In
this case, if it is known that a step has been completed but no
tick is shown, then double click on the text and the
corresponding tick will be toggled on.
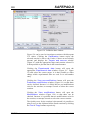
As various operations are carried out entries are made in the
Log. This can be viewed by clicking on the Log|View Log…
menu item or the last toolbar button to display the Log window
shown in Figure 6. The date and time of the entry and the action
are displayed. More entries can be seen by scrolling down. By
default all entries are shown, but various classes can be
displayed by clicking on the View menu and selecting a class.
The available ones are: Added comments, Processing entries,
Ad hoc entries, Warnings and Errors. It is possible to add a
comment to an existing entry or add a new entry (which just
contains a comment) by selecting items on the Edit menu. Note
that shortcut keys are defined for several items, thus Ctrl+E
will enable a comment to be entered. The complete Log or a
selected part of it can be printed out to the default printer or
copied to the clipboard by clicking on the File|Print all,
File|Print selected or Edit|Copy menu items respectively.
Note that for QA reasons it is not possible to delete Log entries.
As the Log becomes larger it is helpful to be able to search for
specific entries. Clicking Edit|Find… displays the Find in
Action window shown in Figure 7. Enter the string to be found
in the text box and click the Find First button. The first entry
containing the string (in the Action column) is shown at the top
of the Log window. Subsequent entries can be found by
clicking the Find Next button.
Figure 6. The Log window.
It is easy to move to the end of the Log by clicking the >> menu
item, and to the start by clicking the << menu item. If the
View|User ID as ToolTip option is checked then resting the
cursor over the grid will give the User ID of the person who
added the Log entry as a ToolTip.
CCFE Fusion
User manual: Issue 8, March 2010
SAFEPAQ-II
9
Figure 7. The Find in Action window.
The present User manual can be viewed on-line as a PDF. To
do this it is necessary to have a PDF viewer on your computer.
Enter the location of this in the Reader for pdf file text box in
the Settings window (Figure 1). To display the User manual
click the Help|View User manual menu item. Note that the
User manual must be named SAFEPAQ-II_User_manual.pdf
and must be in the Extra Folder\Documents folder.
The details of the version of SAFEPAQ-II that is being run can
be found by clicking on Help|About SAFEPAQ-II to display
the About SAFEPAQ-II window shown in Figure 8. This
shows date, version, username, copyright and a short status
report.
Figure 8. The About SAFEPAQ-II window.
Clicking on the System info… button displays the Microsoft
System Information window giving a large amount of
information about the system.
Printing is possible from many of the windows, such printing is
to the default printer. This can be changed by clicking the
File|Printer setup… menu item to display the standard Print
dialog where a printer can be selected. The page setup details
can be altered by clicking the File|Page setup… menu item to
User manual: Issue 8, March 2010
CCFE Fusion
10
SAFEPAQ-II
display the standard Page Setup dialog where page setup
details such as margins can be selected.
The status bar in the main window contains two buttons and a
time display at the right hand side. These operate a stopwatch
that can be used manually or by SAFEPAQ-II to show elapsed
times of various operations. Pressing the Start button will start
the timer and change the button caption to Stop. Clicking this
will stop the clock. Clicking Start again will restart the timer.
The timer can be reset by clicking the Zero button. Many
calculations start the timer automatically, and if the last value is
required to be stored for use later this can be done by clicking
the File|Timer… menu item. This displays the Timer window
shown in Figure 9. The current stored value and description are
shown. These can be cleared by clicking the Clear button.
Clicking the Overwrite button will place the current elapsed
time and a description entered in the first text box in the store.
Clicking the Add to button will add the current elapsed time
shown on the status bar to the store and put the sum in the store.
Note that times greater than 24 hours are shown by the number
of days.
Figure 9. The Timer window.
SAFEPAQ-II can be closed down by clicking the File|Exit…
menu item.
More information about the project can be found by clicking
the File|Project properties… menu item. This displays the
Project properties window shown in Figure 10. Details of the
Trend coefficients are given on page 132.
The information shown in the Settings window (Figure 1) is
stored in a settings file in xml format, details of the various
settings files are given in Appendix 2. This file is read when
SAFEPAQ-II is restarted so that the status is restored. In
addition the location of the more commonly used windows on
the desktop is stored when the window is closed, and then used
to position the window when it is reopened.
CCFE Fusion
User manual: Issue 8, March 2010
SAFEPAQ-II
11
Figure 10. The Project properties window.
The windows that have this feature are: SAFEPAQ-II (Figure
2), Log (Figure 6), Targets and sources (Figure 67), Data
visualisation (Figure 68), Reaction data (Figure 70), Cache
contents (Figure 79), Data selection (Figure 82), Integral
C/E (Figure 94), Integral C/E graph (Figure 97), Quality
scores (Figure 123), Single reaction processing (Figure
124), Validation plots (Figure 132), Validation plot (Figure
133),Validation data (Figure 134),Validation plot (A) (Figure
135),Validation plot (Q) (Figure 136) and REPORT (Figure
138).
In many of the SAFEPAQ-II windows the text and list boxes
are enabled for automatic ‘drag-and-drop’. If the text is selected
then it is possible to ‘drag’ this to another application such as a
text editor or spreadsheet for further use. This feature is not
mentioned for each window, so the user should experiment to
see if it is present. As an example, in Figure 11 if a nuclide is
selected then dragged out of SAFEPAQ-II, the icon changes to
a ‘Cannot drop’, and then when over, say a text editor, it
changes to a ‘Pointer with copy’ icon. Releasing the mouse
button will place the nuclide name and source in the
application.
SAFEPAQ-II has been used to generate all the EAF-2010
libraries; details of these are available in references 9 – 13. As
can be seen in Figure 8, the current version of SAFEPAQ-II is
2.0, build 3506.
User manual: Issue 8, March 2010
CCFE Fusion
12
SAFEPAQ-II
Decay data
The first task when building a new EAF project is to deal with
the choice of required nuclides and their decay data.
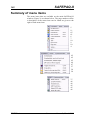
Figure 11. The Nuclide list window.
The sources of data for the nuclides of each element can be
viewed in the Nuclide list window shown in Figure 11. This is
displayed by clicking on the Decay data|Nuclide list… menu
item or the third toolbar button from the right. Enter the symbol
for the element and click the Get data button. The data source
for a selected nuclide can be modified by clicking the Modify…
button to display the Modify nuclide window shown in Figure
12. Note that you need to decide if the nuclide will be
considered as a target in the cross section library by ticking the
Target check box. Click the Modify button in Figure 12 to save
the change.
Figure 12. The Modify nuclide window.
A selected nuclide can be removed from the nuclide list by
clicking the Delete button in Figure 11, and a new nuclide can
be added by clicking the Add… button. This displays the Add
nuclide window shown in Figure 13. A new nuclide, its source
and whether it is a cross section target are entered and the Add
button is clicked to store the changes.
CCFE Fusion
User manual: Issue 8, March 2010
SAFEPAQ-II
13
Figure 13. The Add nuclide window.
Figure 14. The Decay data sources window.
Changes to the sources can be made using the Decay data
sources window shown in Figure 14. This is displayed by
clicking on the Decay data|Sources… menu item. A new
source can be added by entering the name and clicking the Add
source button. The number of header lines for an existing
source can be changed by entering the number and clicking the
Change number button. All the decay data sources are held in
the folder specified in the Decay data folder text box in the
Settings window (Figure 1) in standard ENDF format. In
contrast to the cross section libraries these are not converted to
databases. The reason is that no modifications are made to the
decay data; only a choice from various sources is made. If a
new source of data is available, and it is required that all
nuclides originally with source old_source are changed to
new_source, then the Global source replace window shown
in Figure 15 can be used. This is displayed by clicking on the
Decay data|Global source replace… menu item. The old
and new source names are entered in the text boxes and by
clicking the Replace button the changes are made.
User manual: Issue 8, March 2010
CCFE Fusion
14
SAFEPAQ-II
Figure 15. The Global source replace window.
The biological hazard data in the KnownHazards table can be
viewed and altered by clicking the Decay data|Known
hazard data… menu item. This displays the Known hazard
data window shown in Figure 16. Selecting a nuclide from the
dropdown list displays ingestion and inhalation coefficients and
the source of data. Data for a new nuclide can be entered by
clicking the Add button, which causes all four text boxes to be
blank (with a white background) ready for data entry. Click the
Save button to save the new data or the Cancel button (in the
same place as the Close button) to remove the new data. Data
values can be changed by selecting the nuclide and clicking the
Modify button, this makes the background of the final three text
boxes white and enables the Save button. Data for a nuclide
can be removed by clicking the Delete button. Prior to any data
changes being made a confirmation dialog is displayed.
Figure 16. The Known hazard data window.
The A2 data in the A2_IAEA table can be viewed and altered by
clicking the Decay data|Known A2 data… menu item. This
displays the Known A2 data window shown in Figure 17.
Selecting a nuclide from the dropdown list displays its A2 value
and the source of data. Data for a new nuclide can be entered by
clicking the Add button, which causes all three text boxes to be
blank (with a white background) ready for data entry. Click the
Save button to save the new data or the Cancel button (in the
same place as the Close button) to remove the new data. Data
values can be changed by selecting the nuclide and clicking the
Modify button, this makes the background of the final two text
boxes white and enables the Save button. Data for a nuclide
CCFE Fusion
User manual: Issue 8, March 2010
SAFEPAQ-II
15
can be removed by clicking the Delete button. Prior to any data
changes being made a confirmation dialog is displayed.
Figure 17. The Known A2 data window.
The clearance data in the Clearance_IAEA table can be viewed
and altered by clicking the Decay data|Known clearance
data… menu item. This displays the Known clearance data
window shown in Figure 18. Selecting a nuclide from the
dropdown list displays its clearance level value. The default
unit for the clearance level is Bqkg-1. However, by clicking the
# button data are displayed (and entered) as Bqg-1. Note that
this button acts as a toggle and pressing it again will revert to
the default unit. Data for a new nuclide can be entered by
clicking the Add button, which causes the two text boxes to be
blank (with a white background) ready for data entry. Click the
Save button to save the new data or the Cancel button (in the
same place as the Close button) to remove the new data. Data
values can be changed by selecting the nuclide and clicking the
Modify button, this makes the background of the final text box
white and enables the Save button. Data for a nuclide can be
removed by clicking the Delete button. Prior to any data
changes being made a confirmation dialog is displayed.
Figure 18. The Known clearance data window.
Information on the spins of the ground state and isomers should
be available when producing the cross section library. In some
User manual: Issue 8, March 2010
CCFE Fusion
16
SAFEPAQ-II
poorly known nuclides the spin is unknown, such a lack of data
could cause problems. These nuclides can be identified by
clicking on the Decay data|Find nuclides with unknown
spin… menu item. This displays the Nuclides (isomers) with
unknown spin window shown in Figure 19. It is recommended
that these nuclides be investigated and the spin data improved.
Figure 19. The Nuclides (isomers) with unknown spin window.
Once all nuclides and the data sources are specified then the
data can be assembled by clicking on the Decay
data|Assemble decay data… menu item. This displays the
Assemble decay data window shown in Figure 20. The file
name that was entered in the New EAF project window
(Figure 3) is automatically entered in the File name text box (it
is recommended that this should not be changed). This name is
used to construct the names of the various decay data files. Tick
the various check boxes in the Processes group and click the
Assemble button to begin the assembly process. This is quick
(~ 1 minute) and all the decay data files required by FISPACT
are generated. The second option generates the DecayData
table in Parameter that contains all the decay data; this is
required for subsequent cross section processing.
Figure 20. The Assemble decay data window.
Clicking the Decay data|Documentation menu item will
write
two
files
decay_library_contents
and
CCFE Fusion
User manual: Issue 8, March 2010
SAFEPAQ-II
17
(in the folder specified in the
Decay data folder textbox in the Settings window (Figure
1)). These contain the decay data in a readable format suitable
for use when producing the EAF reports.
hazard_library_contents
The decay data held in the DecayData table of the Parameter
database can be inspected by clicking the Decay data|Decay
data viewer… menu item or the second toolbar button from
the right. This opens the Decay data viewer window shown in
Figure 21. This has a menu bar and a toolbar, and when a
nuclide is entered in the text box and the Get data button
clicked (or the first toolbar button clicked or the Enter key
pressed) data for the nuclide are displayed. The nuclide symbol
is displayed at the top centre, the colour of the background
indicates the decay mode (a key to these colours is shown in
Figure 21, having been made visible by clicking the Key >>
button, it can be removed by clicking the Key << button).
Selecting from the dropdown list boxes alters the units for halflife and energy. Clicking the Photon lines or Matter lines tabs
displays further information on the emitted photons or particles.
Figure 21. The Decay data viewer window.
Clicking the Edit|Copy decay data menu item or the second
toolbar button places the information displayed on the main
widow and the Decay data tab on the clipboard, clicking the
Edit|Copy line data menu item or the third toolbar button
places the information displayed on the Photon lines and
Matter lines tabs on the clipboard. Clicking the fifth toolbar
button (Navigator) changes the nuclide symbol box so that nine
nuclides are shown – the current nuclide and the eight that
User manual: Issue 8, March 2010
CCFE Fusion
18
SAFEPAQ-II
surround it in a ‘Chart of the Nuclides’ plot. Clicking one of
these makes that nuclide the current one, displaying data for it.
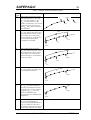
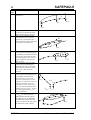
Clicking the Chain… button displays the Decay Chain
window shown in Figure 22 (the nuclide name is placed in the
title bar of the window). Clicking the Draw menu item displays
the chains, by default with no half-life information in black and
white. Clicking the Options|Colour menu item shows the
arrows in the colours appropriate for the decay mode (the key
colours in Figure 21), while clicking the Options|Show halflife menu item includes the nuclide half-lives (as shown in
Figure 22). The Options|Font and Options|Size menu items
allow the size (6, 8, 10 points) and font type (Courier or Times)
to be used to display the chains. Clicking the Print menu item
sends the displayed decay chain to the default printer, while the
Close menu item closes the window. If the length of the chains
is such that not all the nuclides are visible in the window then
the window can be resized.
Figure 22. The Decay chain window.
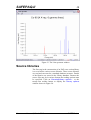
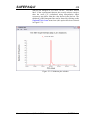
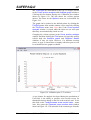
Clicking the View|Plot line energies… menu item in Figure
21 or the fourth toolbar button displays the Line spectrum
window shown in Figure 23. This plots the gamma and X-ray
lines (in blue and red respectively) that are emitted by the
nuclide. The graph can be printed to the default printer by
clicking the File|Print menu item and it can be copied to the
clipboard by clicking the Edit|Copy menu item. The graph is
‘Hot’, by clicking on the top of any of the lines information
about it is displayed in the status bar.
CCFE Fusion
User manual: Issue 8, March 2010
SAFEPAQ-II
19
Figure 23. The Line spectrum window.
Source libraries
The first step in the construction of an EAF cross section library
is to read all the various source libraries. These source libraries
are read and converted to a standard database structure. Details
of the libraries are stored in the Library database. Because the
source files may be in various formats the reading options must
be specified. Click on Libraries|Library options… or the
twenty-first toolbar button to display the Library options
window shown in Figure 24.
User manual: Issue 8, March 2010
CCFE Fusion
20
SAFEPAQ-II
Figure 24. The Library options window.
The options for the existing sources are shown by a series of
check boxes in the Conversion options group. The various
sources can be displayed by clicking on the >, <, >> and <<
buttons, source details can be removed by clicking the Delete
button. Note that deleting does not remove the basic data which
are held in a database for the library; but only the details about
the source, which are held in the Library database. The Browse
button displays the Open dialog that allows the database
location to be specified. Some degree of experimentation will
be necessary to select the various Conversion options. These
specify the type of file (ENDF, version, EAF, ADL, JENDL,
IEAF, XY table, ANITA group data or with derived data), what
types of data are present (MF = 2, 4, 6, 32, 33), if there is a
header line, if the various ENDF end lines are present (FEND,
MEND and TEND) and whether the file (or files) contains
more that one material per file. Note that from EAF-2007,
projects with an incoming particle other than a neutron can be
used. The incoming particle (IP) text box allows the type of
library (neutron, proton or deuteron) to be specified. If changes
have been made then these can be saved by clicking the Save
button or discarded by clicking the Discard button.
If a new library has been specified in the Library options
window, then data can be read by clicking on Libraries|Read
new library… or the eighteenth toolbar button to display the
Read new library window shown in Figure 25. Select the
required Source ID and click Read to read and convert the
data. Note that if the database already exists then you are given
the option to delete it, copy the generic database, rename it and
CCFE Fusion
User manual: Issue 8, March 2010
SAFEPAQ-II
21
then read in the data. Note that the data file(s) are assumed to
be in the same folder as the corresponding database.
Figure 25. The Read new library window.
A summary of all the available source libraries can be seen by
displaying the Library summary window shown in Figure 26.
Figure 26. The Library summary window.
User manual: Issue 8, March 2010
CCFE Fusion
22
SAFEPAQ-II
This is displayed by clicking on the Libraries|Library
summary… menu item or the twentieth toolbar button. This
shows the available sources, the conversion options used and
the types and numbers of reactions.
Having read a new library using Figure 25 it is necessary to add
this to the summary by clicking the Add… button in Figure 26.
This displays the Add library window shown in Figure 27. Any
libraries not entered into the summary are displayed; clicking
the Add button will add the selected library.
Note that if you wish to re-read a source library then it is
necessary to first remove it from the summary using the Delete
button in Figure 26, then to read it using Figure 25 and then to
add it to the summary again using Figure 26 and Figure 27.
Figure 27. The Add library window.
The Library summary window can be used to check what data
are contained in each library, but if it is required to check which
libraries contain a particular reaction, then it is quicker to use
the Library search window shown in Figure 28. This is
displayed by clicking on the Libraries|Library search… menu
item or the nineteenth toolbar button. It is possible to enter
various amounts of information before making the search by
clicking the Find button. Note that only libraries appropriate to
the type of incoming particle selected in the Settings window
(Figure 1) are displayed. If the Target element is specified
(the three remaining boxes are empty) then libraries containing
that element as a target are displayed. If the Target element
and Target mass are specified (the two remaining boxes are
empty) then libraries containing that nuclide in any isomeric
state as a target are displayed. If the Target element, Target
mass and Target state are specified (the Reaction box is
empty) then libraries containing that nuclide as a target are
displayed. If all the inputs are specified then libraries containing
that nuclide as a target for that reaction are displayed. Note that
you cannot ‘leave gaps’ in the input, if a reaction is specified
then all the three boxes above must be filled. The result of the
CCFE Fusion
User manual: Issue 8, March 2010
SAFEPAQ-II
23
search process can be copied to the clipboard by clicking the
Copy button.
Figure 28. The Library search window.
In most cases it is possible to use data from the original source
libraries in constructing the new EAF library. However, for
some reactions it is preferrable to use data that have been
specially prepared for a previous EAF library. In such a case
data can be extracted from an existing Master Data File (MDF)
that was prepared using SYMPAL. The whole MDF should be
stored in the folder MDF on the Source database disk, and
Cross section data folder specified in the Settings window
(Figure 1). The Extract data from MDF window shown in
Figure 29 is used to extract the data. This is displayed by
clicking on the Libraries|Extract data from MDF… menu
item. The name of the MDF is entered in the first text box, the
name of the file where the extracted data are to be put is given
in the second text box and the name of the Source ID (the name
used in Figure 24) is entered in the third. Clicking the Extract
button will read the whole MDF and copy data for the Source
ID into the new file. This can then be used as an additional
source in the same way as any of the existing source libraries.
Figure 29. The Extract data from MDF window.
User manual: Issue 8, March 2010
CCFE Fusion
SAFEPAQ-II
24
Experimental data
The data available at thermal energy can be displayed by
clicking on Experimental data|View 0.0253 eV data … or
the tenth toolbar button to display the 0.0253 eV
experimental data window shown in Figure 30. Selecting a
target shows which reactions have data, and selecting a reaction
displays the available data in the grid. Note that depending on
the incoming particle type selected the Settings window
(Figure 1) the reactions here and in subsequent windows will be
e.g. (n,2n), (d,2n) or (p,2n). In addition to the energy, cross
section and uncertainty displayed in the first three columns, the
last three columns show three flags. These indicate whether the
data are used for calculating branching modifications (Use B),
for calculating renormalisation modifications (Use R) and in
validation (Use V). The source of the data is indicated by a
reference, where this is known. Clicking the Modify button will
display the selected data in editing boxes below the reference.
Changes to the data values or the flags can then be made and
saved to the database by clicking the Save button. A new data
point can be added by clicking the Add button. This displays
the dialog shown in Figure 31, asking if the new data point is
for the selected target and reaction. If the Yes button is clicked
then the editing boxes used in the modification process are
used. If the No button is clicked then the Add 0.0253 eV
experimental data window shown in Figure 32 is displayed.
Figure 30. The 0.0253 eV experimental data window.
Enter target and reaction details in the first text box, the
dropdown list and with the Final state radio buttons. Enter the
experimental data in the text boxes and check the usage flags
that apply. The default cross section unit is b, but by clicking
the # button it is possible to toggle between b and mb for data
entry. Note that the # button should be clicked prior to data
entry. Select a reference from the dropdown list. Clicking the
Add button will save the data in the Parameter database. Note
that the flags must be chosen so that either none or only a single
data point is used for branching, renormalisation or validation.
However, if duplicates are present then the last entered ‘Yes’
CCFE Fusion
User manual: Issue 8, March 2010
SAFEPAQ-II
25
value is retained, any existing ‘Yes’ is automatically changed to
‘No’.
Figure 31. A dialog to choose the type of Add process.
Figure 32. The Add 0.0253 eV experimental data window.
The data available at 30 keV can be displayed by clicking on
Experimental data|View 30 keV data … or the eleventh
toolbar button to display the 30 keV experimental data
window shown in Figure 33. Selecting a target shows which
reactions have data, and selecting a reaction displays the
available data in the grid. In addition to the energy, cross
section and uncertainty displayed in the first three columns, the
last three columns show three flags. These indicate whether the
data are used for calculating branching modifications (Use B),
for calculating renormalisation modifications (Use R) and in
validation (Use V). The source of the data is indicated by a
reference, where this is known. Clicking the Modify button will
display the selected data in editing boxes below the reference
(shown in Figure 33). Changes to the data values or the flags
can then be made and saved to the database by clicking the
Save button; if the change is not required then click the
Cancel button. A new data point can be added by clicking the
Add button. This displays the dialog shown in Figure 31,
asking if the new data point is for the selected target and
reaction. If the Yes button is clicked then the editing boxes
User manual: Issue 8, March 2010
CCFE Fusion
26
SAFEPAQ-II
used in the modification process are used. If the No button is
clicked then the Add 30 keV experimental data window,
very similar to that shown in Figure 32, is displayed. Note that
the flags must be chosen so that either none or only a single
data point is used for branching, renormalisation or validation.
However, if duplicates are present then the last entered ‘Yes’
value is retained, any existing ‘Yes’ is automatically changed to
‘No’.
Figure 33. The 30 keV experimental data window.
The data available at 14.5 MeV can be displayed by clicking on
Experimental data|View 14.5 MeV data … or the twelfth
toolbar button to display the 14.5 MeV experimental data
window shown in Figure 34. Selecting a target shows which
reactions have data, and selecting a reaction displays the
available data in the grid. In addition to the energy, cross
section and uncertainty displayed in the first three columns, the
last three columns show three flags. These indicate whether the
data are used for calculating branching modifications (Use B),
for calculating renormalisation modifications (Use R) and in
validation (Use V). The source of the data is indicated by a
reference, where this is known. Clicking the Modify button will
display the selected data in editing boxes below the reference.
Changes to the data values or the flags can then be made and
saved to the database by clicking the Save button. A new data
point can be added by clicking the Add button. This displays
the dialog shown in Figure 31, asking if the new data point is
for the selected target and reaction. If the Yes button is clicked
then the editing boxes used in the modification process are
used. If the No button is clicked then the Add 14.5 MeV
experimental data window, very similar to that shown in
Figure 32, is displayed. Note that the flags must be chosen so
that either none or only a single data point is used for
branching, renormalisation or validation. However, if
duplicates are present then the last entered ‘Yes’ value is
retained, any existing ‘Yes’ is automatically changed to ‘No’.
At this energy there are typically many reactions on a target,
and several data points for a given reaction.
CCFE Fusion
User manual: Issue 8, March 2010
SAFEPAQ-II
27
Figure 34. The 14.5 MeV experimental data window.
The data available for the resonance integal can be displayed by
clicking on Experimental data|View RI data … or the
thirteenth toolbar button to display the RI experimental data
window shown in Figure 35. Selecting a target shows which
reactions have data, and selecting a reaction displays the
available data in the grid. In addition to the resonance integral
and uncertainty displayed in the first two columns, the last three
columns show three flags. These indicate whether the data are
used for calculating branching modifications (Use B), for
calculating renormalisation modifications (Use R) and in
validation (Use V). Clicking the Modify button will display the
selected data in editing boxes below the reference. Changes to
the data values or the flags can then be made and saved to the
database by clicking the Save button. A new data point can be
added by clicking the Add button. This displays the dialog
shown in Figure 31, asking if the new data point is for the
selected target and reaction. If the Yes button is clicked then
the editing boxes used in the modification process are used. If
the No button is clicked then the Add RI experimental data
window, very similar to that shown in Figure 32, is displayed.
Note that the flags must be chosen so that either none or only a
single data point is used for branching, renormalisation or
validation. However, if duplicates are present then the last
entered ‘Yes’ value is retained, any existing ‘Yes’ is
automatically changed to ‘No’. Note that at present no
resonance integral data are used for renormalisation or
branching.
User manual: Issue 8, March 2010
CCFE Fusion
28
SAFEPAQ-II
Figure 35. The RI experimental data window.
The uncertainty data for non-threshold reactions can be
displayed by clicking on Experimental data|View nonthreshold uncertainty data… or the fourteenth toolbar button
to display the Non-threshold uncertainty data window
shown in Figure 36. Click on a target to show the reactions
present. Click on a reaction to display the uncertainty data.
These data cannot be changed until the Modify button is
clicked. Then click on the Save button to save the change to
the Parameter database. If the change is not required then click
the Cancel button. Data for a reaction can be removed from the
database by clicking the Delete button. To add new uncertainty
data click the Add… button, which displays the Add nonthreshold uncertainty window shown in Figure 37.
Figure 36. The Non-threshold uncertainty data window.
In Figure 36 the four (three for a non-extended library) ‘Delta’
values are shown. Delta (∆) is defined as ∆σ/σ, where ∆σ is the
uncertainty in cross section and the error factor (f) is defined as
f = 1 + ∆. Note that the 20 MeV energy is shown explicitily;
this is the default value, but another value such as 30 MeV can
be used if required.
CCFE Fusion
User manual: Issue 8, March 2010
SAFEPAQ-II
29
In Figure 37 enter the target in the first text box, select the
reaction from the dropdown list and enter the seven (six for a
non-extended library) required values in the remaining text
boxes. Select a final state from the radio buttons and click the
Add button to save the values in the database.
Figure 37. The Add non-threshold uncertainty window.
It is necessary that all (n,γ) and (n,f) reactions have uncertainty
data (specifically EV and EH values). Prior to starting to build
the EAF library this can be checked by clicking on the
Experimental data|Find reactions with no non-threshold
uncertainty data… menu item to display the Reactions with
no uncertainty data window shown in Figure 38. Any
displayed reactions should have uncertainty data added.
Figure 38. The Reactions with no uncertainty data window.
The uncertainty data for threshold reactions can be displayed by
clicking on Experimental data|View threshold uncertainty
data… or the fifteenth toolbar button to display the Threshold
uncertainty data window shown in Figure 39. Click on a
target to show the reactions present. Click on a reaction to
display the uncertainty values. These values cannot be changed
User manual: Issue 8, March 2010
CCFE Fusion
30
SAFEPAQ-II
until the Modify button is clicked. Then click on the Save
button to save the change to the Parameter database. If the
change is not required then click the Cancel button. Data for a
reaction can be removed from the database by clicking the
Delete button. To add a new uncertainty value click the Add…
button, which displays the Add threshold uncertainty window
shown in Figure 40.
Figure 39. The Threshold uncertainty data window.
Figure 40. The Add threshold uncertainty window.
Enter the target in the first text box, select the reaction from the
dropdown list and enter the required values in the remaining
three (two for a non-extended library) text boxes. Select a final
state from the radio buttons and click the Add button to save
the value in the database.
It is possible to check if all threshold reactions have uncertainty
data; this can be checked by clicking on the Experimental
data|Find reactions with missing threshold uncertainty
data… menu item to display the Threshold reactions with
missing uncert. window shown in Figure 41. Any displayed
reactions should have uncertainty data added.
CCFE Fusion
User manual: Issue 8, March 2010
SAFEPAQ-II
31
Figure 41. The threshold reactions with missing uncert. window.
The experimental data contain references to the source of the
data. These references are held in the Parameter database and
can be viewed by clicking on Experimental data|View
References … or the seventeenth toolbar button to display the
References window shown in Figure 42. A Source ID and the
reference text are shown. As indicated by the window text it is
possible to add a new reference or edit an existing one. Editing
is done by changing the text. Note that the Source ID should
not be changed.
Figure 42. The References window.
Under the Experimental data menu there is an item to view
those nuclides for which systematics data are used during
renormalisation. If the flags are set then systematics take
precedence over any experimental data. The systematics flags
can be seen by clicking the Experimental data|View
systematics flags … menu item, this opens the Systematics
flags window shown in Figure 43.
User manual: Issue 8, March 2010
CCFE Fusion
32
SAFEPAQ-II
Figure 43. The Systematics flags window.
Clicking the Modify button displays check boxes for the two
flags, clicking the Save button will store the new values in the
database. Clicking the Delete button removes the selected
reaction from the database. Clicking the Add… button displays
the Add systematics flags window shown in Figure 44. Use
the text box and dropdown list to select the reaction, use the
radio buttons to select the final state and set the flags before
saving by clicking the Add button. Prior to EAF-2005
systematics flags were only set for Final state = Total. If flags
to isomeric states are specified then when used the branching
ratio systematic is also applied so that, for example, a
renormalistaion can be made to systematics for an isomeric
state.
Figure 44. The Add systematics flags window.
In Figure 43, if the selected reaction is (n,γ) then additional data
for the 30 keV systematic are displayed. These can be modified
in the same way as the 14.5 MeV flags, and in Figure 44, check
boxes for these additional flags are displayed if the reaction is
(n,γ). Note that as the Use B flag is never used it should always
remain unchecked. In Figure 44 this is made explicit as the Use
R check box is renamed 14.5 MeV data.
The formulae for the systematics are discussed in the EAF-2010
documentation [10]. For the (n,t), (n,d), (n,n′p) and (n,n′p+d)
CCFE Fusion
User manual: Issue 8, March 2010
SAFEPAQ-II
33
reactions an alternate set of formulae have been defined. The
choice between the two set can be made by selecting Standard
or Alternate on the Experimental data|Systematics menu
item. Note that this choice remains until changed and so applies
to all calculation or use of systematics.
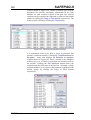
Clicking the Experimental data |Elemental analysis… menu
item displays the Elemental analysis window shown in Figure
45. The element and reaction are selected from the dropdown
lists and the energy, elemental cross section and uncertainty are
entered in the text boxes. The required isotope (generally the
most abundant) is selected by clicking one of the radio buttons
to the left of the table and the Get data button is clicked. The
cross sections for the various isotopes are extracted from the
Final database at the specified energy and entered in the third
column of the table. When all the cross sections have been
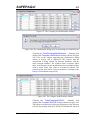
found then the sum is formed and the ki values defined in
equation (1) are calculated and displayed in the fourth column.
In equation (1) the cross sections (σic) are the library values,
while fi are the abundances. Finally the isotopic cross section
value is displayed in the text box.
ki = σ ic
∑f σ
j
c
j
(1)
j
By default the natural abundances are displayed in the second
column. By clicking on the Enriched radio button it is possible
to edit the abundance values to the required values. As can be
seen from Figure 45, the isotopic value is generally similar to
the elemental value, but this depends on the actual cross
sections and abundances of the isotopes for the selected
element.
User manual: Issue 8, March 2010
CCFE Fusion
34
SAFEPAQ-II
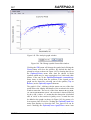
Figure 45. The Elemental analysis window.
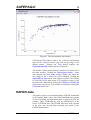
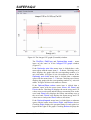
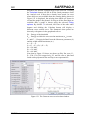
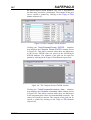
It is possible to plot the experimental data in a similar fashion
to what can be done in the Analysis tool (Figure 144), but with
some additional options. Clicking the Experimental data|Plot
experimental data … menu item, opens the Plot
experimental data window shown in Figure 46. Select the
reaction type in the dropdown list, choose the x-axis value and
the energy range of data and select the required check boxes.
These decide if only data with the Validation flag set or only
total (summed) data are plotted. If the Custom energy radio
button is selected than two additional text boxes are displayed
where the low and high energy limits can be entered.
Figure 46. The Plot experimental data window.
CCFE Fusion
User manual: Issue 8, March 2010
SAFEPAQ-II
35
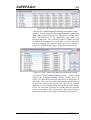
Figure 47. The Experimental data window.
Clicking the Print button sends a list of all the experimental
data for the selected reaction type and energy range to the
default printer. Clicking the Plot button displays the
Experimental data window shown in Figure 47.
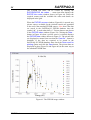
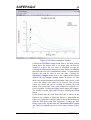
The number of data points plotted is shown in the status bar of
the main window. Clicking the Options|Axis scale… menu
item displays the Axis scale window (Figure 89) where the
axis ranges on the x- and y-axes can be changed. Clicking the
Options|Error bars menu item toggles on and off the display
of error bars for the data points. It is possible to print or copy
the plot to the clipboard by clicking the File|Print or Edit|Copy
menu items respectively. The window is cloded by clicking the
File|Close menu item.
EXFOR data
The primary source of experimental data is EXFOR, maintained
by the Nuclear Data Centres. The NEA Data Bank have put this
on two CD-ROMs and distributed them as part of the JEF-PC
package. These CD-ROMs are used by SAFEPAQ-II as the
source of EXFOR data. The EXFOR files have been searched
in the past and relevant data extracted and stored in the
EXFOR.mdb database
User manual: Issue 8, March 2010
CCFE Fusion
36
SAFEPAQ-II
The SAFEPAQ-II EXFOR database is used in the visualisation
described below, but to select or view the original EXFOR data
it is necessary to have access to the EXFOR CD-ROMs. The
correct CD-ROM must be present on the disk shown in the
EXFOR disk text box in the Settings window (Figure 1).
SAFEPAQ-II will warn the user (Figure 48) if the wrong CDROM is present in the drive; load the correct CD-ROM before
clicking the OK button. Note that it is necessary to physically
put the correct disk in the drive before clicking the OK button
or SAFEPAQ-II will crash.
In the current version it is possible to store all the EXFOR data
on a removable disk rather than a CD-ROM. To use this option
the USB Drive option should be checked in the Settings
window (Figure 1). Note that the data must be in the Exfor
disk/EXFOR_CD_x folder, where x = n, d, p specifies the
incoming particle.
Figure 48. Warning that incorrect CD-ROM present.
Note that an updated version of the CD-ROMs has been
provided by the NEA Data Bank. There are some differences in
the format, and if the new version is used then the Original
EXFOR CD check box on the Settings window (Figure 1) must
be cleared. CDs containing EXFOR data for deuteron- and
proton-induced reactions are available and must be used if the
incoming particle is not a neutron.
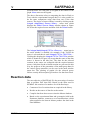
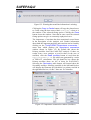
The sources of data for a particular reaction can be viewed by
clicking on EXFOR|EXFOR sources … or the eighth toolbar
button to display the EXFOR sources window shown in
Figure 49. A target nuclide is entered (Note that no isomeric
targets are present in EXFOR), and a reaction selected from the
dropdown list. Clicking the Sources button will display
information on the available sources. The year of the
experiment is given in the first column, ‘#’ indicates that the
data have already been selected in the EXFOR database. Under
the Type column are a series of codes defined in the EXFOR
documentation, but in addition, if the final state is given in the
file then the symbols ‘->g’, ‘->m’ or ‘->n’ are used to
indicate g, m, n states respectively. The Lab codes, energies and
the number of points are also shown. Selecting a particular
source causes a ToolTip to be displayed which shows the Full
CCFE Fusion
User manual: Issue 8, March 2010
SAFEPAQ-II
37
Access number e.g. 40306.002 of the entry, this is a number
that can be useful if the particular data file is required on the
CD-ROM.
Figure 49. The EXFOR sources window.
It is possible to view the complete EXFOR index file for this
nuclide by clicking the View index… button which displays
the EXFOR index window shown in Figure 50. Note that if the
columns do not line up correctly then adjust the value in the
EXFOR index width text box in the Settings window (Figure
1).
Figure 50. The EXFOR index window.
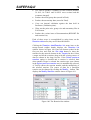
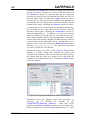
Selecting a particular source in Figure 49 enables a detailed
view of the data by clicking the Data… button which displays
the EXFOR data window shown in Figure 51 (the reaction
name is placed in the title bar of the window). This displays
information about the experiment (authors, institute, title of
paper, reference and the neutron monitor), information on the
daughter state (this is taken from the DecayData table in
Parameter, not from anything stored in the EXFOR file) and the
data points. In some cases the file specifies that a particular
daughter state was measured, in this case the Final state can be
selected from the available radio buttons. The original EXFOR
file can be viewed by clicking the View file… button which
User manual: Issue 8, March 2010
CCFE Fusion
38
SAFEPAQ-II
displays the EXFOR file window shown in Figure 52. This is
sometimes necessary to check on the final state or other details.
Note that in the Final state group the expected g, m, n and
Total options are available. There is an additional entry Mixed,
which should be selected if the data points in the grid refer to
different final states (as indicated in the FS column). If Mixed
is selected then when the data are saved, these are stored in
several entries with the correct final states.
Figure 51. The EXFOR data window for a particular reaction.
For mixed cases it is possible that the FS entries shown in the
grid are incorrect. If so then use the keys 0, 1 or 9 (on the
keyboard) to edit the entry. This information is saved correctly
in the EXFOR database. However, when the data source is
selected again the (incorrect) information from the CD-ROM is
displayed in the grid.
Select a series of rows in the grid; pressing Ctrl+C copies the
energy and cross section data to the clipboard, pressing Ctrl+S
copies the energy and cross section data to a new scrap file with
name NuclideReaction_EXFOR (see page 57 for more details
of scrap files). These keyboard short cuts are displayed in a
ToolTip if the cursor is hovered over the data grid.
By default the Reference information is expanded to make it
more readable than the codes used in the EXFOR files. If there
is an error caused by a reference not being correctly handled,
then it is possible to switch off the expansion process. This is
done by clearing the Expand EXFOR refs check box in the
Settings window (Figure 1).
CCFE Fusion
User manual: Issue 8, March 2010
SAFEPAQ-II
39
The number of points in the data set and the number of data sets
for the reaction already selected are shown above the data grid.
In some cases incorrect data are present on the EXFOR CD.
This is typically due to cross sections or energies having
incorrect units. Provision is made to store factors for each entry
that correct the error.
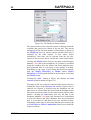
Figure 52. The EXFOR file window.
If after viewing it is decided that the data set is required then
the Data used for plotting option should be checked and the
Save button clicked. Depending on the reaction type there are
various options when saving the data.
If the selected reaction is (n,x) then the dialog shown in Figure
53 is displayed. One of the radio buttons should be selected and
the OK button clicked. The original EXFOR data will be saved
as data for the reaction specified.
Figure 53. The EXFOR reaction type window for (n,x).
If the selected reaction is (n,n′p) or (n,d) then the dialog shown
in Figure 54 is displayed. One of the radio buttons should be
selected and the OK button clicked. The original EXFOR data
will be saved as data for the reaction specified.
User manual: Issue 8, March 2010
CCFE Fusion
40
SAFEPAQ-II
Figure 54. The EXFOR reaction type window for (n,d).
If the selected reaction is (n,n′d) or (n,t) then the dialog shown
in Figure 55 is displayed. One of the radio buttons should be
selected and the OK button clicked. The original EXFOR data
will be saved as data for the reaction specified.
Figure 55. The EXFOR reaction type window for (n,t).
If the selected reaction is (n,h) then the dialog shown in Figure
56 is displayed. One of the radio buttons should be selected and
the OK button clicked. The original EXFOR data will be saved
as data for the reaction specified.
Figure 56. The EXFOR reaction type window for (n,h).
If the selected reaction is (n,α) then the dialog shown in Figure
57 is displayed. One of the radio buttons should be selected and
the OK button clicked. The original EXFOR data will be saved
as data for the reaction specified.
CCFE Fusion
User manual: Issue 8, March 2010
SAFEPAQ-II
41
Figure 57. The EXFOR reaction type window for (n,α).
If the selected reaction is (n,n′α) then the dialog shown in
Figure 58 is displayed. One of the radio buttons should be
selected and the OK button clicked. The original EXFOR data
will be saved as data for the reaction specified.
Figure 58. The EXFOR reaction type window for (n,n′α).
Note that if a summed reaction is chosen in Figure 54 - Figure
58 then the data are saved as a reaction with an MT>200.
However, they will be displayed on plots of reactions of both
the summed and the base reaction. For example if data are
saved for reaction type (n,α+), then on plots of both (n,α) and
(n,α+) the saved EXFOR data will be displayed.
Clicking on the Plot button in Figure 51 displays the EXFOR
plot window shown in Figure 59.
Figure 59 shows the data points for the selected data source.
There are no options for changing axes types or scales, and it is
designed just to enable a ‘quick look’ at the data. However, the
graph can be printed to the default printer or copied to the
clipboard by selecting the File|Print or Edit|Copy menu items.
Returning to Figure 49, it is possible to plot all the data sets that
have been selected and saved in the EXFOR database by
clicking the Plot all button. This displays the EXFOR master
plot window shown in Figure 60. It is possible to change axes
types, but the window is designed just to enable a ‘quick look’
at the data. By default the data are plotted with Lin/Lin axes,
but by clicking on the Options|Log/Log axes menu item the
graph is replotted with Log/Log axes. Clicking the
Options|Lin/Lin axes menu item replots the graph with
Lin/Lin axes. The graph can be printed to the default printer or
User manual: Issue 8, March 2010
CCFE Fusion
42
SAFEPAQ-II
copied to the clipboard by selecting the File|Print or Edit|Copy
menu items respectively. Note that the systematics values (at
14.5 MeV and 30 keV) are also shown if available.
Figure 59. The EXFOR plot window.
An additional menu item, File|Save image, is available to
save the current master plot to disk as an image (placeable
Windows metafile format, *.wmf). This has the advantage that
the particular image of the set of selected EXFOR sorces can be
viewed later, even if the selected set has subsequently been
altered. The image can be viewed by clicking the View image
(View old) button on Figure 49, which displays the EXFOR
image window shown in Figure 61. Note that this button will
only be enabled if there is an available image for the reaction.
All images are saved in the folder graphs shown in the Graphs
folder text box on the Source database disk specified in the
Settings window (Figure 1). A further use of images to
construct a book is described later.
Experimental data that are too recent to be present on the
EXFOR CD-ROMs may be available from other sources. If
CCFE Fusion
User manual: Issue 8, March 2010
SAFEPAQ-II
43
these are to be plotted then it is necessary to save them as
Private EXFOR data. The menu item, EXFOR|Add Private
data… displays the Add Private data window shown in
Figure 62. Enter the target in the first text box, select a reaction
from the dropdown listbox and enter a lab code (use the
standard EXFOR codes with the last two digits of the date; the
codes can be obtained from the EXFOR lab codes window,
see Figure 64). Next select from one of the standard references
(see Figure 42), enter the paper title and the authors in the next
two text boxes, select the final state radio button and then select
the file where the cross section data points are held. The data
must be available in a standard x4s file (details of the format of
these files are given in Appendix 2). Clicking the Add button
will put the data into the EXFOR database in two tables,
Private Reaction and Private cross section. In cases where
private data are added incorrectly or become redundant it is
possible to remove them by selecting the EXFOR|Delete
Private data… menu item which displays the Delete Private
EXFOR data window shown in Figure 63. Select a reaction
and click the Delete button to remove it. Note that it is also
possible to remove standard entries from the EXFOR database
by selecting the Standard type radio button in Figure 63.
Figure 60. The EXFOR master plot window.
User manual: Issue 8, March 2010
CCFE Fusion
44
SAFEPAQ-II
The EXFOR lab codes can be viewed by clicking
EXFOR|EXFOR lab codes … menu item that displays
EXFOR lab codes window shown in Figure 64. Select
required country and the available lab codes and details
displayed in the grid.
the
the
the
are
When the EXFOR sources window (Figure 49) is opened, any
private sources available for the selected reaction are appended
to the end of the standard EXFOR sources. Note that if the data
are stored in the SAFEPAQ-II EXFOR database then the
symbol “&” is used rather than “#”. Private data are not shown
in the EXFOR index window (Figure 50). Clicking the Data...
button in Figure 49 when a private source is selected displays
the EXFOR data window shown in Figure 51. The private data
are displayed as normal (but note that the View file... button is
disabled). If the data are required to be stored in the
SAFEPAQ-II EXFOR database then check the Data used for
plotting option and click the Save button. The private data are
displayed in plots (Figure 59 and Figure 60) in the same way as
the standard EXFOR data.
Figure 61. The EXFOR image window.
CCFE Fusion
User manual: Issue 8, March 2010
SAFEPAQ-II
45
Figure 62. The Add Private data window.
Figure 63. The Delete Private EXFOR data window.
Returning to the main SAFEPAQ-II window, Figure 2.
Clicking the second item on the EXFOR menu, List EXFOR
entries… displays the List EXFOR entries window shown in
Figure 65. Select a reaction type from the dropdown list and
click the Get entries button to display all the reactions stored
for the given reaction type with the Final state (FS = g, m, n or
blank for a total) and the Lab code. The number of entries is
shown. By default the standard EXFOR entries are displayed,
but by clicking the Private option in the Type group, the
Private EXFOR entries can be listed.
User manual: Issue 8, March 2010
CCFE Fusion
46
SAFEPAQ-II
Figure 64. The EXFOR lab codes window.
Figure 65. The List EXFOR entries window.
Clicking the Copy button copies all the entries to the clipboard.
The list can be printed to the default printer by clicking the
Print button.
Clicking on the third item on the EXFOR menu, Assemble
book… or the ninth toolbar button, displays the Assemble
book window shown in Figure 66.
Figure 66. The Assemble book window.
CCFE Fusion
User manual: Issue 8, March 2010
SAFEPAQ-II
47
This window allows a series of images to be plotted in a Word
document (a book) and then printed out for further study.
Choose the range of graphs by selecting the intial and final
targets and the reaction type in the dropdown list boxes. Give a
name for the book (.doc is always present in the text box) and
then click on the Assemble button. This will produce the
Word file containing all the images for the specified targets and
reaction with two plots per page. As described above, the
EXFOR images are used. It is also possible to produce a book
of images that contain EXFOR data and points from one of the
standard data libraries. These images are described later (page
49), but if they are available then a book can be assembled
using them if the Include library data option is checked and
the required Source ID is selected in the dropdown list box.
Visualisation
The ability to visualise cross section data in the various source
libraries and in the SAFEPAQ-II databases is essential in the
evaluation and selection of data for inclusion in EAF.
Comprehensive tools are available in SAFEPAQ-II to
accomplish this. Clicking on the Visualisation|Targets and
sources… menu item or the sixth toolbar button displays the
Targets and sources window shown in Figure 67.
Figure 67. The Targets and sources window.
This window displays the reactions present in the Cache
database. Cache is one of the SAFEPAQ-II databases and
provides a store where data from any of the source libraries or
the SAFEPAQ-II databases (Master, Final or Test) can be
placed for comparison and plotting. Unlike the other databases
where data from only a single source for any reaction can be
present, Cache can contain multiple copies of data for the same
reaction from a variety of sources. The Target nuclides present
User manual: Issue 8, March 2010
CCFE Fusion
48
SAFEPAQ-II
in Cache are shown in the first list box, selecting a target
displays the reactions for that target in the second list box and
selecting a reaction shows the sources of the data in the third
list box. The number of data points in the data set is shown for
the reaction from the selected source. Selecting the Only
selected final state radio button means that in cases where
there are several isomeric states then only the selected final
state (in Figure 67 this would be the g state) will be plotted. If
this radio button is selected, then it is possible to plot data from
all or any of the Sources. This is done by clicking on the first
source with the mouse and then clicking on the last source with
the Shift key pressed, or by clicking on each required source
with the Control key pressed. Note that if several sources are
selected then the number of points of the first selected is
shown.
Note that when opening this window the target used for plotting
when the window was previously closed will be selected. This
feature introduced from EASY-2005 saves time when plotting
data.
Clicking the Plot button will display the Data visualisation
window shown in Figure 68. This shows data for the
Co-59(n,2n) reaction for all final states (the All final states
radio button was clicked in Figure 67). Because the total cross
section for the g and m states has been calculated (see page 58)
three curves are present in Figure 68. In addition to the curves,
experimental data for the reaction stored in the Parameter
database are plotted as red triangles. The key for the curves is at
the right of the plot. The Data visualisation window presents
many options for the user, and is probably the most complicated
in the whole application. It contains a menu bar, a toolbar and a
status bar. The latter is used to present information about a data
point on the graph selected by clicking with the mouse.
In Figure 68 one of the red data points has been clicked, the
status bar shows that it is Experimental data, with the number
of the data point, its energy, cross section and its final state (‘g’,
‘m’, ‘n’ or ‘T’ for total cross section) also shown.
A shortcut method of plotting the data is to double click the
required data source in the Targets and sources window
(Figure 67). Note that if a library with data > 20 MeV is being
used then the x-axis in Figure 68 extends up to 60 MeV,
otherwise the limit is 20 MeV.
Clicking the Edit|Copy menu item or the first toolbar button
copies the current plot to the clipboard. Clicking the File|Print
menu item or the second toolbar button prints the current plot.
CCFE Fusion
User manual: Issue 8, March 2010
SAFEPAQ-II
49
Figure 68. The Data visualisation window.
Clicking the File|Save image menu item or the third toolbar
button saves the current plot as an image, this can then be
written to a Word file as a book as described on page 46.
Clicking the Options|x/y axes menu item displays a submenu
that shows the four axes combinations (fourth - seventh toolbar
buttons) that can be used to plot the data. Clicking the
Options|x/y ranges menu item or the eighth toolbar button
displays the x/y ranges window shown in Figure 69. This
shows the current minimum and maximum values on the x and
y axes and allows new values to be entered. The previous
values are stored and can be recalled by clicking the Last
button. This saves time if the same changes are required on a
series of graphs. Clicking the Apply button makes the changes.
The window remains open until closed by clicking the Close
button.
If the plotted data are from Final then this is shown in the
legend as for example in Figure 68. However, when using the
figure in a publication it may be better to show that the data are
from the EAF library that Final represents. To show the EAF
library name in the legend check the Visualisation|EAF name
not Final in Legend menu item in the main window (Figure
2).
User manual: Issue 8, March 2010
CCFE Fusion
50
SAFEPAQ-II
Figure 69. The x/y ranges window.
Checking the Options|Legend menu item displays a submenu
that shows the two positions of the legend on the plot (Right or
Left). Changing this can be useful if the legend overlaps the
data points. Checking the Options|Show symbols for data
points menu item or the ninth toolbar button plots the data
points that make up each curve. Checking the Options|Show
interpolated values menu item or the tenth toolbar button
shows the position of interpolated data between the selected
data points (determined by the interpolation law between the
points). To use this it is necessary to first click this and then
click the data selection tool and then select the points by
dragging with the mouse.
Checking the Options|Data selection menu item or the
eleventh toolbar button changes the cursor to a cross hair and
enables points to be selected (click and drag the mouse to
display a rubber band around the selected points). Checking the
Overplot experimental menu item or the twelfth toolbar
button plots the experimental data points (note that clicking the
toolbar actually stops the plotting of the data points – the graph
is cleared). Checking the Options|Overplot EXFOR menu
item or the thirteenth toolbar button removes the experimental
data points and plots any available EXFOR data instead. Note
that if the Options|Include exp with EXFOR menu item is
checked then both the experimental data and EXFOR points
will be displayed.
Checking the Options|Overplot uncertainty band menu item
or the fourteenth toolbar button displays an uncertainty band
(using the uncertainty values shown in Figure 36 and Figure 39)
over the main curve. The error factors and the source of data are
shown in the status bar. Note that this option will only work if a
single final state and a single source are selected.
Clicking the Options|Overplot group data menu item
displays a submenu that shows the twelve options for
overplotting group data (No group data and the eleven group
structures). One of these group structures can be selected in the
Settings window (Default group data type) as the group
structure that is shown when the fifteenth toolbar button is
clicked.
CCFE Fusion
User manual: Issue 8, March 2010
SAFEPAQ-II
51
Checking the Options|Omit systematic error bars menu item
means that the error bars for the systematics (displayed when
the Options|Overplot EXFOR menu item is checked) are not
displayed. This is useful if graphs are required for publication
and the large error bars are confusing.
Checking the Options|Draw in black and white menu item
means that graphs will be displayed on screen with the lines
black but distinguished by various patterns. This is useful if
graphs are copied to the clipboard for use in other documents
that will not be printed in colour.
Checking the Options|Draw lines thick menu item means that
graphs will be displayed on screen with the lines thick, making
them more visible. This is useful if graphs are copied to the
clipboard for use in other applications.
Checking the Options|Print lines thick menu item means that
graphs will be printed with the lines thick, making them more
visible. Clicking the Options|Redraw menu item replots the
graph.
Checking the Options|2 dec. pl. on x-axis and Options|2
dec. pl. on y-axis menu items means that graphs will be
displayed with the values on the axes having 2 decimal places
rather than the default of 1. This is necessary if the range of the
values is chosen to be small.
Clicking the Options|Reaction data window for menu item
displays a submenu that shows the names of the various curves
that are plotted (either final states or data sources). Clicking one
of these will display the Reaction data window for the
selected reaction shown in Figure 70. The Reaction data
window for the first reaction can also be opened by clicking the
sixteenth toolbar button.
Checking the Options|Reaction data warning menu item
(checked by default) means that if data for a sum are to be
displayed in the Reaction data window then a warning dialog
with the message ‘Unknown reaction (possibly a sum?)’ is
displayed prior to the window appearing. If this warning is not
required then it can be removed by clearing the check on this
menu item.
If EXFOR data are shown then clicking on a data point will
give information about the selected point. If only the curves are
plotted (preferrably with the data point symbols shown), then
clicking on a point will give information about it (including the
interpolation law in the final pane) in the status bar.
If the plotted curve is from Final and is not a summed reaction
then clicking with the left button of the mouse on the status bar
brings up a ToolTip showing the source of data.
User manual: Issue 8, March 2010
CCFE Fusion
52
SAFEPAQ-II
If the plotted data have been produced by a Data merge
modification (Mod type 13, see Table 2 for details) then there
may be a discontinuity in the data that requires a further
modification (Mod type 4) to scale the high energy data so as to
end up with continuous data. To calculate this factor the
following procedure should be used. Show the symbols for the
data points and click on the last point prior to the discontinuity.
Note that if experimental data are plotted then it will be
necessary to click the twelfth toolbar button to clear the
experimental points. The information for the selected point is
shown in the status bar. Using the left mouse button double
click on the status bar to bring up a ToolTip showing the factor
by which it is necessary to scale the high energy data to achieve
continuity. This works by using extrapolation (using the correct
law) on the selected and the previous point to predicted the new
value at the point above the selected one.
One restriction on the above calculation of factors must be
noted. If the number of data point for a reaction is very large (>
32,767) then the data are thinned prior to plotting (only every
other point is plotted). For such reactions the data source in the
status bar is followed by ‘ – thinned’, and because it may not be
possible to click on the actual point before the discontinuity, the
ability to calculate factors is disabled for reactions with thinned
data.
The Reaction data window shows the source of data in the
title bar, and the reaction above the data grid. Note that if data
from Final, Master or Test are used then the original data
source is also shown in < > brackets. In addition, if there are p
pre-modifications and m modifications, then these are shown as
‘+p,m’ following the original data source. The number of data
points is shown to the right of the reaction. The point number,
energy and cross section are shown in the grid. The various
interpolation law ranges are shown in the lower list box, and if
points are selected in the grid then these are also indicated in
the upper text boxes. The selection of data points is linked to
the Visualisation data window; if points are selected there,
and the Reaction data window is open then the points in the
grid are also shown selected. The selected data can be copied to
the clipboard by clicking the Copy button. The entire grid can
be printed by clicking the Print button.
The reaction number used in the databases to identify the
reaction is sometimes required. This can be found (so long as
the reaction exists in Parameter) by clicking on the reaction
name at the top left of the window, a ToolTip showing the
reaction number is displayed when the cursor hovers over the
reaction name.
CCFE Fusion
User manual: Issue 8, March 2010
SAFEPAQ-II
53
The energy and cross section values in the grid are displayed to
six decimal places. The database holds these values to higher
precision, and especially if changing the value of a cross section
at an energy point, it is necessary to know the values more
precisely. This is possible by selecting a single row and holding
the cursor over the grid, a ToolTip is shown with the values to
twelve decimal places.
Figure 70. The Reaction data window.
Some data sets contain many points, and because of a limit on
the number of rows in the data grid and also to speed up
loading the data, it is necessary to split a large data set into
‘pages’. Each page contains a maximum of 10,000 data points,
and if paging is necessary then the < and > buttons are enabled.
User manual: Issue 8, March 2010
CCFE Fusion
54
SAFEPAQ-II
These display the next (>) and previous (<) page of data as
appropriate.
At the bottom of the Reaction data window are six tabs. By
default the fourth is shown when the window opens. This
shows the Q-value and threshold for the file and those from the
Wapstra mass table. The ratio gives a good indication as to
whether the Q-value is correct in the file. The Save tab is also
active for any data source, but if the source of the reaction data
is the Test database (but not for any other source), then the
other four tabs become active. The five tabs other than the
fourth one shown in Figure 70 are shown in Figure 71 - Figure
75.
Figure 71. The Scale tab of the Reaction data window.
Figure 72. The Renormalise tab of the Reaction data window.
Figure 73. The Resonance integral tab of the Reaction data window.
CCFE Fusion
User manual: Issue 8, March 2010
SAFEPAQ-II
55
Figure 74. The Save tab of the Reaction data window.
Figure 75. The Load tab of the Reaction data window.
The Scale tab (Figure 71) enables a scale factor to be chosen by
selecting a range radio button and dragging the slider. The
resultant factor is shown in the text box. Select the data points
that this modification should apply to and the View button
becomes enabled. Clicking this will plot the modified data. If
this is not correct then clicking the Revert button will plot the
original data. If the change is useful, then it can be saved as a
modification for the reaction by clicking the Save button.
The Renormalise tab (Figure 72) enables a new cross section at
a reference energy to be entered in the text boxes. Select the
data points that this modification should apply to and the View
button becomes enabled. Clicking this will plot the modified
data. If this is not correct then clicking the Revert button will
plot the original data. If the change is useful, then it can be
saved as a modification for the reaction by clicking the Save
button.
The Resonance integral tab (Figure 73) contains two buttons.
Clicking Select will select data points in the range 0.5 eV –
100 keV. Clicking Calculate will calculate the resonance
integral for the reaction and show the result in the first text box
(Note that this text box cannot be edited). Enter the new
resonance integral value in the second text box. Clicking the
View button will plot the modified data. If this is not correct
then clicking the Revert button will plot the original data. If the
change is useful, then it can be saved as a modification for the
reaction by clicking the Save button.
User manual: Issue 8, March 2010
CCFE Fusion
56
SAFEPAQ-II
It is possible to save the selected data points as a ‘scrap’ of
data. This is saved with the file name specified in the text box
on the Save tab (Figure 74) in the folder scraps shown in the
Scrap folder text box on the Source database disk specified
in the Settings window (Figure 1). The interpolation law
applying to the selected points is also saved. Note that it is not
possible to have a data scrap with more than one interpolation
law. This tab should be clicked and then the points required
selected. A file name will be suggested in the text box based on
the current reaction (in Figure 74 this was V-50n,p_ which can
then be customised as required. Clicking the Save button on
the tab writes the scrap to the file.
Data scraps can be merged with the current reaction data (if
these are from Test) using the Load tab (Figure 75). The scraps
can either have been generated using the Save tab or by using
the Scrap editor described below. The available scraps are
shown in the list box, select one of these and then click one of
the radio buttons in the Adjust to fit group. If None is selected
then the scrap data replace data in that range for the current
reaction. If At low E is selected then the scrap data are scaled
so that they have the same value as the current data at the low
energy point. If At high E is selected then the scrap data are
scaled so that they have the same value as the current data at the
high energy point. If At both E is selected then the scrap data
are scaled so that they have the same value as the current data at
both the low and high energy points. This is done by scaling by
a factor that varies linearly with energy between the given
factors at the low and high energies.
Data scraps were described above. Although it is useful to be
able to extract these from an existing file, it may be necessary
to create one from scratch for a particular reaction. This can be
done using the Scrap editor window shown in Figure 76. This
is displayed by clicking on Visualisation|Scrap editor… or
the seventh toolbar button in the main window (Figure 2).
CCFE Fusion
User manual: Issue 8, March 2010
SAFEPAQ-II
57
Figure 76. The Scrap editor window.
Existing data scraps can be viewed by selecting the file name in
the list box and clicking the File|Load menu item (a shortcut is
to double click the file name). This shows the energy and cross
section of the points in the data grid, the interpolation law in the
text box and the number of points. A small graph of the data
appears on the right of the data grid. Data in the grid can be
edited by selecting a number and typing. Note that typing will
overwrite the existing value, if you require to edit, then click on
the number and press the Space key.
A new data point can be added by selecting the data point
which you require to have the new point added after and
clicking the Add button. The number of points increases and
new values can be entered. To remove a data point, select the
point and click the Delete button. The new scrap can be saved,
either overwriting the existing file, or by entering a new name
in the text box. A new scrap can be constructed by clicking
File|New and entering data. The appearance of the graph can be
altered, checking the View|Lin/Lin axes menu item will plot
using both axes linear and checking the View|Log/Log axes
menu item will plot using both axes logarithmic. The data
points can be joined by checking the View|Show lines menu
item. The selected items in the data grid can be copied to the
clipboard by clicking the Edit|Copy menu item. The entire
scrap file can be printed by clicking the File|Print menu item.
Closing the window (either by clicking the File|Close or the
the Close menu items) without saving the changed data
displays a confirmation dialog that gives the chance to save the
file.
An example of the use of data scraps is the calculation of the
capture and fission cross sections in the energy range 1 10-5 eV
to the end of the resolved resonance region (EH). This can be
done using the Single Resonance Approximation (SRA) which
User manual: Issue 8, March 2010
CCFE Fusion
58
SAFEPAQ-II
is described in Appendix 5. To generate the data scrap for a
capture reaction click on the Visualisation|Create (n,g) scrap
using SRA… menu item which displays the Create (n,g)
scrap using SRA window shown in Figure 77. Enter the target
in the first text box, then click on one of the other text boxes.
As much information as possible is then filled in the boxes
automatically from the Parameter database, typically it will only
be necessary to enter a Resonance energy if an experimental
thermal cross section and Resonance integral exist. Choose the
final state and then click the Calculate button. This writes the
data scrap with the given file name and calculates the SRA
Resonance integral. If the Upper energy (EH) value is less than
the normal upper limit for a RI calculation (100 keV) then a red
warning symbol is shown to the right of the ratio. A ToolTip
explains this symbol further.
Various values of the resonance energy can be tried in order to
achieve a calculated RI close to the experimental value. The
data scrape can also be viewed and edited from within the
Scrap editor window (Figure 76) as described above.
To generate a data scrap for a fission reaction click on the
Visualisation|Create (n,f) scrap using SRA… menu item
which displays the Create (n,f) scrap using SRA window
similar to that shown in Figure 77. The only difference is that it
is not necessary to select a final state.
Figure 77. The Create (n,g) scrap using SRA window.
In the Targets and sources window (Figure 67) it is possible
to visualise branching ratio data. This is done by clicking on the
Plot BR button. Note that the caption on this button and
whether it is enabled vary depending on the reaction selected.
In most of the libraries used by SAFEPAQ-II, reactions that
have more than one final state only have reactions to the
CCFE Fusion
User manual: Issue 8, March 2010
SAFEPAQ-II
59
separate final states but not the sum present. Cache is able to
also contain the sum, but before a branching ratio can be
plotted, it is necessary that the sum be calculated. If a reaction
is selected with a final state of 0, 1 or 2 and the sum has not
already been calculated then the button shows the caption Calc
tot. Clicking this will form the sum of the data to the final
states and store the total in Cache. Note that if all the final
states have data ‘on the same energy grid’, then the calculation
is fairly fast even with a large number of points. However, if
the energy grid differs then interpolation is required to form the
sum, and this can take some time.
Following the calculation an additional reaction will appear in
the Reaction list box and the button caption will become Plot
BR and the button will be enabled. Clicking on this button will
display the Branching ratio visualisation window shown in
Figure 78. This is similar to the Data visualisation window
(Figure 68) but with a reduced set of options. There is no
toolbar, but the status bar is used to display information on the
points. In Figure 78 the lower of the orange symbols has been
clicked, information on it is shown in the status bar.
Clicking the File|Print menu item prints the plot to the current
printer. Clicking the Edit|Copy menu item copies the plot to
the clipboard. Clicking the Options|x/y axes menu item
displays a submenu that shows the four axes combinations that
can be used to plot the data. Checking the Options|Show
symbols for data points menu item plots the data points that
make up each curve. Checking the Overplot experimental
menu item plots the experimental data points. If this is not
checked then information on the curve data points can be
shown in the status bar.
Note that if there are a large number of data points, then
plotting the graph can take a significant time.
User manual: Issue 8, March 2010
CCFE Fusion
60
SAFEPAQ-II
Figure 78. The Branching ratio visualisation window.
In the descriptions above the Cache database has been
mentioned several times. The contents of the Cache can be
viewed by clicking the File|Cache contents… menu item or
the second toolbar button in the main window. This displays the
Cache contents window shown in Figure 79. The data grid
shows the reactions that are present, clicking to the left of the
first column will select a reaction and display it in an easy to
read format above the grid. The Source of the reaction is shown
in the first column. The standard ZA and isomeric state values
for the target and daughter are shown in the second to fifth
columns. The ENDF MT reaction code is shown in column six,
and the number of interpolation ranges (NR) and number of
data points (NP) are shown in the final two columns.
CCFE Fusion
User manual: Issue 8, March 2010
SAFEPAQ-II
61
Figure 79. The Cache contents window.
Clicking the Edit|Find... menu item displays the Find window
shown in Figure 80. Enter the required target nuclide and click
the Find First button (or use the Enter key) to display this
reaction in the Cache grid. Futher reactions with this target can
be found by clicking the Find Next button (or use the Enter
key). The window can be closed by clicking the Close button.
Figure 80. The Find window.
Clicking the View|Reaction data... menu item displays the
Reaction data window (Figure 70) for the selected nuclide.
Clicking the >> and << menu items moves to the end and
beginning of the Cache data respectively. A reaction can be
removed from the Cache by clicking the Edit|Delete reaction
menu item, the Cache can be competely emptied by clicking the
Edit|Delete All menu item. Prior to the data being removed, the
confirmation dialog shown in Figure 81 is displayed.
User manual: Issue 8, March 2010
CCFE Fusion
62
SAFEPAQ-II
Figure 81. The confirmation dialog prior to emptying the Cache.
All the reactions for the selected target and source can be
removed from the Cache by clicking the Edit|Delete all
reactions for target and source menu item, no confirmation
is necessary prior to removal. If summed reactions with
MT>200 have been produced (see later), then these can be
removed from the Cache by clicking the Edit|Delete all
MT>200 sums for target and source menu item, no
confirmation is necessary prior to removal.
It is possible to combine data in the Cache in several ways.
Firstly, if a reaction has more than one final state, then the sum
(I daughter = 99) can be formed by clicking the Edit|Add sum
of isomeric cross sections menu item. Secondly, if more than
one reaction from the same source form the same daughter, then
these can be added by clicking the Edit|Add sum of cross
sections for same daughter menu item. The exact meaning
of this sum is actually more general then the cross section to the
same daughter since particle production cross sections are also
formed. The selected reaction must be (n,n′p), (n,d), (n,p), (n,t),
(n,n′t), (n,h), (n,n′h), (n,α) or (n,n′α), and one of the sums
(n,d+n′p), (n,t+n′d), (n,p+n′p), (n,t+n′t), (n,h+n′h) or (n,α+n′α)
is formed. Note that because of the first two sums it is not
possible to produce (n,d+n′d), this must be done by using the
next menu item. Also note that these particle production sums
contain only the first two terms of the more general sums, such
as (n,xp), defined in Table 1.
At energies above 20 MeV many other summed reactions are
important. In order to produce these all the reactions for a
particular reaction and source should be copied to the Cache.
See the option on the Data selection window (Figure 82) to
copy all reactions to the Cache. Because many reactions are
split and summed reactions are totals it is necessary to add all
the split reactions together. Clicking the Add isomers for all
reactions for target menu item does this for the selected
target. Clicking the Edit|Add cross sections to create all
MT>200 sums menu item will produce as many summed cross
sections as possible. The various possibilities and the definition
of the summed reactions are shown in Table 1.
CCFE Fusion
User manual: Issue 8, March 2010
SAFEPAQ-II
63
Table 1. Details of the summed reactions with MT>200.
MT
201
202
203
204
205
206
207
208
209
210
211
212
213
214
215
216
217
218
219
220
221
222
223
224
225
Reaction
(n,n′p+d)
(n,xn)
(n,xp)
(n,xd)
(n,xt)
(n,xh)
(n,xα)
(n,t+)
(n,n′t+)
(n,2nt+)
(n,3nt+)
(n,4nt+)
(n,5nt+)
(n,h+)
(n,α+)
(n,n′α+)
(n,2nα+)
(n,3nα+)
(n,pα+)
(n,dα+)
(n,tα+)
(n,n′tα+)
(n,n′2α+)
(n,t2α+)
(n,ph+)
Summed reactions
(n,n′p), (n,d)
(n,2n), (n,3n), (n,4n), (n,5n), (n,6n), (n,7n), (n,8n)
(n,p), (n,n′p), (n,2np), (n,3np), (n,pα)
(n,d), (n,n′d), (n,2nd), (n,3nd), (n,dα)
(n,t), (n,n′t), (n,2nt), (n,3nt), (n,tα)
(n,h), (n,n′h), (n,2nh), (n,3nh), (n,ph)
(n,α), (n,n′α), (n,2nα), (n,3nα), (n,pα)
(n,t), (n,n′d), (n,2np)
(n,n′t), (n,2nd), (n,3np)
(n,2nt), (n,3nd), (n,4np)
(n,3nt), (n,4nd), (n,5np)
(n,4nt), (n,5nd), (n,6np)
(n,5nt), (n,6nd), (n,7np)
(n,h), (n,pd), (n,n′2p)
(n,α), (n,n′h), (n,pt), (n,n′pd), (n,2n2p)
(n,n′α), (n,2nh), (n,dt), (n,n′pt), (n,3n2p)
(n,2nα), (n,3nh), (n,n′dt), (n,4n2p)
(n,3nα), (n,4nh), (n,5n2p)
(n,pα), (n,dh), (n,n′ph)
(n,dα), (n,n′pα), (n,n′dh)
(n,tα), (n,n′dα), (n,n′th), (n,2npα)
(n,n′tα), (n,3npα)
(n,n′2α), (n,3n2pα)
(n,t2α), (n,n′d2α)
(n,ph), (n,n′3p)
If data in the Cache from one of the source libraries are required
in the EAF library, but the reaction is currently not in Master,
then it is possible to add the reaction (which will both add the
Reaction details in Parameter and copy the data to Master) by
clicking the File|Add to Master menu item. If the reaction is
already in Master, but the source of data needs to be changed
then this can be done by clicking the File|Replace in Master
menu item. A similar replacement can be made in the Final
database by clicking the File|Replace in Final menu item.
Prior to changes being made, confirmation dialogs similar to
Figure 81 are displayed. If the selected reaction is from Master,
then the File|Copy to Test menu item is enabled. If the
reaction has preliminary modifications and/or modifications
then it is possible to carry out the modifications from the two
viewing windows (Figure 111 and Figure 120) and put the data
for the reaction into Test. If no modifications exist, then
clicking this menu item will put a copy of the Master data into
Test. Clicking the File|Create Test for all target’s Final
User manual: Issue 8, March 2010
CCFE Fusion
64
SAFEPAQ-II
reactions menu item creates data in Test for all reactions in
Final for the selected target.
If the data in the Cache are changed while the Cache contents
window is open, then the reactions listed can be refreshed by
clicking the View|Refresh data menu item.
Data can be placed in the Cache from other databases so that
they can be visualised by clicking the File|Data selection…
menu item or the first toolbar button. This displays the Data
selection window shown in Figure 82. The available source
databases are shown in the dropdown list, selecting one of these
will show the targets present in the first list box, and selecting a
target shows the reactions present in the second list box.
Alternatively, one of the three SAFEPAQ-II databases can be
selected from the list box. Whichever database is selected its
path is shown at the top of the window. The data for the
selected reaction are shown in the data grid. Note that if there
are more than one final state then all the reactions are shown.
The data grid shows the Multiplicity of the data, the Q-value
(QI), the number of interpolation regions (NR) and number of
data points (NP). Clicking the Copy to Cache button will add
the data in the grid to Cache. Note that when Final data are
transferred to the Cache a check is made to determine if the
data are already in the Cache, if they are then these data are
removed prior to copying.
If the selected database is Master, then an additional checkbox:
Copy data as Test to Cache is available. Ticking this copies
the data from Master to Cache and an additional copy is also
copied to Cache as Test.
If the Copy all reactions for target check box is ticked, then
clicking the Copy to Cache button copies all reactions for the
selected target to the Cache. This is extremely useful if summed
reactions with MT>200 are required. A time saving feature
introduced from EASY-2005 means that when the Data
selection window is opened the database and target that were
selected when the window was last closed are again selected.
CCFE Fusion
User manual: Issue 8, March 2010
SAFEPAQ-II
65
Figure 82. The Data selection window.
The lists of targets and reactions shown in the Targets and
sources window (Figure 67) are shown by default and refer to
‘normal’ plots. If the Visualisation|Extended plots menu item
in the main window (Figure 2) is checked then only those
targets which have the full range of summed reactions with
MT> 200 present are shown. Similarly the number of reactions
is different and refer to the summed reactions such as (n,xp),
(n,α+) and one termed ‘Multiple’. The latter refers to the
reactions (n,γ), (n,p), (n,d), (n,t), (n,h), (n,α), (n,2n), (n,3n) and
(n,n′α). When the Plot button in Figure 67 is clicked then a
series of cross section curves are plotted. Experimental data
symbols are shown for each reaction type and if EXFOR data
are overplotted then separate colours refer to data for the
various reaction types.
If the Visualisation|Extended plots, use (n,n′p) not (n,g)
menu item in the main window (Figure 2) is checked then in the
multiple plot case data for the reaction (n,n′p) rather than (n,γ)
are displayed. These extended plots are very useful for
comparing several reaction types and investigating relationships
between them. An example of such a plot, for (x,nx) reactions
on 184W is shown in Figure 83.
If the Visualisation|Extended plots, multiple targets menu
item in the main window (Figure 2) is checked then when a
reaction is selected in the the Targets and sources window
(Figure 67) then all targets (to a maximum of nine) starting
with the one selected for that element are plotted. It is the user’s
User manual: Issue 8, March 2010
CCFE Fusion
66
SAFEPAQ-II
responsibility to ensure that the reactions for the various targets
exist in the Cache and that in the case of split reactions they
have been summed. An example of such a plot, for (x,p)
reactions on Sn is shown in Figure 84.
Figure 83. Plot of 184W(n,xn) cross sections produced using the
Extended plot option.
Figure 84. Plot of Sn(n,p) cross sections produced using the
Extended plot, multiple targets option.
CCFE Fusion
User manual: Issue 8, March 2010
SAFEPAQ-II
67
Integral data
Measurements can be made in a neutron spectrum, rather than
at a particular neutron energy, to give an average cross section.
In order to use such integral measurements to improve the data
library it is necessary to be able to average the library data in
well defined neutron spectra. Clicking the Integral
data|Neutron spectra… menu item displays the Neutron
spectra window shown in Figure 85.
Note that at the present time there are no integral data stored for
deuteron- or proton-induced reactions. Consequently, there is
no option to view spectra for these particles.
The available neutron spectra, which are stored in the
Parameter database are displayed, followed by the type, a
description and reference. A spectrum can be removed by
clicking the Delete button. Note that if integral data are already
stored for a neutron spectrum then it is not possible to delete
the spectrum (the Delete button is grayed out). A further
spectrum can be added by clicking the Add… button which
displays the Add spectrum window shown in Figure 86. A
name and description are entered in the text boxes, and a type
(number of groups and weighting) is chosen from the dropdown
list. The file containing the spectrum is selected using the
browse button (…) and the reference is selected from the
dropdown list. Note that the file should be in standard ‘ASCII’
format (‘%’ character at the start of comment lines) with the
asc extension. Clicking the Add button will add the spectrum
to the database.
Figure 85. The Neutron spectra window.
User manual: Issue 8, March 2010
CCFE Fusion
68
SAFEPAQ-II
A neutron spectrum can be plotted by selecting it in Figure 85
and then clicking the Plot… button. This displays the Plot
spectrum window shown in Figure 87. This gives three
options for plotting, showing the neutrons per energy group, per
energy interval or per lethargy interval. The spectrum can be
scaled by a factor entered in the text box, this is useful if it is
required to compare two spectra with very different
normalisations. Select one of the radio buttons and then click
the Plot… button to display the Neutron spectrum window
shown in Figure 88.
Figure 86. The Add spectrum window.
The menu bar in Figure 88 allows the plot to be printed to the
default printer by clicking the File|Print menu item, and copied
to the clipboard by clicking the Edit|Copy menu item. It is
possible to compare two spectra by plotting them on the same
graph. To do this a spectrum must be stored by clicking the
Store|Store spectrum menu item (the name will then be
shown in Figure 87 when this is subsequently opened again).
The Neutron spectrum window is then closed and another
spectrum chosen in Figure 85. Having plotting this, clicking the
Store|Plot store menu item then displays both spectra.
Figure 87. The Plot spectrum window.
CCFE Fusion
User manual: Issue 8, March 2010
SAFEPAQ-II
69
Figure 88. The Neutron spectrum window.
The y-axis can be plotted either linearly or logarithmically by
clicking Options|y axis which displays a submenu with Log
and Lin items. The axis ranges can be changed by clicking the
Options|Axis scale… menu item which displays the Axis
scale window shown in Figure 89. Change the values in the
text boxes and then click the Apply button to change the
ranges. Clicking the Options|Thick lines menu item shows the
lines as thick lines, which makes them more visible if the graph
is copied and then pasted into another application.
Figure 89. The Axis scale window.
Once the multi-group cross sections have been calculated, the
Average XS button in Figure 85 becomes enabled. Clicking
this once a spectrum is selected will calculate and store the
average cross section for each reaction (this is the same as the
‘collapsed’ cross section calculated in FISPACT). For an
extended enegy library this takes about 20 minutes. These can
then be compared with experimental integral data.
User manual: Issue 8, March 2010
CCFE Fusion
70
SAFEPAQ-II
The values of the average cross sections for particular spectra
can be seen by clicking on the Integral data|Average cross
sections… menu item in the main window, which displays the
Average cross sections window shown in Figure 90. Select a
target, reaction and neutron spectrum in the three list boxes,
click on the required radio button in the Final state group and
then click the Get average to show the average cross section
value in the text box.
Figure 90. The Average cross sections window.
The experimental integral data can be viewed by clicking on the
Integral data|View Integral data… menu item or the
sixteenth toolbar button, which displays the Integral data
window shown in Figure 91. Selecting a target shows which
reactions have data, and selecting a reaction displays the
available data in the grid. In addition to the spectrum name,
cross section and uncertainty shown in the first three columns,
the final column shows a flag. This indicates whether the data
are to be used (so allowing several data in the same spectrum).
The source of the data is indicated by a reference, where this is
known.
Figure 91. The Integral data window.
CCFE Fusion
User manual: Issue 8, March 2010
SAFEPAQ-II
71
Clicking the Modify button will display the selected data in
editing boxes below the reference. Changes to the data values
or the flag can then be made and saved to the database by
clicking the Save button. A data point can be removed by
clicking the Delete button. A new data point can be added by
clicking the Add button. This displays the dialog shown in
Figure 31. Clicking the No button displays the Add Integral
data window shown in Figure 92. Enter target and reaction
details in the first text box, the dropdown list and with the Final
state radio buttons. Enter the integral data in the text boxes and
tick the Use check box. The default cross section unit is b, but
by clicking the # button it is possible to toggle between b and
mb for data entry. Note that the # button should be clicked prior
to data entry. Select a reference from the dropdown list.
Clicking the Add button will save the data in the Parameter
database.
Note that the Save button actually becomes the Close, C/E
button which acts as a shortcut to displaying the Integral C/E
window when a change to the data is not in progress. Clicking
this will close the Integral data window (as does the Close
button) and open the Integral C/E window (Figure 94).
Figure 92. The Add Integral data window.
The reactions that can be selected in the Add Integral data
window (Figure 92) include the various summed reactions with
MT identifiers > 200 (see Table 1). In some cases experiments
have been carried out on elements rather than isotopes. In order
to improve the estimation of the isotopic effective cross section
from the elemental value under the assumption that the
elemental value applies to the most abundant isotope, a
calculation can be carried out using the current cross section
values.
User manual: Issue 8, March 2010
CCFE Fusion
SAFEPAQ-II
72
Clicking the Integral data|Elemental analysis… menu item
displays the Elemental analysis window shown in Figure 93.
The element, spectrum and reaction are selected from the
dropdown lists and the elemental cross section and uncertainty
are entered in the text boxes. The required isotope (generally
the most abundant) is selected by clicking one of the radio
buttons to the left of the table and the Get data button is
clicked. The particle production cross sections for the various
isotopes are calculated and entered in the third column of the
table. When all the cross sections have been calculated then the
sum is formed and the ki values defined in equation (2) are
calculated and displayed in the fourth column. In equation (2)
the cross sections (σic) are the library values, while fi are the
abundances. Finally the isotopic cross section value is displayed
in the text box.
ki = σ ic
∑f σ
j
c
j
(2)
j
By default the natural abundances are displayed in the second
column. By clicking on the Enriched radio button it is possible
to edit the abundance values to the required values. As can be
seen from Figure 93, the isotopic value is generally similar to
the elemental value, but this depends on the actual cross
sections for the selected element.
Figure 93. The Elemental analysis window.
CCFE Fusion
User manual: Issue 8, March 2010
SAFEPAQ-II
73
Selecting a data set in Figure 91 stores details of the reaction
and writes the reaction name in the main window status bar.
Closing Figure 91 retains details of the selected reaction and
enables the Integral data|Integral C/E… menu item. Clicking
this displays the Integral C/E window shown in Figure 94 (the
reaction is shown in the title bar). This initially shows the same
integral data as in Figure 91 (but only where the Use flag is
‘Yes’) and if the multi-group cross sections have been
calculated then the average cross section for the reaction using
data in Final are presented with the C/E value. If the multigroup data have not yet been calculated then ‘????’ is shown.
Note that if a particle production cross section is selected then
the calculation of the C/E values takes some time, and the user
is warned by a message in the Staus bar to have patience. If the
data are in Final then the Plot… button is enabled – its use is
described below. If the reaction is in Test then the Test button
is enabled. Selecting one of the spectra enables the Reaction
rate… button. Clicking the Copy button places the entire
contents of the data grid on the clipboard.
Clicking the Test button will expand the window, change the
heading of the third column from ‘Final’ to ‘Test’, change the
values displayed in the grid and display another grid. This
enlarged window is shown in Figure 95, showing the multigroup data calculated using Test and several new buttons and
controls.
Figure 94. The Integral C/E window.
User manual: Issue 8, March 2010
CCFE Fusion
74
SAFEPAQ-II
Figure 95. The C/E Integral data window (enlarged).
Clicking on a spectrum displays the group cross sections in the
lower grid, the number of energy points and the weighting are
shown above the lower grid. Initially the Factor for each group
value is 1.0. If it is required to alter the group data to get a
better C/E value, then select the required groups and alter the
factor in the text box. Clicking the Apply button will display
the new factor in the lower grid, recalculate the C/E value and
display it in the upper grid and enable the Save as mods
button. Note that all spectra with the same number of groups
(irrespective of the weighting) have their C/E values updated.
Clicking the Save as mods button will find a set of
modifications (Mod type 4) for the correct energy ranges and
store them in Parameter. It will also remove from the Test
database the current reaction. This forces the reaction to be
remade using the modifications before it can be used again.
Clicking the Copy GXS button copies the selected data in the
lower grid to the clipboard. Clicking the Print GXS button
prints the entire contents of the lower grid to the default printer.
Clicking the Copy C/E button copies the entire contents of the
upper grid to the clipboard.
In both Figure 94 and Figure 95 there is a Reaction rate…
button. If the one in Figure 94 is clicked then the reaction rate
data for the reaction in Final are plotted. If the one in Figure 95
is clicked then the data in Test are plotted. The graphs are
CCFE Fusion
User manual: Issue 8, March 2010
SAFEPAQ-II
75
displayed in the Reaction rate window shown in Figure 96.
What is plotted is shown in equation (3), where the reaction
rate in the ith group is shown in terms of the group cross
sections (σi) and group fluxes (φi). It gives a visual indication of
the energies at which the cross section in a particular spectrum
contribute significantly to the production of the daughter
nuclide. This can be used to indicate where changes in the cross
section should be made so as to improve the C/E value.
R i = σ iφ i
∑φ
(3)
j
j
Figure 96. The Reaction rate window.
The menu bar in Figure 96 allows the plot to be printed to the
default printer by clicking the File|Print menu item, and copied
to the clipboard by clicking the Edit|Copy menu item. The yaxis can be plotted either linearly or logarithmically by clicking
Options|y axis which displays a submenu with Log and Lin
items. The axes ranges can be changed by clicking the
Options|Axis scale… menu item which displays the Axis
scale window shown in Figure 89. Change the values in the
text boxes and then click the Apply button to alter the ranges.
Returning to Figure 95, clicking the Plot… button displays the
Integral C/E graph window shown in Figure 97. This shows
the C/E values for the various neutron spectra with error bars
representing the experimental uncertainty. If uncertainty data
exist in the Final database then the uncertainty value for the
User manual: Issue 8, March 2010
CCFE Fusion
76
SAFEPAQ-II
reaction is used to display an error band around the C/E = 1
value. If the Options|Show values menu item is checked then
the C/E values are displayed next to each point and on the error
band. The graph can be printed to the default printer by clicking
the File|Print menu item, and copied to the clipboard by
clicking the Edit|Copy menu item.
Figure 97. The Integral C/E graph window.
Since EAF-2007 it is possible to display the C/E values in
another way. Selecting the Integral data|Extended C/E plot
menu item in the main window checks it and means that when
the Plot… button in Figure 94 is clicked then the Integral C/E
graph (Extended) window shown in Figure 98 is displayed. In
this case the reaction rate for each spectrum is calculated and
the point is placed at the energy corresponding to the maximum
reaction rate. The energy interval such that 90% of the reaction
rate is contained is calculated and used to plot an energy ‘error
bar’. Such a plot shows clearly the energies at which the
integral data can be used to validate the EAF data.
CCFE Fusion
User manual: Issue 8, March 2010
SAFEPAQ-II
77
Figure 98. The Integral C/E graph (Extended) window.
The File|Print, Edit|Copy and Options|Axis scale… menu
items are the same as in the Integral C/E graph window
(Figure 97).
If the Options|x axis ticks menu item is clicked then a submenu opens with the menu items 1 – 6 shown. Checking one of
these displays the graph with the corresponding number of x
axis tick marks. In Figure 98 six tick marks are shown. If the
Options|y axis ticks menu item is clicked then a submenu
opens with the menu items 1 – 5 shown. Checking one of these
displays the graph with the corresponding number of y axis tick
marks. In Figure 98 three tick marks are shown.
If the Options|Show values menu item is clicked then a
submenu opens with the menu items None, All, Band and
Points shown. Checking All displays the mean energy and C/E
values next to each point and the library uncertainty next to the
error band. Band only displays the library uncertainty next to
the error band, Points only displays the mean energy and C/E
values next to each point. None removes all values.
If the Options|Legend menu item is clicked then a submenu
opens with the menu items None, Right, and Bottom shown.
Checking Right displays the spectrum name for each point in a
legend at the right of the graph. Checking Bottom displays the
User manual: Issue 8, March 2010
CCFE Fusion
SAFEPAQ-II
78
spectrum name for each point in a legend at the bottom of the
graph. None removes the legend.
The above discussion refers to comparing the data in Final (or
Test) with the experimental integral data. It is also possible to
do the same comparison using data from one of the data
sources. The choice of source library is made by clicking on the
Integral data|Select Source library… menu item which
displays the Select Source library window shown in Figure
99. Select the required source and then click the Select button.
Figure 99. The Select Source library window.
The Integral data|Integral C/E for <Source>… menu item in
the main window is enabled, for example if the TALYS-6a
source is selected then it reads Integral C/E for TALYS-6a….
Clicking this displays the Integral C/E for TALYS-6a window
which is identical to Figure 94 (except that the name of the data
source is shown in the title bar). The data for the selected
reaction in the source are collapsed with the required neutron
spectra. Only data for the selected reaction are processed in this
way, the progress of the generation of the multi-group data for
the various group structures can be seen in the main window
status bar. The plotting of graphs for the selected source
follows exactly the description given above for data from Final.
Reaction data
The next objective of SAFEPAQ-II is the processing of reaction
data to produce EAF data files. Based on the ideas used in
SYMPAL this consists of a number of well defined steps.
CCFE Fusion
•
Construct a list of reactions that are required in the library.
•
Decide on the source of data for each reaction.
•
Compile data from these sources into the Master database.
•
Based on the experimental data and systematics held in the
Parameter database, construct a set of modifications, which
when applied to the data in Master produce the data in the
Final database.
User manual: Issue 8, March 2010
SAFEPAQ-II
79
•
Use Final to produce a summary of each reaction (thermal,
30 keV, 14.5 MeV and 20 MeV cross sections and the
resonance integral).
•
Produce the multi-group data (stored in Final).
•
Produce the uncertainty data (stored in Final).
•
Carry out internal validation against the data held in
Parameter (Validation plots).
•
Write out the point wise, group wise and uncertainty files in
EAF format.
•
Produce the various items of documentation (REPORT file
and reaction list).
Each of these steps is accomplished by using items on the
Reaction data menu, they are all described below.
Clicking the Reaction data|Reaction list menu item or the
twenty-second toolbar button displays the Reaction list
window shown in Figure 100. Enter an element symbol in the
first text box and click the Get data button to show the
nuclides for the entered element in the Targets list box. Select
a target and all the reactions along with the existing source of
data are shown in the large list box. If the Select previous
reaction option is checked and a reaction is selected, then
when another Target is selected the reaction type (now shown
in the Select previous reaction text) is automatically selected.
A ToolTip shows the reaction number and the multiplicity of
the selected reaction. The source of data for a particular
reaction can be changed by clicking the Modify… button. This
displays the Modify reaction window shown in Figure 101.
Figure 100. The Reaction list window.
User manual: Issue 8, March 2010
CCFE Fusion
80
SAFEPAQ-II
Figure 101. The Modify reaction window.
The current source of the selected reaction is displayed, and the
available data sources are shown in the list box. The current
multiplicity of the reaction (number of final states) is shown in
the Multiplicity text box and the current reaction final state is
indicated by the radio buttons. A new source and/or
multiplicity, final state can be selected from the list box,
entered in the text box and by clicked the correct radio button.
Clicking the Modify button will save the data in the Parameter
database. Note that if the multiplicity of a reaction is modified
using this window after the Master and Final databases have
been generated then it is necessary to also modify it in them.
Depending on the stage of processing that has been reached,
then the Modify Multiplicity in Master and/or Modify
Multiplicity in Final options should be checked prior to clicking
the Modify button.
Clicking the Add... button in Figure 100 displays the Add
reaction window shown in Figure 102.
The target of the new reaction is entered in the first text box (by
default the target in the Reaction list window (Figure 100) is
entered), the reaction is selected from the dropdown list, the
data source is selected from the list box and the multiplicity and
final state are entered in the text box and selected with the radio
buttons. Clicking the Add button will save the data in the
Parameter database. Note that if the reaction list is being added
to after the Master and Final databases have been generated
then it is necessary to add data for the new reaction to them.
Depending on the stage of processing that has been reached, the
two Add data to <Name> databases check boxes should be
ticked or cleared.
CCFE Fusion
User manual: Issue 8, March 2010
SAFEPAQ-II
81
Figure 102. The Add reaction window.
If the reaction does not exist in the selected data source then the
most sensible alternative will be used, if possible, by default.
Thus if the reaction is (n,d) and only (n,n′p+d) data exists in the
source then data for this reaction will be used. If the Ask check
box is checked then a dialog will confirm this.
Clicking the Delete button in Figure 100 removes the reaction
from the ReacSummary table in the Parameter database.
The tasks of adding and deleting reactions and changing the
data source for an existing reaction are common during library
preparation. There are several ways of achieving these tasks in
SAFEPAQ-II and the following recommendations are made for
carrying them out efficiently. Prior to the generation of Master
and Final is the best time to add or delete reactions and the
Reaction list window (Figure 100) is the best place to do this.
The data source can also be changed using the Modify reaction
window (Figure 101) at this stage, but if Master and Final have
already been produced then the Single reaction window
(Figure 124) is to be preferred. Note that if the Modify reaction
window (Figure 101) is used to change the source and Master
already exists then this will cause problems as the Reaction list
window (Figure 100) will show this change (reflecting the
change in Parameter), but Master will still contain the original
source.
It is possible to change all instances of a data source to another
for all targets in a specified ZAI range (ZAI = 10000 x Z+10 x
A+I). Clicking on the Reaction data|Global source
replace… menu item displays the Global source replace
User manual: Issue 8, March 2010
CCFE Fusion
82
SAFEPAQ-II
window shown in Figure 103. Enter the original and new data
source identifiers and the ZAI limits in the text boxes and click
the Replace button to make the change.
Figure 103. The Global source replace window.
When moving from an EAF library with an upper energy limit
of 20 MeV to one with 60 MeV, a considerable number of
reactions need to be added. In the construction of EAF-2005 the
TALYS data source was used extensively. Reactions present in
TALYS but not in the previous EAF library (EAF-2003)
needed to be added. This can be done by clicking on the
Reaction data|Add new reactions… menu item that displays
the Add new reactions window shown in Figure 104. A
choice of which reactions to include is made by entering a value
in the text box. If the reaction in TALYS has a maximum cross
section at some energy greater than this value then the reaction
is added to the ReacSummary table in Parameter. Clicking the
Add button adds all the relevant reactions.
Figure 104. The Add new reactions window (All option).
This is the default behaviour, with the All Targets option
selected. If the One Targets option is selected then the
window will be displayed as shown in Figure 105. This enables
reactions for only the specified target with large enough cross
section to be added from TALYS.
Figure 105. The Add new reactions window (One option).
CCFE Fusion
User manual: Issue 8, March 2010
SAFEPAQ-II
83
In the Add new reactions window (Figure 104) and several
other windows the word TALYS appears. There are several
data sources of this type and the one that is required to be used
is entered in the Version of TALYS text box in the Settings
window (Figure 1).
During the development of deuteron and proton libraries it is
common to start with a reaction list for neutron-induced
reactions. When the incoming particle in the list is changed
form n to say d, then many of the reactions in the list will be
elastic reactions such as (d,d) where the daughter is not an
isomeric state. These reactions can be removed from the list by
clicking the Reaction data|Delete elastic reactions menu
item.
Reading the Log and checking on errors often requires that the
reaction number in the Final database be identified. This is
possible by clicking on the Reaction data|Reaction numbers
menu item that displays the Reaction numbers window
shown in Figure 106. Enter the reaction number in the text box,
click the Get details button and the reaction and source are
shown.
Figure 106. The Reaction numbers window.
Clicking the Reaction data|Reaction search menu item or
the twenty-third toolbar button displays the Reaction search
window shown in Figure 107. Using this window searches can
be made for particular reaction types or data sources. If
searching by reaction type then select the Reaction radio
button and select a reaction type from the dropdown list and
choose the initial and final states with the radio buttons.
Clicking the Get reactions button shows all reactions that fit
the criteria, the data source and the total number of reactions.
This list can be printed out by clicking the Print button and
placed on the clipboard by clicking the Copy button.
If the Score check box is checked then the search can be
refined by specifying a score; then only reactions with that
score are returned. If the Show systematic UseR check box is
ticked then the status of this flag is also returned. ‘+’ indicates
the flag is set, ‘-’ that it is cleared and ‘ ’ indicates that the
reaction has no systematics flag. If searching by reaction type
then there is an additional option to sort the reactions by target
(the default) or by data source (then within that source by
User manual: Issue 8, March 2010
CCFE Fusion
84
SAFEPAQ-II
target). To do this click the right hand radio button above the
list box.
If a search by data source is required then click the Source
radio button and select the source from the dropdown list.
Clicking the Get reactions button shows all reactions that fit
the criteria, the data source and the total number of reactions.
Figure 107. The Reaction search window.
Another way of making global changes of the data source for
sets of reactions is by considering the Quality score for the
reaction (see Table 4). By clicking on the Reaction
data|Change data source for score=0 to TALYS for
reaction type menu item and then selecting a reaction type
such as (n,2n) from the submenu, then all (n,2n) reactions that
have score = 0 and with a data source not set to TALYS will be
changed to data from the current TALYS version. The submenu
shows fifteen reaction types explicitly. All the remaining
reaction types can be changed together by clicking the Others
menu item.
After making significant changes to the reaction list it is
sensible to check that all the specified data sources for each
CCFE Fusion
User manual: Issue 8, March 2010
SAFEPAQ-II
85
reaction actually contain data. This can be done by clicking the
Reaction data|Check|Sources in reaction list… menu item
which displays the Check sources in reaction list window
shown in Figure 108.
Figure 108. The Check sources in reaction list window.
Click the Get reactions button to display a list of reactions for
which the specified data source actually contains no data. The
list can be printed out by clicking the Print button and placed
on the clipboard by clicking the Copy button. During the
production of the EAF-2007 proton-induced library there was
only a single data source. Therefore all reactions listed needed
to be removed from the reaction list. In such a case all the listed
reactions can be removed by clicking on the Delete all button.
A second check that can be carried out is to check that all the
reactions have daughters that are also defined in the list of
nuclides. Problems may occur with reactions having isomeric
daughter states not defined in the nuclide list. Clicking the
Reaction data|Check|Daughters in reaction list… menu
item displays the Check daughters in reaction list window
which is identical to Figure 108, except that the text reads
‘reactions with no decay data for daughters’.
A third check that can be carried out is to check that all the
multiplicities are correct. Clicking the Reaction data|Check|
Multiplicities in reaction list… menu item displays the Check
multiplicities in reaction list window shown in Figure 109.
Select one of the radio buttons specifying the multiplicity to test
and then click the Get reactions button to display a list of
reactions for which the multiplicity is incorrect. The list can be
printed out by clicking the Print button and placed on the
clipboard by clicking the Copy button.
User manual: Issue 8, March 2010
CCFE Fusion
86
SAFEPAQ-II
Figure 109. The Check multiplicities in reaction list window.
A fourth check that can be carried out further checks that all the
multiplicities are correct. Clicking the Reaction data|Check|
Multiplicities in reaction/nuclide lists… menu item displays
the Check multiplicities in reaction/nuclide lists window
which is identical to Figure 108, except that the text reads
‘reactions with multiplicity <> number FS’. Click the Get
reactions button to display a list of reactions for which the
multiplicity is incorrect. The list can be printed out by clicking
the Print button and placed on the clipboard by clicking the
Copy button.
Having decided on the reactions and their sources the next step
is to construct the Master database. This is done by clicking on
the Reaction data|Generate Master database menu item. If
Master already contains data then the confirmation dialog
shown in Figure 110 is displayed prior to deleting any data. It
takes a significant time (~ 7 hours) to generate Master.
Figure 110. Confirmation dialog prior to deleting reactions
from Master.
The next step is to find modifications to the data in Master.
This is divided into two stages; termed preliminary
modifications and modifications. In the first stage three types of
preliminary modifications are considered. Firstly any preCCFE Fusion
User manual: Issue 8, March 2010
SAFEPAQ-II
87
equilibrium modifications to capture data at high energies are
found. SAFEPAQ-II carries out this step by comparing the
Master data with that predicted by systematics at 14.5 MeV.
Only reactions with a multiplicity of one are considered (to
avoid issues with branching). Any reactions where (data in
Master / Systematics) < 0.5 are noted and the additional data
are generated using the Zhixiang and Delin formula for direct
capture. This generates 119 (39 in the case of a non-extended
energy library) data points in the energy range 1 – 60 (20) MeV,
these are stored in the Additional data table of Parameter and a
modification of Mod type 9 is stored for the reaction. Click on
the Reaction data|Find all pre-equilib preliminary
modifications menu item to carry out this action.
The data files contain ‘double points’. These are where two
data points have the same energy but different cross sections.
Double points (and single points exactly at the EH value for
(n,γ) reactions) can cause problems. It is necessary to slightly
shift the energy value of such points, clicking the Reaction
data|Find all EH preliminary modifications menu item
carries out this step.
Thirdly, it is possible that some data files contain inaccurate Qvalues for the non-threshold reactions. These can be corrected
by using data from the Wapstra mass table. Any reactions
where the Q-value in Master differs by more than 5% from the
Wapstra value are changed to the Wapstra value. Click on the
Reaction data|Find all non-threshold Q-value preliminary
modifications menu item to carry out this action.
These three types of preliminary modifications involve several
of the basic modifications considered in SAFEPAQ-II. The
nineteen modification types are shown in Table 2. The results
of these steps can be viewed by clicking the Reaction
data|View preliminary modifications… menu item or the
twenty-fourth toolbar button which displays the Preliminary
modifications window shown in Figure 111.
Modifications are either introduced automatically during
processing or in an ‘Ad-hoc’ fashion. For those added by
processing there is a yellow background text box containing
‘Process’. For Ad-hoc mods the box contains ‘Ad-hoc’ on a
blue background. If the Change value of Kind check box is
ticked in the Settings window (Figure 1), then it is possible to
toggle the type by double clicking the coloured box with the
mouse. This should not normally be necessary and the check
box should normally be cleared. If the Ext check box is ticked
then values of parameters for pre-modifications in the External
database (see page 154) will be displayed in a ToolTip. If there
User manual: Issue 8, March 2010
CCFE Fusion
88
SAFEPAQ-II
is more than one pre-modification, then pressing the ‘>’ or ‘<’
keyboard keys will display the next or previous details. For
some reactions there may be two data merge (Mod type 13) premodifications present. The order of these is important and it
may be necessary to reverse them, which can be done by
selecting the first data merge and then clicking the Switch
button.
Figure 111. The Preliminary modifications window.
In Table 2 a brief description of the Action of each Mod type is
given, followed by a specification in terms of the six fields used
in each modification. These are [Elow], [Ehigh], [Eref], [Xref],
[fact], [Addnum]. The first five are Double data types and the
last is a Long. The first three are typically energy values, the
fourth is a cross section, the fifth a factor and the sixth the
identification number of additional data. Details of what each
modification does in terms of the data points are given in Table
3.
In Figure 111 values for the first five of these fields are shown
in the text boxes and the Action of the modification is shown in
the Mod type text box. The value of the Addnum field is rarely
required, but it is available in a ToolTip by hovering the cursor
over the Mod type text box. If a Mod Type 13 (data merge)
modification is selected then the ToolTip also shows the upper
energy (Emax) of the data merge. Selecting any of the reactions
in the list box shows the values of the first five fields for the
first modification in the text boxes. If there is more than one
modification for the reaction then the > and < buttons are
enabled, it is possible to view each of the modifications by
clicking < to move back and > to move to the next one. The
selected modification can be removed by clicking the Delete
Mod button. Clicking the button actually inserts a Mod type 17
CCFE Fusion
User manual: Issue 8, March 2010
SAFEPAQ-II
89
modification for the reaction. The reason is that this Ad-hoc
deletion is stored and can be redone automatically for a future
library. There may be times when the pre-modification needs to
be removed completely and this can be done by clicking the
Delete Mod button with the Shift key pressed. A new
modification can be added by clicking the Add Mod… button
which displays the Add Preliminary modification window
shown in Figure 112. Note that if the Shift key is pressed
while clicking the Add Mod… button, then the details of the
currently selected reaction are added to Figure 112.
Figure 112. The Add Preliminary modification window.
Enter details of the reaction in the text box, dropdown list and
with the radio buttons. Select a type of modification in the Mod
type dropdown list and add any values required in the text
boxes. Note that the boxes that require data are shown in white
rather than grey. If the Data merge (Mod type 13) modification
is chosen from the dropdown list then a list box of the source
databases becomes visible. If the Low energy merge (Mod type
18) modification is chosen from the dropdown list then list
boxes showing the source databases and the reaction types
become visible. For both modification types it is necessary to
select a database from the Source databases dropdown box
which will provide the data for the reaction. In the Low energy
merge it is possible to use data for a different type of reaction
than the reaction specified in the Reaction dropdown box. To
do this select a reaction for the low energy data from the
Source dropdown box. Clicking the Add button will add the
modification to the Parameter database.
Note that from EASY-2005 it is possible to do a data merge
using data from a summed reaction rather than only for a
reaction of the exact reaction type.
User manual: Issue 8, March 2010
CCFE Fusion
SAFEPAQ-II
90
Table 2. Specification of the modification types.
Mod
type
1
Action
Extrapolated data points
2
Renormalise to systematics
3
Renormalise to experiment
4
Renormalise by factor
5
Removes data points
6
7
8
Renormalise by linearly
energy dependent branching
ratio
Modification of Q-value
Change number of points
9
Pre-equilibrium addition
10
Change interpolation law
11
1/v addition
12
Add a data scrap
13
Data merge
14
Change energy value
15
Change cross section
16
17
Add single data point
Delete modification
18
Low energy merge
19
Energy scale shift
CCFE Fusion
Specification
Additional data points between [Elow] and [Ehigh] extrapolated
using the law in [Xref].
Renormalise all data between [Elow] and [Ehigh] to the
systematic value [Xref] given at 14.5 MeV or 30 keV [Eref].
Renormalise all data between [Elow] and [Ehigh] to the
experimental value [Xref] given at [Eref].
Multiplies all data between [Elow] and [Ehigh] by a factor
[fact].
Removes all data points with [Elow] ≤ Energy ≤ [Ehigh]. Note
that mod implemented for no points > [Ehigh] at this stage.
Multiplies each data point between EH [Elow] and 60 MeV
[Ehigh] by factor f. f=fmid +(fhigh-fmid)*(E-Emid)/(Ehigh-Emid).
Ehigh=[Eref], fmid=[Xref], fhigh=[fact].
Replaces QI in the Reaction entry by the new Q-value [Eref].
Removes npt [Addnum] points from the start of cross section,
replaces by 1 point [Xref] at E [Eref]. Adjusts NP in Reaction
and Interpolation tables.
Additional cross section data between [Elow] and [Ehigh] given
in [Addnum].
The interpolation law for points between [Elow] and [Ehigh] is
changed to Int([fact]). Note that when entering [Elow] use a
value ≥ than the value required.
Additional cross section data between 1 x 10⁻⁵ eV [Elow] and EV
[Ehigh] given in [Addnum]. Curve can go through [Xref] at
[Eref] if required.
Additional data between [Elow] and [Ehigh] given in [Addnum].
The interpolation law is Int([fact]) and the number of points is in
[Eref].
Additional data above [Eref] given in [Addnum]. The
interpolation law is Int([fact]) and the number of point is in
[Xref].
Data points at [Eref] are changed by a factor 1 ± [fact]. Lower
point by (1-[fact]), the higher (if present) by (1+[fact]).
The data point at [Eref] has its cross section value changed to
[Xref].
A new data point of cross section value [Xref] at [Eref] is added.
An existing modification of type [Addnum] with parameters
given by [Elow], [Ehigh], [Eref], [Xref], [fact] is not used.
Additional data below [Eref] given in [Addnum]. The
interpolation law is Int([fact]) and the number of point is in
[Xref].
All data points have energy value increased by [Eref].
User manual: Issue 8, March 2010
SAFEPAQ-II
91
Table 3. Details of the modification types.
Mod
type
1
2
Description
Diagrams
Current data for the reaction has
the last point at Eupper . Elow and
Ehigh are such that Eupper < Elow <
Ehigh. Using the final two data
points to extrapolate, cross section
values for the 11 points (at Elow
and Ehigh and 9 others in between)
are calculated.
Current data points in range Elow ≤
E ≤ Ehigh and the next point > Ehigh
are multiplied by a factor so that
the average curve of the points
passes through Xref. Note that Eref
is one of the energies where
systematics are defined.
Eupper
9 points
Ehigh
Elow
X ref
Ehigh
Eref
Elow
3
Current data points in range Elow ≤
E ≤ Ehigh and the next point > Ehigh
are multiplied by a factor so that
the average curve of the points
passes through Xref. Note that Eref
can be any value.
X ref
Ehigh
Eref
Elow
4
Current data points in range Elow ≤
E ≤ Ehigh and the next point > Ehigh
are multiplied by a factor f.
f
Ehigh
Elow
5
6
Current data points in range Elow ≤
E ≤ Ehigh are removed from the
data set. Note that there must be
no points > Ehigh in the set and if
the point at Eupper (= 20 or 60
MeV) is removed by this
operation then it is added back to
the dataset.
Ehigh
Elow
Current data points in range Elow ≤
E ≤ Eref are multiplied by a
linearly energy dependent factor f.
f=f0 +(f1-f0)*(E-Elow)/(Eref-Elow).
f0=[Xref], f1=[fact]. If f<0 then f is
set to 0.001.Data points in range
User manual: Issue 8, March 2010
CCFE Fusion
SAFEPAQ-II
92
Mod
type
Description
Diagrams
Eref < E ≤ Ehigh are multiplied by
the factor f1.
f1
Eref
f0
Ehigh
Elow
7
8
Replaces QI in the Reaction entry
by the new Q-value [Eref]. Note
that no data points are changed.
Removes npt [Addnum] points
from the start of cross section,
replaces by 1 point [Xref] at E
[Eref]. Note that these points must
be at the start of the data set.
Xref
npt
Eref
9
10
11
12
Additional cross section data
between [Elow] and [Ehigh] given
in [Addnum] are added. If the data
overlaps the current data set then
the existing energies are used. At
higher energies a spacing of 0.5
MeV is used.
The interpolation law for points
between [Elow] and [Ehigh] is
changed to Int ([fact]). Note that
when entering a value for [Elow]
use a value ≥ than the value
required.
Additional cross section data
between [Elow] and [Ehigh] given
in [Addnum]. Initial point of
current data set is at E1. If E1 =
Ehigh then set [Eref] to Ehigh and
[Xref] to 1/v value at Ehigh. The 1/v
values are scaled so as to join
smoothly on to the current set. If
Ehigh < E1 then interpolation law 5
extends up to E1. If Ehigh > E1 then
the existing points with E1 ≤ E <
Ehigh are removed.
The current data points with Elow <
E < Ehigh are removed and the
additional data between [Elow]
and [Ehigh] given in [Addnum]
are added. The interpolation law
of the scrap data is Int ([fact]) and
the number of points is [Eref].
Elow
Elow
Ehigh
Xref
XS
Ehigh = Eref E1
Remove
Ehigh
Elow
CCFE Fusion
User manual: Issue 8, March 2010
SAFEPAQ-II
Mod
type
13
93
Description
Diagrams
Current data in the range E ≥ Eref
are removed and replaced with the
additional data specified in
[Addnum]. The interpolation law
is Int([fact]) and the number of
new data points is in [Xref].
Remove
Eref
14
Data points at [Eref] are changed
by a factor 1 ± f, where f = [fact].
Lower point by (1-f), the higher (if
present) by (1+f).
New data
(1+f)*Eref
(1-f)*Eref
Eref
15
The data point at [Eref] has its
cross section value changed to
[Xref].
Xref
Eref
16
A new data point of cross section
value [Xref]at [Eref] is added.
Xref
Eref
17
18
An existing modification of type
[Addnum] with parameters given
by [Elow], [Ehigh], [Eref], [Xref],
[fact] is not used.
Current data in the range E ≤ Eref
are removed and replaced with the
additional data given in [Addnum]
which covers the energy range
from 1 x 10⁻⁵ eV – Eref. The
interpolation law is Int ([fact]) and
the number of new data point is in
[Xref].
Remove
Eref
New data
19
All data points have energy value
increased by [Eref].
In Figure 111, clicking the Delete all Mods for reaction
button removes all preliminary modifications for the reaction
from the database. Note that this method of deleting actually
removes the modification rather than by inserting a Mod type
17 modification. It is possible to remove all preliminary
modifications by clicking the Delete all Mods in Parameter
button. It is possible to see the effect of modifications on a
User manual: Issue 8, March 2010
CCFE Fusion
94
SAFEPAQ-II
reaction by clicking the Test Mods button. This copies data
from the Master to Test database, and carries out the
modifications. The cross section can then be visualised in the
normal way by copying the data to Cache. It is possible to add a
comment so that details of the added modification can be noted.
To do this select the pre-modification and either type a
comment or select an existing one using the dropdown list.
Clicking the Save button will write the comment to Parameter.
A list of all the preliminary modifications can be printed by
clicking the Print button.
If preliminary modifications that were added Ad-hoc are
available in a previous EAF database then these can be reused
(so long as data for the reaction in Parameter have not been
significantly changed), saving a great deal of effort. To do this
click the Reaction data|Process Ad-hoc preliminary
modifications… menu item that displays the Process Ad-Hoc
Preliminary modifications window shown in Figure 113. The
database to be used is shown, this is the same as the one
selected when comparing with an External database (see page
154). Before use it is necessary to click the Check button to
ensure that the External Parameter database is sufficiently
recent (the Kind and Status fields must be present). By default
the All radio button is selected. If the database can be used then
the Process button is enabled. Clicking this will add all
possible Ad-Hoc preliminary modifications to the Internal
Parameter database. Any that cannot be added are listed in the
window. This list can be copied to the clipboard by clicking the
Copy button or printed by clicking the Print button. The
reactions can be investigated individually and further
preliminary modifications added as necessary.
Figure 113. The Process Ad-Hoc Preliminary modifications window.
Rather than process all the Ad-hoc preliminary modifications it
is possible to select a range. If the PreModification and
PreModSummary tables in the Parameter database are
examined using Access the required Mod numbers can be
CCFE Fusion
User manual: Issue 8, March 2010
SAFEPAQ-II
95
chosen. The Range from radio button is clicked and the
starting and finish modifications (inclusive) are entered in the
text boxes. In some cases the Status of the reaction is
unimportant (if experimental data or the data source have been
changed in Parameter then the Status field is changed from 0 to
1 and the pre-modification is not added). To ignore the reaction
Status check the Ignore Status check box.
It is possible that following the addition of Ad-hoc premodifications that for some reactions there may exist redundant
Mod type 17 pre-modifications. These should be removed and
this can be done by clicking the Reaction data|Find reactions
with incorrect ModType 17 pre-modifications… menu item
that displays the Reactions with incorrect ModType 17 premodifications window shown in Figure 114. Clicking the Get
reactions button lists the reactions. If any reactions are shown
then select one and click the View data button to open the
Reaction data window (Figure 70) where the data can be
inspected.
Figure 114. The Reactions with incorrect ModType 17 premodifications window.
The major difference for an extended energy library is that data
are required between 20 and 60 MeV. A large number of
reactions have been added from TALYS using the Add new
reactions window (Figure 104), but those already present in
say, EAF-2003, need to be extended to 60 MeV. This can be
done automatically using data from TALYS by clicking the
Reaction data|Find all high-energy data merge premodifications|Find all >20 MeV data merge (TALYS) premodifications… menu item. This searches through the reaction
list and for each reaction with no data > 20 MeV checks if such
data exist in TALYS. If so then the data are extracted, scaled by
a factor f so that there is no discontinuity at 20 MeV and then
stored as a Mod type 13 pre-modification.
For the preparation of the EAF-2007 deuteron-induced library it
was necessary to extend a set of reactions above 50 MeV. This
was done by clicking the Reaction data|Find all high-energy
User manual: Issue 8, March 2010
CCFE Fusion
96
SAFEPAQ-II
data merge pre-modifications|Find all >50 MeV data
merge (TALYS) pre-modifications… menu item.
For reactions where the threshold is close to 20 MeV the factor
required to smoothly join the TALYS data to the existing data
at 20 MeV may be significantly different from 1. Such reactions
may be better represented by changing the data source to
TALYS over the entire energy range. To view the values of the
factors click the Reaction data|View High energy factors…
menu item, that displays the View High energy factors
window shown in Figure 115. Enter the factor required in the
text box and click the Get reactions button to list the
reactions, the data source and factor (f). By default the All
sources check box is ticked. This means that even if the
existing data comes from TALYS then the reaction is listed
(this can occur if the TALYS data < 20 MeV were modified).
To remove reactions with a TALYS data source from the data
grid, clear the check box.
In order to view the data for a particular reaction click the
Visualisation button (which is enabled once a reaction is
selected), this copies the selected reaction’s data to the Cache
(if these are not already present) and displays the Targets and
sources window (Figure 67) with the appropriate target and
reaction selected. It is then possible to plot the data in the
normal manner.
If a reaction already has a data merge pre-modification prior to
the automatic data merge with TALYS, then the calculated
factor is almost certainly incorrect. For such reactions the
calculated factor is replaced with the value 1.0E6. Any
reactions with this factors in the table should be investigated.
Figure 115. The View High energy factors window.
CCFE Fusion
User manual: Issue 8, March 2010
SAFEPAQ-II
97
The change of data source to TALYS for reactions with large
factors can be done automatically by clicking the Reaction
data|Change data source to TALYS for all reactions with
large f menu item. This finds all reactions where f > 100 and
the data source is not TALYS and then changes it to TALYS
data from the data source given in the Version of TALYS text
box in the Settings window (Figure 1).
In the discussion of the Preliminary modifications window
(Figure 111) the purpose of the Switch button was given. In
order to identify reactions with multiple Mod type 13
modifications click the Reaction data|Find reactions with
multiple data merges… menu item, this displays the
Reactions with multiple data merges window shown in
Figure 116. Each reaction can then be investigated in turn.
Figure 116. The Reactions with multiple data merges window.
To check which reactions have been extended by a data merge
with TALYS data click the Reaction data|Find reactions
from TALYS with a data merge… menu item. This displays
the Reactions from TALYS with a data merge window
which is the same as Figure 116 except that the caption is
different.
The TALYS data source may not contain high energy cross
section data for all reactions in the EAF project. A second
source of data up to 60 MeV is from the IEAF-2001 library. In
order to use this data source automatically for any reactions not
already completed by data from TALYS click the Reaction
data|Find
all
high-energy
data
merge
premodifications|Find all >20 MeV data merge (IEAF) premodifications… menu item. This searches through the reaction
list and for each reaction with no data > 20 MeV checks if such
data exist in IEAF-2001. If so then the data are extracted, scaled
by a factor f so that there is no discontinuity at 20 MeV and
then stored as a Mod type 13 pre-modification.
Once the collection of pre-modifications is complete, these can
be implemented by generating the Final database. This is done
by clicking the Reaction data|Generate Final database
using preliminary mods menu item. If Final already contains
data then a confirmation dialog similar to that shown in Figure
User manual: Issue 8, March 2010
CCFE Fusion
98
SAFEPAQ-II
110 is displayed prior to deleting any data. Generating Final
involves copying all the data from Master to Final and then
implementing the pre-modifications. It takes a reasonably short
time (~ 10 mins) to carry out this step.
It is now possible to find the main set of modifications. These
are generated by comparing data for each reaction in Final with
information in Parameter. Although it is possible to find these
modifications in a series of steps using items on the Reaction
data|Find modifications sub-menu, it is preferrable to
automate this by clicking on the Reaction data|Automate
processing… menu item or the twenty-sixth toolbar button.
This displays the Automate processing window shown in
Figure 117.
Figure 117. The Automate processing window.
The window shows a series of steps, the required ones should
be checked. The first step opens the Compact databases
window (Figure 4), step 4 refers to the pre-modifications
discussed above. If the various steps are to be carried out unsupervised then the Interactive confirmations check box
CCFE Fusion
User manual: Issue 8, March 2010
SAFEPAQ-II
99
should be unchecked. This stops any confirmation dialogs that
require user interaction.
It can be seen that eight modification steps are checked in
Figure 117, these are described below. Note that in all cases the
flags (Use B and Use R), stored with the experimental data,
determine if the data are used to create the modifications.
Find all branching modifications
(Reaction data|Find modifications|Find all branching
modifications) considers first the threshold and then the nonthreshold reactions. For each of the threshold reactions the
following steps are considered:
1. Are there experimental data for this final state and the other
(for a multiplicity = 2 reaction)? If so then calculate the
branching ratio at the given energy and store a Mod type 4.
2. Are there experimental data for this final state and the other
two (for a multiplicity = 3 reaction)? If so then calculate the
branching ratio at the given energy and store a Mod type 4.
3. Are there experimental data points for two final states but
not the required final state (e.g. m and Total may be present
allowing g to be calculated)? If so then calculate the
branching ratio at the given energy and store a Mod type 4.
4. Are there experimental data points for three final states but
not the required final state (e.g. g, m and Total may be
present allowing n to be calculated)? If so then calculate the
branching ratio at the given energy and store a Mod type 4.
5. Remaining branching ratios by systematics, storing a Mod
type 4.
For non-threshold reactions the following steps are considered:
1. Are there experimental data at 0.0253 eV for this final state
and the other (for a multiplicity = 2 reaction)? If so then
calculate the branching ratio at the energy and store a Mod
type 4.
2. Are there experimental data at 0.0253 eV for this final state
and the other two (for a multiplicity = 3 reaction)? If so then
calculate the branching ratio at the energy and store a Mod
type 4.
3. Are there experimental data points at 0.0253 eV for two
final states but not the required final state (e.g. m and Total
may be present allowing g to be calculated)? If so then
calculate the branching ratio at the given energy and store a
Mod type 4.
4. Are there experimental data points at 0.0253 eV for three
final states but not the required final state (e.g. g, m and
Total may be present allowing n to be calculated)? If so
User manual: Issue 8, March 2010
CCFE Fusion
100
SAFEPAQ-II
then calculate the branching ratio at the given energy and
store a Mod type 4.
5. Remaining branching ratios at thermal energies by
systematics, storing a Mod type 4.
6. Are there experimental resonance integral data for this final
state and the other (for a multiplicity = 2 reaction)? If so
then calculate the branching ratio and store a Mod type 4.
7. Are there experimental resonance integral data for this final
state and the other two (for a multiplicity = 3 reaction)? If
so then calculate the branching ratio and store a Mod type 4.
8. Are there experimental resonance integral data for two final
states but not the required final state (e.g. m and Total may
be present allowing g to be calculated)? If so then calculate
the branching ratio and store a Mod type 4.
9. Are there experimental resonance integral data for three
final states but not the required final state (e.g. g, m and
Total may be present allowing n to be calculated)? If so
then calculate the branching ratio and store a Mod type 4.
10. Remaining branching ratios in the mid-range use those
calculated at thermal energy.
11. Are there experimental data at 14.5 MeV for this final state
and the other (for a multiplicity = 2 reaction), if so then
calculate the branching ratio at the given energy and store a
Mod type 6.
12. Are there experimental data at 14.5 MeV for this final state
and the other two (for a multiplicity = 3 reaction), if so then
calculate the branching ratio at the given energy and store a
Mod type 6.
13. Are there experimental data points at 14.5 MeV for two
final states but not the required final state (e.g. m and Total
may be present allowing g to be calculated)? If so then
calculate the branching ratio at the given energy and store a
Mod type 6.
14. Are there experimental data points at 14.5 MeV for three
final states but not the required final state (e.g. g, m and
Total may be present allowing n to be calculated)? If so
then calculate the branching ratio at the given energy and
store a Mod type 6.
15. Remaining branching ratios at 14.5 MeV by systematics,
storing a Mod type 6.
Details about the definition of branching ratios are given in
Appendix 4.
CCFE Fusion
User manual: Issue 8, March 2010
SAFEPAQ-II
101
Find all experimental modifications
(Reaction data|Find modifications|Find all experimental
modifications) carries out renormalisation to experimental data
for all the reactions, storing a Mod type 3.
Find all systematics modifications
(Reaction data|Find modifications|Find all systematics
modifications) carries out renormalisation to systematic values
for all the reactions, storing a Mod type 2.
Find all repeated zero modifications
(Reaction data|Find modifications|Find all repeated zero
modifications) finds reactions where there is more than one
zero cross section at the start of the data. These additional
points are removed using a Mod type 8 modification.
Find all greater than 60 MeV modifications
(Reaction data|Find modifications|Find all greater than 60
MeV modifications) finds reactions where there are data
points with energies greater than 60 MeV. These unnecessary
points are removed using a Mod type 5 modification. In nonextended libraries the menu item shows 20 MeV.
Find all threshold modifications using Wapstra
(Reaction data|Find modifications|Find all threshold
modifications using Wapstra) compares the threshold in the
file with that calculated using the Wapstra mass table. If
Abs(QWapstra - Qfile) > 10000 eV, then a modification is stored as
Mod type 7.
Find all > 1 E-5 eV non-threshold modifications
(Reaction data|Find modifications|Find all > 1E-5 eV nonthreshold modifications) finds the reactions which are nonthreshold, and where the first point is in the range 1 x 10⁻⁵ < E
< 1 eV. For these reactions add a new point at 1 x 10⁻⁵ eV,
storing the modification as Mod type 8.
Find all non-threshold first point modifications
(Reaction data|Find modifications|Find all non-threshold
first point modifications) finds the reactions which are nonthreshold, and where the first energy value is either < 1 x 10⁻⁵
(in practice this means E = 0) or > 1000 eV or E = 1 x 10⁻⁵eV,
but cross section = 0. For these reactions the first point is
changed to Energy = 1 x 10⁻⁵ eV and cross section = 1 x 10⁻¹⁰ b,
the interpolation law between points 1 and 2 is changed to 1 if
necessary. These two modification are stored as Mod type 8 and
Mod type 10.
User manual: Issue 8, March 2010
CCFE Fusion
102
SAFEPAQ-II
All the above modifications can be found automatically. The
remaining modifications involve changes to the interpolation
law data, but these require user interaction. The first step is to
generate a table of data points for non-threshold reactions
where there is a significant gap (Ei / Ei-1 > 1.5) between data
points (exclude reactions starting with E = 0). This is done by
clicking the Reaction data|Prepare Adjacent cross section
table menu item or the sixth check box in Figure 117. Then
using this table a set of suspect reactions is found by clicking
the Reaction data|Find modifications|Find all suspect
interpolation laws sub-menu item or ticking the fifteenth
check box in Figure 117.
A reaction is suspect if the ratio of energies > 2 and the
interpolation law is not 5 or 1. These suspect reactions can be
viewed in the Interpolation law modifications window shown
in Figure 118, this is displayed by clicking the Reaction
data|Find
modifications|Find
interpolation
law
modifications manually… sub-menu item. Note that at the
same time the Targets and sources window (Figure 67) also
opens, as the two windows are used together.
Figure 118. The Interpolation law modifications window.
The Interpolation law modifications window shows the
suspect reactions in the list box, and when one is selected the
number of suspect points and their point numbers are shown. At
the same time data for this reaction are copied to the Cache (if
they are not already present), and the target and reaction are
selected in the Targets and sources window. From here it is
possible to plot the data in the usual way and decide if there is a
need to modify the interpolation law. If the law is correct, then
click the Ignore button in Figure 118; the window shows this
CCFE Fusion
User manual: Issue 8, March 2010
SAFEPAQ-II
103
(by the word ‘Ignored’) and the status is stored in the database.
However, if some of the data points do require law changes
then select these points in the Data visualisation window
(Figure 68), these points are also selected in the Reaction data
window (Figure 70), or the points can be selected directly in the
Reaction data window. The high and low points of the
selected data are then also shown in the text boxes in Figure
118. Select a new law in the dropdown list and click the Save
Mod button to add a new modification. Note that the
confirmation dialog shown in Figure 119 is displayed before the
modification is saved.
Figure 119. Confirmation dialog prior to adding modification.
As modifications are saved, they are also stored in the
InterpMods table. If there are any entries in this table (as a
result of a previous use of this window) then the Automate
button is enabled. Clicking this checks each suspect reaction in
turn and if there is an entry for this reaction with the same data
source in the InterpMods table then the modification data are
used to create a new modification (without any confirmation
dialog). If the reaction has a different source then it is not
treated, and if it is not present in the InterpMods table then the
‘Ignored’ flag is set. When all the suspect reactions have been
considered then the list box in Figure 118 shows only the
reactions that have not been treated.
User manual: Issue 8, March 2010
CCFE Fusion
104
SAFEPAQ-II
Figure 120. The Modifications window.
The collection of all modifications that have been made can be
viewed by clicking the Reaction data|View modifications…
menu item or the twenty-fifth toolbar button which displays the
Modifications window shown in Figure 120.
The description of this window is exactly the same as following
Figure 111. Refer to that text for details. Clicking the Add
Mod… button displays the Add modification window shown
in Figure 121. Note that if the Shift key is pressed while
clicking the Add Mod… button, then the details of the
currently selected reaction are added to Figure 121.
Figure 121 is very similar to Figure 112, the differences are that
a wider range of modifications are available in the Mod type
dropdown list, there is an additional text box to enter a value in
the Addnum field and there is a Mid range check box. The
latter is required because if the modification refers to the midenergy range for a non-threshold reaction, then it is necessary to
store this value for use in branching calculations. Note that the
boxes that require data are shown in white rather than grey. In
the case of the 1/v addition (Mod type 11) modification it is
optional to enter values in the Ref. Energy and Value at Ref
text boxes. If this is done then the 1/v curve will pass through
the specified point, otherwise it will pass through the point at
High energy.
CCFE Fusion
User manual: Issue 8, March 2010
SAFEPAQ-II
105
Figure 121. The Add modification window.
If the modification adds a Data scrap (Mod Type 12) then a File
name list box and set of Adjust to fit radio buttons are shown
(very similar to those in Figure 75). These need to be completed
before clicking the Add button.
If modifications that were added Ad-hoc are available in a
previous EAF database then these can be reused (so long as
data for the reaction in Parameter have not been changed),
saving a great deal of effort. To do this click the Reaction
data|Process Ad-hoc modifications… menu item that
displays the Process Ad-Hoc modifications window. This is
very similar to Figure 113, but displays modifications not
preliminary modifications. The database to be used is shown,
this is the same as the one selected when comparing with an
External database (see page 154). Before use it is necessary to
click the Check button to ensure that the External Parameter
database is sufficiently recent (the Kind and Status fields must
be present). As in the case of pre-modifications a range of Mod
numbers can be considered as well as the default of processing
all the Ad-hoc modifications. If the database can be used then
the Process button is enabled. Clicking this will add all
possible Ad-Hoc modifications to the Internal Parameter
database. Any that cannot be added are listed in the window.
This list can be copied to the clipboard by clicking the Copy
button or printed by clicking the Print button. The reactions can
be investigated individually and further modifications added as
necessary.
It is possible that following the addition of Ad-hoc
modifications, that for some reactions there may exist
User manual: Issue 8, March 2010
CCFE Fusion
106
SAFEPAQ-II
redundant Mod type 17 modifications. These should be
removed and this can be done by clicking the Reaction
data|Find reactions with incorrect ModType 17
modifications… menu item that displays the Reactions with
incorrect ModType 17 modifications window which is
identical to Figure 114, except that the title is different.
Clicking the Get reactions button lists the reactions. If any
reactions are shown then select one and click the View data
button to open the Reaction data window (Figure 70) where
the data can be inspected.
Once the collection of modifications is complete, these can be
implemented by generating the Final database. This is done by
clicking the Reaction data|Generate Final database using
modifications menu item. Final already contains data, but
these are not deleted, only further changed using the
modifications. The time taken to carry out this step depends on
the total number of modifications, but is typically about 10
minutes.
The assembling of all reaction data is now complete. The next
steps are a series of iterations to view, check and correct the
data to ensure that no further modifications are required.
Twenty-one tests on the data in Final can be carried out. The
first check is to ensure that no negative cross section data have
been produced during the production of Final. To check this
click the Reaction data|Test Final for|Negative cross
sections… submenu item, this displays the Negative cross
sections window shown in Figure 122.
To check if there are any reactions with negative cross sections,
click the Get reactions button, this takes about 20 s to check
all the data. If, as required, there are no reactions shown then
the check is complete. If any reactions are shown then select
one and click the View data button to open the Reaction data
window (Figure 70) where the data can be inspected.
The second test shows if any reactions have zero cross section
at high energy. To check this click the Reaction data|Test
Final for|Missing high energy data… submenu item, this
displays the Missing high energy data window which is
identical to Figure 122 except for the caption.
The third test shows if any reactions have negative energy
values. To check this click the Reaction data|Test Final
for|Negative energies… submenu item, this displays the
Negative energy values window which is identical to Figure
122 except for the caption.
CCFE Fusion
User manual: Issue 8, March 2010
SAFEPAQ-II
107
Figure 122. The Negative cross sections window.
The fourth test shows if any non-threshold reactions have the
first energy point ≠ 1 x 10⁻⁵ eV. To check this click the
Reaction data|Test Final for|Non-threshold reactions with
E<>1E-5 eV… submenu item, this displays the Nonthreshold reactions with E<>1E-5 eV window which is
identical to Figure 122 except for the caption.
The fifth test shows if any non-threshold reactions have any
data points with cross section = 0. To check this click the
Reaction data|Test Final for|Non-threshold reactions with
any xs=0… submenu item, this displays the Non-threshold
reactions with any xs=0 window which is identical to Figure
122 except for the caption.
The sixth test shows if any threshold reactions have other than
the first data points with cross section = 0. To check this click
the Reaction data|Test Final for|Threshold reactions with
other than 1st point xs=0… submenu item, this displays the
Non-threshold reactions with other than 1st point xs=0
window which is identical to Figure 122 except for the caption.
Note that if reactions are shown in the list box, then it may be
possible to generate a set of modifications to correct them by
clicking on the Reaction data|Find all 2nd type of repeated
zero modifications menu item. This finds reactions where the
first two points have cross section = 0 and replaces the second
value with a value linearly interpolated from the first and third
points. Usually this class of modifications will not be required.
The seventh test shows if any reactions have the data point at
60 MeV missing. To check this click the Reaction data|Test
Final for|Missing 60 MeV data point… submenu item, this
displays the Missing 60 MeV data point window which is
identical to Figure 122 except for the caption. Note that if
reactions are shown in the list box, then it may be possible to
generate a set of modifications to correct them by clicking on
the Reaction data|Find all missing 60 MeV modifications
menu item. This finds reactions where there is no data point at
60 MeV and adds it using a value linearly extrapolated from the
last two data points. Usually this class of modifications will not
User manual: Issue 8, March 2010
CCFE Fusion
108
SAFEPAQ-II
be required. For non-extended libraries, 20 replaces 60 on all
menu items.
The eighth test shows if any reactions contain repeated energy
points. To check this click the Reaction data|Test Final
for|Repeated energy points… submenu item, this displays
the Reactions with repeated energy points window which is
identical to Figure 122 except for the caption. Note that if
reactions are shown in the list box, then it is possible to correct
them by clicking on the Reaction data|Remove repeated
energy points from Final menu item. This step is described
later.
The ninth test shows if any reactions contain inconsistent
interpolation ranges. It is possible that the number of
interpolation ranges for a reaction shown in the Reaction and
Interpolation tables of Final may not agree. To check this click
the Reaction data|Test Final for|Inconsistent Interpolation
ranges… submenu item, this displays the Reactions with
inconsistent Interpolation ranges window which is identical
to Figure 122 except for the caption.
The tenth test shows if any reactions contain inconsistent cross
section data. It is possible that the number of data points for a
reaction shown in the Reaction and Cross section tables of
Final may not agree. To check this click the Reaction
data|Test Final for|Inconsistent Cross section data… submenu item, this displays the Reactions with inconsistent
Cross section data window which is identical to Figure 122
except for the caption.
The eleventh test shows if any reactions contain inconsistent
numbers of data points. It is possible that the number of data
points or ranges for a reaction shown in the Reaction, Cross
section and Interpolation tables of Final may not agree. To
check this click the Reaction data|Test Final
for|Inconsistent number of data points… submenu item,
this displays the Reactions with inconsistent number of
data points window which is identical to Figure 122 except for
the caption.
The twelfth test shows if any threshold reactions contain a first
point with energy < 1eV. To check this click the Reaction
data|Test Final for|Threshold reactions with wrong 1st
point… submenu item, this displays the Theshold reactions
with wrong 1st point window which is identical to Figure 122
except for the caption.
The thirteenth test shows if any threshold reactions contain a
first range with a interpolation law that uses the log of the cross
section (laws 4 or 5). Since the first data point has cross section
CCFE Fusion
User manual: Issue 8, March 2010
SAFEPAQ-II
109
= 0, such a law would cause a crash. To check this click the
Reaction data|Test Final for|Threshold reactions with
wrong 1st law… submenu item, this displays the Theshold
reactions with wrong 1st law window which is identical to
Figure 122 except for the caption.
The fourteenth test only applies to libaries with energies > 20
MeV. For such libraries all reactions should contain data above
20 MeV. To check this click the Reaction data|Test Final
for|Missing data above 20 MeV… submenu item, this
displays the Missing data above 20 MeV window which is
identical to Figure 122 except for the caption.
The fifteenth test shows if any reactions have data points with
energies > 60 MeV. To check this click the Reaction
data|Test Final for|Data points > 60 MeV… submenu item,
this displays the Data points > 60 MeV window which is
identical to Figure 122 except for the caption. For non-extended
libraries, 20 replaces 60 on the menu item.
The sixteenth test shows if any reactions have a Q-value of
zero. To check this click the Reaction data|Test Final for|Q
value = 0… submenu item, this displays the Q value = 0
window which is identical to Figure 122 except for the caption.
The seventeenth test actually uses data in Parameter, but
devived from Final. A systematic formula for the total nonelastic cross sections is available [10]. The sum of the cross
sections for all the reactions at 14.5 MeV should agree closely
with the non-elastic systematic for this energy. Any reactions
which differ by more than a factor of 2 need further
investigation. To check this click the Reaction data|Test
Final for|Inconsistent non-elastic data at 14.5 MeV… submenu item, this displays the Inconsistent non-elastic data at
14.5 MeV window which is identical to Figure 122 except for
the caption.
The eighteenth test is identical to the seventeenth except that
data at 40 MeV are considered. To check, click the Reaction
data|Test Final for|Inconsistent non-elastic data at 40.0
MeV… submenu item, this displays the Inconsistent nonelastic data at 40.0 MeV window which is identical to Figure
122 except for the caption.
The nineteenth test shows if any reactions have energies for the
first and second data points that are not increasing. To check
this click the Reaction data|Test Final for|Wrong energy
order for points 1 and 2… submenu item, this displays the
Wrong energy order for points 1 and 2 window which is
identical to Figure 122 except for the caption.
User manual: Issue 8, March 2010
CCFE Fusion
SAFEPAQ-II
110
The twentieth test shows if any reactions have a very sharp
discontinuity in cross section as the energy increases. Such a
steep gradient can cause problems when the group cross
sections are calculated. To check this click the Reaction
data|Test Final for|Very steep gradient… submenu item,
this displays the Reactions with very steep gradient window
which is identical to Figure 122 except for the caption.
The twenty first test shows if any reactions have an incorrect
multiplicity value. A similar test was carried out in Parameter
(see Figure 109), but problems may occur during the generation
of Final. To check this click the Reaction data|Test Final
for|Incorrect multiplicity… submenu item, this displays the
Reactions with incorrect multiplicity window which is
identical to Figure 122 except for the caption.
Table 4. EAF-2010 Quality scores.
Score
0
1
2
3
4
5
50
51
52
53
54
6
Description
No experimental data exists
Limited differential data which disagrees with the library (weak
disagreement)
Limited differential data which agrees with the library (weak
agreement)
Differential data which disagrees with the library (strong
disagreement)
Differential data which agrees with the library (strong agreement)
Both differential and integral data exist or only integral data exist
and these are not in agreement with the library
Differential data are missing and unsatisfactory agreement with
integral data
Unsatisfactory agreement with differential and integral data
Satisfactory agreement with differential and unsatisfactory
agreement with integral data
Differential data are missing and satisfactory agreement with
integral data
Unsatisfactory agreement with differential data and satisfactory
agreement with integral data
Both differential and integral data exist and they are in agreement
with the library (validation)
A new feature in EASY-2003 was the addition of a Quality
score for each reaction. This score indicates whether there are
any differential or integral experimental data and whether the
data agree with the EAF library. For the current version score 5
(discrepant data) has been subdivided to show the degree of
discrepancy. Table 4 shows the definitions of the scores.
The Quality scores for reactions can be viewed by clicking the
Reaction data|Quality scores… menu item which displays
CCFE Fusion
User manual: Issue 8, March 2010
SAFEPAQ-II
111
the Quality scores window shown in Figure 123. A choice of
reactions to view is made by selecting one of the radio buttons
in the View reactions group and clicking the Get reactions
button. The number of reactions is indicated at the top right of
the window.
Figure 123. The Quality scores window.
In the case that reactions with score 5 are selected then it is
possible to select which type of Discrepant reactions are shown
in the Discrepant reactions group. Selecting a reaction
displays the score in one or two text boxes enabling it to be
changed. Clicking the Save button saves the change. Note that
if all reactions (or those with score 0) are displayed then for
high mass targets the new score is not displayed in the list. This
technical problem can be avoided by changing scores with one
of the other reaction radio buttons clicked. The list of reactions
can be copied to the clipboard by clicking the Copy button or
printed by clicking the Print button. Clicking the Close button
closes the window.
The data source of the selected reaction is displayed as a
ToolTip when the cursor hovers over the Reaction listbox.
This information can be included when reactions are copied or
printed if the Source in Print/Copy option is checked.
During the review of data in Final, it may be necessary to
follow all the above processing steps for a single reaction to
improve the data. This can be done by clicking the Reaction
User manual: Issue 8, March 2010
CCFE Fusion
112
SAFEPAQ-II
data|Single reaction processing… menu item or the twentyseventh toolbar button which displays the Single reaction
processing window shown in Figure 124. This consists of a
series of tabs which divide the processing into a number of
phases. The window opens with the Source tab displayed.
Clicking on the Get reactions button will show all the targets
in the first list box, selecting one of these displays the reactions
for the target in the second list box. The selected reaction name
is shown in the window’s title bar.
Note that the Get reactions button is only enabled if the Final
database has been constructed. To avoid having to click the Get
reactions button each time the window is opened (provided
that Final has been constructed), the window will open with the
reactions already displayed if the Auto open Single Reac
check box is ticked in the Settings window (Figure 1). An
additional feature that saves time when selecting reactions has
been added from EASY-2005. The window will open with the
target and reaction selected that were used when the window
was closed previously.
Figure 124. The Single reaction processing window (Tab 1).
Note that if a reaction is split into several final states then these
must be considered consecutively (g, then m, then n) without
shutting down SAFEPAQ-II, so that the systematics data in the
various Summary tables in Parameter can be correctly stored.
Note that the selected reaction and the reaction number are also
displayed at the bottom left of the window. This is necessary as
in some cases the entire reaction including the daughter cannot
be displayed in the window caption.
CCFE Fusion
User manual: Issue 8, March 2010
SAFEPAQ-II
113
Note that only sources relevant to the specified type of
incoming particle are displayed.
Click the Get sources button to enter all the sources for the
selected reaction into the dropdown list box. Note that sources
with the selected reaction’s final state or 99 are shown, this
enables the source of a split reaction to be changed to a source
which only contains the total cross section. If it is necessary to
use summed data from a data source, then the MT>200 check
box must be checked so that this data source is available in the
dropdown list. The current source can be altered by clicking
one of the sources in the dropdown list. To make the change
click the Change source button. Before data are changed in
the Parameter database the confirmation dialog shown in Figure
125 is displayed. If the source has been changed then click on
the Change Master button to change data for this reaction in
the Master database. Now click on the Pre-mods tab to start
the next phase.
Figure 125. Confirmation dialog prior to changing data source.
Figure 126 shows the window with this tab selected. Text in the
window shows the number of pre-modifications that exist for
the reaction. If this is greater than 0, then the Delete button is
enabled and the existing pre-modifications can be removed. If
any of the pre-modifications is Ad-hoc then this is noted at the
bottom of the tab. Now click the Find pre-mods button to find
any pre-modifications required for the reaction. Note that it is
possible to use the existing Pre-modifications by just clicking
the Change Final button. As the pre-modification types are
considered a tick or a cross is displayed next to the premodification description to indicate if it been found. Other premodifications (specifically a Data merge) can be entered by
clicking the Add pre-mod… button. This displays the Add
Preliminary modification window shown in Figure 112. Note
that the Target, Reaction and Final state details are already
entered. When carrying out a Data merge, the value of EH is
inserted in the Ref. energy text box. In cases where the
reaction is split this value should be slightly increased to avoid
problems. Click the Delete pre-mod… button to show a series
of Confirmation dialogs enabling each pre-modification to be
deleted in turn. Click the Change Final button to implement
these pre-modifications in Final. Click the Change Adjacent
User manual: Issue 8, March 2010
CCFE Fusion
114
SAFEPAQ-II
button to change the data in the Adjacent cross section table for
the reaction.
Note that there is a major distinction between clicking the
Delete and the Delete pre-mod... buttons. The former
removes all the pre-modification for the reactions, while the
latter actually adds a Mod type 17 modification to the existing
pre-mods. The reason for this is that pre-modifications
generated automatically can be removed. Removal of a premodification by the use of a Mod type 17 pre-modification is
also stored and can be reused in the next EAF project (see
discussion on page 88). Now click on the Mods tab to display
the third tab shown in Figure 127.
Figure 126. The Single reaction processing window (Tab 2).
Text in the window shows the number of modifications that
exist for the reaction. If this is greater than 0, then the Delete
button is enabled and the existing modifications should be
removed. Note that if required, the existing modifications can
be used to recalculate Final. If any of the modifications is Adhoc then this is noted at the bottom of the tab, as in Figure 127.
Now click the Find mods button to find any modifications
required for the reaction. As the various modification types are
considered a tick or a cross is displayed next to the
modification description to indicate if modifications have been
found. Click the Interp mods… button to open the
Interpolation law modifications window (Figure 118) to
decide if the interpolation law needs to be changed. Additional
modifications can be entered by clicking the Add mod…
button. This displays the Add Modification window shown in
Figure 121. Note that the Target, Reaction and Final state
details are already entered. Click the Delete mod… button to
show a series of Confirmation dialogs enabling each
CCFE Fusion
User manual: Issue 8, March 2010
SAFEPAQ-II
115
modification to be deleted in turn. Click the Change Final
button to implement these modifications in Final. The same
distinction between deleting all the modifications and deleting
one discussed above also applies here. Now click on the
Remainder tab to display the fourth tab shown in Figure 128.
Figure 127. The Single reaction processing window (Tab 3).
Figure 128. The Single reaction processing window (Tab 4).
Click the Change summary button to change the summary
values (discussed below). Click the Change multi-group
button to change the multi-group values (discussed below), as
each energy group is completed a tick is shown against the
group name. Click the Change uncertainty button to change
the uncertainty values (discussed below). Click the Change
averages button to change the average cross section values in
User manual: Issue 8, March 2010
CCFE Fusion
116
SAFEPAQ-II
the various neutron spectra values (see page 69). The Quality
score for the reaction (see page 111) is displayed, this can be
changed and then saved by clicking the Save Score button.
When changes are made it is a good idea to add comments in
the Log. This can be done by clicking the View Log… button
to open the Log window (Figure 6).
The final processing action for the data in the Final database is
to remove any repeated energy points. Reactions where they
occur are indicated by the eighth test described on page 108. If
there are repeated points then click on the Reaction
data|Remove repeated energy points from Final menu
item. This step takes typically from a few minutes to 1.5 hours,
depending on the number of reactions and replaces a set of
points with the same energy by a set separated by a single digit
in the sixth decimal place.
It can now be assumed that the data in Final are good enough.
The data can now be further processed. Clicking the Reaction
data|Generate data|Generate summary of Final database
submenu item will start the calculation of the thermal, 30 keV,
14.5 MeV, 20 MeV and resonance integral values for each
reaction and put the results in various tables in the Parameter
database. Also systematics data for each reaction are stored in
tables in Parameter. If summary data already exist then the
confirmation dialog shown in Figure 129 is displayed.
Generating summary data takes about 6 hours.
Figure 129. Confirmation dialog prior to changing summary data.
Clicking the Reaction data|Generate data|Generate multigroup data… submenu item will display the Multi-group files
window shown in Figure 130. Check the energy groups that
need to be calculated, if the elapsed time is required then check
the Timer option. Clicking the Calculate button will start the
calculation. Since calculating each group structure can take
many hours, there is a facility for interrupting the calculation.
While the calculation is running, the caption of the second
button changes to STOP calculation!. Clicking this will stop
the calculation at the end of the next reaction. However, the
progress of the calculation is stored and the dialog shown in
Figure 131 is displayed next time. Typical calculation times
CCFE Fusion
User manual: Issue 8, March 2010
SAFEPAQ-II
117
are: 69-groups 6h, 100-groups 10h, 172-groups 14h, 175groups 16h, 315-groups 36h, 211-groups 15h, 351-groups 25h.
Figure 130. Multi-group files window.
Figure 131. Confirmation dialog prior to starting multi-group calculation.
Figure 131 shows the number of reactions that have already
been calculated. Clicking the No button will keep the results
and restart the calculation. Clicking Yes will remove existing
results and start again. Note that where there is more than one
weighting, give the same answer for each confirmation dialog.
A mathematical description of the methods of multi-group
calculation is given in Appendix 3.
Clicking the Reaction data|Generate data|Generate
uncertainty data submenu item will start the calculation of the
uncertainty data for all the reactions. If uncertainty data already
exist then a confirmation dialog similar to Figure 129 is
displayed. This step takes about 55 minutes.
The summary information generated above can be used to carry
out validation of the Final data against the experimental and
systematic data held in Parameter. Clicking the Reaction
data|Validation plots… menu item or the twenty-eighth
toolbar button displays the Validation plots window shown in
User manual: Issue 8, March 2010
CCFE Fusion
118
SAFEPAQ-II
Figure 132. Since EASY-2005, three distinct types of graphs
can be plotted. First consider the histogram plots, selected by
clicking the Histogram radio button.
Select a reaction type in the dropdown list box, a comparison
type (C/S shows the Final/Systematics ratio, C/E shows the
Final/Experimental ratio and C/T shows the Final/Trend ratio).
The C/T option is disabled when the Validation plots window is
opened from the menu or Toolbar. The use of this option is
described in the Analysis section. From EASY-2007 the cross
section analysis feature discussed later enables trend lines to be
stored, and these can also be used for validation. Check one or
more of the Final state options (more than one final state
results in multiple graphs) and the required energy. An
additional feature from EASY-2005 is the ability to produce
C/S plots at 20 MeV for some reactions. Note that if the
Include summed data with Total check box is ticked then
comparison is made with experimental data for the total cross
section and the sum of all final states for split reactions. These
summed reactions are not actually present in the Final database.
Clicking the Plot button displays the Validation plot window
shown in Figure 133.
Figure 132. Validation plots window.
Figure 133 shows the C/E data plotted as a histogram. In order
to see which reactions are responsible for the scatter about the
ideal value of 1.0, click on the graph at a vertex of the
histogram and the Validation data window shown in Figure
134 is displayed. This shows the reactions that have C/E values
in the selected range. Select a reaction and the data from Final
(for summed data the reactions are not in Final) and for the
experiment (or from systematics) are displayed. The exact C/E
value is also shown. This is necessary because the summary
CCFE Fusion
User manual: Issue 8, March 2010
SAFEPAQ-II
119
data are for energies of 25.3 meV, 30 keV, 14.5 MeV and 20
MeV. If the experimental data are not exactly at these energies,
then the exact C/E (calculated using interpolation where
necessary) may differ from the value shown in the list box. The
thickness of the histogram line can be altered by clicking on the
Options|Thick lines menu item (this option has been selected
in Figure 133).
Figure 133. Validation plot window.
User manual: Issue 8, March 2010
CCFE Fusion
120
SAFEPAQ-II
Figure 134. Validation data window.
Figure 134 can be used to investigate reactions with discrepant
C/E values. Clicking the Visualisation button copies the
selected reaction’s data to the Cache (if these are not already
present) and displays the Targets and sources window
(Figure 67) with the appropriate target and reaction selected. It
is then possible to plot the data in the normal manner.
Clicking the Experimental data button will open the
appropriate Experimental data window (Figure 30 - Figure
35) and select the correct target. It is then possible to either
change which experimental data are used or to add another
entry.
Clicking the View pre-modifications button will open the
Preliminary modifications window (Figure 111) so that these
can be checked. Because it is likely that no pre-modifications
exist for the reaction, no attempt is made to select the correct
reaction.
Clicking the View modifications button will open the
Modifications window (Figure 120) so that these can be
checked. Because it is possible that no modifications exist for
the reaction, no attempt is made to select the correct reaction.
The Quality score for the reaction is shown and it is possible to
print or copy to the clipboard all the listed reactions by clicking
the Print or Copy buttons respectively.
CCFE Fusion
User manual: Issue 8, March 2010
SAFEPAQ-II
121
If the C/S option is selected in Figure 132 then addition options
are shown. It is possible to select reactions by their Quality
score, in the Scores group either All Scores, those reactions
with Score = 0 or > 0 can be selected by the radio buttons. If
reactions with Scores = 0 or > 0 are selected then the title in
Figure 133 will show this. Next to the C/S radio button is
shown the check box As C/E. If this is checked then only those
reactions that have experimental data are included in the C/S
plot.
If the C/S option is selected in Figure 132 then in Figure 134
there will be an additional button shown once a reaction is
selected. This Exclude button allows particular reactions to be
excluded from the analysis. Information on excluded reactions
is stored in the ValidationExcluded file in the ascii folder.
If the selected reaction has been excluded then the button
changes to become the Include button, so allowing the reaction
to be included again in the analysis. In the Validation plot
window (Figure 133) the list of excluded reactions can be
managed by clicking the Options|Include all reactions menu
item to remove all entries from the file, by clicking the
Options|Save excluded reactions menu item to save to the
file the current selection and by clicking Options|Load
excluded reactions menu item to load from the file the saved
selection.
In Figure 133 it is possible to print or copy the plot to the
clipboard by clicking the File|Print or Edit|Copy menu items
respectively.
Returning to Figure 132, the second type of plot, that of C/E or
C/S as a function of target mass (A) can be made by selecting
the x/y plot, x axis Mass (A) radio button. Select the other
options as in the case of a histogram, then click the Plot button
to display the Validation plot (A) window shown in Figure
135.
Figure 135 shows the C/E data plotted as a function of atomic
mass. In order to identify the various points click on one to see
details presented in the status bar of the main window. It is
possible to print or copy the plot to the clipboard by clicking
the File|Print or Edit|Copy menu items respectively. The
appearance of the graph can be altered; clicking the Options|Y
axis menu item displays a submenu with five entries allowing
the y axis range to be selected. In Figure 135 the option E-1 –
E1 has been checked. Clicking the Options|X axis menu item
displays a submenu with three entries allowing the x axis range
to be selected. In Figure 135 the option 0 - 250 has been
checked.
User manual: Issue 8, March 2010
CCFE Fusion
122
SAFEPAQ-II
Figure 135. Validation plot (A) window.
Returning to Figure 132, the third type of plot, that of C/E or
C/S as a function of the absolute value of Q-value can be made
by selecting the x/y plot, x axis Q-value radio button. Select
the other options as in the case of a histogram, then clicking the
Plot button displays the Validation plot (Q) window shown in
Figure 136.
Figure 136 shows the C/E data plotted as a function of the
absolute value of the Q-value. In order to identify the various
points click on one to see details presented in the status bar of
the main window. It is possible to print or copy the plot to the
clipboard by clicking the File|Print or Edit|Copy menu items
respectively. The appearance of the graph can be altered;
clicking the Options|Y axis menu item displays a submenu
with five entries allowing the y axis range to be selected. In
Figure 136 the option E-1 – E1 has been checked. Clicking the
Options|X axis menu item displays a submenu with five
entries allowing the x axis range to be selected. In Figure 136
the option 0 – 15 MeV has been checked.
CCFE Fusion
User manual: Issue 8, March 2010
SAFEPAQ-II
123
Figure 136. Validation plot (Q) window.
The discussion above on validation plots is concerned with data
in the current EAF project. However, it is also useful to be able
to view the validation plots for the various data sources,
especially if the library covers a ‘complete’ set of reactions.
This feature was introduced for EASY-2005. To use it a source
library is selected by clicking on the Libraries|Select Source
library for validation… menu item which displays the Select
Source library window shown in Figure 137.
Figure 137. Select Source library window.
Selecting the required source and clicking the Select button
causes the Libraries|Generate summary for <Source>
library menu item to be enabled. Clicking this will generate
summary data for the selected source. This is a similar process
to generating summary data for Final discussed on page 116.
This can be time consumming for large source libraries.
User manual: Issue 8, March 2010
CCFE Fusion
124
SAFEPAQ-II
Once the summary for the source has been generated the
Libraries|Validation plots… menu item is enabled. Clicking
this displays the Validation plots - <Source> window which
is identical to Figure 132 except that the source name is
displayed in the title bar. The discussion given above for the
various graphs plotted using Final data is relevant for source
data, the only differences are that the titles of the graphs show
the data source being used.
At some point prior to opening the REPORT window, and
following the production of the Final database it is necessary to
click on the Reaction data|Set nuclides as targets menu
item. This will note which of the nuclides have cross section
data and enter this into the NucSummary table in the Parameter
database.
In SYMPAL one of the main pieces of documentation produced
was the REPORT file. This was a large printed book
summarising all the EAF data. It is judged that because of the
highly interactive nature of SAFEPAQ-II, such a printed
volume is of less interest. Rather, it is possible to view the same
summary of data in a similar format as previously, but for a
single reaction at a time. Clicking the Reaction
data|REPORT… menu item or the twenty-ninth toolbar
button displays the REPORT window shown in Figure 138.
Select a target in the first list box and the reactions for that
target are shown in the second list box. Clicking a reaction
shows a summary of the reaction in the data grid. Data for all
final states and their sum are displayed. Values from Final, the
experimental data and systematics are displayed. The
modification history for each final state is shown in the History
box. Data for the reaction can be printed to the default printer
by clicking the Print button. Although in the future it may be
implemented, there is currently no facility to print out the whole
REPORT file.
CCFE Fusion
User manual: Issue 8, March 2010
SAFEPAQ-II
125
Figure 138. The REPORT window.
The tasks that now remain are to write out the Final data in
EAF format. Clicking the Reaction data|Write EAF
files|Write EAF_GXS files… submenu item displays the
Write EAF_GXS files window shown in Figure 139. At the
beginning of each EAF group file there is a 16 line header
giving information about the library. The header for each group
file can be created or modified in this window. Select the
required Group file type radio button and then save the header
by clicking the Save header button. The headers are stored in
the ascii folder on the disk shown in the Source database
disk text box in the Settings window (Figure 1). Clicking the
Write all GXS files button will create the files in the folder
cross section on the Source database disk, and Cross
section data folder specified in the Settings window (Figure
1). The files have names such as eaf_gxs_175V indicating the
group structure and weighting (this takes about 2 hours).
User manual: Issue 8, March 2010
CCFE Fusion
126
SAFEPAQ-II
Figure 139. The Write EAF_GXS files window.
Clicking the Reaction data|Documentation menu item
displays a submenu with two items. Clicking Reaction list
generates a list of reactions in a readable form. A new feature
introduced for EAF-2003 was the flagging of reactions that
have changed since the previous EAF library. In order to do this
it is necessary to have information on the previous library, this
is obtained from the External database defined for Compare
(see Figure 175). To check that the correct database is open the
confirmation dialog shown in Figure 140 is displayed. If the
External folder is correct then click the Yes button to continue,
if not then Click the No button and create a new Compare
database (see Figure 175). Note that the comparison means that
this operation now takes longer (about 3 minutes) than in
previous versions.
Figure 140. The confirmation dialog prior to writing the reaction list.
CCFE Fusion
User manual: Issue 8, March 2010
SAFEPAQ-II
127
For libraries such as the EAF-2007 proton-induced one which
have no previous version, there is the option of producing a
simpler form of reaction list. If the database compare.mdb is
not present in the Safepaq_2_ folder then the dialog shown in
Figure 141 is displayed. This enables the database to be
generated or the reaction list to be produced with no flagging.
Figure 141. The confirmation dialog if compare.mdb is missing.
The file (reaction_list) contains the source, modification
history (using the Mod types shown in Table 2, the Quality
score (see Table 4) and the number of data points. Clicking
Source table generates a table of numbers of reactions with
given MT values that are taken from the various sources
(source_table). Both these files are located in the Documents
folder on the disk shown in the Source database disk text
box in the Settings window (Figure 1). These can be used in
the production of the EAF report.
Clicking the Reaction data|Write EAF files|Write EAF_XS
file submenu item creates the file eaf_xs in the folder cross
section on the Source database disk, and Cross section
data folder specified in the Settings window (Figure 1), this
takes about 14 h. Note that in order to increase the precision of
the energy and cross section values, data can be written in the
ENDF scientific format. The eleven character wide field is
written as ‘ 0.000000+0’ rather than ‘ 0.0000E+00’. Although
such a format cannot be read by a standard FORTRAN format
statement, there are special routines to do it. This option is set
by ticking the ENDF scientific format check box in the
Settings window (Figure 1).
Clicking the Reaction data|Write EAF files|Write EAF_UN
file submenu item creates the file eaf_un in the folder cross
section on the Source database disk, and Cross section
data folder specified in the Settings window (Figure 1), this
takes about 6 minutes.
Some additional information on reaction properties can be
found on the Tools menu. Clicking the Tools|Final
uncertainties… menu item displays the Final uncertainties
User manual: Issue 8, March 2010
CCFE Fusion
128
SAFEPAQ-II
window shown in Figure 142. Choose a reaction type from the
dropdown list and the unceratinty information in the final
database for each reaction is shown in the grid. The selected
reactions can be copied to the clipboard or printed to the default
printer by clicking the Copy or Print buttons respectively. The
window can be closed by clicking the Close button.
Figure 142. The Final uncertainties window.
It is sometimes useful to be able to show all reactions that
produce a particular nuclide. Clicking the Tools|Reactions for
daughter… menu item displays the Reactins to daughter
window shown in Figure 143. Enter a nuclide in the Daughter
textbox, use g, m, n if there is more that one isomeric state for
the nuclide. Clicking the Get reactions button shows the
reactions and the final state in the list box. Selecting a single
reaction enables it to be copied to the clipboard or printed to the
default printer by clicking the Copy or Print buttons
respectively.
Figure 143. The Reactions to daughter window.
CCFE Fusion
User manual: Issue 8, March 2010
SAFEPAQ-II
129
If all the reactions in the listbox need to be printed then this can
be done by clicking the Print All button. The window can be
closed by clicking the Close button.
Analysis
The data in both the Final database and in the various Data
sources are so extensive that a statistical analysis can reveal
underlying trends and pinpoint reactions for improvement. This
approach is similar to that carried out to produce the
systematics; the main difference is that for the systematics
experimental data were considered while for the present
analysis library data are used.
It is expected that properties such as the maximum of an
excitation function and the energy at which the maximum
occurs should be reasonably smooth functions of A, Z and the
asymmetry parameter (s). Plotting these and also cross sections
at particular energies against say A will give scatter plots that
can have trend lines displayed. A full description of this
Statistical Analysis of Cross Sections (SACS) is given in
reference 14.
To use these tools click on the Tools|Cross section
analysis… menu item to display the Cross section analysis
window shown in Figure 144. Select the source of data (either
Final, a Data source or Experimental data) in the first dropdown
list and then select a reaction type from the second. For
reactions such as (n,2n) which have a threshold then the Min
energy textbox can be left as 0, but for say (n,p) reactions a
value of 1.00E+06 eV would be appropriate (this ensures that
only data above the Min energy value are considered when
finding the maximum cross section.
Information on the Quality Scores are also extracted from the
databases; since for split reactions the scores can be different it
is necessary to specify how the score of the total cross section is
calculated. There are two options: if one of the final states has a
Score = 0 then the total has Score = 0 and if one of the final
states is > 0 then the total has a score which is the maximum of
all the final states. One of these options is selected in the Split
Score group; Min: {s,0}=0 selects the first option and Max:
{s,0}=s selects the second.
If information on the width of the excitation curve are required
(additional time is required to find these data) then check the
Include width data option which enables the Width at
maximum radio button. The width refers to the width of the
excitation curve at half the maximum cross section value.
User manual: Issue 8, March 2010
CCFE Fusion
130
SAFEPAQ-II
Figure 144. The Cross section analysis window.
By default the Maximum cross section radio button is
selected in the y-axis group, and any of the first five options
actually causes the data for all five options to be collected; this
process is quite time consumming and may take several
minutes. Selecting any of the remaining options causes data at
the specified energy to be collected; this is typically much
quicker. Note that if one of the Cross section at <energy>
options is chosen then the label of the Min energy textbox
changes to Delta energy, referring to the interval about the
specified energy that is used to average data. This is important
in cases where no data point exists at the specified energy.
By default the Mass (A) radio button in the x-axis group is
selected. If the Maximum cross section radio button is
selected in the y-axis group then the 2nd reaction group is
enabled and data for the selected reaction are added to the
primary reaction. This is important in the case of (n,2n) where
at high target mass it is appropriate to be able to consider the
sum of (n,2n) and (n,f) so that the scatter can be reduced.
Clicking the Plot button will cause the data to be collected from
the database, a message in the Main window status bar reminds
the user that this process can be time consumming. Having
collected the data then the Analysis graph window shown in
Figure 145 is opened and the data displayed. Note that the
number of data points are displayed in the Main window status
bar. The menu bar in the Analysis graph window allows the
CCFE Fusion
User manual: Issue 8, March 2010
SAFEPAQ-II
131
graph to be customised as required. Clicking the Options|Axis
scale… menu item displays the Axis scale window (Figure
89) where the axis ranges on the x- and y-axes can be changed.
Options|Distinguish
Even/Odd
or
Clicking
the
Options|Distinguish Even/Odd Z menu items will show the
various Even and Odd combinations of Z and N for the targets
in various colours and affords another method of spotting
trends. Clicking the Options|Distinguish Importance menu
item will indicate if the reaction is included in the list of
important reactions given in reference 15 (analysis carried out
with EASY-2003) or the more recent (as yet unpublished)
EASY-2007 by the use of two colours. Note that there are menu
items
(Options|Importance
from|EASY-2003
and
Options|Importance from|EASY-2007) to select one of these
two options. Clicking the Options|Importance from|EASY2007 option enables the Options|Importance values used
submenu which gives eight options to select various values of
the importance. Clicking the Options|Distinguish Scores
menu item will indicate whether the reactions have Quality
Score > or = 0 by the use of two colours. Clicking the
Options|Distinguish Threshold reactions menu item will
indicate whether the reactions have a threshold or not by the use
of two colours (Note that this option is only appropriate for
certain classes of reactions such as (n,p)). These five menu
items act as toggles and the ticks indicates which option is
selected. Note that only one of them can be applied at any time,
selecting one will disable the other options.
If a point is clicked with the right mouse button then it can be
excluded from the display. If the Options|Allow symbol
change menu item is checked then it is possible to show
particular points as a red triangle (instead of the usual blue
circle) so allowing particular points to be identified when the
graph is copied to an external document. This can be done by
clicking the point with the middle mouse button or by clicking
the Options|Change symbol for nuclide… menu item which
displays a small dialog shown in Figure 146 which enables a
target nuclide to be entered.
User manual: Issue 8, March 2010
CCFE Fusion
132
SAFEPAQ-II
Figure 145. The Analysis graph window.
Figure 146. The Change symbol for nuclide window.
Clicking the OK button will change the symbol and clicking the
Close button will close the window. By default the data are
plotted in colour as shown in Figure 145, by clearing the tick on
the Options|Colour menu item, data are shown in black
symbols which may be more appropiate for a black and white
printer. If the one of the Options|Distinguish <something>
menu items is ticked then the position of the legend on the
graph can be altered by selecting one of the options (Top or
Bottom) on the Options|Legend submenu.
The graph is ‘Hot’, clicking with the mouse on one of the data
points shows the identity and details of the reaction in the main
window status bar. The text is of the form ‘Data for B-11(n,2n)B10: x=0.09,y=6.5973E-02 In,S=2’, the reactions is shown followed
by the x and y values. ‘In’ means that the data point is included
and ‘S’ refers to the reaction’s Quality score. A trend line can
be added to the graph (as shown in Figure 145) by means of a
least squares line of best-fit. Clicking the Options|Trend line
menu item displays or clears the line. Two types of fit can be
used. Checking the Options|Curve type|Power menu item
CCFE Fusion
User manual: Issue 8, March 2010
SAFEPAQ-II
133
causes the functional form shown in equation 4 to be used for
the trend curve.
σ = 10 α + β x + γx
2
+δ x 3
(4)
Checking the Options|Curve type|Logarithmic menu item
causes the functional form shown in equation 5 to be used for
the trend curve. In equations 4 and 5 x can be A, Z or s.
σ = Ax B
(5)
The order (1, 2 or 3) of the polynomial used for the fitting in
equation 4 can be chosen from the Options|Curve order
submenu. If the curve order is 1 then γ and δ are 0, if 2 then δ is
0, and if 3 then all of α, β, γ, δ are non-zero. Note that if a
Logarithmic curve is chosen then the Options|Curve order
menu item is disabled.
The trend line can be displayed as a thick or thin line depending
on whether the Options|Draw lines thick menu item is
checked or cleared. The form of the equation can be displayed
in the Main window status bar by clicking the Options|Display
equation menu item. A trend line can be stored by clicking the
Options|Store trend menu item, this trend can then be used in
the Validation plots window (Figure 149).
At the present time details for a large subset of the reactions
and trend curve options can be stored. σmax(A) and σmax(s)
trends for the Logarithmic curve can be stored for the reaction
types: (n,2n), (n,3n), (n,4n), (n,p), (n,d), (n,t), (n,h) and (n,α).
Trends for the same reactions for the Power curve can be
stored, for any of the Curve order options and for any of the
eleven y-axis options, not just σmax. Values of the coefficients
in the fit equations are stored in an XML file (see Appendix 2
for further details).
In addition to the trend lines which are fitted to the data points
it is possible to define a custom line which can either be a trend
line fitted with various options and then saved or a curve
defined by the user. Clicking the Options|Define custom
line… menu item opens the Custom Line window shown in
Figure 147. Choose the form of the equation of the line by
clicking one of the three radio buttons and then add the
coefficients in one of the text boxes (that will have a white
background). Clicking the Details button will enable
information about the curve to be entered in the first textbox;
the buttons are changed so that it possible only to Store or
Cancel these details. Alternatively a previously saved curve
can be selected from the dropdown list. Clicking OK will
User manual: Issue 8, March 2010
CCFE Fusion
134
SAFEPAQ-II
display this curve (in green) on the Analysis graph. If the
custom line is not required then it can be removed by clicking
on the Options|Custom Line menu item to remove the check.
Note that this option is only enabled once a custom line is
defined.
Figure 147. The Custom Line window.
It is possible to exclude various points. The Options|Plotted
points submenu shows a series of options. By default
Options|Plotted points|All is checked and all the points are
shown. If Options|Plotted points|Not excluded is checked
then any of the options listed below that are checked are not
plotted. Checking Options|Plotted points|Exclude actinides
ensures that all reactions where the target has Z > 85 are
excluded. Checking Options|Plotted points|Exclude A < 20
ensures that all reactions where the target has A < 20 are
excluded. Checking Options|Plotted points|Exclude A < 40
ensures that all reactions where the target has A < 40 are
excluded. Checking Options|Plotted points|Exclude Z even
ensures that all reactions where the target has even values of Z
are excluded. Checking Options|Plotted points|Exclude Z
odd ensures that all reactions where the target has odd values
of Z are excluded. Checking Options|Plotted points|Exclude
Scores = 0 ensures that all reactions that have a Quality Score
of 0 are excluded. Checking Options|Plotted points|Exclude
Scores > 0 ensures that all reactions that have a Quality Score
> 0 are excluded. Checking Options|Plotted points|Exclude
Unimportant ensures that all reactions that are not in the list of
important reactions are excluded. Checking Options|Plotted
points|Exclude Important ensures that all reactions that are in
the list of important reactions are excluded. Checking
Options|Plotted points|Exclude Non-threshold ensures that
all reactions that do not have a threshold are excluded.
Checking Options|Plotted points|Exclude Threshold
ensures that all reactions that have a threshold are excluded.
CCFE Fusion
User manual: Issue 8, March 2010
SAFEPAQ-II
135
It is possible to return to the cases where all points are plotted
by clicking the Options|Plotted points|Reset, none
excluded menu item, and all points can be plotted with the
standard symbol by clicking the Options|Plotted points|
Reset, standard symbols menu item. When the graph is
redrawn the actual number of points plotted is shown in the
Main window status bar.
Once a trend line is shown then the Options|Reaction
details… menu item is enabled. Clicking this displays the
Reaction details window shown in Figure 148. The type of
reaction and the data source are shown on the window title bar.
By default all the reactions are listed, sorted by the ZA value of
the target. By selecting one of the > Factor <n> radio buttons
only a subset of the reactions significantly far from the trend
line are listed. Note that it is possible to sort the data by any of
the column values, clicking on the appropriate column heading
will order the data in ascending order, a second click on the
heading reverses the order showing it as descending.
Figure 148. The Reaction details window.
If points have been excluded in the plot then they can also be
excluded from the Reaction details window. Clicking the As
graph option in the Exclude group and then clicking the Get
reactions button shows the reduced list. So long as the All
reactions option is selected then two Confidence intervals are
displayed. In Figure 148 these show that 68% of the points are
User manual: Issue 8, March 2010
CCFE Fusion
136
SAFEPAQ-II
within a factor of 1.41 of the trend line and 95.5% are within a
factor 3.76.
The selected items in the grid can be copied to the clipboard by
clicking the Copy button. The entire listing can be printed to
the default printer by clicking the Print button. The window can
be closed by clicking the Close button.
Returning to the Analysis graph window (Figure 145);
clicking the Edit|Copy menu item places the graph on the
clipboard. Clicking the Edit|Copy coefficients menu item
copies the Trend line coefficients onto the clipboard using 4
decimal places. This gives a higher accuracy than in the Main
window status bar and is useful if the equation is to be used for
other studies. There are two additional options on the Edit
menu related to the custom lines discussed above. Clicking the
Edit|Remove current custom line menu item removes details
of the current line so that another has to be defined. Clicking
the Edit|Remove all custom lines menu item details of all the
stored custom lines. The Plot menu item allows the graph to be
redrawn.
In the earlier discussion of validation plots, the option of
producing C/T plots was mentioned in the Validation plots
window (Figure 132). These can only be produced by opening
an extended version of the window. Clicking the Validation…
button displays the extended version of the Validation plots
window (Figure 149). It will be noted that the C/T type option
is selected by default and that three additional sets of options
are available: the variable on the C/T axis (either A or s), the
Trend type (Log or Power) and the Score values.
Figure 149. Validation plots (extended) window.
Note that it is not possible to change the Graph type, the
Energy or the Final state. The choice of Reaction, C/T axis
CCFE Fusion
User manual: Issue 8, March 2010
SAFEPAQ-II
137
and Trend type are determined by the type of Analysis chosen
in the Cross section analysis and Analysis graph windows.
Clicking the Plot button displays the Validation plot window
shown in Figure 150. The title shows the various options
chosen. The items on the Options menu are as described for
Figure 134.
The graph can be printed to the default printer by clicking the
File|Print menu item, and the window can be closed by clicking
the File|Close menu item. Note that if the Cross section
analysis window is closed while the other two are still open
then they are automatically closed as well.
Changing the various options in the Cross section analysis
window and then clicking the Plot button will typically quickly
refresh both the Analysis graph and Reaction details
windows if they are open. However, if a different reaction
source or type is chosen then a lengthy collection process will
be needed before the graph is redrawn.
Figure 150. Validation plot (C/T) window.
A new feature for analysis developed during the production of
EAF-2010 is the ability to produce cross section curves for
threshold reactions based on the fits in the Analysis tool. To do
this click on the Tools|Generate cross section data… menu
item, this opens the Generate cross section data window
shown in Figure 151. Fill in details of the reaction type from the
User manual: Issue 8, March 2010
CCFE Fusion
138
SAFEPAQ-II
dropdown list and the reaction target in the text box. Clicking
the Calculate button will fill in all the fitted parameters from
the Analysis tool if these have already been stored. In cases
where these are not available then the warning dialog shown in
Figure 152 is displayed, the missing data labels are shown in
red and the graph is not plotted. So long as all the fitted data are
available then a graph is shown using the selected Fitting
options. By default 1 is selected, click one of the other radio
buttons and clicking the Calculate button will display a
different cross section curve. The Parametric data points are
shown by red squares in the graph and refer to:
Eth – Energy of the threshold
Em – Energy at which the cross section maximum (σm) occurs
E− and E+ – Energies defined from the Skewness parameter (k)
and the width at half-maximum (∆½).
∆½ = E+ − E−
k = (E+ + E−− Em) / (E+ + E−)
E20 = 20 MeV
E30 = 30 MeV
E60 = 60 MeV
Note that in Figure 151 these are shown as Eth, Em, max, E-,
E+, E20, E30, E60 respectively. P3, and P4 refer to third and
fourth order polynomial fits and Exp to an exponental fit.
Figure 151. The Generate cross section data window.
CCFE Fusion
User manual: Issue 8, March 2010
SAFEPAQ-II
139
Figure 152. Warning that trend line information is missing.
Clicking the Copy to Cache button will copy the plotted curve
to Cache using the data source label Generated_n where n is
the number of the selected fitting option. Clicking the Close
button closes the window. Note that in some cases the selected
fitting options can give an extremely unphysical curve.
The importance of reactions has been mentioned several times
in the description of the Analysis tool. Further information
about both the important nuclides and reactions can be found by
clicking on the Tools|FISPACT|Importance summaries…
menu item which displays the Importance summaries
window shown in Figure 153. By default this shows the
Primary nuclides from the EASY-2007 analysis. If there are
results from a new analysis to read in then (in the case of
nuclides) click the Read nuclides button to read from the
ImportanceSummary1.txt file which was generated by a series
of FISPACT calculations. The left hand list box shows the
Primary nuclides (there are 447 of them for EASY-2007).
Selecting the Secondary radio button will instead show the
Secondary nuclides. Selecting a nuclide in the left hand list box
will display the Elements for which this is a primary nuclide in
the right hand list box, for Be-7 there are five elements.
Figure 153. Importance summaries window (Nuclides).
User manual: Issue 8, March 2010
CCFE Fusion
140
SAFEPAQ-II
Selecting the Reactions radio button will display the important
reactions as shown in Figure 154. If none of the check boxes in
the Reactions group are selected then all the important
reactions are shown in the left hand list box (there are 5096 of
them for EASY-2007). Checking the Target check box allows
an element to be selected from the dropdown list and then the
left hand list box only shows those reactions with the selected
element as the target. Checking the Reaction check box allows
a reaction type to be selected from the dropdown list and then
the left hand list box only shows those reactions with the
selected reaction type. Checking the Importance check box
allows an importance (1 – 5 or Major (= 4 or 5)) to be selected
from the dropdown list and then the left hand list box only
shows those reactions with the selected importance. Selecting a
reaction shows the Primary daughter nuclides that are produced
by the reaction in the right hand list box. Results from a new
analysis can be read in by clicking the Read reactions button
from the ImportanceSummary2.txt file which was generated
by a series of FISPACT calculations.
Moving the mouse over either of the Copy or Print buttons
displays a ToolTip stating that clicking the button will
Copy/Print the contents of the left hand list box while clicking
the button with the Shift key pressed will Copy/Print the
contents of the right hand list box. Clicking the Close button
closes the window.
Figure 154. Importance summaries window (Reactions).
Information about the Quality scores and importance of
reactions can be obtained by clicking on the
Tools|FISPACT|Reaction statistics… menu item which
displays the Reaction statistics window shown in Figure 155.
Select a Quality score from the Score dropdown list (1 – 6 and
CCFE Fusion
User manual: Issue 8, March 2010
SAFEPAQ-II
141
various combinations) and an Importance from the Importance
dropdown list (1 – 5 and various combinations) and the
statistics are shown in a Venn diagram. Clicking on any of the
numbers will show the number with a border and the details of
all the relevant reactions in the list box. The contents of the list
box can be copied to the clipboard or printed to the default
printer by clicking the Copy or Print buttons respectively.
Clicking the Close button closes the window.
Figure 155. Reaction statistics window.
Information about the Dominant nuclides can be obtained by
clicking on the Tools|FISPACT|Dominant nuclides… menu
item which displays the Dominant nuclides window shown in
Figure 156. The nuclides shown are selected by one of the
Nuclides radio buttons.
The nuclides displayed can be from all data sources or a specific
one, this can be changed this by selecting one of the Original
source radio buttons. It is also possible to order the nuclides
not just by ZA, but also by the quantity ∆Q. This quantity is a
measure of the goodness of the evaluation and is the difference
between two methods of calculating the Q-value of the decay,
large values indicate nuclides that should be re-evaluated.
Values of 100% are typical from NUBASE where no gamma
lines are included in the file. Clicking the Comments button
shows the comment lines at the beginning of the evaluated file.
User manual: Issue 8, March 2010
CCFE Fusion
SAFEPAQ-II
142
The contents of the list box can be copied to the clipboard or
printed to the default printer by clicking the Copy or Print
buttons respectively. Clicking the Close button closes the
window.
Figure 156. Dominant nuclides window
Miscellaneous tools
It is often useful to know the Q-value for a reaction. Clicking
on the Tools|Calculate Q-value… menu item displays the
Calculate Q-value window shown in Figure 157. Enter the
target in the text box and select the reaction from the dropdown
list. Clicking the Calculate button displays the Q-value, the
threshold and also the target neutron (Sn) and proton (Sp)
separation energies.
Figure 157. The Calculate Q-value window.
If the All targets button is clicked then the confirmation dialog
shown in Figure 158 opens where the location of the file (in this
case Q_n2n in the ascii folder) is shown. Clicking the OK
button will write the four values for each of the reactions of the
CCFE Fusion
User manual: Issue 8, March 2010
SAFEPAQ-II
143
selected type to the file. The window is closed by clicking the
Close button.
Figure 158. The Calculate Q-value confirmation dialog.
Systematic formulae are used for many purposes in SAFEPAQII. Details of these are available in the EASY documentation
[10]. The values used for the various reactions and energies can
be seen by clicking on the Tools|Calculate systematics…
menu item, this displays the Calculate systematics window
shown in Figure 159. Enter the target in the text box and select
the reaction from the dropdown list. Clicking the Calculate
button displays the available systematics values. Depending on
the reaction type, systematics at one, two or three energies are
displayed. By default the standard sytematics formulae are
used, but if the Experimental data|Systematics|Alternate
submenu item is checked then the alternate set of formulae are
used in the calculations. The window is closed by clicking the
Close button.
If the reaction chosen is (n,n′) then the window has additional
options as shown in Figure 160. Only the 3 MeV value is
shown (instead of the standard 30 keV value), and the final
state of the daughter must be chosen in the Final state group
by selecting one of the g, m or n radio buttons.
Figure 159. The Calculate systematics window.
User manual: Issue 8, March 2010
CCFE Fusion
144
SAFEPAQ-II
Figure 160. The Calculate systematics window for (n,n′) reaction.
While working with SAFEPAQ-II it is often useful to be able to
find the atomic number (Z) for particular elements. This can be
found by clicking on the Tools|View elements… menu item
that displays the Elements window shown in Figure 161. This
shows Z and the chemical symbol for each element. The name
corresponding to the symbol can be seen by selecting an
element and the name is shown in a ToolTip. The window is
closed by clicking the Close button.
Figure 161. The Elements window.
The type of reaction is shown in ENDF files by means of the
MT value. A list of MT numbers can be seen by clicking on the
CCFE Fusion
User manual: Issue 8, March 2010
SAFEPAQ-II
145
Tools|View MT numbers… menu item that displays the MT
numbers window shown in Figure 162. This shows MT and
the conventional symbol for each reaction. The standard ENDF
MT numbers appear above the dividing line, those below are
non-standard ones defined in EASY for extended energy
libraries. The window is closed by clicking the Close button.
Figure 162. The MT numbers window.
The Mod types of the various modifications are shown in Table
2. A list of the Mod types can be seen by clicking on the
Tools|View Modification types… menu item that displays the
Modification types window shown in Figure 163. This shows
the Mod types and the corresponding action and Specification
for each modification. The window is closed by clicking the
Close button.
User manual: Issue 8, March 2010
CCFE Fusion
146
SAFEPAQ-II
Figure 163. The Modification types window.
It has been found that due to changes in decay data that the
isomeric state of a target nuclide can need to be changed. As an
example in EAF-2007, Ir-194m was long-lived while Ir-194n
was short-lived. For EAF-2010 the new decay data reverses
these two isomers and now In-194n requires cross section data.
Unfortunately no data sources have cross section data for this
target. By clicking on the Tools|Change target isomeric
state… menu item that displays the Change target isomeric
state window shown in shown in Figure 164 it is possible to
specify the target nuclide in the text box and the old and new
isomeric states in the dropdown list. Clicking the Change
button will make the necessary changes in the Parameter,
Master and Final databases.
Figure 164. The Change target isomeric state window.
If SAFEPAQ-II crashes during data entry it is possible that the
Final database can be left in a damaged state. Typically there is
an entry for a reaction in the Parameter database, but this is
missing in Final. This means that it is not possible just to add
the reaction (using Figure 102) and the reaction is not present
when using Single reaction processing (Figure 124). To correct
this situation click on the Tools|Repair Final… menu item to
display the Repair Final window shown in Figure 165.
CCFE Fusion
User manual: Issue 8, March 2010
SAFEPAQ-II
147
Figure 165. The Repair Final window.
Clicking the Get reactions button displays any reactions
missing from Final but present in Parameter in the list box.
Clicking on a reaction displays a message describing which
tables the reaction is missing from and where possible showing
the number of data points and interpolation ranges in the text
boxes. Clicking the Repair button will add the reaction details
back into the Final database tables using data from Master.
There is now an entry for the reaction, but the actual data may
not be correct, a warning dialog box informs the user that the
data should be corrected using the Single reaction processing
window (Figure 124). The window is closed by clicking the
Close button.
If SAFEPAQ-II crashes it is possible that one of the Access
databases can be damaged. If this happens then during use of
SAFEPAQ-II an error message will be displayed stating that the
file is not in database format when the application tries to open
the damaged database. It is usually possible to repair such
damage and return the database to a usable state. To do this
click on the Tools|Repair databases… menu item to display
the Repair databases window shown in Figure 166. Select
the database to be repaired and click the Repair button. Note
that since moving to VB.NET repairing is actually the same as
compacting a database.
User manual: Issue 8, March 2010
CCFE Fusion
148
SAFEPAQ-II
Figure 166. The Repair databases window.
As SAFEPAQ-II is developed new features are added. In most
cases this means that the SQL queries in the various databases
are either amended or new ones added. It follows that if an old
database is used with the current version of SAFEPAQ-II then
it can crash because the code calls non-existent queries. This
can be corrected by importing the new or modified queries into
the old database. There can be many such changes, so this
process is automated by clicking on the Tools|Update
databases… menu item to display the Update databases
window shown in Figure 167.
Figure 167. The Update databases window.
Click the browse button (…) to display the Open dialog and
select one of the databases in the folder containing the
SAFEPAQ-II databases needing to be updated. The folder name
is displayed in the text box. Depending on the SAFEPAQ-II
version only some of the databases need to be updated, these
are shown with the check boxes enabled. Select the ones
required (usually select all possible) and click the Update
button. This adds all the new queries to the selected databases.
CCFE Fusion
User manual: Issue 8, March 2010
SAFEPAQ-II
149
Sometimes the various source databases need to be similarly
updated. This can be done by ticking the All Source
databases check box in the lower part of the window. Note
that even if only the source databases need to be updated it is
still necessary to select a database folder (ensure that none of
the database check boxes are ticked). The window is closed by
clicking the Close button.
SAFEPAQ-II is primarly designed as a means of producing
EAF data libraries in standard text formats (such as the
modified ENDF format known as the EAF format). However,
for some applications there is a need to be able to write data as
XML files. Clicking the Tools|Write library as XML menu
item writes a file containing subsets of the decay and cross
section data to a file named eaf_xml located in the Cross
section data folder.
SAFEPAQ-II is a Windows application and therefore tends to
work with Windows style files. However, files are available
from various sources and it may be that all the files in a folder
are actually in UNIX style (the differences relate to the
character(s) delimiting the end of each line). In such a case it is
necessary to convert them from one style to the other. While
this is easy using standard tools if there are only a few files, in
cases where there are many (such as a single files for each
target in an evaluated library) the standard tools can be very
time consuming. Clicking the Tools|Convert UNIX/PC type
files… menu item to display the Convert UNIX/PC file types
window shown in Figure 168. Clicking the Browse (…) button
to open the Browse For Folder dialog where the folder
containing the files for conversion can be selected. Choose how
the files are to be converted by selcting one of the radio button
options and then click the Convert button to do the conversion.
The window is closed by clicking the Close button.
Figure 168. The Convert UNIX/PC file types window.
SAFEPAQ-II is continually improved with new features and
errors in the coding corrected. This is reflected in the Version
number displayed in the About SAFEPAQ-II window (Figure
User manual: Issue 8, March 2010
CCFE Fusion
150
SAFEPAQ-II
8). Keeping track of bugs and requests for new features is
important and a feature to do this has been added for EASY2007. In addition other parts of EASY also need to have bugs
and new features recorded. This feature is only available for the
developer of the code system (R.A. Forrest). Another Access
database (Helpdesk_.mdb) is held in the Extra folder. Clicking
the Tools|Helpdesk menu item displays a submenu containing
the items New, Edit and List entries…. Clicking the
New|Person… menu item displays the New person window
shown in Figure 169. Select a Title from the dropdown list and
enter details in the text boxes. Clicking the Save button stores
the information in the Helpdesk_.mdb database (following a
confirmation dialog) and clicking the Close button closes the
window.
Figure 169. The New person window.
Clicking the New|Entry… menu item displays the New entry
window shown in Figure 170. Select one of the already defined
people from the Person dropdown list. The type of entry is
selected from the Type dropdown list (FISPACT, SAFEPAQII, User Interface, EAF and Documentation are the options).
The source of the entry is selected from the Source dropdown
list (Phone, e-mail, Discussion, Document, Idea are the options)
and a reference to it given in the Reference textbox. A
description of the entry is added to the Description textbox and
today’s date is automatically entered in the Date created
textbox. Typically the Response and Date finished textboxes
are left blank. Clicking the Save button stores the information
in the Helpdesk_.mdb database (following a confirmation
dialog) and clicking the Close button closes the window.
CCFE Fusion
User manual: Issue 8, March 2010
SAFEPAQ-II
151
Figure 170. The New entry window.
The details of a person already defined can be edited by
clicking the Edit|Person… menu item which displays the Edit
person window shown in Figure 171. Enter a Surname and
click the Get person button to display the details of the person.
If more than one person with the same name has been defined
then the > and < buttons allow details for each one to be
displayed. The Title, First name and Organisation can be
changed if required and the changes stored in the database by
clicking the Save button. Clicking the Close button closes the
window.
Figure 171. The Edit person window.
A list of the available entries can be found by clicking the
Tools|Helpdesk|List entries… menu item which displays the
List entries window shown in Figure 172. Select an entry from
the List by dropdown list (Surname, Organisation, Type,
Source, Before date, Unfinished and Completed are options). In
the first five cases a criterion must be entered in the Criteria
combo box (if a suitable criterion is available in the dropdown
list then it can be selected). Clicking the List button will display
the selected entries. The list can be printed by clicking the Print
button. Select an entry in the list and click on the Edit button to
display the Edit entry widow which is identical to Figure 170.
It is now possible to enter information in the Response and
User manual: Issue 8, March 2010
CCFE Fusion
152
SAFEPAQ-II
Date finished textboxes. If the entry was completed today then
today’s date can be entered by clicking the Today button. The
changes can be stored in the database by clicking the Save
button. Clicking the Close button closes the window.
Figure 172. The List entries window.
It is important to keep track of the users of EASY so that, for
instance, they can be notified of new versions. PC users also
require a serial number and password during installation. A
database of users is only available to the developer of the code
system (R.A. Forrest) in another Access database (Users_.mdb)
held in the Extra folder. Clicking the Tools|Users menu item
displays a submenu containing the items New user… and Edit
user…. Clicking the New user… menu item displays the New
user window shown in Figure 173. Enter details of the user,
and whether the version of EASY is an internal one or a
commercial sale. Select the EASY versions and types and then
click the Add button to store the information in the database
(following a confirmation dialog). Clicking the Close button
closes the window.
Figure 173. The New user window.
Clicking the Tools|Edit user… menu item displays the Edit
user window shown in Figure 174. A user can be selected
CCFE Fusion
User manual: Issue 8, March 2010
SAFEPAQ-II
153
from the Surname dropdown list which displays their details.
Certain details such as Initials, ID and Serial number cannot be
changed. Click the Save button to store the information in the
database (following a confirmation dialog). Clicking the Close
button closes the window.
Figure 174. The Edit user window.
Clicking the Copy details button copies user information
(Name, Serial number and Password) onto the clipboard. These
details are required when the EASY User Interface software is
installed.
Updating databases
A major advantage of developing SAFEPAQ-II as a Windows
application is that it enables several users to participate in
producing EAF libraries. These users are in separate countries
and so there is the question of how their contributions can be
integrated to form the final library. It is possible to design the
Access databases so that there is a single ‘Design Master’ and
several ‘Replica’ databases. When changes are made to the
Replicas, these can be reconciled in the Design Master by a
process of ‘synchronization’ which ensures that all copies are
identical. Such a process is automatic, and there is no
possibility of choosing if all changes should be implemented.
Also there are certain technical differences in the structure of
the databases in a ‘Replica set’, the most important being that
auto-number fields are added randomly rather than in numerical
order. It therefore seemed better to carry out the updating in a
more manual fashion.
All information on a particular library version is held in the
Parameter database. In addition choices about experimental
User manual: Issue 8, March 2010
CCFE Fusion
154
SAFEPAQ-II
data to be used for visualisation are held in the EXFOR
database. It is only necessary therefore to have copies of these
two databases (which are relatively small compared to Final) to
compare with the original (which is held at Culham). A series
of queries using tables from the original (termed the Internal)
and the copy (termed the External) databases have been
developed. These are held in a new database compare.mdb.
Actually, there is a database comp_generic.mdb that contains
all the queries but no tables. When it is necessary to compare
the Internal and External databases a new version of Compare
is produced which contains links to tables in the Internal and
External databases. This is done by clicking on the
Tools|Create Compare database… menu item which
displays the Create Compare database window shown in
Figure 175. Note that the current External folder is shown, and
so this window can be used if the location of the External folder
is required for other purposes. Another option is to use the
Project properties window (Figure 10).
Figure 175. The Create Compare database window.
Clicking the browse button (…) displays the standard Browse
For Folder dialog where the folder containing the External
databases can be selected. Clicking the Create button copies
comp_generic.mdb to compare.mdb and links all the required
tables. If Compare already exists then a confirmation dialog is
displayed. Once the Compare database has been created (in the
current SAFEPAQ folder), a set of menu items on the Tools
menu become enabled. These enable a series of comparisons to
be carried out.
Clicking the Tools|Compare|Reaction sources… submenu
item displays the Compare reaction sources window shown
in Figure 176. This shows reactions where the data source is
different between the Internal and External databases. The
contents of the grid can be copied or printed by clicking on the
Copy or Print buttons respectively.
CCFE Fusion
User manual: Issue 8, March 2010
SAFEPAQ-II
155
Figure 176. The Compare reaction sources window.
Clicking the Tools|Compare|References… submenu item
displays the Compare references window shown in Figure
177. This shows new references in External that are not in
Internal. The contents of the grid can be copied or printed by
clicking on the Copy or Print buttons respectively.
Clicking the Tools|Compare|Experimental data flags…
submenu item displays the Compare experimental data
flags window shown in Figure 178. This shows data sets where
the flags (these show if the experimental data are used for
branching, renormalisation or validation) are different between
Internal and External for matching data sets. In the grid
headings ‘I’ refers to the internal and ‘E’ to the External
databases. The contents of the grid can be copied or printed by
clicking on the Copy or Print buttons respectively.
Figure 177. The Compare references window.
User manual: Issue 8, March 2010
CCFE Fusion
156
SAFEPAQ-II
Figure 178. The Compare experimental data flags window.
Clicking the Tools|Compare|New experimental data… submenu item displays the Compare new experimental data
window shown in Figure 179. This shows reactions where there
are new data sets in External that are not present in Internal and
the values that are in External. The contents of the grid can be
copied or printed by clicking on the Copy or Print buttons
respectively.
Figure 179. The Compare new experimental data window.
Clicking the Tools|Compare|Systematics data flags… submenu item displays the Compare systematics data flags
window shown in Figure 180. This shows reactions where there
are differences in the usage flags for systematics. The values of
the UseR and UseB fields in the External and Internal databases
are shown. The contents of the grid can be copied or printed by
clicking on the Copy or Print buttons respectively.
CCFE Fusion
User manual: Issue 8, March 2010
SAFEPAQ-II
157
Figure 180. The Compare systematics data flags window.
Clicking the Tools|Compare|New systematics flags… submenu item displays the Compare new systematics flags
window shown in Figure 181. This shows reactions where there
are new systematics data flags in the External database. The
values of the UseR and UseB fields in the External database are
shown. The contents of the grid can be copied or printed by
clicking on the Copy or Print buttons respectively.
Figure 181. The Compare new systematics flags window.
Clicking the Tools|Compare|Removed systematics flags…
submenu item displays the Compare removed systematics
flags window shown in Figure 182. This shows reactions
where systematics data flags for a reaction have been removed
in the External database. The values of the UseR and UseB
fields in the Internal database are shown. The contents of the
grid can be copied or printed by clicking on the Copy or Print
buttons respectively.
User manual: Issue 8, March 2010
CCFE Fusion
158
SAFEPAQ-II
Figure 182. The Compare removed systematics flags window.
Clicking the Tools|Compare|Integral data… submenu item
displays the Compare integral data window shown in Figure
183. This shows reactions where there are differences in the
integral data between the Internal and External databases. The
contents of the grid can be copied or printed by clicking on the
Copy or Print buttons respectively.
Figure 183. The Compare integral data window.
Clicking the Tools|Compare|New Integral data… submenu
item displays the Compare new integral data window shown
in Figure 184. This shows reactions where there are new
integral data in the External database. The values of the integral
data in the External database are shown. The contents of the
grid can be copied or printed by clicking on the Copy or Print
buttons respectively.
CCFE Fusion
User manual: Issue 8, March 2010
SAFEPAQ-II
159
Figure 184. The Compare new integral data window.
Clicking
the
Tools|Compare|Number
of
premodifications… submenu item displays the Compare
number of pre-modifications window shown in Figure 185.
This shows reactions where there are differences in the number
of pre-modifications in the External and Internal databases. To
discover what the External pre-modifications are click on the
reaction to display a ToolTip containing all the details. If there
is more that one pre-modification then pressing the ‘>’ or ‘<’
keys will display the next or previous pre-modification details.
If changes are made to the pre-modifications while the window
is open then the list can be refreshed by clicking the Refresh
button. The contents of the grid can be copied or printed by
clicking on the Copy or Print buttons respectively.
Figure 185. The Compare number of pre-modifications window.
Clicking the Tools|Compare|Number of modifications…
submenu item displays the Compare number of
modifications window shown in Figure 186. This shows
reactions where there are differences in the number of
modifications in the External and Internal databases. To
discover what the External modifications are click on the
reaction to display a ToolTip containing all the details. If there
User manual: Issue 8, March 2010
CCFE Fusion
160
SAFEPAQ-II
is more that one modification then pressing the ‘>’ or ‘<’ keys
will display the next or previous modification details. The
contents of the grid can be copied or printed by clicking on the
Copy or Print buttons respectively.
Figure 186. The Compare number of modifications window.
At one point during the development of SAFEPAQ-II, the Mod
type 5 modification only removed data points. Now this
modification also ensures that a point at 60 MeV exits (20 MeV
for a non-extended library). Prior to this it was necessary to add
the 60 or 20 MeV point by means of a Mod type 16
modification. When comparing with an External database that
used these additional Mod type 16 modifications, the list of
reactions with different numbers of modifications can be very
large. Most of these are actually not relevant as the External
Mod type 16 is not required to be added to the Internal
database. The Ignore final Mod type 16 mods check box in
the Settings window (Figure 1) should be ticked if the External
database contains these modifications.
Clicking the Tools|Compare|Pre-modifications… submenu
item displays the Compare pre-modifications window shown
in Figure 187. Prior to the window appearing the confirmation
dialog shown in Figure 188 is displayed. This ensures that the
comparison is being carried out between databases with the
same reaction numbers. The window shows reactions where
there are differences in the pre-modifications stored and that
will be used to create Final. The values in External are shown.
The contents of the grid can be copied or printed by clicking on
the Copy or Print buttons respectively.
CCFE Fusion
User manual: Issue 8, March 2010
SAFEPAQ-II
161
Figure 187. The Compare pre-modifications window.
Figure 188. The confirmation dialog prior to comparing pre-modifications.
Clicking the Tools|Compare|Modifications… submenu item
displays the Compare modifications window shown in Figure
189. Prior to the window appearing the confirmation dialog
similar to Figure 188 is displayed. This ensures that the
comparison is being carried out between databases with the
same reaction numbers. The window shows reactions where
there are differences in the modifications stored and that will be
used to create Final. The values in External are shown. The
contents of the grid can be copied or printed by clicking on the
Copy or Print buttons respectively.
Figure 189. The Compare modifications window.
Clicking the Tools|Compare|EXFOR… submenu item
displays the Compare EXFOR window shown in Figure 190.
This shows reactions where there are differences in the data sets
selected for plotting from the EXFOR CD-ROMs and stored in
User manual: Issue 8, March 2010
CCFE Fusion
162
SAFEPAQ-II
the SAFEPAQ-II EXFOR database. The ‘Use P’ flag shows if
the data entry is used for visualisation. The contents of the grid
can be copied or printed by clicking on the Copy or Print
buttons respectively.
Figure 190. The Compare EXFOR window.
Clicking the Tools|Compare|Private EXFOR… submenu
item displays the Compare Private EXFOR window shown
in Figure 191. This shows reactions where there are differences
in the Private EXFOR data sets stored in the SAFEPAQ-II
EXFOR database. The contents of the grid can be copied or
printed by clicking on the Copy or Print buttons respectively.
Figure 191. The Compare Private EXFOR window.
Clicking the Tools|Compare|Uncertainty data… submenu
item displays the Compare uncertainty data window shown
in Figure 192. This shows reactions where there are differences
in the uncertainty data values (for non-threshold reactions). The
values in External are shown. The contents of the grid can be
copied or printed by clicking on the Copy or Print buttons
respectively.
CCFE Fusion
User manual: Issue 8, March 2010
SAFEPAQ-II
163
Figure 192. The Compare uncertainty data window.
Clicking the Tools|Compare|Threshold uncertainty data…
submenu item displays the Compare threshold uncertainty
data window shown in Figure 193. This shows reactions where
there are differences in the uncertainty data values (for
threshold reactions). The value in External is shown, and also
an indication of whether it is a new entry or if the Delta value
has been changed. The contents of the grid can be copied or
printed by clicking on the Copy or Print buttons respectively.
Figure 193. The Compare threshold uncertainty data window.
Clicking the Tools|Compare|Quality scores… submenu item
displays the Compare Quality scores window shown in
Figure 194. This shows reactions where there are differences in
the scores. The scores in External and Internal and the number
of different reactions are shown. Note that if the External
database is recent enough so that data on the extended Quality
scores for discrepant reactions are present then the extended
scores are also shown. The contents of the grid can be copied or
printed by clicking on the Copy or Print buttons respectively.
User manual: Issue 8, March 2010
CCFE Fusion
164
SAFEPAQ-II
Figure 194. The Compare Quality scores window.
Using information from Figure 176 - Figure 194 enable changes
to be made systematically to the Internal database that take into
account the changes made in the External database.
The ability to view the Log in an External database is
sometimes necessary in order to check on what changes have
been made. This is possible by clicking on the Tools|View
external Log… menu item that displays the Log window
shown in Figure 6. In this case the title bar shows Log –
External and the contents of the External rather than Internal
Log are shown.
A further way to compare with a previous EAF library has been
available from EASY-2005. Clicking the Tools|Compare with
previous EAF library… menu item displays the Compare
with previous EAF library window shown in Figure 195. Prior
to opening the window the confirmation dialog shown in Figure
196 is displayed. The Compare with previous EAF library
window shows all the reactions in the current library and
contains four tabs. The Source tab displays the data source and
Quality score for the two libraries.
CCFE Fusion
User manual: Issue 8, March 2010
SAFEPAQ-II
165
Figure 195. The Compare with previous EAF library window (Tab 1).
Figure 196. The confirmation dialog prior to comparing with
previous EAF library.
The second tab is displayed by clicking on the Premods tab;
the result is shown in Figure 197. This shows details of the premodifications applied to the two libraries. The third tab is
displayed by clicking on the Mods tab; the result is almost
identical to Figure 197 except that modifications for the two
libraries are shown.
The fourth tab is displayed by clicking on the Summary tab;
the result is shown in Figure 198. This show the cross sections
at standard energies for the two libraries, the ratios and if
available the values from experiment. The data grid can be
printed to the default printer by clicking the Print button. The
window can be closed from this tab by clicking the Close
button, or the Close button at the top of the window. Note that
if the Final summary values for the Internal database have not
yet been calculated then a message to this effect is displayed in
the window.
There are many reactions in the EAF libraries and to select a
particular one the Find text box can be used. Enter a reaction
string e.g. Fe-56(n,p) and clicking the Find button will
User manual: Issue 8, March 2010
CCFE Fusion
166
SAFEPAQ-II
display data for the selected reaction. To display reactions with
high mass targets it is necessary to use the ‘paging buttons’:
clicking > displays the next page and clicking < displays the
previous page.
Figure 197. The Compare with previous EAF library window (Tab 2).
Figure 198. The Compare with previous EAF library window (Tab 4).
As discussed in Appendix 2, the use of linked tables in several
of the databases used by SAFEPAQ-II can cause problems if
databases are moved to another computer. To resolve such
problems click on the Tools|Linked tables… menu item to
display the Linked tables window shown in Figure 199.
There are two potential problems, firstly with Final and
secondly with the various source databases. In Figure 199 the
Final radio button is clicked, and clicking on the Find button
CCFE Fusion
User manual: Issue 8, March 2010
SAFEPAQ-II
167
displays in the text box the current location of the linked tables
in Final. The list box shows all the tables with an indication of
the linked ones. If the path is not valid then use the browse
button (…) to open the standard Open dialog and select the
correct final_add.mdb on the computer. Once this has been
done the Change links button is enabled and clicking this will
change all the links in final.mdb to the new specified location.
The list box will show which tables have been relinked.
If the Data source radio button is clicked then a new
dropdown list containing the names of all the data sources
appears. Select the required source and click the Find button to
show the location of parameter.mdb specified in the links. If
links do not yet exist for the selected source, then a warning
message is displayed. If the links exist then, as in the case of
Final discussed above, these can be altered by clicking the
browse (…) and Change links buttons. The window is closed
by clicking the Close button.
Figure 199. The Linked tables window.
User manual: Issue 8, March 2010
CCFE Fusion
SAFEPAQ-II
168
Summary of menu items
The menu items that are available on the main SAFEPAQ-II
window (Figure 2) are shown below. The page numbers where
a description of the menu item can be found are given to the
right of each menu item.
5
11
65
61
6
7
10
9
10
4
65
65
65
49
47
57
58
58
37
46
46
45
45
46
CCFE Fusion
User manual: Issue 8, March 2010
SAFEPAQ-II
169
24
26
27
28
34
34
32
See a
28
29
30
30
31
67
70
70
72
76
73
78
78
21
23
21
20
23
123
123
124
User manual: Issue 8, March 2010
CCFE Fusion
170
SAFEPAQ-II
79
82
82
83
83
84
See b
See c
86
88
104
98
See d
94
95
See e
97
97
97
97
102
96
See f
105
106
106
See g
107
107
112
116
See h
118
111
124
125
See i
See j
CCFE Fusion
User manual: Issue 8, March 2010
SAFEPAQ-II
171
a
32
32
b
84
84
84
84
84
84
84
84
84
84
84
84
84
84
84
84
c
85
85
85
86
d
87
87
87
e
95
97
96
User manual: Issue 8, March 2010
CCFE Fusion
SAFEPAQ-II
172
f
99
101
101
101
101
101
101
101
102
102
g
106
106
106
107
107
107
107
108
108
108
108
108
109
109
109
109
109
109
109
110
110
h
116
117
117
i
126
127
127
j
126
127
CCFE Fusion
User manual: Issue 8, March 2010
SAFEPAQ-II
173
12
14
13
15
14
15
16
16
17
16
154
See k
165
164
146
129
138
142
143
See l
128
128
149
167
148
147
147
149
144
145
146
See m
See n
User manual: Issue 8, March 2010
CCFE Fusion
SAFEPAQ-II
174
k
155
155
156
156
157
157
157
158
159
159
160
161
161
162
162
163
163
164
l
139
141
142
m
See o
See o
151
n
152
152
o
150
150
8
9
9
CCFE Fusion
User manual: Issue 8, March 2010
SAFEPAQ-II
175
References
[1] RA Forrest, ‘FISPACT-2007: User manual’, UKAEA FUS
534, 2007.
[2] JA Simpson, J-Ch Sublet and D Nierop, ‘SYMPAL: User
guide’, UKAEA FUS 356, 1997.
[3] JA Simpson and J-Ch Sublet, ‘SYMPAL: Utilities guide’,
UKAEA FUS 357, 1997.
[4] J-Ch Sublet, J Kopecky and RA Forrest, ‘The European
Activation File: EAF-99 cross section library’, UKAEA
FUS 408, 1998.
[5] RA Forrest and J-Ch Sublet, ‘The European Activation
File: EAF-99 decay data library’, UKAEA FUS 409, 1998.
[6] RA Forrest and J-Ch Sublet, ‘The European Activation
File: EAF-99 biological, clearance and transport libraries’,
UKAEA FUS 410, 1998.
[7] RA Forrest and JA Simpson, ‘SAFEPAQ: User manual’,
UKAEA FUS 355, 1997.
[8] Visual Numerics, Inc., ‘PV-WAVE Foundation and PVWAVE: Visual Exploration Documentation, Version 6’,
Boulder Colorado, USA, 1996.
[9] RA Forrest, ‘The European Activation System: EASY-2007
overview’, UKAEA FUS 533, 2007.
[10] RA Forrest, J Kopecky and J-Ch Sublet, ‘The European
Activation File: EAF-2007 neutron-induced cross section
library’, UKAEA FUS 535, 2007.
[11] RA Forrest, ‘The European Activation File: EAF-2007
deuteron- and proton-induced cross section libraries’,
UKAEA FUS 536, 2007.
[12] RA Forrest, ‘The European Activation File: EAF-2007
decay data library’, UKAEA FUS 537, 2007.
[13] RA Forrest, ‘The European Activation File: EAF-2007
biological, clearance and transport libraries’, UKAEA
FUS 538, 2007.
[14] RA Forrest and J Kopecky, ‘Statistical analysis of cross
sections – A new tool for data validation’, Fus. Eng.
Design, 82, 73-90, 2007.
[15] RA Forrest, ‘Data requirements for neutron activation –
Part I: Cross sections’, Fus. Eng. Design, 81, 2143-2156,
2006.
User manual: Issue 8, March 2010
CCFE Fusion
SAFEPAQ-II
176
Appendix 1. SAFEPAQ-II design
1. Overall structure
New EAF file
Modify based on
parameter database
Write
Source database files
Source files
Master database
Final database
Select based on
parameter database
Read
Parameter database
Visualisation
Library database
Cache database
Test database
Validation and
documentation
based on
parameter
database
2. Database design
The various source libraries each require a separate database to
contain all the relevant data in a standard form. Each database
is given a name <source>.mdb. The design of the database is
given in generic.mdb, this database is copied and then renamed
for each new database. Using the Documenter feature in Access
the definitions of the tables in generic.mdb are given in Section
3. The fields in each table are shown.
The fields in each table are mostly self-explanatory, note that in
the Reaction table the last six fields are given names taken
directly from ENDF nomenclature. Note that wherever a
floating-point data number is used it has a Double type and that
Long integers are used in cases where more than one or two
possibilities exist. Similar conventions are used in the design of
all the remaining databases.
The library.mdb database contains the RawData table that
describes the location of the source data file and the name of
the database. A series of Boolean variables describe the format
of the data and enable the reading and conversion to database
CCFE Fusion
User manual: Issue 8, March 2010
SAFEPAQ-II
177
form to be achieved. The tables in the library.mdb database are
defined in Section 4. The Reaction table is the same as that
defined for generic.mdb.
The parameter.mdb database contains all the version dependent
information. The tables in the parameter.mdb database are
defined in Section 5.
The master.mdb database tables are very similar to those in
generic.mdb, but also include information on the multiplicity of
the source in addition to the actual multiplicity in the Reaction
table. The tables in the master.mdb database are defined in
Section 6.
The cache.mdb database tables are very similar to those in
master.mdb, but also include information on the history of
modifications made to the original data. The tables in the
cache.mdb database are defined in Section 7.
The final.mdb database tables contain additional information on
group data, and the suspect interpolation laws. The tables in the
final.mdb database are defined in Section 8. Note that from
EASY-2005 the final_add.mdb database contains all the Group
nnn tables, except Group 175F. Final then contains links to
these tables.
The test.mdb database tables are identical to final.mdb, except
that the Adjacent cross section and suspect points tables are not
present and AverageXS is added.
The EXFOR.mdb database is not shown in the diagram above.
It contains information selected from the EXFOR CD-ROMs
(see page 34) that are used for visualisation. The tables in the
EXFOR.mdb database are defined in Section 9.
In addition to the tables present in each of the databases
discussed above, extensive use is made of pre-compiled
queries. Whenever data is selected from a database table, data
in a record are amended or a new record is added this is
achieved by calling a query from Visual Basic. In most cases
various parameters are needed so that a particular query can be
properly defined.
3. The definition of the generic.mdb database tables
Cross section
Name
Reaction number
Point number
Energy
Cross section
User manual: Issue 8, March 2010
Type
Number (Long)
Number (Long)
Number (Double)
Number (Double)
Size
4
4
8
8
CCFE Fusion
SAFEPAQ-II
178
Details
Name
Name
Calc_summary
Linked
Type
Text
Yes/No
Yes/No
Size
50
1
1
Name
Reaction number
Range number
Range limit
Interpolation law
Type
Number (Long)
Number (Integer)
Number (Long)
Number (Integer)
Size
4
2
4
2
Name
Reaction number
Cross section thermal
Cross section 30keV
Cross section 14MeV
Resonance Integral
Type
Number (Long)
Number (Double)
Number (Double)
Number (Double)
Number (Double)
Size
4
8
8
8
8
Name
Reaction number
Source
ZA target
I target
ZA daughter
I daughter
Multiplicity
MT
QM
QI
LR
NR
NP
Type
Number (Long)
Text
Number (Long)
Number (Integer)
Number (Long)
Number (Integer)
Number (Integer)
Number (Integer)
Number (Double)
Number (Double)
Number (Integer)
Number (Integer)
Number (Long)
Size
4
50
4
2
4
2
2
2
8
8
2
2
4
Name
Reaction number
ZA target
I target
ZA daughter
I daughter
MT
Cross section 20MeV
Systematics
Type
Number (Long)
Number (Long)
Number (Integer)
Number (Long)
Number (Integer)
Number (Integer)
Number (Double)
Number (Double)
Size
4
4
2
4
2
2
8
8
Name
Reaction number
ZA target
I target
ZA daughter
I daughter
MT
Cross section 30keV
Systematics
Type
Number (Long)
Number (Long)
Number (Integer)
Number (Long)
Number (Integer)
Number (Integer)
Number (Double)
Number (Double)
Size
4
4
2
4
2
2
8
8
Name
Reaction number
ZA target
I target
ZA daughter
I daughter
MT
Cross section 14MeV
Systematics
Systematics_alt
Type
Number (Long)
Number (Long)
Number (Integer)
Number (Long)
Number (Integer)
Number (Integer)
Number (Double)
Number (Double)
Number (Double)
Size
4
4
2
4
2
2
8
8
8
Interpolation
LibrarySummary
Reaction
Systematics20Summary
Systematics30Summary
SystematicsSummary
CCFE Fusion
User manual: Issue 8, March 2010
SAFEPAQ-II
179
Target
Name
Target number
ZA
I
Type
Number (Integer)
Number (Long)
Number (Integer)
Size
2
4
2
Name
Reaction number
Cross section thermal
Cross section 30keV
Cross section 14MeV
Resonance Integral
Type
Number (Long)
Number (Double)
Number (Double)
Number (Double)
Number (Double)
Size
4
8
8
8
8
Name
Reaction number
ZA target
I target
ZA daughter
I daughter
Multiplicity
MT
Type
Number (Long)
Number (Long)
Number (Integer)
Number (Long)
Number (Integer)
Number (Integer)
Number (Integer)
Size
4
4
2
4
2
2
2
Name
Z
Symbol
Type
Number (Integer)
Text
Size
2
2
Name
MT
Reaction name
Type
Number (Integer)
Text
Size
2
7
Name
Source
Database name
Path
Strict ENDF
ADL-3
JENDL
EAF
XY Table
Version 6
MF2
MF4
MF32
MF33
1 material per file
Header
FEND
MEND
TEND
IEAF
MF6
IPType
Derived
ANITA
Type
Text
Text
Text
Yes/No
Yes/No
Yes/No
Yes/No
Yes/No
Yes/No
Yes/No
Yes/No
Yes/No
Yes/No
Yes/No
Yes/No
Yes/No
Yes/No
Yes/No
Yes/No
Yes/No
Text
Yes/No
Yes/No
Size
50
50
100
1
1
1
1
1
1
1
1
1
1
1
1
1
1
1
1
1
10
1
1
TotalLibrarySummary
TotalReaction
4. The definition of the library.mdb database tables
Elements
MTvalues
RawData
User manual: Issue 8, March 2010
CCFE Fusion
SAFEPAQ-II
180
Reaction
Name
Reaction number
Source
ZA target
I target
ZA daughter
I daughter
Multiplicity
MT
QM
QI
LR
NR
NP
Type
Number (Long)
Text
Number (Long)
Number (Integer)
Number (Long)
Number (Integer)
Number (Integer)
Number (Integer)
Number (Double)
Number (Double)
Number (Integer)
Number (Integer)
Number (Long)
Size
4
50
4
2
4
2
2
2
8
8
2
2
4
Name
Source ID
Source
Number targets
Number reactions
Number n
Number 2n
Number 3n
Number f
Number na
Number 2na
Number np
Number n2a
Number nd
Number nt
Number nh
Number 4n
Number 2np
Number g
Number p
Number d
Number t
Number h
Number a
Number 2a
Number 2p
Type
Number (Integer)
Text
Number (Integer)
Number (Long)
Number (Long)
Number (Long)
Number (Long)
Number (Long)
Number (Long)
Number (Long)
Number (Long)
Number (Long)
Number (Long)
Number (Long)
Number (Long)
Number (Long)
Number (Long)
Number (Long)
Number (Long)
Number (Long)
Number (Long)
Number (Long)
Number (Long)
Number (Long)
Number (Long)
Size
2
50
2
4
4
4
4
4
4
4
4
4
4
4
4
4
4
4
4
4
4
4
4
4
4
Source
5. The definition of the parameter.mdb database tables
A2_IAEA
Name
ZA
Isom
A2
Type
Number (Long)
Number (Integer)
Number (Single)
Size
4
2
4
Name
Add number
Point number
Energy
Cross section
Type
Number (Long)
Number (Long)
Number (Double)
Number (Double)
Size
4
4
8
8
Name
Type
Number (Integer)
Text
Number (Integer)
Number (Integer)
Number (Integer)
Number (Integer)
Number (Double)
Number (Double)
Number (Double)
Number (Double)
Size
2
50
8
2
2
2
8
8
8
8
AdditionalData
AnalysisFits
ID
Source
Curve
Order
Type
Axis
a
b
c
d
CCFE Fusion
User manual: Issue 8, March 2010
SAFEPAQ-II
181
MT
Details
Number (Integer)
Text
2
50
Name
Reaction number
Spectrum ID
Average XS
Type
Number (Long)
Number (Integer)
Number (Double)
Size
4
2
8
Name
Reaction number
Source ID
Spectrum ID
Average XS
Type
Number (Long)
Number (Integer)
Number (Integer)
Number (Double)
Size
4
2
2
8
Name
Group number
Energy
Weight
Type
Number (Integer)
Number (Double)
Number (Integer)
Size
2
8
2
Name
Group number
Energy
Weight
Type
Number (Integer)
Number (Double)
Number (Integer)
Size
2
8
2
Name
Group number
Energy
Weight fission
Weight fusion
Type
Number (Integer)
Number (Double)
Number (Integer)
Number (Integer)
Size
2
8
2
2
Name
Group number
Energy
Weight
Type
Number (Integer)
Number (Double)
Number (Integer)
Size
2
8
2
Name
Group number
Energy
Type
Number (Integer)
Number (Double)
Size
2
8
Name
Group number
Energy
Weight fission
Weight fusion
Type
Number (Integer)
Number (Double)
Number (Integer)
Number (Integer)
Size
2
8
2
2
Name
Group number
Energy
Type
Number (Integer)
Number (Double)
Size
2
8
Name
subfile
ZA
I
Type
Number (Integer)
Number (Long)
Number (Integer)
Size
2
4
2
Name
Reaction number
All branching
Low branching
Mid branching
High branching
Mid factor
Type
Number (Long)
Yes/No
Yes/No
Yes/No
Yes/No
Number (Double)
Size
4
1
1
1
1
8
AverageXS
AverageXS_Source
bound_069
bound_100
bound_172
bound_175
bound_211
bound_315
bound_351
Boundary
BranchingStatus
User manual: Issue 8, March 2010
CCFE Fusion
SAFEPAQ-II
182
BRData
Name
Isomer spin
BR_1
BR_2
BR_3
Type
Number (Single)
Number (Double)
Number (Double)
Number (Double)
Size
4
8
8
8
Name
ZA
Isom
Clearance
Type
Number (Long)
Number (Integer)
Number (Single)
Size
4
2
4
Name
ZA
Isom
Clearance
Type
Number (Long)
Number (Integer)
Number (Single)
Size
4
2
4
Name
Nuclide number
Name
Source
ZA
AWR
MAT
ELIS
STA
LISO
THALF
D_THALF
EA
D_EA
EB
D_EB
EG
D_EG
SPI
PAR
NDK
RTYP_1
RTYP_2
RTYP_3
RTYP_4
RFS_1
RFS_2
RFS_3
RFS_4
Q_1
Q_2
Q_3
Q_4
D_Q_1
D_Q_2
D_Q_3
D_Q_4
BR_1
BR_2
BR_3
BR_4
D_BR_1
D_BR_2
D_BR_3
D_BR_4
A2
A2SOURCE
CING
CINH
HAZSRC
Clearance
ClearSource
OrigSource
Type
Number (Integer)
Text
Text
Number (Long)
Number (Double)
Number (Integer)
Number (Double)
Number (Integer)
Number (Integer)
Number (Double)
Number (Double)
Number (Double)
Number (Double)
Number (Double)
Number (Double)
Number (Double)
Number (Double)
Number (Single)
Number (Integer)
Number (Integer)
Number (Single)
Number (Single)
Number (Single)
Number (Single)
Number (Integer)
Number (Integer)
Number (Integer)
Number (Integer)
Number (Double)
Number (Double)
Number (Double)
Number (Double)
Number (Double)
Number (Double)
Number (Double)
Number (Double)
Number (Double)
Number (Double)
Number (Double)
Number (Double)
Number (Double)
Number (Double)
Number (Double)
Number (Double)
Number (Double)
Text
Number (Double)
Number (Double)
Text
Number (Double)
Text
Text
Size
2
7
50
4
8
2
8
2
2
8
8
8
8
8
8
8
8
4
2
2
4
4
4
4
2
2
2
2
8
8
8
8
8
8
8
8
8
8
8
8
8
8
8
8
8
50
8
8
50
8
50
50
Clearance_IAEA
Clearance_IAEA_old
DecayData
CCFE Fusion
User manual: Issue 8, March 2010
SAFEPAQ-II
183
DeltaQ
Number (Double)
8
Name
Source
Header
Type
Text
Number (Integer)
Size
50
2
Name
Name
Description
Start Mod
PreModMaxAddnum
DecayDB
MasterDB
FoundPM
FinalDB_PM
AdjacentTable
FoundM_BR
FoundM_Exp
FoundM_Sys
FoundM_Zero
FoundM_20
FoundM_Thresh
FoundM_LowE
FoundM_NonThresh
FoundM_Suspect
FinalDB_M
Calc_Summary
Calc_069
Calc_100
Calc_172
Calc_175
Calc_211
Calc_315
Calc_351
Calc_Uncert
Write_GXS
Write_XS
Write_UN
Type
Text
Text
Number (Long)
Number (Long)
Yes/No
Yes/No
Yes/No
Yes/No
Yes/No
Yes/No
Yes/No
Yes/No
Yes/No
Yes/No
Yes/No
Yes/No
Yes/No
Yes/No
Yes/No
Yes/No
Yes/No
Yes/No
Yes/No
Yes/No
Yes/No
Yes/No
Yes/No
Yes/No
Yes/No
Yes/No
Yes/No
Size
50
255
4
4
1
1
1
1
1
1
1
1
1
1
1
1
1
1
1
1
1
1
1
1
1
1
1
1
1
1
1
Name
Z
Symbol
Type
Number (Integer)
Text
Size
2
2
Name
MT
f
name
Type
Number (Integer)
Number (Double)
Text
Size
2
8
50
Name
Exp number
ZA
I
ZAD
ID
MT
Use B
Use R
Use V
Energy
Cross section
Delta Cross section
Source
Type
Number (Long)
Number (Long)
Number (Integer)
Number (Long)
Number (Integer)
Number (Integer)
Yes/No
Yes/No
Yes/No
Number (Double)
Number (Double)
Number (Double)
Text
Size
4
4
2
4
2
2
1
1
1
8
8
8
5
Name
Reaction number
Cross section thermal
Cross section 30keV
Cross section 14MeV
Type
Number (Long)
Number (Double)
Number (Double)
Number (Double)
Size
4
8
8
8
Decaydata sources
Details
Elements
Error factors
ExpData
FinalSummary
User manual: Issue 8, March 2010
CCFE Fusion
SAFEPAQ-II
184
Resonance Integral
Cross section 40MeV
Number (Double)
Number (Double)
8
8
Name
A
Width
Type
Number (Integer)
Number (Double)
Size
2
8
Name
Reaction number
Factor
Type
Number (Long)
Number (Double)
Size
4
8
Name
Reaction number
ZA
I
MT
ZAD
ID
Type
Number (Long)
Number (Long)
Number (Integer)
Number (Integer)
Number (Long)
Number (Integer)
Size
4
4
2
2
4
2
Name
Reaction number
ZA
I
MT
ZAD
ID
Import
Type
Number (Long)
Number (Long)
Number (Integer)
Number (Integer)
Number (Long)
Number (Integer)
Number (Integer)
Size
4
4
2
2
4
2
2
Name
Reaction number
Daughter
Type
Number (Long)
Text
Size
4
7
Name
ZA
LISO
Import_2003
Type
Number (Long)
Number (Integer)
Number (Integer)
Size
4
2
2
Name
ZA
LISO
Import_2007
Type
Number (Long)
Number (Integer)
Number (Integer)
Size
4
2
2
Name
ZA
LISO
Import_2007
Element
Type
Number (Long)
Number (Integer)
Number (Integer)
Text
Size
4
2
2
2
Name
Exp number
ZA
I
ZAD
ID
MT
Use
Spectrum ID
Cross section
Delta Cross section
Source
Type
Number (Long)
Number (Long)
Number (Integer)
Number (Long)
Number (Integer)
Number (Integer)
Yes/No
Number (Integer)
Number (Double)
Number (Double)
Text
Size
4
4
2
4
2
2
1
2
8
8
5
GammaGamma
HighEnergyFactors
Important_2003
Important_2007
ImportantDaughter_2007
ImportantNuc_2003
ImportantNuc_2007
ImportantNucElem_2007
Integral Data
CCFE Fusion
User manual: Issue 8, March 2010
SAFEPAQ-II
185
InterpMods
Name
Reaction number
Source
E low
E high
E ref
X ref
factor
Add number
Exp number
Comment
Type
Number (Long)
Text
Number (Double)
Number (Double)
Number (Double)
Number (Double)
Number (Double)
Number (Long)
Number (Long)
Text
Size
4
50
8
8
8
8
8
4
4
50
Name
ZA
Isom
CEDE_Ing
CEDE_Inh
Source
Type
Number (Long)
Number (Integer)
Number (Single)
Number (Single)
Text
Size
4
2
4
4
7
Name
Nucleon
a
PZ
PN
Type
Number (Integer)
Number (Double)
Number (Double)
Number (Double)
Size
2
8
8
8
Name
Z
A
aa
del
Type
Number (Integer)
Number (Integer)
Number (Double)
Number (Double)
Size
2
2
8
8
Name
Nuclide number
STYP
RTYP
Energy
DEnergy
Intensity
DIntensity
Type
Number (Integer)
Number (Byte)
Number (Single)
Number (Double)
Number (Double)
Number (Double)
Number (Double)
Size
2
1
4
8
8
8
8
Name
Date_Time
Action
Comment
Type
UserID
Type
Date/Time
Text
Text
Number (Byte)
Text
Size
8
100
100
1
3
Name
Mod number
Reaction number
Type
Number (Long)
Number (Long)
Size
4
4
Name
Mod number
Reaction number
Mod type
E low
E high
E ref
X ref
factor
Type
Number (Long)
Number (Long)
Number (Integer)
Number (Double)
Number (Double)
Number (Double)
Number (Double)
Number (Double)
Size
4
4
2
8
8
8
8
8
KnownHazards
LevelDensity
LevelDensityRIPL2
LineData
Log
ModAdhocAdd
ModAdhocDel
User manual: Issue 8, March 2010
CCFE Fusion
SAFEPAQ-II
186
ModDetails
Name
Mod type
Action
Specification
Type
Number (Integer)
Text
Text
Size
2
30
200
Name
Mod number
Mod type
E low
E high
E ref
X ref
factor
Add number
Exp number
Kind
Comment
Type
Number (Long)
Number (Integer)
Number (Double)
Number (Double)
Number (Double)
Number (Double)
Number (Double)
Number (Long)
Number (Long)
Number (Byte)
Text
Size
4
2
8
8
8
8
8
4
4
1
50
Name
Reaction number
Number Mods
Mod 1
Mod 2
Mod 3
Mod 4
Mod 5
Mod 6
Mod 7
Mod 8
Mod 9
Mod 10
Type
Number (Long)
Number (Integer)
Number (Long)
Number (Long)
Number (Long)
Number (Long)
Number (Long)
Number (Long)
Number (Long)
Number (Long)
Number (Long)
Number (Long)
Size
4
2
4
4
4
4
4
4
4
4
4
4
Name
Nuclide number
Comments
Type
Number (Integer)
Memo
Size
2
-
Name
ZA
Isom
MAT
AWR
ELIS
SPI
PAR
Type
Number (Long)
Number (Integer)
Number (Integer)
Number (Double)
Number (Double)
Number (Single)
Number (Integer)
Size
4
2
2
8
8
4
2
Name
ZA
Isom
Target
Source
Type
Number (Long)
Number (Integer)
Yes/No
Text
Size
4
2
1
50
Name
Mod number
Reaction number
Type
Number (Long)
Number (Long)
Size
4
4
Name
Mod number
Reaction number
Mod type
E low
E high
E ref
X ref
factor
Type
Number (Long)
Number (Long)
Number (Integer)
Number (Double)
Number (Double)
Number (Double)
Number (Double)
Number (Double)
Size
4
4
2
8
8
8
8
8
Modification
ModSummary
NucComments
NucProperties
NucSummary
PreModAdhocAdd
PreModAdhocDel
CCFE Fusion
User manual: Issue 8, March 2010
SAFEPAQ-II
187
PreModification
Name
Mod number
Mod type
E low
E high
E ref
X ref
factor
Add number
Exp number
Kind
Comment
Type
Number (Long)
Number (Integer)
Number (Double)
Number (Double)
Number (Double)
Number (Double)
Number (Double)
Number (Long)
Number (Long)
Number (Byte)
Text
Size
4
2
8
8
8
8
8
4
4
1
50
Name
Reaction number
Number Mods
Mod 1
Mod 2
Mod 3
Mod 4
Mod 5
Mod 6
Mod 7
Mod 8
Mod 9
Mod 10
Type
Number (Long)
Number (Integer)
Number (Long)
Number (Long)
Number (Long)
Number (Long)
Number (Long)
Number (Long)
Number (Long)
Number (Long)
Number (Long)
Number (Long)
Size
4
2
4
4
4
4
4
4
4
4
4
4
Name
Reaction number
ZA target
I target
ZA daughter
I daughter
Multiplicity
MT
Source
Status
Score
ExtScore
Type
Number (Long)
Number (Long)
Number (Integer)
Number (Long)
Number (Integer)
Number (Integer)
Number (Integer)
Text
Number (Byte)
Number (Byte)
Number (Byte)
Size
4
4
2
4
2
2
2
50
1
1
1
Name
MT
Reaction
Type
Number (Integer)
Text
Size
2
8
Name
Source
Reference
Type
Text
Text
Size
5
250
Name
RI number
ZA
I
ZAD
ID
MT
Use B
Use R
Use V
RI
Delta RI
Type
Number (Long)
Number (Long)
Number (Integer)
Number (Long)
Number (Integer)
Number (Integer)
Yes/No
Yes/No
Yes/No
Number (Double)
Number (Double)
Size
4
4
2
4
2
2
1
1
1
8
8
Name
Reaction number
Source I daughter
Source Multiplicity
Type
Number (Long)
Number (Integer)
Number (Integer)
Size
4
2
2
PreModSummary
ReacSummary
ReactionType
Reference
RIData
SourceData
User manual: Issue 8, March 2010
CCFE Fusion
SAFEPAQ-II
188
Source MT
Number (Integer)
2
Name
ID
Group number
Flux
Type
Number (Integer)
Number (Integer)
Number (Double)
Size
2
2
8
Name
ID
Name
Structure
Groups
Description
Reference
Type
Number (Integer)
Text
Number (Integer)
Number (Integer)
Text
Text
Size
2
20
2
2
200
10
Name
ZA
I
Spin
Parity
Mass
Abundance
Type
Number (Long)
Number (Integer)
Number (Single)
Number (Integer)
Number (Double)
Number (Double)
Size
4
2
4
2
8
8
Name
Syst number
ZA
I
ZAD
ID
MT
Use B
Use R
Type
Number (Long)
Number (Long)
Number (Integer)
Number (Long)
Number (Integer)
Number (Integer)
Yes/No
Yes/No
Size
4
4
2
4
2
2
1
1
Name
Syst number
ZA
I
ZAD
ID
MT
Use B
Use R
Type
Number (Long)
Number (Long)
Number (Integer)
Number (Long)
Number (Integer)
Number (Integer)
Yes/No
Yes/No
Size
4
4
2
4
2
2
1
1
Name
Reaction number
ZA target
I target
ZA daughter
I daughter
MT
Cross section 14MeV
Systematics
Systematics_alt
Type
Number (Long)
Number (Long)
Number (Integer)
Number (Long)
Number (Integer)
Number (Integer)
Number (Double)
Number (Double)
Number (Double)
Size
4
4
2
4
2
2
8
8
8
Name
Reaction number
ZA target
I target
ZA daughter
I daughter
MT
Cross section 20MeV
Systematics
Type
Number (Long)
Number (Long)
Number (Integer)
Number (Long)
Number (Integer)
Number (Integer)
Number (Double)
Number (Double)
Size
4
4
2
4
2
2
8
8
Name
Reaction number
ZA target
Type
Number (Long)
Number (Long)
Size
4
4
Spectra
SpectraSummary
StablesData
SystData
Syst30Data
SystematicsSummary
Systematics20Summary
Systematics30Summary
CCFE Fusion
User manual: Issue 8, March 2010
SAFEPAQ-II
189
I target
ZA daughter
I daughter
MT
Cross section 30keV
Systematics
Number (Integer)
Number (Long)
Number (Integer)
Number (Integer)
Number (Double)
Number (Double)
2
4
2
2
8
8
Name
Reaction number
Cross section thermal
Cross section 30keV
Cross section 14MeV
Resonance Integral
Cross section 40MeV
Type
Number (Long)
Number (Double)
Number (Double)
Number (Double)
Number (Double)
Number (Double)
Size
4
8
8
8
8
8
Name
Reaction number
Group number
Energy
DeltaSquared
Type
Number (Long)
Number (Long)
Number (Double)
Number (Double)
Size
4
4
8
8
Name
Reaction number
ZA target
I target
ZA daughter
I daughter
Multiplicity
MT
Source
Type
Number (Long)
Number (Long)
Number (Integer)
Number (Long)
Number (Integer)
Number (Integer)
Number (Integer)
Text
Size
4
4
2
4
2
2
2
50
Name
Uncert number
ZA
I
ZAD
ID
MT
Use B
Use R
Use V
EV
EH
DeltaV
DeltaH
Delta20
Delta60
E20
Type
Number (Long)
Number (Long)
Number (Integer)
Number (Long)
Number (Integer)
Number (Integer)
Yes/No
Yes/No
Yes/No
Number (Double)
Number (Double)
Number (Double)
Number (Double)
Number (Double)
Number (Double)
Number (Double)
Size
4
4
2
4
2
2
1
1
1
8
8
8
8
8
8
8
Name
Uncert number
ZA
I
ZAD
ID
MT
Use B
Use R
Use V
VAR
Delta60
E20
Type
Number (Long)
Number (Long)
Number (Integer)
Number (Long)
Number (Integer)
Number (Integer)
Yes/No
Yes/No
Yes/No
Number (Double)
Number (Double)
Number (Double)
Size
4
4
2
4
2
2
1
1
1
8
8
8
Name
ZA
Mass
Type
Number (Long)
Number (Double)
Size
4
8
TotalFinalSummary
TotalFinalUncert
TotalReacSummary
UncertData
UncertDataThreshold
WapstraMass
User manual: Issue 8, March 2010
CCFE Fusion
SAFEPAQ-II
190
6. The definition of the master.mdb database tables
Cross section
Name
Reaction number
Point number
Energy
Cross section
Type
Number (Long)
Number (Long)
Number (Double)
Number (Double)
Size
4
4
8
8
Name
Reaction number
Range number
Range limit
Interpolation law
Type
Number (Long)
Number (Integer)
Number (Long)
Number (Integer)
Size
4
2
4
2
Name
Reaction number
Source
ZA target
I target
ZA daughter
I daughter
Multiplicity
Source I daughter
Source Multiplicity
MT
QM
QI
LR
NR
NP
Type
Number (Long)
Text
Number (Long)
Number (Integer)
Number (Long)
Number (Integer)
Number (Integer)
Number (Integer)
Number (Integer)
Number (Integer)
Number (Double)
Number (Double)
Number (Integer)
Number (Integer)
Number (Long)
Size
4
50
4
2
4
2
2
2
2
2
8
8
2
2
4
Name
Target number
ZA
I
Type
Number (Long)
Number (Long)
Number (Integer)
Size
4
4
2
Name
Reaction number
Point number
Energy
Cross section
Type
Number (Long)
Number (Long)
Number (Double)
Number (Double)
Size
4
4
8
8
Name
Reaction number
Range number
Range limit
Interpolation law
Type
Number (Long)
Number (Integer)
Number (Long)
Number (Integer)
Size
4
2
4
2
Name
Reaction number
Source
ZA target
I target
ZA daughter
I daughter
Multiplicity
Source I daughter
Source Multiplicity
MT
QM
QI
Type
Number (Long)
Text
Number (Long)
Number (Integer)
Number (Long)
Number (Integer)
Number (Integer)
Number (Integer)
Number (Integer)
Number (Integer)
Number (Double)
Number (Double)
Size
4
50
4
2
4
2
2
2
2
2
8
8
Interpolation
Reaction
Target
7. The definition of the cache.mdb database tables
Cross section
Interpolation
Reaction
CCFE Fusion
User manual: Issue 8, March 2010
SAFEPAQ-II
191
LR
NR
NP
History
Number (Integer)
Number (Integer)
Number (Long)
Text
2
2
4
255
Name
Target number
ZA
I
Type
Number (Integer)
Number (Long)
Number (Integer)
Size
2
4
2
Name
Reaction number
Point number
Energy
Cross section
Next Energy
Next Cross section
Type
Number (Long)
Number (Long)
Number (Double)
Number (Double)
Number (Double)
Number (Double)
Size
4
4
8
8
8
8
Name
Reaction number
Point number
Energy
Cross section
Type
Number (Long)
Number (Long)
Number (Double)
Number (Double)
Size
4
4
8
8
Name
Reaction number
Group number
Cross section
Type
Number (Long)
Number (Long)
Number (Double)
Size
4
4
8
Name
Reaction number
Source ID
Group number
Cross section
Type
Number (Long)
Number (Integer)
Number (Long)
Number (Double)
Size
4
2
4
8
Name
Reaction number
Group number
Cross section
Type
Number (Long)
Number (Long)
Number (Double)
Size
4
4
8
Name
Reaction number
Source ID
Group number
Cross section
Type
Number (Long)
Number (Integer)
Number (Long)
Number (Double)
Size
4
2
4
8
Name
Reaction number
Group number
Cross section
Type
Number (Long)
Number (Long)
Number (Double)
Size
4
4
8
Name
Reaction number
Source ID
Group number
Cross section
Type
Number (Long)
Number (Integer)
Number (Long)
Number (Double)
Size
4
2
4
8
Target
8. The definition of the final.mdb database tables
Adjacent cross section
Cross section
Group 069[Link]
Group 069_Source
Group 100[Link]
Group 100_Source
Group 172F[Link]
Group 172F_Source
User manual: Issue 8, March 2010
CCFE Fusion
SAFEPAQ-II
192
Group 172V[Link]
Name
Reaction number
Group number
Cross section
Type
Number (Long)
Number (Long)
Number (Double)
Size
4
4
8
Name
Reaction number
Group number
Cross section
Type
Number (Long)
Number (Long)
Number (Double)
Size
4
4
8
Name
Reaction number
Source ID
Group number
Cross section
Type
Number (Long)
Number (Integer)
Number (Long)
Number (Double)
Size
4
2
4
8
Name
Reaction number
Group number
Cross section
Type
Number (Long)
Number (Long)
Number (Double)
Size
4
4
8
Name
Reaction number
Source ID
Group number
Cross section
Type
Number (Long)
Number (Integer)
Number (Long)
Number (Double)
Size
4
2
4
8
Name
Reaction number
Group number
Cross section
Type
Number (Long)
Number (Long)
Number (Double)
Size
4
4
8
Name
Reaction number
Source ID
Group number
Cross section
Type
Number (Long)
Number (Integer)
Number (Long)
Number (Double)
Size
4
2
4
8
Name
Reaction number
Group number
Cross section
Type
Number (Long)
Number (Long)
Number (Double)
Size
4
4
8
Name
Reaction number
Source ID
Group number
Cross section
Type
Number (Long)
Number (Integer)
Number (Long)
Number (Double)
Size
4
2
4
8
Name
Reaction number
Group number
Cross section
Type
Number (Long)
Number (Long)
Number (Double)
Size
4
4
8
Name
Reaction number
Source ID
Group number
Cross section
Type
Number (Long)
Number (Integer)
Number (Long)
Number (Double)
Size
4
2
4
8
Group 172W[Link]
Group 172W_Source
Group 175F
Group175F_Source
Group 175V[Link]
Group 175V_Source
Group 211F[Link]
Group 211F_Source
Group 315F[Link]
Group 315F_Source
CCFE Fusion
User manual: Issue 8, March 2010
SAFEPAQ-II
193
Group 315V
Name
Reaction number
Group number
Cross section
Type
Number (Long)
Number (Long)
Number (Double)
Size
4
4
8
Name
Reaction number
Source ID
Group number
Cross section
Type
Number (Long)
Number (Integer)
Number (Long)
Number (Double)
Size
4
2
4
8
Name
Reaction number
Group number
Cross section
Type
Number (Long)
Number (Long)
Number (Double)
Size
4
4
8
Name
Reaction number
Source ID
Group number
Cross section
Type
Number (Long)
Number (Integer)
Number (Long)
Number (Double)
Size
4
2
4
8
Name
Reaction number
Group number
Cross section
Type
Number (Long)
Number (Long)
Number (Double)
Size
4
4
8
Name
Reaction number
Source ID
Group number
Cross section
Type
Number (Long)
Number (Integer)
Number (Long)
Number (Double)
Size
4
2
4
8
Name
Reaction number
Range number
Range limit
Interpolation law
Type
Number (Long)
Number (Integer)
Number (Long)
Number (Integer)
Size
4
2
4
2
Name
Reaction number
Source
ZA target
I target
ZA daughter
I daughter
Multiplicity
MT
QM
QI
LR
NR
NP
History
Type
Number (Long)
Text
Number (Long)
Number (Integer)
Number (Long)
Number (Integer)
Number (Integer)
Number (Integer)
Number (Double)
Number (Double)
Number (Integer)
Number (Integer)
Number (Long)
Text
Size
4
50
4
2
4
2
2
2
8
8
2
2
4
255
Name
Reaction number
Point number
Ratio
Interpolation law
Treated
Type
Number (Long)
Number (Long)
Number (Single)
Number (Integer)
Number (Byte)
Size
4
4
4
2
1
Group315V_Source
Group 315W
Group 315W_Source
Group 351F[Link]
Group351F_Source
Interpolation
Reaction
Suspect points
User manual: Issue 8, March 2010
CCFE Fusion
SAFEPAQ-II
194
Target
Name
Target number
ZA
I
Type
Number (Long)
Number (Long)
Number (Integer)
Size
4
4
2
Name
Reaction number
Group number
Energy
DeltaSquared
Type
Number (Long)
Number (Long)
Number (Double)
Number (Double)
Size
4
4
8
8
Name
Code
Name
Type
Text
Text
Size
11
56
Name
ID
Name
Code
Type
Number(Integer)
Text
Text
Size
2
30
3
Name
Full access
Point number
Energy
Delta energy
Cross section
Delta cross section
Type
Number (Long)
Number (Long)
Number (Double)
Number (Double)
Number (Double)
Number (Double)
Size
4
4
8
8
8
8
Name
ZA
I
MT
Status
Library
File name
Type
Number (Long)
Number (Integer)
Number (Integer)
Number (Integer)
Text
Text
Size
4
2
2
2
50
50
Name
ZA
I
MT
Status
File name
Type
Number (Long)
Number (Integer)
Number (Integer)
Number (Integer)
Text
Size
4
2
2
2
50
Name
Code
Name
Type
Text
Text
Size
10
50
Name
Code
ID
Name
Type
Text
Number (Integer)
Text
Size
3
2
60
Name
Full access
Point number
Energy
Delta energy
Cross section
Type
Number (Long)
Number (Long)
Number (Double)
Number (Double)
Number (Double)
Size
4
4
8
8
8
Uncertainty
9. The definition of the EXFOR.mdb database tables
Conferences
CountryCodes
Cross section
Evaluated Graphs
Graphs
Journals
LabCodes
Private Cross section
CCFE Fusion
User manual: Issue 8, March 2010
SAFEPAQ-II
195
Delta cross section
Number (Double)
8
Name
ZA target
I target
Full access
FS
MT
Code
NP
Date
Type
E low
E high
Title
Authors
Reference
Type
Number (Long)
Number (Integer)
Number (Long)
Number (Long)
Number (Integer)
Text
Number (Long)
Text
Text
Number (Double)
Number (Double)
Text
Text
Text
Size
4
2
4
4
2
6
4
4
3
8
8
100
50
6
Name
ZA target
I target
Full access
FS
MT
Code
NP
UseP
Factor E
Factor DE
Factor X
Factor DX
Type
Number (Long)
Number (Integer)
Number (Long)
Number (Long)
Number (Integer)
Text
Number (Long)
Yes/No
Number (Double)
Number (Double)
Number (Double)
Number (Double)
Size
4
2
4
4
2
6
4
1
8
8
8
8
Name
Code
MT
FS
Type
Text
Number (Integer)
Number (Integer)
Size
3
2
2
Name
Code
Name
Type
Text
Text
Size
11
50
Private Reaction
Reaction
ReacCode
Reports
User manual: Issue 8, March 2010
CCFE Fusion
SAFEPAQ-II
196
Appendix 2. Practical details
File locations
The locations of the various files used by SAFEPAQ-II are
defined in the Settings window (Figure 1). This appendix gives
more details of the locations. To increase flexibility a special
folder termed the ‘Extra folder’ is used. If the folder is
Safepaq_DotNet all the folders defined in the Settings window
are assumed to be in this folder. Figure A2.1 shows a case with
the Extra folder.
Source database disk = E
SAFEPAQ database disk = E
E
Safepaq_DotNet
ascii
Cross section data
Decay data
Documents
Exfor
Graphs
New_Safepaq
Scraps
Fig A2.1 Disk structure with extra folder.
In all cases the default location of the safepaq2.exe file is on the
‘Base disk’ (C) in the folder Programe Files\safepaq2.
Linked tables
As the SAFEPAQ-II application has become more sophisticated
and the sizes of the EAF projects have increased there are
several cases where the databases contain linked tables. This
can be a problem when transferring projects between various
computers. The reason is that the location of a linked table is
specified in terms of the path on the computer where the link
was created, if the database is then moved or copied to another
disk the link may no longer be valid, causing a crash of
SAFEPAQ-II. Although a tool (Linked Table Manager) exists
in Access to deal with such problems, it can only be used if the
version of the database is the same as the version of Access.
Since in many cases these are different it is necessary to
consider this problem within SAFEPAQ-II.
The linked tables within compare.mdb can be dealt with by
recreating the database on the new computer, and it is
CCFE Fusion
User manual: Issue 8, March 2010
SAFEPAQ-II
197
recommended that this be done as soon as SAFEPAQ-II is
opened with a new project.
Prior to EAF-2005 the size of final.mdb was well below the 1
GB limit that is part of the Access specification. However, with
the significant increase in the number of reactions from EAF2005 this size became a real limitation. In order to overcome
this limit most of the tables containing multi-group data (the
exception is Group 175F) are transferred to the final_add.mdb
database, and final.mdb contains links to the tables in
final_add.mdb. This change is transparent to the Visual Basic
code, but the location of final_add.mdb is ‘hard-wired’ into
final.mdb. This means that if the specified path does not exist
on a computer that both Final databases are moved to, then a
crash will occur.
A similar problem occurs for the source databases e.g.
talys5.mdb under certain circumstances. If the procedure to
generate a summary for validation has been carried out for the
source database then links are included to parameter.mdb of the
current project. Again, if the source database is moved to
another computer then these links will be incorrect and while
the summary can be regenerated, this can be time consuming
for large source libraries.
The solution to these problems is to use the ‘Linked tables’ tool
available on the Tools menu of SAFEPAQ-II. This shows the
current location held in the link and enables this to be changed
to the correct path. Note that when a new project is created the
links in the new version of final.mdb are automatically changed
so as to point to the new version of final_add.mdb.
Another problem with links also has to be avoided when a new
EAF project is created. This arises because when the files are
copied to a new folder, the new final.mdb still contained links
to the original final_add.mdb. When the data in the new
final.mdb were removed, what actually happened for the group
data was that the original final_add.mdb was cleared. This
problem has been corrected and the links are automatically
updated when the new project is created.
x4s file format
Private EXFOR data are held in an x4s file. The format of the
file is illustrated below.
2
9 2
GEO65
Energy (MeV)
1.3940E+01
1.4500E+01
1.4920E+01
User manual: Issue 8, March 2010
Xsect (mb)
1.1000E-01
2.1000E-01
2.1000E+00
D-Xsect (mb)
2.0000E-02
4.0000E-02
4.0000E-01
CCFE Fusion
SAFEPAQ-II
198
1.5350E+01
1.5890E+01
1.6500E+01
1.7060E+01
1.7490E+01
1.7980E+01
3
1 2
ITJ73
Energy (MeV)
1.4000E+01
4.5000E+00
5.4000E+00
1.3000E+01
2.6000E+01
2.6000E+01
3.8000E+01
6.0000E-01
1.0000E+00
2.0000E+00
0.0000E+00
4.0000E+00
5.0000E+00
Xsect (mb)
1.3000E-01
D-Xsect (mb)
5.0000E-02
Line 1 contains the number of the data set (any unique value
can be used) in positions 1-3, the number of points in the data
set in positions 5-9 and the final state identifier (0, 1, 2, 99 or
blank = 99 can be used) in position 10-11.
Line 2 contains the data set identifier (XXXnn format) in
positions 1-5.
Line 3 contains the data headers, note that units must be given,
these can only be ‘eV’, ‘MeV’, ‘b’ or ‘mb’. The data can be in
two columns (Energy and Xsect) or three columns (Energy,
Xsect and D-Xsect).
Following lines show the data points is standard scientific
notation.
The next data set then follows with no blank line separating the
data.
XY table file format
One of the options for the format of the source data files is ‘XY
table’, see the Library options window (Figure 24). The format
of the file is illustrated below.
18039 0
102 99
2
49
2.00000E+00
4.60000E+00
1.00000E+01
1.50000E+01
2.20000E+01
3.84000E+01
1.75000E+01
8.30000E+00
5.58000E+00
3.84000E+00
Line 1 contains the ZA identifier of the target in positions 1-6,
and the initial state of the target (0, 1, 2) in postion 9.
Line 2 contains the reaction MT number in positions 4-6 and
the daughter final state (0, 1, 2, 99) in positions 8-9.
Line 3 contains the interpolation law (only one law is possible)
in position 6.
Line 4 contains the number of data points in positions 3-6.
CCFE Fusion
User manual: Issue 8, March 2010
SAFEPAQ-II
199
Following lines show the data points (energy, cross section) in
standard scientific notation. The data must be in the format
shown (5 decimal places) starting in columns 1 and 13.
Scrap file format
Data scraps are held in a very similar file format to the ‘XY
table’ however Lines 1 and 2 are not present.
XML files
The settings required in several areas of SAFEPAQ-II are
stored in XML files since the change to VB.NET. The folder
containing the safepaq.exe file also contains a folder Settings.
This contains three files:
SafepaqProgramSettings.xml
SafepaqFormSizeAndLocations.xml
AnalysisTrends.xml
These files are maintained by SAFEPAQ-II and require no
direct user interaction.
Appendix 3. Multi-group cross sections
Introduction
Calculations of multi-group cross sections are made exactly in
SAFEPAQ-II, i.e. by summing the contributions made by all
pairs of data points in a particular group. The data points and
the interpolation law define exactly the form of the cross
section in that range and by using one of a small number of
weighting functions the contribution can be analytically
evaluated. Note that it is assumed that the weighting function
cannot change between any two points.
For a particular energy group the definition of group cross
section is given in equation (1), where φ ( E ) is the weighting
function in the group, σ ( E ) is the cross section and φg is the
value of the weighting function integrated over the group.
σg =
1
φg
∫ φ ( E )σ ( E )dE .........................................................(1)
g
If there are n data points in the group, then it is necessary to add
the two additional points that lie on the upper and lower
boundaries. The cross section values for these are obtained by
interpolation.
Thus the value of the multi-group cross section will be given by
equation (2), where Ei is the energy of the ith point.
User manual: Issue 8, March 2010
CCFE Fusion
SAFEPAQ-II
200
σg =
1
φg
n +1
∑∫
i =0
E i +1
Ei
φ ( E )σ ( E ) dE ................................................(2)
By the use of one of the five standard interpolation laws, σ ( E )
is expressible as an analytical formula, and φ ( E ) is one of five
standard formulae. The five standard forms of weighting
function are shown in equations (3) - (7).
φ ( E ) = C {Flat weighting}.................................................................................(3)
φ ( E ) = C E {1/E weighting} .............................................................................(4)
φ ( E ) = CE exp( − E kT ) {Maxwellian thermal weighting} ...............................(5)
φ ( E ) = C E exp( − E T f ) {Fission spectrum weighting} .................................(6)
(
)
φ ( E ) = C exp − 5 kT f ( E − E f ) {Velocity exponential fusion weighting} .(7)
In these equations, C is a constant, kT = 0.0253 eV, kTf = 1.4
MeV (in (6)), kTf = 0.025 MeV (in (7)) and Ef = 14.07 MeV.
The problem of calculating the 25 expressions resulting from
using these weighting functions and interpolation laws yields
simple analytical expressions in most cases. However, for the
fission spectrum weighting some of the analytical expressions
are very complicated (involving Error and Hypergeometric
functions) and it is be preferable to replace equation (6) by a
quadratic function that fits (6) extremely well.
Interpolation laws
Expressions for the form of the cross section are given in terms
of the energies (E1 and E2) and cross sections ( σ 1 and σ 2 ).
Law 1, constant
σ ( E ) = σ 1 ...............................................................................(8)
Law 2, linear-linear
σ (E ) = σ 1 +
⇒ A=
σ 2 − σ1
E 2 − E1
σ 1 E 2 − σ 2 E1
E 2 − E1
(E − E1 ) = A + BE .................................(9)
;B =
σ 2 −σ1
E 2 − E1
.....................................(10)
Law 3, log-linear
σ (E ) = σ 1 +
CCFE Fusion
σ 2 −σ1
ln( E 2 ) − ln( E1 )
(ln( E ) − ln( E1 ) ) = A + B ln( E ) ...(11)
User manual: Issue 8, March 2010
SAFEPAQ-II
201
⇒ A=
σ 1 ln( E 2 ) − σ 2 ln( E1 )
ln( E 2 ) − ln( E1 )
;B =
σ 2 −σ1
ln( E 2 ) − ln( E1 )
...........(12)
Law 4, linear-log
ln(σ ( E )) = ln(σ 1 ) +
ln(σ 2 ) − ln(σ 1 )
(E − E1 ) = A + BE .......(13)
E 2 − E1
⇒ σ ( E ) = e A e BE ...................................................................(14)
⇒ A=
ln(σ 1 ) E 2 − ln( σ 2 ) E1
ln( σ 2 ) − ln(σ 1 )
;B =
.............(15)
E 2 − E1
E 2 − E1
Law 5, log-log
ln(σ ( E )) = ln(σ 1 ) +
ln(σ 2 ) − ln(σ 1 )
(ln( E ) − ln( E1 ) ) = A + B ln( E ) (16)
ln( E 2 ) − ln( E1 )
⇒ σ ( E ) = e A E B ...............................................................................(17)
⇒ A=
ln( σ 1 ) ln( E 2 ) − ln( σ 2 ) ln( E1 )
ln( σ 2 ) − ln( σ 1 )
;B =
...........(18)
ln( E 2 ) − ln( E1 )
ln( E 2 ) − ln( E1 )
Flat weighting
Using equation (3) for the weighting and each interpolation law
in term yields the following expressions for the multi-group
cross section integral J = ∫ φ ( E )σ ( E ) dE .
Law 1
J ( E1 , E 2 ) = C σ 1
∫
E2
E1
dE = C σ 1 ( E 2 − E 1 )
..............................(19)
Law 2
J ( E1 , E 2 ) = C
=
1
∫
E2
E1
( A + BE ) dE = CA ( E 2 − E1 ) +
2 C (σ 1
1
2
2CB ( E 2
− E12 )
..(20)
+ σ 2 )( E 2 − E1 )
Law 3
J ( E1 , E 2 ) = C
∫
E2
E1
E2
( A + B ln( E )) dE = CA ( E 2 − E 1 ) + CB [E ln( E ) − E ]
E1
(21)
= C ( A − B )( E 2 − E 1 ) + CB ( E 2 ln( E 2 ) − E 1 ln( E 1 ))
User manual: Issue 8, March 2010
CCFE Fusion
SAFEPAQ-II
202
Law 4
E2
∫
C
= e (e
B
J ( E1 , E 2 ) = Ce A
[ ]
C A BE
e e
B
e BE dE =
E1
A
BE 2
)
E2
E1
− e BE1 for B ≠ 0
............................(22)
= Ce A ( E 2 − E1 ) for B = 0
Law 5
J ( E1 , E 2 ) = Ce A
=
∫
E2
E B dE =
E1
[
Ce A
E B +1
( B + 1)
(
]
E2
E1
)
Ce A
E 2B +1 − E1B +1 for B ≠ 0 and B ≠ − 1 ......(23)
( B + 1)
= Ce A ( E 2 − E1 ) for B = 0
= Ce A ln( E 2 E1 ) for B = − 1
1/E weighting
Using equation (4) for the weighting and each interpolation law
in term yields the following expressions for the multi-group
cross section J. Note that these are the same formulae as used in
the calculation of the resonance integral.
Law 1
J ( E1 , E 2 ) = Cσ 1
∫
E2
E1
E
dE
= Cσ 1 ln( 2 ) ..................................(24)
E
E1
Law 2
J ( E1 , E 2 ) = C
∫
E2
E1
E
( A + BE )
dE =CA ln( 2 ) + CB ( E 2 − E1 )
E
E1
= CA ln(
E2
) + C (σ 2 − σ 1 )
E1
(25)
Law 3
Using the standard integral (A2):
J ( E1 , E 2 ) = C
∫
E2
E1
E
( A + B ln( E ))
dE = CA ln( 2 ) +
E
E1
= CA (ln( E 2 ) − ln( E1 )) +
=
CCFE Fusion
1
2 C (σ 1
+ σ 2 ) ln(
1
1
[
2
2 CB (ln( E ) )
]
E2
E1
2 CB (ln( E 2 ) − ln( E1 ))(ln( E 2 ) +
ln( E1 )) (26)
E2
)
E1
User manual: Issue 8, March 2010
SAFEPAQ-II
203
Law 4
J ( E1 , E 2 ) = Ce A
∫
E2
E1
e BE
dE .................................................(27)
E
Using the standard result, shown in equation (A3), and defining
I n (E1 , E2 ,α ) by equation (28) the final expression is given in
(29).
I n ( E1 , E 2 , α ) =
∫
E2
E n e α E dE
E1
...................................................(28)
J ( E1 , E 2 ) = Ce A I −1 ( E1 , E 2 , B ) ...............................................(29)
Law 5
∫
J ( E1 , E 2 ) = Ce A
E2
E B −1 dE =
E1
(
[ ]
Ce A B
E
B
E2
E1
)
Ce A
E 2B − E1B for B ≠ 0 and B ≠ 1 .................(30)
B
= Ce A ( E 2 − E1 ) for B = 1
=
= Ce A ln( E 2 E1 ) for B = 0
Maxwellian thermal weighting
Using equation (5) for the weighting and each interpolation law
in term yields the following expressions for the multi-group
cross section integral J.
Law 1
J ( E1 , E 2 ) = C σ 1
∫
E2
E1
E exp( − E kT ) dE
................................(31)
Using the standard result, shown in equation (A1), and using
I n (E1 , E2 ,α ) defined by equation (28), the final expression is
given in (32).
J ( E1 , E 2 ) = Cσ 1 I1 ( E1 , E 2 ,− 1 kT ) ..........................................(32)
Law 2
J ( E1 , E 2 ) = C
∫
E2
( A + BE ) E exp( − E kT ) dE
........(33)
E1
= CAI 1 ( E1 , E 2 , − 1 kT ) + CBI 2 ( E1 , E 2 , − 1 kT )
User manual: Issue 8, March 2010
CCFE Fusion
SAFEPAQ-II
204
Law 3
J ( E1 , E 2 ) = C
∫
E2
( A + B ln( E )) E exp( − E kT ) dE
E1
= CAI 1 ( E1 , E 2 , − 1 kT ) + CBk 2T 2 I −1 ( E1 , E 2 ,− 1 kT ) − ....(34)
E2
( E + kT ) ln( E )
CBk T exp( − E kT )
+ 1
kT
E1
2
2
Law 4
J ( E1 , E 2 ) = Ce A
∫
E2
Ee BE exp( − E kT ) dE = Ce A
E1
∫
E2
E1
− E (1 − BkT )
E exp
dE .(35)
kT
Defining a new variable ε such that ε = (1 − kTB ) E means that
(35) can be written as (36).
J ( E1 , E 2 ) =
Ce A
(1 − kTB ) 2
∫
(1− kTB ) E 2
(1− kTB ) E1
ε exp (− ε kT )dε
Ce A
I1 ((1 − kTB ) E1 , (1 − kTB ) E 2 ,− 1 kT ) , where B ≠ 1 kT ......(36)
(1 − kTB ) 2
1
= Ce A ( E 22 − E12 ) , where B = 1 kT
2
=
Law 5
J ( E 1 , E 2 ) = Ce
A
∫
E2
E1
E B + 1 exp( − E kT ) dE
...........................(37)
Note that in equation (37) B is not generally an integer, and the
solution for non-integer B involves incomplete gamma
functions. The solution for integral B is given in equation (38),
for the general case the solution using gamma functions is
shown in equation (39).
J ( E1 , E 2 ) = Ce A I B +1 ( E1 , E 2 , − 1 kT ) .....................................(38)
Equation (37) can be written as equation (39) using equation
(A13).
J ( E1 , E 2 ) = Ce A ( kT ) B + 2 Γ ( B + 2 )[P ( B + 2 , E 2 kT ) − P ( B + 2 , E1 kT ) ] with B > − 2 (39)
Equation (39) is only valid for B > −2, in order to extend the
range to more negative vales of B, equation (37) can be
integrated by parts. K1 ( E1 , E 2 ) is defined by equation (40) and
Fn ( E1 , E2 ) by equation (41).
J ( E1 , E 2 ) = Ce A K 1 ( E1 , E 2 ) ..................................................(40)
CCFE Fusion
User manual: Issue 8, March 2010
SAFEPAQ-II
Fn ( E1 , E 2 ) =
205
[
]
1
E 2B + n exp( − E 2 kT ) − E1B + n exp( − E1 kT ) ......(41)
( B + n)
Then K1 can be written in several forms as shown in equations
(42) – (44) following integration by parts.
K 1 = F2 +
K 1 = F2 +
K2
............................................................(42)
kT ( B + 2 )
K 1 = F2 +
F3
K3
+
.........................(43)
2
kT ( B + 2 ) ( kT ) ( B + 2 )( B + 3)
F3
F4
K4
+
+
(44)
kT ( B + 2 ) ( kT ) 2 ( B + 2 )( B + 3) ( kT ) 3 ( B + 2 )( B + 3)( B + 4 )
Kn can be written in terms of gamma functions in a similar
fashion to equation (39) as shown in equation (45).
K n ( E1 , E 2 ) = ( kT ) B + n +1 Γ ( B + n + 1)[P ( B + n + 1, E 2 kT ) − P ( B + n + 1, E1 kT ) ] with B > − (1 + n )
..................................................................................................................................(45)
For more negative values of B, a quadratic fit as described in
the following section is used.
Fission spectrum weighting
Using equation (6) for the weighting leads to extremely
complicated integrals. Over the energy range of interest it is
possible to very accurately fit the weighting function to a
simple quadratic function shown in (46). The constants are
found by fitting to the original function. Using this and each
interpolation law in term yields the following expressions for
the multi-group cross section integral J.
φ ( E ) = α + β E + γ E 2 ............................................................(46)
Law 1
J ( E1 , E 2 ) = σ 1
∫
E2
(α + β E + γ E 2 ) dE
E1
[
(α ( E
= σ 1 αE +
1
= σ1
− E1 ) +
User manual: Issue 8, March 2010
2
2
βE 2 +
1
1
2
3 γE
]
3 E2
E1
β ( E 22 − E12 ) +
1
3γ
( E 23 − E13 )
)
(47)
CCFE Fusion
SAFEPAQ-II
206
Law 2
J ( E1 , E 2 ) =
∫
E2
=
∫
E2
( A + BE )(α + β E + γ E 2 ) dE
E1
α A + β AE + γ AE 2 + α BE + β BE 2 + γ BE 3 dE
E1
[
= (α A ( E
= α AE +
2
1
2 (βA
+ αB ) E 2 +
− E1 ) +
1
2 (βA
1
3
(γ A + β B ) E 3 +
+ α B )( E 22 − E12 ) +
1
3
1
]
4 E2
E1
4 γ BE
(γ A + β B )( E 23 − E13 ) +
1
4
4 γB ( E 2
− E14 )
)
..................................................................................................................................(48)
Law 3
J ( E1 , E 2 ) =
=
∫
E2
∫
E2
( A + B ln( E ))( α + β E + γ E 2 ) dE
E1
..(49)
α A + β AE + γ AE
2
+ α B ln( E ) + β BE ln( E ) + γ BE
2
ln( E ) dE
E1
Using the standard integrals shown in (A6)-(A8) this integral
can be evaluated as shown in equation (50).
α AE + 1 2 β AE 2 + 1 3 γAE 3 + α BE ln( E ) − α BE +
J ( E1 , E 2 ) =
K + 1 3 γ BE 3 ln( E ) − 1 9 γBE 3
[
= α ( A − B)E +
1
4
β (2 A − B ) E 2 +
1
9γ
1
(3 A − B ) E 3 +
2
1
β BE 2 ln( E ) −
6
1
4
β BE 2 K
E1
B ( 6α + 3 β E + 2γ E 2 ) E ln( E )
..................................................................................................................................(50)
Law 4
J ( E1 , E 2 ) = e A
=
=
∫
E2
e BE (α + β E + γE 2 ) dE
E1
[
eA
(α + β E + γE 2 ) e BE
B
]
E2
E1
−
eA
B
∫
E2
e BE ( β + 2γE ) dE
E1
E
2
e BE
eA
2
BE
α
β
γ
β
γ
(
+
E
+
E
)
e
−
(
+
2
E
)
+ 2
B
B
E1
eA
B
∫
E2
E1
e BE 2γdE
...(51)
E
2
eA
e BE
e BE
2
BE
=
+ 2γ 2
(α + β E + γE )e − ( β + 2γE )
B
B
B E
1
=
eA
B
3
[e
BE
(α B 2 − β B + 2γ + B ( β B − 2γ ) E + γB 2 E 2 )
]
E2
E1
Law 5
J ( E1 , E 2 ) = e A
∫
E2
E1
E B (α + β E + γ E 2 ) dE = e A
∫
E2
E1
α E B + β E B +1 + γ E B + 2 dE .....(52)
Equation (52) can be solved trivially except for three values of
B = -1, -2, -3. In these cases a log term is introduced.
CCFE Fusion
E2
User manual: Issue 8, March 2010
]
E2
E1
SAFEPAQ-II
207
A αE
E2
β E B + 2 γE B + 3
J ( E1 , E 2 ) = e
+
+
, where B ≠ {− 1,−2,−3}
B+2
B + 3
B + 1
E1
B +1
E2
A
β E B + 2 γE B + 3
= e α ln( E ) +
+
, where B = −1
B+2
B + 3
E
1
......(53)
E2
α E B +1
γE B + 3
=e
+ β ln( E ) +
, where B = −2
B + 3
B + 1
E1
A
E
α E B +1 β E B + 2
2
=e
+
+ γ ln( E ) , where B = −3
B+2
B + 1
E1
A
Velocity exponential fusion
Equation (7) can be rewritten in a simpler form as shown in
equation (54), where g = 5 E f kT f and a = −5 kT f . Using
equation (54) for the weighting and each interpolation law in
term yields the following expressions for the multi-group cross
section integral J.
(
φ ( E ) = Cg exp aE 1 2
)
...........................................................(54)
Law 1
J ( E 1 , E 2 ) = Cg σ 1
∫
E2
exp( aE 1 2 ) dE
E1
......................................(55)
By changing the variable, E = z 2 , equation (55) can be written
as equation (56).
J ( E 1 , E 2 ) = 2 Cg σ 1
∫
E2
z exp( az ) dz
.....................................(56)
E1
Using the integral shown in equation (28), this integral can be
evaluated as shown in equation (57).
J ( E1 , E 2 ) = 2 Cg σ 1 I 1 ( E11 2 , E 12 2 , − 5 kT f ) ..............................(57)
Law 2
J ( E 1 , E 2 ) = Cg
∫
E2
( A + BE ) exp( aE 1 2 ) dE
E1
= 2 CgAI
1 2
1 ( E1 ,
E 21 2 , −
5 kT f ) + CgB
∫
E2
....(58)
E exp( aE
1 2
) dE
E1
Changing the variable as in Law 1 enables the second integral
to be written in standard form yielding equation (59).
J ( E1 , E 2 ) = 2 CgAI 1 ( E 11 2 , E 12 2 , − 5 kT f ) + 2 CgBI 3 ( E 11 2 , E 21 2 , − 5 kT f ) .(59)
User manual: Issue 8, March 2010
CCFE Fusion
SAFEPAQ-II
208
Law 3
J ( E 1 , E 2 ) = Cg
∫
E2
( A + B ln( E )) exp( aE 1 2 ) dE
E1
= 2 CgAI
E 21 2 , −
1 2
1 ( E1 ,
5 kT f ) + CgB
∫
E2
.(60)
ln( E ) exp( aE
1 2
) dE
E1
Defining the integral in the second term in equation (60) as
shown in equation (61).
K ( E1 , E 2 ) =
∫
E2
ln( E ) exp( aE 1 2 ) dE
E1
......................................(61)
Changing the variable as in Law 1, carrying out integration by
parts and noting that
d
2
ln( z 2 ) = enables equation (61) to be
dz
z
written as equation (62).
K=
2
1
4
4
ln( z 2 ) ze az − e az − 2 e az + 2
a
a
a
a
∫
e az
dz ...................(62)
z
Changing the variable back to E, equation (62) can be written in
standard form in equation (63).
E1 2
1
K ( E1 , E 2 ) = 2 exp( aE 1 2 ) ln( E )
− 2
a
a
E
2
2
4
12
12
−
a 2 + a 2 I −1 ( E1 , E 2 , a ) (63)
E1
Law 4
J ( E 1 , E 2 ) = Cge
A
∫
E2
e BE exp( aE 1 2 ) dE = Ce
A
E1
∫
E2
E1
(
)
exp BE + aE 1 2 dE
(64)
Equation (64) can be solved in terms of Error functions (a < 0,
but B can be either positive or negative meaning that the
Imaginary error function would be required). It would be more
practical to use a quadratic fit to the weighting spectrum this
yields equation (65), which has been solved in equation (51) in
section 6.4.
J ( E1 , E 2 ) = e A
∫
E2
e BE (α + β E + γ E 2 ) dE
E1
..............................(65)
Law 5
J ( E 1 , E 2 ) = Cge
A
∫
E2
E B exp( aE 1 2 ) dE
E1
.................................(66)
Changing the variable as in section 7.1 enables equation (66) to
be written as equation (67).
J ( E 1 , E 2 ) = 2 Cge
CCFE Fusion
A
∫
E2
z 2 B +1 e az dz
.........................................(67)
E1
User manual: Issue 8, March 2010
SAFEPAQ-II
209
If (2B+1) is an integer then equation (67) can be solved by
equation (68), otherwise it is the same form as equation (37)
which was solved using gamma functions. The solution is given
in equation (69).
J ( E1 , E 2 ) = 2 Cge A I 2 B +1 ( E11 2 , E 12 2 , − 5 kT f ) ..........................(68)
2B+2
5 E 2
5 E1
with B > −1
Γ (2 B + 2 ) P 2 B + 2,
− P 2 B + 2,
kT f
kT
f
..................................................................................................................................(69)
A
kT f
J ( E1 , E 2 ) = 2Cge
5
Equation (69) is only valid for B > −1, in order to extend the
range to more negative vales of B, equation (67) can be
integrated by parts. K1 ( E1 , E 2 ) is defined by equation (70) and
Fn ( E1 , E2 ) by equation (71).
J ( E1 , E 2 ) = 2 Ce A K 1 ( E1 , E 2 ) ................................................(70)
Fn ( E1 , E 2 ) =
1
E
2
( 2 B + n )
2B+n
exp( − 5 E 2 kT f ) − E1
2B+n
exp( − 5 E1 kT f ) ..(71)
Then K1 can be written in several forms as shown in equations
(72) – (74) following integration by parts.
K 1 = F2 +
K1 = F2 +
5K 2
........................................................(72)
kT f ( 2 B + 2)
K 1 = F2 +
5 F3
52 K 3
+
................(73)
kT f ( 2 B + 2 ) ( kT f ) 2 ( 2 B + 2 )( 2 B + 3)
5 F3
5 2 F4
53 K 4
+
+
kT f ( 2 B + 2 ) ( kT f ) 2 ( 2 B + 2 )( 2 B + 3) ( kT f ) 3 ( 2 B + 2 )( 2 B + 3)( 2 B + 4 )
...................................................................................................................................(74)
Kn can be written in terms of gamma functions in a similar
fashion to equation (69) as shown in equation (75).
kT f
K n ( E1 , E 2 ) =
5
2 B + n +1
5 E2
Γ (2 B + n + 1) P 2 B + n + 1,
kT f
− P 2 B + n + 1, 5 E1
kT f
with B > − (1 + n ) / 2
..................................................................................................................................(75)
For more negative values of B, a quadratic fit as described in
the fission spectrum weighting section is used.
User manual: Issue 8, March 2010
CCFE Fusion
SAFEPAQ-II
210
Summary
A summary of the method of solution in each of the 25 cases is
given in the following table. Note that ‘Simple’ indicates an
algebraic function of E1, E2, σ1 and σ2, ‘Quadratic fit’ indicates
that due to the complexity of the solution a quadratic fit to the
weighting spectrum over the energy range has been adopted and
‘~In indicates that an algebraic expression and the standard
integral shown in equation (28) has been used. ‘Gamma fun’
indicates that an incomplete gamma function has been used.
Weighting→
Law ↓
1 - constant
2 - lin/lin
3 - log E/lin σ
4 - lin E/ log σ
5 - log/log
Flat
1/E
Simple
Simple
Simple
Simple
Simple
Maxwellian
thermal
~ I1
~ I1 + I2
~ I1 + I-1
~ I1
Gamma fun
Simple
Simple
Simple
~ I-1
Simple
Fission
spectrum
Quadratic fit
Quadratic fit
Quadratic fit
Quadratic fit
Quadratic fit
Velocity
exp. fusion
~ I1
~ I1 + I3
~ I1 + I-1
Quadratic fit
Gamma fun
Annex: Standard integrals
See reference [1] for all except (A13), which is taken from [2]:
∫
⌠ ln( x ) dx =
⌡ x
1
∑ ( − 1)
∫
ln( x ) e ax dx =
x ln( x ) e ax dx =
(ln( x ) )2
....................................................... (A2)
2
1
a
∞
∑
i =1
( ax ) i
................................................. (A3)
ii !
ln( x )( e ax − 1) −
∫x
2
1
2
ln( x ) dx =
2
1
∞
∑
i =1
(( ax − 1) ln( x ) − 1 ) +
∫ ln( x ) dx = x ln( x ) − x
∫ x ln( x ) dx =
.................................... (A1)
( m − r )! a r +1
e ax
a
r
r =0
ax
⌠ e
dx = ln( x ) +
⌡ x
∫
m! x m − r
m
x m e ax dx = e ax
........................ (A4)
1
ln( x ) +
a 2
∞
∑
i =1
( ax ) i
ii !
. (A5)
......................................................... (A6)
x 2 ln( x ) −
3
( ax ) i
ii !
1
x 3 ln( x ) −
4
1
x 2 ............................................. (A7)
9
x 3 ........................................... (A8)
Explicit formulae for the standard integral I n (E1 , E2 ,α ) defined
in equation (28) are given for n = -1, 1, 2, 3.
I1 ( E1 , E 2 , α ) =
CCFE Fusion
1
α2
[(αE
2
]
− 1)eαE 2 − (αE1 − 1)eαE1 ................... (A9)
User manual: Issue 8, March 2010
SAFEPAQ-II
I 2 ( E1 , E 2 , α ) =
I 3 ( E1 , E 2 , α ) =
1
[(α
3
211
1
α
3
[(α
2
]
E 22 − 2αE 2 + 2)eαE 2 − (α 2 E12 − 2α E1 + 2)eαE1 .... (A10)
E 23 − 3α 2 E 22 + 6αE 2 − 6)eαE 2 − (α 3 E13 − 3α 2 E12 + 6αE1 − 6)eαE1
]
α
................................................................................................................................ (A11)
4
I −1 ( E1 , E 2 , α ) = ln( E 2 E1 ) +
∞
∑
i =1
α i ( E 2i − E1i )
ii!
...................... (A12)
x
P (a, x) =
1
t a −1 e − t dt a > 0 ......................................... (A13)
Γ (a )
∫
0
References
[1] CRC Handbook of Chemistry and Physics, Editor R. C.
Weast, 68th Edition, 1998.
[2] Numerical Recipes in Fortran, 2nd Edition, W.H. Press, S.A.
Teukolsky, W.T. Vetterling and B.P. Flannery, Cambridge
University Press, 1992.
User manual: Issue 8, March 2010
CCFE Fusion
SAFEPAQ-II
212
Appendix 4. Branching ratios
An inconsistent definition of the branching ratio was used in
SYMPAL. This was corrected in later stages of the processing.
The following description shows the definition used in
SAFEPAQ-II.
If there is only a single isomeric state then the branching ratio is
defined by equation (1).
bm =
σm
.........................................................................(1)
σm +σ g
This branching ratio can be calculated by systematics.
If there is a second isomeric state then the branching ratio for
this state (on the assumption that it is the only one), is given by
equation (2).
bn =
σn
..........................................................................(2)
σn +σ g
In SYMPAL, and in early versions of SAFEPAQ-II an incorrect
assumption about how to form bg from the other two b’s had
been made. It was assumed that equation (3) should be used.
b g = 1 − bm − bn ........................................................................(3)
It can be easily seen that if bm and bn are > 0.5 then bg will be
negative. Errors like this were discovered in early versions of
SAFEPAQ-II by the presence of negative cross sections.
The correct way to proceed is to assume that the ratios
σ m σ g and σ n σ g remain constant irrespective of whether the
number of final states is 2 or 3. The values of these ratios are
given in equations (4) and (5).
σm
bm
=
.........................................................................(4)
σ g (1 − bm )
σn
bn
=
..........................................................................(5)
σ g (1 − bn )
If σ T is the sum of the three final states, then the ith 3-state
branching ratio is given by equation (6).
~ σ
bi = i ...................................................................................(6)
σT
CCFE Fusion
User manual: Issue 8, March 2010
SAFEPAQ-II
213
Thus for the 1st isomeric state, equation (6) can be rewritten in
equation (7).
~
bm =
σm σg
σm
b (1 − bn )
=
= m
.........(7)
σ g + σ m + σ n 1+ σ m σ g + σ n σ g
1 − bm bn
Similarly the other two ratios are given in equations (8) and (9).
~ b (1 − bm )
bn = n
........................................................................(8)
1 − bm bn
~
(1 − bn )(1 − bm )
bg =
................................................................(9)
1 − bm bn
Note that the sum of equations (7), (8) and (9) is 1 as required.
Thus equation (3) must be replaced by equation (10).
~
~
~
b g = 1 − bm − bn ......................................................................(10)
User manual: Issue 8, March 2010
CCFE Fusion
SAFEPAQ-II
214
Appendix 5. Single Resonance Approximation
If the thermal cross section is large then it is a physically
reasonable approximation to assume that the thermal cross
section (and to some extent the resonance integral) are
determined by a single strong s-wave resonance. The single
level Breit-Wigner (SLBW) formula can be written as shown in
equation (1),
σ =
πg J
k
2
Γn Γγ
( E − E 0 ) 2 + 14 Γ 2
.......................................................(1)
where k is the neutron wave number, gJ is a spin statistical
weight factor, Γn is the neutron width, Γγ is the radiative width,
Γ is the total width, E0 is the energy of the resonance and E is
the energy. It is assumed that σ is measured in m2, and E in J.
Note that the second fraction is dimensionless and so it can be
assumed that all the terms are measured in eV.
The relationship between E and k is shown in equation (2):
E=
h 2k 2
................................................................................(2)
2m
The energy dependence of Γn is shown in equation (3):
Γn = Γn0 E .............................................................................(3)
where Γn0 is the reduced neutron width (units of eV are used).
Using the numerical values of all the constants the basic
formula can be rewritten so that σ is measured in b, and E in
eV. The numerical values are:
h = 1.05457266 10-34 Js
m = 1.008664904 u
1 u = 1.6605402 10-27 kg
1 J = 6.2415064 1018 eV
1 b = 1 10-28 m2
Thus using f as the dimensionless fraction, the basic formula
(with units in brackets) is given by equation (4):
σ (m 2 ) =
CCFE Fusion
πg J h 2 ( Js )
2 m ( kg ) E ( J )
f .........................................................(4)
User manual: Issue 8, March 2010
SAFEPAQ-II
215
Using the numerical values equation (4) can be written as
equation (5):
σ (b ) =
Cg J
f .....................................................................(5)
E (eV )
where C = 6.50977546 105
Assuming that all energies that follow are measured in eV and
all cross sections in b, and that the non-elastic contribution to
the total width can be neglected then equation (1) can be
written as equation (6):
σ =
Γn0 Γγ
Cg J
E ( E − E 0 ) 2 + 14 (Γn + Γγ ) 2
.........................................(6)
In order to determine Γn0 the thermal cross section value is used
(and assuming that E0 >> Et and E0 >>Γ) as shown by equation
(7):
σt =
Cg J Γn 0 Γγ
Et
E02
.....................................................................(7)
In the present version of SAFEPAQ-II the following additional
simplifications are used:
•
A value of 0.5 is assumed for gJ.
•
A simple systematic is used for the radiative width as
shown in equation (8) for targets with A < 40:
Γγ = 1593 / A2 .........................................................................(8)
where A is the mass number of the target. In cases where A ≥
40, a table of widths stored in the Parameter database is used.
With these assumptions equation (6) can be used to calculate
cross section values from 1 10-5 eV to EH.
A similar treatment is used for the (n,f) reactions. In this case Γγ
is replaced by Γf. It is assumed by default that Γf = 0.235 eV for
fissile targets and 7 10-4 eV for non-fissile targets.
User manual: Issue 8, March 2010
CCFE Fusion
SAFEPAQ-II
216
Appendix 6. Low Energy Approximation
It has been demonstrated experimentally [1] that the low energy
component of the (n,γ), (n,p) or (n,α) cross sections (for targets
with Q > 0) have the same energy dependence, namely 1/v
connected to the resonance region. The similarity in the shapes
and distribution of resonances in these three reactions has also
been demonstrated experimentally. From this a plausible
assumption can be formulated, namely that the partial widths
Γγi, Γpi and Γαi obey the same χ 2 - distribution (PorterThomas) which results in the similar behaviour of total widths
Γγ, Γp and Γα with values close to a constant mean value for
each reaction.
Figure 1. Values of (n,p)/(n,γ) and (n,α)/(n,γ) cross sections for
Pd and 107Ag targets respectively calculated by TALYS.
107
These facts have been later supported theoretically by statistical
model calculations, which show a constant and energy
independent ratio of (n,p)/(n,γ) and (n,α)/(n,γ) cross sections
from about 1 meV up to 50-100 keV. This is demonstrated in
Figure 1, where the results of calculations with the code
TALYS for 107Pd and 107Ag targets are shown. It is obvious that
this feature can be used to approximate the unknown low
energy component of (n,p) and (n,α) reactions from the known
(n,γ) cross sections and smoothly join these data with the
excitation curve above the ‘effective threshold’. This feature
was first used by H. Gruppelaar in 1981 to estimate (n,p)
CCFE Fusion
User manual: Issue 8, March 2010
SAFEPAQ-II
217
components in 58gCo and 58mCo evaluations [2] from the total
absorption cross section and later in a slight modified version
(adjustable MF2 data used to generate data for the resolved
resonance region satisfying the thermal (n,p) or (n,α) cross
sections) for a small number of reactions on targets in the
deformed region between 150 < A < 165 in the JENDL-3
library.
During the development of the TALYS code [3] this idea of the
low energy treatment of the non-threshold (n,p) and (n,α)
reactions has been included. For normalization of the (n,p) and
(n,α) data either the thermal (n,p) and (n,α) cross sections (if
experimentally known) or values derived from σ(n,p)/σ(n,γ) or
σ(n,α)/σ(n,γ) ratios calculated by TALYS can be used.
This approximation is termed the Low Energy Approximation
(LEA), it can be applied to two groups of (n,p) and (n,α)
reactions with resolved resonance region in the (n,γ) [MT=102]
channel in SAFEPAQ-II.
1. The thermal cross section for the (n,p) or (n,α) reaction is
known. In this case the (n,γ) component between 10-5 eV
and EH (including the resolved resonance region) is merged
with the (n,p) or (n,α) data by means of a Mod type 18
preliminary modification and the low energy (n,γ)
component is then normalised to the experimental value of
(n,p) or (n,α) thermal cross section.
2. If the thermal cross section for the (n,p) or (n,α) reaction is
not known, then the ratio σcal/σγcal at D0 is calculated by
TALYS and this ratio is used to derive from the known
(n,γ) cross section the (n,p) or (n,α) thermal value ( σ th ) as
shown in equation (1).
(
)
σ th = σ γth × σ cal σ γcal ....................................................... (1)
It should be noted, that in both cases the resolved resonance
region, if available in the capture reaction, is adopted between
10-5 eV and EH. An illustration of the use of this approximation
is shown in Figure 2. The original EAF-2003 data contained a
simple 1/v component joined to the model calculation at 1
MeV. For TALYS-5a a 1/v component is joined to the
statistical calculation at 3 keV. In EAF-2005 the resonance data
from the 39K(n,γ) reaction is joined to the TALYS-5a data at
300 keV (EH) to give a improved description of the reaction.
User manual: Issue 8, March 2010
CCFE Fusion
SAFEPAQ-II
218
1.0E+00
1.0E-01
Cross section (b)
1.0E-02
Systm
Sys20
IFJ65
NZW67
HAM60
HAM58
OTC61
FRK64
HAM62
RIC61
1.0E-03
1.0E-04
1.0E-05
1.0E-06
1.0E-07
1.0E-08
1.0E-09
1.0E-041.0E-031.0E-021.0E-011.0E+001.0E+011.0E+021.0E+031.0E+041.0E+051.0E+061.0E+07
6.0E+07
Energy (eV)
Final
Figure 2. Data for
and TALYS-5a.
39
TALYS-5a
EAF-2003.0
K(n,α) in EAF-2003, EAF-2005 (Final)
In cases where no experimental information is available for
either the (n,γ) or (n,p), (n,α) reactions, the complete TALYS
calculation is adopted. The (n,γ) thermal cross section is
estimated from the crude systematic developed in reference 4.
References
[1] Yu. I. Popov and F. L. Shapiro, ZETF, 40, 1610, 1961.
[2] H. A. J Van der Kamp and H. Gruppelaar, ‘Documentation
RCN-2 evaluation on 58gCo and 58mCo’, FSR-Gr-35 parts 50,
51 (April 1981).
[3] A. J. Koning, S. Hilaire and M. Duijvetsijn, ‘TALYS – A
nuclear reaction code, User Manual’, p. 95-97 in Section 4.9,
to be published.
[4] J. Kopecky, M.G. Delfini, H.A.J. Van der Kamp and H.
Gruppelaar, ‘Revisions and extensions of neutron capture
cross-sections in the European Activation File EAF-3’, ECNC-051, July 1992.
CCFE Fusion
User manual: Issue 8, March 2010
SAFEPAQ-II
219
Acknowledgements
The development of EAF and the production of this
documentation have been supported by the United Kingdom
Engineering and Sciences Research Council and the European
Communities under the contract of Association between
EURATOM and CCFE, and were carried out within the
framework of the European Fusion Development Agreement.
The views and opinions expressed herein do not necessarily
reflect those of the European Commission. The assistance of J.
Kopecky (JUKO Research) in the development and testing of
SAFEPAQ-II is gratefully acknowledged.
Disclaimer
Neither the authors nor CCFE accept responsibility for
consequences arising from any errors either in the present
documentation, the EAF libraries or in the SAFEPAQ-II code.
Contact person
Feedback on the use of EAF and SAFEPAQ-II is welcomed.
Please contact Lee Packer with comments or in case of
problems.
L W Packer
EURATOM/CCFE Fusion Association
D3/1.92 Culham Science Centre
Abingdon
Oxfordshire OX14 3DB
Tel: +44 1235 466458
Fax: +44 1235 466435
e-mail: [email protected]
Internet: www.fusion.org.uk/easy20107
User manual: Issue 8, March 2010
CCFE Fusion