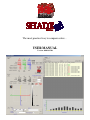
1
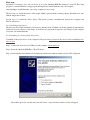
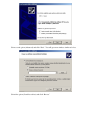
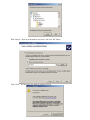
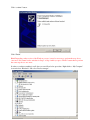
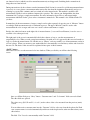
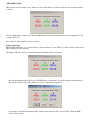
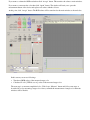
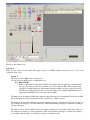
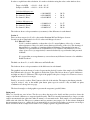
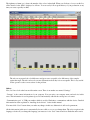
Engineering Arts Center
RGB Plus
The most practical way to compare colors…
USER MANUAL
Version: 090616.1508
This manual explains the “ShadeArt RGB Plus” color measurement and comparing software
Before start:
Minimum computer requirements tu run ShadeArt RGB Plus are as follows.
512 Mb RAM
50 Gb HardDisk
CD driver
Color monitor with 1280x1024 pikxel resolution
Video card with 1280x1024 pixel resolution
Windows Me, Xp, NT, 2000 operating system
1 free USB port
Keyboard
Mouse
Color printer
Dear customer,
We congratulate you for your choice to be a member of ‘ShadeArt family”. You can now start to overcome the color
related problems one-step ahead. You are going to understand what we mean once you read this manual and you are
proud of you.
Before starting to explain ShadeArt, we strongly remind to visit official web site www.artoksi.com of the owner of
ShadeArt, ‘Artoksi Engineering Arts Center, perodically. This helps to catch new improvements which may your
life easier.
Besides, we espacially take your notice to another state-of-art product which gets impressive feedbacks from all
over the world. We call this product “Color Calculation Treasure”. This product lets the people to write a color
matching software without knowing how to do. Interesting? We say, “do not think you can not succeed. Be
independent!”. You can get detailed informations on our web site www.artoksi.com.
Finally, we wish to inform that, we always need your suggestions and friendship. We would be very glad if we
could have any asistance on your achiveness.
Wellcome…
Best regards,
Saygılarımızla,
Engineering Arts Center
First step:
Installation of software is easy. All you need to do is to run “ShadeArt RGB Plus Setup.exe” from CD. This setup
program is a standard Windows setup program which perfectly installs ShadeArt onto your computer.
After finishing to install ShadeArt, you need to complete two more steps.
The first step is to install the drivers of the dongle which is given with the software package. ShadeArt never runs
without dongle and its driver.
Second step is to install the device drivers. This drivers provide communication between the computer and
PenColorArt device.
Job 1: Installing dongle drivers
The necessary file for this installation is Unlock.exe which is in the CD. Run it by double clicking. It automatically
installs all necessary drivers for the dongle. You will need to plug in the dongle into any USB port of the computer
every time you run the ShadeArt.
Job 2: Installing color measurement device driver
Caution! Connect the device to the computer USB port but do not turn on the device before installing device
drivers first.
Step 1: Connect the device into any USB port of the computer. Never turn it on!
Step 2: Insert the ‘ShadeArt RGB Plus’ CD in CD driver.
Step 3: New hardware found wizard will automatically launch and a window similar to below will be displayed
Select third option (No, not this time) and click “Next”. A new windows similar to below will appear
Select second option (Advanced) and click “Next”. You will get a new windows similar to below.
Select first option (Search best driver) and click “Browse”
Find “Drivers” directory in thiswindows and clicl it and click “Ok” button.
Click “Next”. You will get a new windows similar to below.
Click “continue” button.
Click “Finish”.
Note! Depending on the version of the Windows you use, it may be necessary to perform the steps above
ones more. If it returns back to windows in Step 3 or Step 4 when you press “Finish” button then re-perform
the same steps above ones more.
In order to test that everything is well done you can follow below procedure. Right click to “My Computer”
icon and select “Hardware” and select “Device manager”.
In this windows, there should be no warning sign (Exclamation or question mark) at the item of
“Communication ports (COM ve LPT)” in the device list. You should also see item like “USB Serial Port” or
“USB HighSpeed Serial Port” benzeri bir ifade görmelisiniz. This refers installation is well done.
P.S: That item has also a suffix in pharantesis showing the serial channel number. In the sample screen
above it is (COM8). Number 8 is the communicatrion channel number which will be used by ShadeArt
to communicate with the device ‘PenColorArt”. Find your own channel number and keep in your mind
this number. You will need it later.
Using ShadeArt RGB Plus
When you first run ShadeArt, you are going to encounter following screen. This screen will appear only once when
you run ShadeArt first. It will not be showed up at later running.
Select the language you wish to use and the modal of the color measurement device and communication port
number and click “Ok”
The rest of this manual has been prepared according to language is set to “English”.
Once you entered desired information and click “Ok” button, it will be saved for later use and a welcome
screen will appear.
Clicking any place on this window will take you to main windows as follows.
Let’s explain the features in this window.
As you notice the screen is divided into two portion as left and right.
There are 7 buttons on the left side as follows
And 1 button on the right side as follows.
The buttons at the first row are for “target” and the second row are for “sample” operations.
The purpose of these buttons are as follows.
“Automatic” button:
There are two measurement to take measurements in ShadeArt RGB Plus. These are called as “Automatic” and
“Manuel”. This button is used for switching between this two modes. When you switched to automatic mode, the
two buttons below it (which is used for manual measurement) are disappeared. Switching back to manual mode
brings these two buttons back.
During automatic mode, the software scans the instrument (PenColorArt) in a nested loop if the measurement button
is pressed. As soon as detect a measurement taken retrives the data from the instrument automatically and goes to
scanning loop again. This continues until you switch on back to manual mode. This method is usefull to take
measurements rapidly in serious without computer side operation. The software can distinguish the data from
instrument if it is a target or sample measurement. For more information about “How to take target/sample
measurement with PenColorArt” please refer to instrument’s manual also. This manual is also included in the CD
you have.
In manual mode, the measurements of target or sample can be taken separately by pressing one of “Measure” button
accordingly. Each measurement needs a confirmation process. The upper “Measure” button is used to take
measurement the color as target and lower one is used to take measurements as sample.
Besides, the other four buttons at the right side of measure buttons ( 2 save and 2 recall buttons) is used to save or
recall the colors taken previously.
The right panel of the screen is automatically built by the software as long as you take measurements of
target/sample colors. When you take a target measurement a list with one row is appeared in this area and extends as
long as you take the measurements. We call this area as “History” and very usefull to see all measurements results in
a list at a glance. When you measure a new standard the list is automatically saved in history archive and cleared for
the new one. The detais of this area will be explained in later parts of this document.
“SAVE” button
This buton is used to save the measured color into database. When you click it you will have the following
screen.
Once you fill the fileds press “Okey” button. “Customer name” and “Color name” fields can not be blank.
The other fields are optional.
The values at top (R, G, B and L*, a* ve b*) are the values of the color measured from the previous (main)
screen.
You can either write a customer name into the “Customer” field or select one from the dropdown list. Each
new customer name is recorded automatically and shown in the dropdown list at the next time when you use
this window.
The field “User” has also same mentality with “Customer” field.
“RECALL” button
This button is used to retrieve the color saved before. When you click this button you will be directed to a
screen similar to below.
This window consist of all previously recorded colors and is sorted according to “Date/Time” column
initially. You can also change the sorting criteria by clicking the options just below this list. The sorting
method can be any of “Date/Time”, “Customer”,”Color Name”, “Color Code” or “User” column. The
sorting direction is always ascending.
When you click on a row you will be prompted a menu with 2 items as follows.
The items of this menu have following functions
SELECT: The color values (R-G-B and L*-a*-b*) of the selected row is retrieved and transfered to main window
as Target or Sample.
DELETE : The color of the selected row is removed from databe.
“MEASURE” button:
This button is used to measure a color. When you click on this button you will be directed to the measuring window
as follows.
Press measuring button of the device. The result (RGB values) will be automatically retrieved and displayed by the
software. That’s all.
Let’s explain it with a scenario similar to real life.
Sample application:
Run ShadeArt RGB plus, go to main window, connect the device to the USB port of the computer and perform
white calibration process properly.
Click upper “Measure” button to measure the target. Measuring window will appear.
Press the measuring button of the device. The RGB values of measured color will be displayed automatically in
the window. At the bottom of this windows, you will see three buttons appeared
If you want to cancel the measurement and get back to main windows click “Cancel” button. Then the RGB
values will be omitted.
If you want to evaluate the RGB results then click “Accept” button. This transfers the values to main windows.
If you want to re-measure the color then click “Again” button. The window will wait you to press the
measurement button of the device and replace new values with the old ones.
At this point, click “Accept” button. The RGB values will be transferred to the main window as shown below.
In this screen you can see followings
•
•
Transferred RGB values of the measured target color
Calculated L*a*b* [CIELab (D65-10)] values of the measured target color.
The next step is to measure sample/trial color. Click lower “Measure” button and follow same steps as
described above for measuring a target color. Once you finish the measurement of sample color the main
windows will be like this.
What does this windows say?
Left panel:
There are two sections in this panel. The upper section is for RGB evaluation and lower one is for L*a*b*
evaluation of the colors.
Section 1:
The first row shows RGB values of target color.
Second row shows RGB values of sample/trial color.
P.S: What is RGB?
RGB is a abbreviation of the initials of Red, Green, Blue. This also indicates a standard which
says any color can be produced as a mixture of 3 color Red, Green, Blue. This is main stnadrt
especially on digital technology. Each channel (Red-green-Blue) can have a value between 0255. The more value the more color of its relevant channel. For example RGB=0-0-0 means an
ideal black and RGB=255-255-255 means an ideal white.
The third row shows numerical differences between sample and target for each channel .Please keep in mind
that all the differences and assessment should be considered as “sample to target”.
The forth row shows rational differences between sample and target for each channel. The values in this row
are calculated according to %absolute differences. This means that the percentage is calculated according to
255 steps full range.
The fifth row shows rational differences between sample and target for each channel. The values in this row
are calculated according to %relative differences. This means that the percentage is calculated according to
an acceptance that the range is not 255 but it is target color channel value.
In order to explain better this calculation, let’s make a calculation using the values on the window above.
Target color RGB
Sample color RGB
= 128.12 – 93.91 - 211.47
= 126.11 – 94.19 - 212.36
%absolute differences are;
For cahannel 1 (Red)
For channel 2 (Green)
For channel 3 (Blue)
= 2.01*100/255
= 0.28*100/255
= 0.89*100/255
=
=
=
%0.79
%0.11
%0.35
%relative differences are,
For cahannel 1 (Red)
For channel 2 (Green)
For channel 3 (Blue)
= 2*100/128.12
= 2*100/93.91
=2*100/211.47
=
=
=
%1.57
%0.30
%0.42
The sixth row shows oral representations (assessments) of the differences in each channel.
Section 2:
First row shows target color L*a*b* values under illuminant D65 and 10 degree observer.
Second row shows sample/trial color L*a*b values and 10 degree observer.
P.S: What is L*a*b*?
L*a*b* is another standard to evaluate the colors. L* means lightness of the color, a* means
redness/greenness of the color and b* means blueness/yellowness of the color. The advantage of
this standard is to capability of simulating different illuminants. This standard is known as
CIELab color space and the most used method for color evaluation. The difference of L*a*b*
values of two colors (say target & trial) is named calculated by a special method and presented
in DeltaE.
It’s accepted that an average human eye can not detect any difference between colors which has
DeltaE less then 1.
The third row shows L*, a* and b* differences and DeltaE value.
The forth row shows oral representations of the differences in each channel.
The graphical area at the bottom of section 2 represents the physical location of the sample color in CIELab
three dimensional color space. The graphic is divided into 2 parts. The left one shows a* and b* differences
and right one shows L* differences. The origin of the graphic is the place of target color. The more closer to
origin the more closer color to target.
Finally, you can also see three “Print” button at left side of the window. The upmost print button prints the
report in section 1 only, at the middle print button prints report in section 2 only and third one prints
combination of both report in one page.
The dotted rectangles on both graphics represents the acceptance (pass/fail) limits.
Right panel:
There is a list with two rows in here. The first row shows the target color details and the second row shows the
sample color details (differences to target and pas/fail results). This list is extended automatically as long as you take
sample measurements time after time either in manual or in automatic mode. Each sample color measurement is
added at the and of this list. This process continues until you measure a new target color. As the software distinguish
the measurement is target or sample, the list is automatically is saved and cleared when you measure a new target.
Below screenshot shows a sample screen with 11 color (sample) against 1 target measurement.
At the top of this list there are two information also. The bulk number is automatically created by the software each
time you start with a new target color. Bulk numbers are consecutive numbers. At top right of this list, “average
DeltaE” of this bulk can also be seen.
At the bottom of this list a graphical representation of this bulk can also be seen.
History button:
As we mentioned above, the list at the right panel is saved and cleared automatically by the software once you
measured a new target. History button is designed to recall any of these bulks at any time.
When you press history button, a screen similar to below is displayed.
The rightmost column (pcs.) shows the number of the colors in that bulk. When you click any of a row on this list,
all the details for the bulk is displayed as follows. You can easily follow up the history of your production at any
time you want, especially in shifts.
The red rows represent bad color differences and green rows acceptable color differences of the samples
against the target. The red row has also an extra information about why it is not acceptable. This is very useful
for the operator to take correct actions for the problem.
Others:
Now, let’s have look at the bottom of the main screen. There is an another area named “Settings”.
“Contacts” is the contact information of your company. You can write your company name and web site in this
areas. This information is used in printer report. It is automatically added at the end report as a footnote.
“Communication port” is USB port number which is used by ShadeArt to communicate with the device. Detailed
information has been explained in “installing device drivers” section in this manual.
You must click “Save” button when you make any changes in this area. Otherwise it will not be permanent.
All the information in this area is automatically become valid as soon as you change them. The only exception is the
language selection. If you change the language you must save it via “Save” button and close ShadeArt and re-run it.
ShadeArt has two languages embedded. On the other hand, ShadeArt can talk with any language. If you need such a
case, you must select language as “User” and the fill user column of the Access file named “abc.mdb”. This file is
located in the directory you installed ShadeArt. It is strongly recommended to back up this file before making any
modifications in it.
Our company, Artoksi Engineering Arts Center, is being improving the products day by day. So, it is advised to
visit our web site www.artoksi.com from time to time. You may find something new which makes your life more
comfortable.
Enginnering Arts Center
www.artoksi.com
[email protected]
Fax: +90 216 481 03 71