1
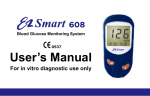
USER GUIDE
EZ Smart 608
For DIACHEX Series Blood Glucose Monitoring System Use
DIACHEX + Series
Manufacturer:
Authorized representative in the EU:
Tyson Bioresearch, Inc.
Medical Device Safety Service GmbH
5F. #22, Ke E. Road III, Science-Based
Schiffgraben 41, D-30175 Hannover,
Industrial Park Chu-Nan 350,
Germany
Miao-Li County, Taiwan, R.O.C.
TEL: +49 511 62628630
TEL: +886 37 585998
TysonBio Link Health Management System
Table of Contents
Introduction…………………………………………………………………………..…3
Welcome……………………………………………………………………..………3
About this software………………………………………………..……….………..3
About this guide…………………………………………………………..………….3
About the product packing……………………………………………………..…...3
Starting TysonBio Link Health Management System…………………..………..4
System and Equipment Required………………………………………………….4
Software Installation………………………………………………………………..…4
Install the TysonBio Link Health Management System software………………4
Install the USB cable driver…………………………………………………..……6
Re-install USB cable driver………………………………………………………7
Cancel Installation…………………………………………………………………..7
Using TysonBio Link Health Management System………………………………8
Software interface……………………………………………………………….…..8
Main function bar……………………………………………………………….…..9
Main toolbar…………………………………………………………………………9
Meter………………………………………………………………………………...10
Reports……………………………………………………………………………11
Tools…………………………………………………………………………………11
Help…………………………………………………………………………………11
Transferring meter results to the computer…………….………………………..12
Setting meter to PC-Link mode………………………….………………………..12
Connecting meter to the computer……………………………………………….13
Starting the transfer………………………………………………………………..13
Setting User Information………………………………………………………….…14
Main function icon………………………………………………………………….14
Choosing user ID…………………………………………………………………..15
Add new user……………………………………………………………………….15
Delete user………………………………………………………………………….16
Edit user information……………………………………………………………….17
Viewing your test result and report……………………………………………..18
Setting target glucose value……………………………………………………..18
Report setting………………………………………………………………………19
Testing result………………………………………………………………………19
Pie Chart report……………………………………………………………………20
Average report…………………………………………………………………….22
Line Chart report…………………………………………………………………..23
Hourly Average report……………………………………………………………24
Test Frequency report……………………………………………………………25
Distribution report…………………………………………………………………26
-1-
TysonBio Link Health Management System
Average Summary report………………………………………………………...27
Print preview……………………………………………………………………….29
Clear Meter Memory…………………………………………………………………30
Help…………………………………………………………………………………..…30
Software Uninstallation………………………………………..………………........31
Uninstall software…………………………………………………...……………...31
Uninstall USB cable driver…………………………………………………………32
Troubleshooting………………………………………………………………………33
Installation problem…………………………………………………………………33
Meters and data transfer problem………………………………………………...33
Printing problem…………………………………………………………………….35
Screen image problem……………………………………………………………..35
Other problem……………………………………………………………….………36
-2-
TysonBio Link Health Management System
Introduction
Welcome
Thank you for choosing TysonBio Link Health Management System.
You will quickly recognize your blood glucose level by TysonBio Diabetics
Management Software.
About this Software
“TysonBio Link Health Management System” is a tool enables you to transfer
your test results from the EZ Smart 608 / DIACHEX serious / DIACHEX +
serious Glucose Meter to your computer to help you manage your diabetes.
You can review, manage, analysis and document your test results and make
better decisions through the clearer information. The characteristic of this
software is:
Multiple Users Management Platform
Automatic Transferring of Data to PC
Automatic tracking of average day/weeks/months trends and statistics
Easy to read and printable several types of reports and statistics
About this Guide
This guide contains information about using the commands and features of the
“TysonBio Link Health Management System”. It is strongly recommended that
you read the whole guide before using to ensure smoothly operating. Please
keep this guide for future reference.
Throughout this guide, operating items are denoted in bold font as this
example: “Take the window of Main Menu and Add User for example”. The
section of instructions is denoted in bold italic font.
About the Product Packing
The TysonBio Link Health Management System product contains the
following items:
One TysonBio Link Software CD (option)
One USB cable
User’s Manual (included in CD disk)
Note:
1. Contact your dealer immediately if any items are missing, appear
damaged, or if the CD-ROM does not work.
2. For the package without CD disk, please visit website: www.tysonbio.com
to download the software and user’s manual.
-3-
TysonBio Link Health Management System
Starting TysonBio Link Health Management System
System and Equipment Required
Supported EZ Smart-608 / DIACHEX serious / DIACHEX + Serious
Blood Glucose Monitoring System.
A PC/Notebook which have followed specifications:
Microsoft® Windows®2000/XP
Minimum 100 MB of free hard disk space or more
Intel® Pentium® III 850 MHz processor or better
Minimum 128 MB of RAM or better
USB 2.0 port
Mouse and Keyboard
Printer (Optional)
Note:
1. If there is no USB 2.0 port in your PC/Notebook, please contact your dealer
for suitable adapter.
2. Printer is optional depending on printing measured data or not. Refer to
“Print Preview” for instructions.
Software Installation
2 items have to be installed:
(1) Install the TysonBio Link Health Management System software
(2) Install the USB cable driver
You can install the software through the TysonBio Link CD or download the
software from the website first then install it.
Install the TysonBio Link Health Management System software
1. Open CD-ROM drive and put in
“TysonBio Link CD with picture side
upward.
2. Put CD-ROM drive back and the CD will
start auto-run.
Note:
Refer to “Troubleshooting” to get help if
CD does not auto-run.
-4-
TysonBio Link Health Management System
3. After the TysonBio Link_V1.1.exe
display, click it to bring up the
welcome window.
Note:
If you will Install the software from the
downloaded software, direct click TysonBio
Link_V1.1.exe to start installation and follow
the same instructions below.
4.Click
(Default Setting) to start
installing program files.
:Refer to “Cancel Installation”
to see further information.
5. The TysonBio Link Software will be
installed successful after progress bar
showing 100% installed. Then click
to start installing the USB cable
driver.
1. Status: Show the status of installing program files.
2. Progress Bar: Show the progress of installing from 0% to
100% (installation fully completed).
3. Back button: Back to last step. This button will be workable
after installation fully completed.
4. Next button: Click to start installing USB cable driver. This
button will be workable after installation fully completed.
5. Cancel button: Cancel installing software. Refer to “Cancel
Installation” to see further information.
Note:
1. It may damage CD reading if putting
wrong CD side into CD-ROM drive.
2. It may damage CD-ROM data if click
during installing.
-5-
TysonBio Link Health Management System
Install the USB cable driver
1. A box shows the process and jump to
next step when 100% completed.
2. Click
(Default Setting) to
start installation.
:The button is locked.
:Refer to “Cancel Installation”
to see further information.
3. Click
to finish and close
installation window.
:The button is locked.
:The button is locked.
-6-
TysonBio Link Health Management System
Re-install USB cable driver
If you had installed USB driver before, the re-install program will auto-run after you
finishing the installation of the software and USB cable driver. The Setup Type box will
appear.
1. Three items to choose:
A. Re-Installation(Upgrade)
B. Uninstall driver!
C. Exit Setup!
2. Click
to continue after making choice.
:The button is locked.
:Refer to “Cancel Installation” for further
instructions.
Either you click Item 1-A or Item1-B, a finish box will
show up and there are two items of restarting the
computer for your choice:
(1) Yes, I want to restart my computer now.
(2) No, I will restart my computer later.
Then click
to finish re-installation.
&
are locked.
If you click Item 1-C, it will exit setup and close the box.
Note:
If it is first time you install the USB driver, you can ignore
USB re-installation and click Item 1-C to exit setup.
Cancel installation
If you click
will show up.
Click
Click
during re-installing the USB cable driver, the window of exit setup
(Default Setting) will back to installing process.
will exit setup and end the installation.
-7-
TysonBio Link Health Management System
Using TysonBio Link Health Management System
Software interface
No
FUNCTION
DESCRIPTION
1
Main Function Bar
Main functions of this software
Refer to “Main function bar” for further instruction.
2
Main Tool Bar
Hotkeys for setup and operation.
Refer to “Main tool bar” for further instruction.
3
Blood Glucose Data
Show blood glucose test results.
4
User Information
Show user’s information and modify user setting.
Refer to “Setting User Information” to find further
operation
-8-
TysonBio Link Health Management System
Main function bar
No
FUNCTION
DESCRIPTION
1
Meter
Meter Settings.
Refer to “Meter” for details.
2
Reports
Measured data reports.
Refer to “Reports” for details.
3
Tools
Glucose Setting, report setting and Meter type setting.
Refer to “Tools” for details.
4
Help
Show software information.
Main tool bar
No
FUNCTION
DESCRIPTION
1
Connect
Connecting the Glucose Meter with
computer by USB cable.
2
Load data
Transferring Meter results to the
computer.
3
Clear Memory
Clear Meter results.
4
Testing Results
Show testing data loading from meter.
5
Pie Chart
Show glucose value field.
6
Average
Show measured data with track and
weekly.
7
Line Chart
Daily glucose average value.
8
Hourly Average
Hourly glucose average value.
-9-
Refer to
“Transferring
meter results to
the computer” for
further instruction.
Refer to “Viewing
your test result
and report” for
further instruction.
TysonBio Link Health Management System
9
Test Frequency
Showing test average
different Track.
results
in
10
Distribution
Times of test average data.
11
Average Summary
Summary of track, daily, 10days and
raw days.
12
Print preview
Print reports.
13
Help
Software information.
Meter
No
FUNCTION
DESCRIPTION
Add/Edit/Delete user data
1
User
2
Connect
Connect with PC. Refer to
3
Load Meter Data
Load data from meter. Refer to
4
Clear Memory
Clear Meter results. Refer to
5
Exit
Exit Meter setting.
Refer to “Setting User Information” for details.
- 10 -
for more information.
for more information.
for more information.
TysonBio Link Health Management System
Report
No
FUNCTION
DESCRIPTION
1
Test Results
2
Pie Chart
3
Average
4
Line Chart
5
Hourly Average
6
Test Frequency
7
Distribution
8
Average Summary
9
Print preview
Refer to
for
further information
Tools
No
1
FUNCTION
DESCRIPTION
1. Change target value and
report setting meal time
setting. Refer to
“Viewing your test
result and report” for
details.
Options
Help
No
1
FUNCTION
About
DESCRIPTION
Check software information.
- 11 -
TysonBio Link Health Management System
Transferring meter results to the computer
Setting meter to PC-Link mode
EZ Smart 608
2
1
3
1. Press M for 3 seconds to enter meter setting mode.
2. Keep pressing and releasing M button to pass through time setting until PC link
setting appear.
3. Press S button (yes) to enter PC link mode, the “PC” will appear on the display.
DIACHEX / DIACHEX + Series
2
3
4
5
1
1. Press M for 3 seconds to enter meter setting mode.
2. Keep pressing and releasing M button to pass through time setting until alarm setting
appear.
3. Press S button to pass through alarm setting and HI-LO alarm setting will appear.
4. Press M button to pass through HI-LO alarm setting and bring up PC link setting.
5. Press M button (yes) to enter PC link mode, the “PC” will appear on the display.
Note:
Please refer to your Glucose Meter User’s Manual for more details about meter
setting.
- 12 -
TysonBio Link Health Management System
Connecting meter to the computer
1. After you setting up the meter to PC link
mode, connect one end of the cable to
the serial port on the computer then
connect the other end of the cable to
the data port on the meter.
2. Press recent on the desk to execute the
software.
3. Click main toolbar
icon to start
connecting. System will detect Meter
model automatically and show if the
connection is successful.
Starting the transfer
1. Click main toolbar
icon to start
transferring meter results to the
computer. Click Run button when
loading process till 100%.
Important:
If more than one user is using the software, remember to select user from “User
Information” before transferring meter results. Please refer to section “Setting
User Information” for details.
- 13 -
TysonBio Link Health Management System
Setting User Information
Main function icon
Press “User Modify” to open user
information setting.
User List box:
1. Select and show User ID in using.
2. Corresponding to User ID.
3. Add new user data.
4. Delete a user and data.
5. Edit user information.
6. Finish setting.
7. Show user’s photo.
- 14 -
TysonBio Link Health Management System
Choosing user ID
1. Click
in User Information Area
to quick setup user data.
2. Click
to choose if user ID is more than
one. The selected user record will be
opened.
Note:
Make sure you choose the right user ID
before you transferring meter.
Add new user
1.
Click
in User Information
Area to quick setup user data.
2. Click
to open Add User box.
3. Key-in user’ name in column of Name:
4. User’s ID is given.
5.
Click
files from disk.
6.
Choose a photo file and click
Click
- 15 -
to open user’s photo
to close the box.
TysonBio Link Health Management System
7. The photo opens in Planel1 area.
8. Move blue frame to edit photo size.
9. Click cursor to confirm photo editing.
to finish setting and close
10. Click
window.
Delete user
1. Click
in User Information
Area to quick setup user data.
2. Click
up.
3. Click
Click
- 16 -
and information box show
to delete user data.
to cancel delete.
TysonBio Link Health Management System
Edit user information
1. Click
in User Information
Area to quick setup user data.
2. Click
show up.
and the information box will
3. Edit User’s name in column of Name:
4. User’s ID is given.
5. Follow “Add a new user” step 4 to step 9
to edit photo.
6. Click
window.
- 17 -
to finish setting and close
TysonBio Link Health Management System
Viewing your test result and report
Setting target glucose value
You can set personal target glucose value and meal time to help you viewing
results more understanding.
1. Press
on the desk.
of User Information
At Glucose sheet you can set:
1. Target value setting
For glucose value field settings(mg/dL)
Hypoglycemia
Pre-meal
Post-meal
2. Meal time
For meal time setting(24 hr)
Pre-Breakfast/Post-Breakfast
Pre-Lunch/Post-Lunch
Pre-Dinner/Post-Dinner
Bedtime
Click
to confirm new setting.
Click
to cancel setting.
Note: The information you set will show in the
result sheet and affect report display.
- 18 -
TysonBio Link Health Management System
Report setting
3. Data Interval
Test results testing during this time period
will be displayed.
From : year/month/date
To: year/month/date
4. Average Summary
Starting Date: year/month/date
Number of days
5. Choose unit of test results to display
mg/dL
mmol/L
Click
to confirm setting.
Click
to cancel setting.
Testing result
Click main toolbar
icon and blood
glucose test results transferring from meter
will show.
Column Items(From left to right) :
1. Date: The day you do the test.
2. Week: The week you do the test.
3. Time: The time you do the test.
4. Track: Show meal time.
5. Type: The type of test you do.
6. Value: Test result.
7. Other and Event: For you to memo
information at these two columns.
Note: User only can enter memo, notice and comments to “Other” and “Event”
fields, such as meal, excise, note and so on.
Printing the data sheet
Click main toolbar
icon or choose “ Report ” then click “ Print Preview” to
print the report. Refer to “ Print Preview ” for instructions.
- 19 -
TysonBio Link Health Management System
Pie Chart report
The pie chart display the percentage of blood glucose test results that fall below
the hypoglycemia or fall outside the target blood glucose value.
Click main toolbar
report.
icon or choose “Meter” then click “Pie Chart” to display
Symbol
Meaning
Red
Blood glucose test results fall below hypoglycemia limit.
Green
Blood glucose test results are within normal range.
Blue
Blood glucose test results are higher than normal range.
Pre-Breakfast / Post-Breakfast
Pre-Lunch / Post-Lunch
- 20 -
TysonBio Link Health Management System
Pre-Dinner / Post-Dinner
Bedtime
Total Target Pie
Printing the report
icon or choose “Reports” then click “Print Preview” to
Click main toolbar
print the report. Refer to “Print Preview” for instructions.
- 21 -
TysonBio Link Health Management System
Average report
The Average display pre / post meal average and cumulative weekday average
result for the current time range.
Click main toolbar
to display report.
Symbol
icon or choose function bar “Reports” then click “Average”
Meaning
Red line
Hypoglycemia limit.
Blue line
Post meal high limit.
Test result average.
Pre and Post meal average
X-coordinate :
PreBr/PosBr/PreLu/PosLu/PreDi/PosDi/BedTi
Y- coordinate : Glucose(mg/dL or mmol/L)
Cumulative weekday average
X-coordinate : Mon/Tue/Wed/Thur/Fri/Sat/Sun
Y- coordinate : Glucose(mg/dL or mmol/L)
Printing the report
Click main toolbar
icon or choose “Reports” then click “Print Preview” to
print the report. Refer to “Print Preview” for instructions.
- 22 -
TysonBio Link Health Management System
Line Chart report
The Line Chart display daily blood glucose test result for the current time range.
Click main toolbar
icon or choose function bar “Reports” then click “Line
chart” to display report.
Symbol
Meaning
Red line
Hypoglycemia limit.
Blue line
Post meal high limit.
Green line
Blood glucose test result.
X-coordinate : Date
Y- coordinate : Glucose(mg/dL or mmol/L)
Printing the report
icon or choose “Reports” then click “Print Preview” to
Click main toolbar
print the report. Refer to “Print Preview” for instructions.
- 23 -
TysonBio Link Health Management System
Hourly Average report
The Hourly Average displays the average of blood glucose test results of each
hour for the current time range.
Click main toolbar
icon or choose function bar “Reports” then click “Hourly
Average” to display report.
Symbol
Meaning
Red line
Hypoglycemia limit.
Blue line
Post meal high limit.
Purple blot
Hourly blood glucose test result average.
X-coordinate : Time
Y- coordinate : Glucose(mg/dL or mmol/L)
Printing the report
Click main toolbar
icon or choose “Reports” then click “Print Preview” to
print the report. Refer to “Print Preview” for instructions.
- 24 -
TysonBio Link Health Management System
Test Frequency report
The Test Frequency displays the cumulative pre and post meal test frequency.
Click main toolbar
icon or choose function bar “Reports” then click “Test
Frequency” to display report.
Symbol
Meaning
Test frequency
X-coordinate
:
PreBr/PosBr/PreLu/PosLu/PreDi/PosDi/BedTi
Y- coordinate : Glucose(mg/dL or mmol/L)
Printing the report
icon or choose “Reports” then click “Print Preview” to
Click main toolbar
print the report. Refer to “Print Preview” for instructions.
- 25 -
TysonBio Link Health Management System
Distribution report
The Distribution displays the blood glucose test result distribution.
Click main toolbar
icon or choose function bar “Reports” then click
“Distribution” to display report.
X-coordinate
:
PreBr/PosBr/PreLu/PosLu/PreDi/PosDi/BedTi
Y- coordinate : Testing result count
Printing the report
Click main toolbar
icon or choose “Reports” then click “Print Preview” to
print the report. Refer to “Print Preview” for instructions.
- 26 -
TysonBio Link Health Management System
Average Summary report
The Average Summary display pre / post meal test result average and daily test
result average.
Click main toolbar
icon or choose function bar “Reports” then click
“Average Summary” to display report.
Symbol
Meaning
Red line
Hypoglycemia limit.
Blue line
Post meal high limit.
Test result average.
Track(Pre and Post Meals) Average
X-coordinate:
PreBr/PosBr/PreLu/PosLu/PreDi/PosDi/BedTi
Y- coordinate: Glucose (mg/dL)
Daily Average
X-coordinate : Date
Y- coordinate: Glucose (mg/dL)
10days Average
Column
:
Stat/PreBr/PosBr/PreLu/PosLu/PreDi/PosDi/Be
dTi
Row: Readings/Minimum/Maximum/Standard
Note:
The current time period can be set according to
your need. Refer to “Report Setting” for more
details.
- 27 -
TysonBio Link Health Management System
Raw Average
Column:
Date/PreBr/PosBr/PreLu/PosLu/PreDi/PosDi/BedTi
Row: Date
Printing the report
Click main toolbar
icon or choose “Reports” then click “Print Preview” to
print the report. Refer to “Print Preview” for instructions.
- 28 -
TysonBio Link Health Management System
Print preview
Click main toolbar
icon or choose “Reports” then click “Print Preview” to
open the print review window.
No
FUNCTION
DESCRIPTION
Resize the preview to fit
1-3
Zoom
Show the preview as full screen size
Show the preview as widest size.
Show the first page
Show last page
4-7
Page
Show next page
Show latest page
Print Setting
8-9
Print
Print
Save File
10-11
File
Open File
5
Close
Click to close window
- 29 -
TysonBio Link Health Management System
Clear Meter Memory
You can choose to clear Meter memory after transferring the meter results to the
computer.
Click main toolbar
icon or choose function bar “Meter” then click “Clear
Memory” to clear meter results.
1. Click
2. Click
3. Click
to open Information box.
to confirm delete action.
to finish and close box.
Help
Display the software information.
icon or choose function bar “Help” then click “About” to
Click main toolbar
display software information.
- 30 -
TysonBio Link Health Management System
Software uninstallation
Uninstall software
1. Click Start to see function list
2. Move cursor to highlight All Programs
and show next layer.
3. Move cursor to highlight TysonBio Link
and show next layer.
4. Move cursor to highlight Uninstall
TysonBio Link 1.1 and click to start
uninstalling process.
5. Click
to start uninstall
:Refer to “Cancel Installation”
to see further information.
6. The bar will show uninstall process from
0% to 100% as below:
Buttons are locked when uninstalling.
7. Click
to finish and close
uninstall window.
- 31 -
TysonBio Link Health Management System
Uninstall USB cable driver
1. Click Start to see function list.
2. Move cursor to highlight All Programs
and show next layer.
3. Move cursor to highlight PL-2303 USB
Serial Driver and show next layer
4. Click Uninstaller to start uninstalling
process.
5. A process bar show Tyson USB cable
(PL-2303) driver uninstall.
:Refer to “Cancel Installation”
to see further information.
6. A box shows up and there are two items
of restarting the computer for your
choice:
(1) Yes, I want to restart my computer
now
(2) No, I will restart my computer later
Click
window.
to finish and close the
and
- 32 -
are locked.
TysonBio Link Health Management System
Troubleshooting
This section lists potential problems you may have and supply the solutions to
solve it. If you cannot find the solution to your problem, please call Tyson
Bioresearch Inc. Customer Service at +886-37-585998.
Installation problem
Problem 1
TysonBio Link Health Management System software can not be installed.
Solution
Please check following items to solve problem:
Is there enough memory available for the installation?
Have you closed all programs before starting the installation?
Is there enough hard drive free of space? You can check with PC/NB spec.
Note: Refer to “System and Equipment Required” for details.
Problem 2
You are unable connect Glucose Meter to the computer.
Solution
Please check following actions:
Restart the computer when fist time install.
Please check if the PC Link cable has already been connected to meter
and the computer USB port appropriately.
Try to uninstall and re-install TysonBio Link Health Management System
again to solve the problem.
Meters and data transfer problem
Problem 1
When you try to transfer meter results, you get the Message : “Fail to initialize
Connection!”
Solution
Check whether all requirements have been met:
- 33 -
TysonBio Link Health Management System
Are you using the correct cable?
Is the cable connected properly to both the computer and the meter end?
Is the cable undamaged?
Has the meter been prepared for communication status? If not, Please let
meter entry “PC” mode.
Is the meter battery fully charged?
Is the meter supported by TysonBio Link Health Management System
software? Refer to your Glucose Meter Manual for more information.
Problem 2
When you click a report type in the View Reports screen, no readings appear
in the report.
Solution
Make sure the Date interval you set includes the test date of the missing test
results. Reset the Date interval to include the date period of all testing results
to avoid test results missing in the report.
Problem 3
There are readings in the meter memory that do not appear in the reports.
Solution
Some readings, like Control Solution records, will not appear in reports
(except Data List and Data Source Reports and the Daily Details screen).
Make sure the Date interval you set includes the test date of the missing
test results. Reset the Date interval to include the date period of all testing
results to avoid test results missing in the report.
- 34 -
TysonBio Link Health Management System
Printing problem
Problem 1
Reports are being cut off or shift in the printout.
Solution
Please check paper format is correctly? In the File menu, select the
command Print Setup and set the correct paper format and position.
Check the paper be put on right position and no shift on your printer.
Problem 2
Problem In a monochrome printout, the target range band of the analysis
graph masks all other elements and/or lines.
Solution
Check the color Ink status if it is not enough, please replace color ink.
Screen image problem
Problem 1
TysonBio Link Software fills only part of the screen.
Solution
The program is designed to screen at the standard 800 x 600 resolution.
Resizing the report screen is possible only when the screen resolution is
greater than 800 x 600.
Problem 2
The full report page doesn’t display on the screen.
Solution
Software is designed to provide full-page printed reports. To see the entire
report on screen, click the maximize button in the upper-right corner of the
application window. If the window is already maximized, use the scroll bars.
- 35 -
TysonBio Link Health Management System
Other problem
Problem 1
The program is running very slowly.
Solution
Check to see if you have other applications running. If so, quit those
applications. Large data sets can also slow the program down. If you have
accumulated a large amount of data, try reducing the date interval or
archiving some of the readings to improve performance.
The minimum recommended system memory needed to run TysonBio Link
Software is 128 MB.
The minimum recommended computer is an Intel® Pentium® III 850 MHz
processor or faster computer.
- 36 -