1
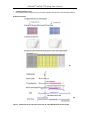
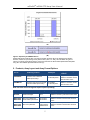
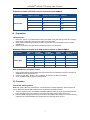
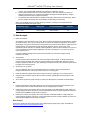
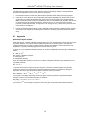
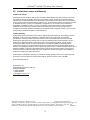
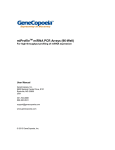
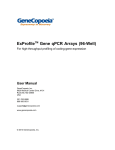
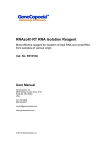
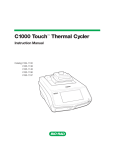
miProfileTM miRNA PCR Arrays (384-Well) For high-throughput profiling of miRNA expression User Manual GeneCopoeia, Inc. 9620 Medical Center Drive, #101 Rockville, MD 20850 USA 301-762-0888 866-360-9531 [email protected] www.genecopoeia.com © 2013 GeneCopoeia, Inc. miProfileTM miRNA PCR Array User Manual USER MANUAL miProfileTM miRNA PCR Array I. II. III. IV. V. VI. VII. Introduction Kit Components and Array Format Options Preparation Procedure Data Analysis Appendix Limited Use License and Warranty I. Introduction MicroRNAs (miRNAs) are small non-coding RNAs that regulate gene expression at the post-transcriptional level. Usually 21-23 nucleotides in length, miRNAs are important modulators in cellular pathways and are highly conserved in eukaryotic organisms. Irregularities in miRNA-regulated gene expression have been found to be associated with cancers, cardiovascular disorders and a variety of other diseases. The miProfile miRNA PCR Arrays are designed for profiling the expressions of pre-defined or customized sets of miRNAs in various tissues or cells. The resulting differential expressions of profiled miRNAs help researchers to identify those miRNAs that are of biological significance and importance relevant to their research. Each 384-well plate contains up to 360 pairs of PCR primers (forward: miRNA-specific primer; reverse: universal primer), which have been pre-validated and deposited in designated wells. Each plate also has 24 wells that contain different types of controls for monitoring the efficiency of the entire experimental process: from reverse transcription to qPCR reaction. The All-in-OneTM miRNA First-Strand cDNA Synthesis Kits (AMRT-0020, AMRT-0060) and qPCR Mix Kits (AOPR-0200, AOPR-1000, AOPR-4000) are the recommended RT-PCR reagents for use with the miProfile miRNA qPCR arrays. These reagents have been optimized to produce high sensitivity, efficiency, and specificity. The All-in-One reverse transcriptase mix contains a novel and optimized blend of polyA polymerase and reverse transcriptase in a buffer that allows high activities and maximal performances of both enzymes. In such reactions, the polyA polymerase adds poly-A tails to mature miRNAs to generate polyA miRNAs. In the same reaction, m-MLV RTase and a unique oligo dT adaptor primer (compatible with the PCR universal reverse primer pre-deposited in the miRNA plates) reverse-transcribe the polyA miRNAs. ® The All-in-One qPCR Mix containing SYBR Green is used to specifically detect the reverse-transcribed miRNA with the miRNA-specific forward primer and PCR universal reverse primer which are pre-deposited in the miRNA plates. Similar reagents from third-party vendors may be compatible for use. However, their uses are not supported. Using a universal real-time PCR condition, one can easily profile and analyze the miRNA expression in a high-throughput fashion. Small RNA is recommended as the input RNA to increase the specificity of detection, although use of total RNA can achieve similar results. Key advantages Genome-wide coverage, pre-arranged groups, or customized groups Largest genome-wide miRNA coverage Cancer-related groups Customized miRNA arrays for focused study Robust performance Sensitive – Detect miRNAs from as little as 10 pg of input small RNA or 20 pg of total RNA Specific – Capable of distinguishing miRNAs with single nucleotide mismatches. Each primer set has been experimentally validated for specific amplification Broad linearity – Allow miRNAs at different expression levels to be detected simultaneously 2 Reproducible -High reproducibility (R > 0.99) for inter-array and intra-array replicates 2 miProfileTM miRNA PCR Array User Manual Validated miRNA primers Each miRNA primer is designed using a proprietary algorithm and has been experimentally validated Protocol overview (A) (B) Figure 1. miRNA PCR array experiment work flow (A) and miRNA RT-PCR mechanism (B) 3 miProfileTM miRNA PCR Array User Manual Performance data Linear Range and Sensitivity (Total RNA) Figure 2. Broad linear range and high sensitivity Starting with serially diluted amounts of human colon cancer total RNA, miR-21 and miR-1260 were detected using All-in-One™ miRNA qRT-PCR Detection Kit. The resulting Ct values were plotted against the log10 of the amounts of input total RNA. The data demonstrated a broad linear dynamic range from 20pg to 2 µg of input total RNA as well as high sensitivity. This allows the detection of miRNAs at varying expression levels, including low expressers. Inter-Array Reproducibility Figure 3. High inter-array reproducibility Two miProfile PCR array replicates (plate A and B) were analyzed using human total RNA (10-tissue mix) on the Bio-Rad iQ5. The Ct values of the replicate plates were plotted against each other. R2 > 0.99 were observed for high inter-array reproducibility. R2 > 0.99 is also observed for intra-array reproducibility (data not shown). 4 miProfileTM miRNA PCR Array User Manual (A) (B) Figure 4. Specificity of miRNA detection miRNA miR-29a and miR-29c with one single nucleotide mismatch (B) can be distinguished. Relative detection, defined as a percentage of the perfect match (100% x 2 - ΔCt), was calculated using the Ct values of on-target and off-target assays, which were performed to detect miRNA plasmid DNA templates using All-in-One miRNA qRT-PCR Detection Kits (A). II. Products, Array Layout and Array Format Options Cat. No. qPCR array products PAM-HG384 miProfile human miRNome miRNA qPCR arrays PAM-MG384 Quantity/set 1,700 miRNAs 5 x 384-well plates miProfile human single-nucleotide 834 miRNAs mismatch miRNA qPCR arrays 3 x 384-well plate Shipping and storage condition Shipped at room temperate Stable for at least 6 months when stored at -20°C Shipped at room temperate Stable for at least 6 months when stored at -20°C RNA extraction RT-PCR reagents required (sold separately) Cat. No. Products Quantity/set Shipping and storage condition E01010A RNAzol® RT RNA Isolation Reagent 50 ml Shipped at RT Stable for at least 2 years when stored at RT AMRT-0020 AMRT-0060 All-in-One miRNA firststrand cDNA synthesis kit 20 reactions 60 reactions Shipped with an ice-pack Stable for at least 6 months when stored at -20°C AOPR-0200 AOPR-1000 AOPR-4000 All-in-One qPCR mix 200 reactions 1000 reactions 4000reactions Shipped with an ice-pack Stable for at least 6 months when stored at -20°C 5 miProfileTM miRNA PCR Array User Manual Array format options Important note: Upon receiving, please check to make sure that the correct array format was ordered to ensure the compatibility with your qPCR instrument. GeneCopoeia provides five qPCR array formats (A, B, C, D, and E) suitable for use with the following real-time cyclers. Plate format Instrument provider qPCR instrument model F (384-well) Applied Biosystems 7900HT (384-well block), ViiATM7 (384-well block) G (384-well) Bio-Rad Laboratories CFX384TM (384-well block) H (384-well) Roche Applied Science LightCycler 480 (384-well block) ® Array layout Figure 5. Illustration of miProfile miRNA qPCR array layout (384-well plate) miRNA primer pairs: Wells 1-360 are designated wells for pre-deposited miRNA primer pairs. NC: Negative controls, which only have the pre-deposited reverse universal primers HK1-6: Six pre-deposited housekeeping snRNAs (HK1-6) primer pairs, which can be used as endogenous positive controls as well as for array normalization. RT: Spike-in reverse transcription controls, which can be used to monitor the efficiency of the RT reactions. These pre-deposited primer pairs specifically amplify the cDNA template reversed transcribed from the spike-in exogenous RNA in the sample. PCR: Positive PCR controls, which are used to verify the PCR efficiency by amplifying the predeposited DNA template with its specific pre-deposited primer pairs. Other materials required but not provided ® Small/total RNA extraction kit (i.e. RNAzol RT) DNase/RNase free tips, PCR reaction tubes, 1.5 ml microcentrifuge tubes 5 ml and 10 ml graduated pipettes, beakers, flasks, and cylinders 10 μl to 1,000 μl adjustable single channel micropipettes with disposable tips 5 μl to 20 μl adjustable multichannel micropipette, disposable tips, and reservoir qPCR instrument, compatible with miRNA qPCR arrays ordered 6 miProfileTM miRNA PCR Array User Manual Estimates of number of RT-PCR reactions required for EACH SAMPLE Array format 384-well plate Numbers of plates Numbers of RT reactions Numbers of PCR reactions 1 2 450 3 6 1350 5 10 2250 6 12 2700 10 20 4500 III. Preparation Important notes 1. 2. 3. Before use, remove any condensation that has accumulated on the plate sealing surface and centrifuge plates briefly to collect the contents to the bottom of the plate wells. Strictly follow the standard procedures for PCR to avoid nucleic acid contamination and non-specific amplifications. Read the instructions thoroughly before attempting to perform the procedures. Estimates of RNA and number of RT-PCR reactions required for EACH SAMPLE Array format 384-well plate Number of Small RNA plates recommended Total RNA recommended Number of RT reactions Number of qPCR reactions 1 1-2 ug 2-4 ug 2 450 3 3-6 ug 6-12 ug 6 1350 5 5-10 ug 10-20 ug 10 2250 6 6-12 ug 12-24 ug 12 2700 10 10-20 ug 20-40 ug 20 4500 RNA quantification and quality control 1. 2. 3. Dilute the RNA sample with the RNase-free water and measure the absorbance at 260 nm and 280 nm. A260/280 should be greater than 1.8. Use the formula A260 × dilution × 40 = μg RNA/mL to determine the RNA concentration. Check the RNA integrity by agarose electrophoresis. IV. Procedure First-strand cDNA synthesis Note: High-quality cDNA is a prerequisite for accurate detection of miRNA expression. GeneCopoeia’s Allin-One miRNA First-Strand cDNA Synthesis Kit is required for small cDNA synthesis. 1. 2. Thaw the reagents in All-in-One miRNA First-Strand cDNA Synthesis Kit, mix by gently flicking the tube, briefly centrifuge to bring the contents to the bottom of the tubes and then place them on ice. Prepare miRNA polyA polymerase (PAP) and reverse transcriptase (RT) reaction mix. Add the following reagents to the ice-chilled RNase-free reaction tubes to a final total volume of 25 μl. 7 miProfileTM miRNA PCR Array User Manual Component Volume a Quantity 0.5~1.0 μg 2.5 U Small RNA 2.5U/μl PolyA Polymerase 1 μl RTase mix 1 μl 5×PAP/RT buffer 5 μl Spike-in RT control 1 μl ddH2O(RNase/DNase free) to final 25μl b 1× cDNA product from a standard miRNA reverse transcription reaction (25 μl) should be enough for 2 plates of 96-Well reactions. Prepare at least 10 standard miRNA reverse transcription reactions for the 19 plates of whole genome miRNA PCR Arrays. b. To increase the rate of positive detection, an input of 0.5~1.0μg of small RNA is recommended for the standard miRNA reverse transcription reaction (25 μl). Perform reverse transcription reaction: Mix the prepared reaction mix gently by pipetting up and down. Incubate at 37°C for 60 minutes. Terminate the reaction by incubating at 85°C for 5 minutes. After the incubation, dilute the cDNA products 10 times by adding 225μl of sterile water to each RT reaction and use it for the subsequent qPCR reactions. The diluted cDNA can be stored at -20°C for several weeks. a. 3. qPCR reaction Note: Be sure the miProfile miRNA PCR Array plate is compatible with your qPCR instrument before beginning this protocol. 1. 2. Thaw the reagents of All-in-One miRNA qPCR Mix Kit. Invert the tubes to mix gently but thoroughly. Briefly centrifuge to bring the contents to the bottom of the tubes and then place them on ice. Remove any condensation that has accumulated on the plate sealing surface and centrifuge briefly to collect the contents to the bottom of the plate wells. Carefully remove sealing film before use 96-Well-qPCR. Prepare qPCR solution on ice a Components 1 well N well 2×All-in-One qPCR Mix miRNA cDNA(10 times dilution) 10μl 1μl 11μl × N 1.1μl × N 0.4μl 0.44μl× N 9 μl 8.6 μl 20μl 9.9 μl× N 9.5 μl× N 22μl× N 50 X Rox Reference Dye b ddH2O ■ Not using Rox Reference Dye ■ Using Rox Reference Dye Final Volume a. 3. 4. 5. miProfile miRNA PCR Array is used to detect multiple miRNAs simultaneously in the same sample. Ensure sufficient mix is available by preparing enough for the number of reactions to be used with a 10% additional volume for pipetting loss. b. 50×Rox Reference Dye is added only for qPCR instruments that require ROX for calibration. Mix the qPCR solution thoroughly and centrifuge briefly. Accurately transfer exactly 20 μl reaction mix to each well. Change tips after each transfer to avoid cross-contamination. Tightly seal the qPCR reaction plate with a new sealing film, Ensure that the film seals smoothly to prevent refraction of light. Centrifuge briefly to remove bubbles. Run qPCR. The following three-step PCR program is recommended for running qPCR. Cycles Steps Temperature Duration 1 40 Initial denaturation Denaturation Annealing Extension 95°C 95°C b 60°C c 72°C 10min 10sec. 20 sec. 10 sec. a. a Detection No No No Yes The DNA polymerase used in the 2X All-in-One qPCR Mix is a special chemically modified hot-start 8 miProfileTM miRNA PCR Array User Manual b. c. enzyme. The indicated initial denaturation is sufficient to activate the enzyme. The annealing temperatures of the cross-linked primers in All-in-One qPCR Primer Array are designed and optimized. For comparing the miRNAs with single nucleotide difference, a higher annealing temperature (65°C) might be necessary. The extension time indicated above is suitable for Bio-Rad’s iQ5 real-time PCR instrument. Adjust the time duration according to the documentation provided with your instrument. When using SYBR Green dye to monitor the qPCR reaction, a melting curve analysis should be performed immediately after qPCR cycling. Temperature range Heating rate Constant temperature Detection 66°C~95°C 0.5°C/unit time 6sec./unit time Yes V. Data Analysis 1. Define the baseline The baseline is the noise level in early cycles. Each real-time PCR instrument has algorithms to perform the baseline-setting. This may be a fixed number of cycles for all samples or adaptive for each sample, depending on the type of instrument that is being used. If the lowest Ct is less than the upper limit of the baseline setting, then the baseline should be manually adjusted. Use the “Linear View” of the amplification plot to determine the earliest visible amplification, and then set the baseline from cycle 2 to two cycles before the earliest visible amplification. Normally it is between 2 to 10 cycles. Do not use cycles greater than 15. Ensure that baseline settings are the same across all PCR runs in the same analysis to allow comparison of results. 2. Set threshold Correct placement of the threshold is the next crucial step in data analysis. To adjust the threshold properly, set the threshold value within the exponential phase of all amplification plots when viewed using the logarithmic scale for the y axis. Generally, the expression level of each reference gene should be higher than most other genes. 3. Obtain the Ct or Cp values The Ct is defined as the cycle when sample fluorescence exceeds a chosen threshold above background fluorescence. This is also known as the Cp or crossing point. 4. Export the data. Most qPCR instruments provide a function for exporting Ct or Cp values to Excel. 5. Analyze the qPCR results using the ΔΔCT method of relative quantification and interpretation of the control wells. 6. All Ct values reported as greater than 35 or as N/A (not detected) are considered as not detectable. QC 1. Examined amplification and melting status of each gene using the qPCR instrument software. Each reference gene, RTC and PPC should exhibit only one melting peak per reaction. 2. Examined CT values of the positive PCR control wells (PCR). If the RNA sample is of high quality, the cycling program has been correctly run, and the thresholds have been correctly defined, the value of Ct of PCR should be 20±2 across all arrays or samples. 3. Examined CT values of the positive RT control wells (RT). If the RNA sample is of high quality, the cycling program has been correctly run, and the thresholds have been correctly defined, the value of Ct of RT should be 20±3 across all arrays or samples. Data analysis Analyze the qPCR result with GeneCopoeia’s online Data Analysis System (free), which is available at http://www.genecopoeia.com/product/qpcr/analyse/ 9 miProfileTM miRNA PCR Array User Manual This Data Analysis System uses the ΔΔCt method to perform fold-change analysis or simple statistical analysis of the expression level (Ct or Cp values) for each gene. 1. Download and read the “Primer Array Date Analysis Operation Guide” before performing analysis. 2. Import the Ct or Cp values into the corresponding data analysis template form (Sample Data.xls and Control Data.xls). Upload the template form and choose the correct reference and analysis factors. Note: The reference factor chosen for qPCR Primer Array for normalization with the ΔΔC t method must not be influenced by the experimental design. Therefore use one or more factors that have been previously verified experimentally. A single value or an average of the C t values for the reference factor can be used for normalization. 3. Perform the specified analysis. When a test is repeated at least three times, statistical results (p value) are provided. The analysis results allow genes of interest to be simply and rapidly selected for further study. VI. Appendix ΔΔCt data analysis method ΔΔCt data analysis, a relative quantitative analysis technique, is the most simple and direct method for gene expression analyses. The method requires stable expression from a reference gene to normalize the variation introduced by each step, including sample collection, RNA isolation, reverse transcription and amplification. Typically housekeeping genes are used as reference genes. In qPCR, as in any amplification-based technique, the number of amplification products (N) is calculated as follows: Ct N =N0× (1+E) N0: number of template molecules Ct: threshold cycle E: amplification efficiency When the amplification efficiency E is 100%, the number of template molecules in pre-amplification mix is calculated as follows: -Ct N0 =N × 2 To analyze the change in expression level for the gene of interest in multiple samples using the ΔΔC t method, the amount of the amplification template from different samples is normalized by dividing the expression level of the gene of interest (x) with the reference factor (r) as follows: -Ctx Nrel = N0x/N0r =N × 2 / N ×2 -Ctr -(Ctx - Ctr) =2 -ΔCt =2 The change in normalized expression levels of the gene of interest (x) between experimental sample (sample 1) and the control sample (sample 2) is as follows: Nrel1/Nrel2=2 -ΔCt1 The value of 2 -ΔCt2 /2 -ΔΔCt -(ΔCt1- ΔCt2) =2 =2 -ΔΔCt is the change in expression level of the gene of interest between different samples. 10 miProfileTM miRNA PCR Array User Manual VII. Limited Use License and Warranty Limited use license Following terms and conditions apply to use of miProfile miRNA qPCR Arrays (the Products). If the terms and conditions are not acceptable, the Product in its entirety must be returned to GeneCopoeia within 5 calendar days. A limited End-User license is granted to the purchaser of the Product. The Product shall be used by the purchaser for internal research purposes only. The Product is expressly not designed, intended, or warranted for use in humans or for therapeutic or diagnostic use. The Product must not be resold, repackaged or modified for resale, or used to manufacture commercial products or deliver information obtained in service without prior written consent from GeneCopoeia. This Product should be used in accordance with the NIH guidelines developed for recombinant DNA and genetic research. Use of any part of the Product constitutes acceptance of the above terms. Limited warranty GeneCopoeia warrants that the Product meets the specifications described in the accompanying Product Datasheet. If it is proven to the satisfaction of GeneCopoeia that the Product fails to meet these specifications, GeneCopoeia will replace the Product. In the event a replacement cannot be provided, GeneCopoeia will provide the purchaser with a refund. This limited warranty shall not extend to anyone other than the original purchaser of the Product. Notice of nonconforming products must be made to GeneCopoeia within 30 days of receipt of the Product. GeneCopoeia’s liability is expressly limited to replacement of Product or a refund limited to the actual purchase price. GeneCopoeia’s liability does not extend to any damages arising from use or improper use of the Product, or losses associated with the use of additional materials or reagents. This limited warranty is the sole and exclusive warranty. GeneCopoeia does not provide any other warranties of any kind, expressed or implied, including the merchantability or fitness of the Product for a particular purpose. GeneCopoeia is committed to providing our customers with high-quality products. If you should have any questions or concerns about any GeneCopoeia products, please contact us at 301-762-0888. © 2013 GeneCopoeia, Inc. GeneCopoeia, Inc. 9620 Medical Center Drive, Suite 101 Rockville, MD 20850 +1 (301) 762-0888 +1 (866) 360-9531 [email protected] GeneCopoeia Products are for Research Use Only Copyright © 2013 GeneCopoeia, Inc. Trademarks: GeneCopoeia™, miProfile™, All-in-One™, miProfile™ (GeneCopoeia Inc.); SYBR® (Molecular Probes);iCycler iQ®, MyiQ™, iQ™5 , CFX96™, DNA Engine Opticon™, DNA Engine Opticon 2™, Chromo4™ (Bio-Rad); LightCycler® (Roche);Trizol™, ABI®, ROX®, ViiATM, StepOnePlusTM (Life Technologies); RNAzol® (Molecular Research Center, Inc.); NanoDrop™ (Thermo Scientific). PAM062813 11