1
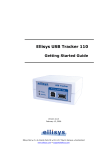
Ellisys USB Analysis Software User Manual Version 3.0.0 December 5, 2007 Ellisys ● Chemin du Grand-Puits 38 ● CH-1217 Meyrin Geneva ● Switzerland www.ellisys.com ● [email protected] Version 3.0.0 December 5, 2007 Table of Contents Chapter 1: Software overview ........................................................................ 5 Overview............................................................................................................5 Dockable panes ...................................................................................................5 Toolbar ..............................................................................................................7 Protocol display ...................................................................................................8 Grouping of consecutive NAKs and SOFs .................................................................9 Details display .................................................................................................. 10 Color-coding transactions ................................................................................... 12 Options ............................................................................................................ 12 Chapter 2: Recording options....................................................................... 14 General tab ...................................................................................................... 14 Filter tab .......................................................................................................... 15 Trigger tab ....................................................................................................... 16 Chapter 3: Real-time Monitoring ................................................................ 29 Overview.......................................................................................................... 29 General tab ...................................................................................................... 30 Devices tab ...................................................................................................... 31 Frames tab ....................................................................................................... 31 Chapter 4: Protocol Summary....................................................................... 33 Introduction...................................................................................................... 33 Categories ........................................................................................................ 34 Find Summarized Items...................................................................................... 34 Total and Displayed items Summary..................................................................... 34 Report export ................................................................................................... 35 Chapter 5: Searching and Post-capture Filtering...................................... 36 Search ............................................................................................................. 36 Instant filters .................................................................................................... 42 Chapter 6: Data Export................................................................................... 44 Introduction...................................................................................................... 44 Exporting USB transactions ................................................................................. 45 Exporting endpoints data .................................................................................... 51 Exporting Setup requests.................................................................................... 52 Exporting descriptors ......................................................................................... 53 USB Analysis Software User Manual Page 2 of 68 Version 3.0.0 December 5, 2007 Exporting generator scripts ................................................................................. 55 Chapter 7: Software and drivers installation ............................................ 57 Install or update the analysis software.................................................................. 57 Automatically install or update the device driver .................................................... 57 Manually install or update the device driver ........................................................... 57 Install an optional functionality ............................................................................ 62 Chapter 8: Frequently Asked Questions.................................................... 66 Chapter 9: Troubleshooting.......................................................................... 68 USB Analysis Software User Manual Page 3 of 68 Version 3.0.0 December 5, 2007 Table of Figures Figure 1 - Overview of the analysis software ............................................................................5 Figure 2 - Grouping of consecutive Start Of Frames ..................................................................9 Figure 3 - Grouping of consecutive NAKed transactions .............................................................9 Figure 4 - Default display of tables ....................................................................................... 10 Figure 5 – Tables display with full details............................................................................... 10 Figure 6 - Tables display with full details and low level values................................................... 11 Figure 7 - Color-coding of transactions.................................................................................. 12 Figure 8 - Protocol Summary view ........................................................................................ 33 Figure 9 - Protocol Summary view with filtered items .............................................................. 35 Figure 10 - Search panel..................................................................................................... 36 Figure 11 – Search for protocol elements .............................................................................. 37 Figure 12 - Search for USB transactions ................................................................................ 38 Figure 13 - Search for endpoints data ................................................................................... 39 Figure 14 - Search for setup requests ................................................................................... 40 Figure 15 - Search for columns strings .................................................................................. 41 Figure 16 - Search of protocol errors .................................................................................... 42 Figure 17 - Export panel ..................................................................................................... 44 Figure 18 - Export USB transactions ..................................................................................... 45 Figure 19 - XML export sample ............................................................................................ 48 Figure 20 - Export endpoints data ........................................................................................ 51 Figure 21 - Export setup transferts ....................................................................................... 52 Figure 22 - Export descriptors.............................................................................................. 53 Figure 22 - Export generator script ....................................................................................... 55 Figure 23 - Updating driver from the Device Manager.............................................................. 58 Figure 24 - Install from a list or specific location..................................................................... 59 Figure 25 - Search for the best driver ................................................................................... 60 Figure 26 - Driver installation .............................................................................................. 61 Figure 27 – Driver installation completed............................................................................... 62 Figure 28 - Icon of the unlocking software ............................................................................. 62 Figure 29 - Extracting compressed software........................................................................... 63 Figure 30 - Software waiting for an analyzer connection .......................................................... 63 Figure 31 - Software ready to activate optional functionality .................................................... 64 Figure 32 - Wrong serial number detected ............................................................................. 64 Figure 33 - Optional functionality properly installed................................................................. 65 USB Analysis Software User Manual Page 4 of 68 Version 3.0.0 December 5, 2007 Chapter 1: Software overview Overview The Ellisys USB analysis software comprises the following elements: • A list displaying USB protocol elements. This list contains editable fields at the top, called 'Instant Filters', which enable you to filter out elements easily. • Dockable panes. You may move the panels as you wish in accordance with your preferences. • A toolbar with shortcuts to the most frequently activated functions. Toolbar USB protocol list Dockable panes Figure 1 - Overview of the analysis software Dockable panes Software panes can be moved to adapt to your needs. For example, the Data pane can be placed under the detail pane as in the screen shot below. USB Analysis Software User Manual Page 5 of 68 Version 3.0.0 December 5, 2007 To move a pane, drag the pane and slide it to the desired place, release the mouse button and the pane will fix itself at the desired destination. In the screen shot below, the user dragged the Search pane and fix it under the protocol element’s list. USB Analysis Software User Manual Page 6 of 68 Version 3.0.0 December 5, 2007 Toolbar Record (Ctrl+R) Starts recording USB traffic (an asterisk appears when the recording options are modified). Record and Append Starts recording USB traffic and append new traffic to the current document (an asterisk appears when the recording options are modified). Recording options Opens the dialog permitting to configure all options related to recording like circular buffer, hard-disk streaming, limit, filters and triggers. Open (Ctrl+O) Opens a previously saved file. Open and Append Appends a previously saved file at the end of the current document. Save (Ctrl+S) Saves a data acquisition in a file. Group transactions Displays transactions without grouping them into transfers. Group transfers Displays transactions grouped into transfers. Show/Hide SOFs Displays or hides Start Of Frames. Show/Hide NAKs Displays or hides NAKs. Show/Hide Split transactions Displays or hides Split transactions. Show/Hide bus states Displays or hides the bus and power supply states. Find Shows the display enabling users to start searches. Automatic Coloring Color-codes transactions based on the device address and endpoint number. Set Time Reference Set the zero on a specific protocol element. Reset Time Reference Reset the zero to the original value. USB Analysis Software User Manual Page 7 of 68 Version 3.0.0 December 5, 2007 Protocol display The most basic USB element is the data packet, but this is not always the most relevant element. The transaction, generally comprising several data packets, is what ultimately conveys information. The analysis software lists transactions on the left side of the display. Each transaction includes the address of the device involved, the endpoint number, the transaction status, payload and absolute time expressed in seconds. All of this information is presented in a convenient column format. The software analyses and decodes descriptors and requests so that they can be displayed in a format that is easier to follow. In just a few seconds you can record and display all the characteristics of a device being analyzed. Every element displayed in the USB list protocol holds an easily identifiable icon as follows: Start-of-frame Setup transaction Isochronous OUT transaction Bulk or Interrupt OUT transaction NAKed Bulk or Interrupt OUT transaction Isochronous IN transaction Bulk or Interrupt IN transaction NAKed Bulk or Interrupt IN transaction Ping ACK Ping NAK Start Split transaction Start Split transaction (erroneous) Complete Split transaction Complete Split transaction (erroneous) Control transfer OUT Control transfer IN High Speed Detection Handshake Extended SE0 state for more than 2 microseconds No activity detected for more than 3 milliseconds Power supply detected on DUT connector Loss of power supply on DUT connector User comment The element contains a warning The element contains an error The element contains a low-level error USB Analysis Software User Manual Page 8 of 68 Version 3.0.0 December 5, 2007 Grouping of consecutive NAKs and SOFs Start Of Frames are fundamental protocol elements, but they make the display too cumbersome if all SOFs are displayed. To prevent this inconvenience, the software automatically groups consecutive Start Of Frames and indicates the count of grouped elements. The following example shows an open group of Start Of Frames containing four elements. Figure 2 - Grouping of consecutive Start Of Frames Consecutive NAK transactions are also grouped together in the same way. Figure 3 shows a Bulk transmission for a storage device with relatively slow access. Each valid transaction is preceded by several NAKs, which reduces the reading performance of this device. Figure 3 - Grouping of consecutive NAKed transactions USB Analysis Software User Manual Page 9 of 68 Version 3.0.0 December 5, 2007 Details display The details display allows you to show more information about the selected protocol element. In addition to other tasks, this display allows you to visualize USB descriptors, requests details, etc. By default, the software displays only high-level values in the tables. The least important elements are hidden to prevent the display from being overloaded (see Figure 4). Figure 4 - Default display of tables When you click on the Show full details button, the fields used less frequently appear in a slightly darker color (see Figure 5). Figure 5 – Tables display with full details USB Analysis Software User Manual Page 10 of 68 Version 3.0.0 December 5, 2007 Clicking once on the Show low level button opens up an additional level that displays the digital equivalent of high-level values in decimal, hexadecimal, and binary (see Figure 6). Figure 6 - Tables display with full details and low level values USB Analysis Software User Manual Page 11 of 68 Version 3.0.0 December 5, 2007 Color-coding transactions When several devices are connected at the same time, the quantity of transactions being displayed can make it difficult to identify which elements belong to what transaction. To prevent you from having to perform a tiresome search, the analysis software allows you to color-code transactions that belong to a specific device. You can thus show information sent on a single device in one color whilst displaying all other traffic in another color. The device address defines the background color of a transaction and the endpoint number defines the text color (see Figure 7). Figure 7 - Color-coding of transactions Color-coding transactions for didactic purposes can be very interesting. For example, this approach enables you to compare the traffic of a hub to that of a device during the listing process, as is shown in the illustration above. Options Display • Expand full-details Select this check box to display full-details in the Details view by default. If this check box is cleared, only the most frequently used fields will be displayed. USB Analysis Software User Manual Page 12 of 68 Version 3.0.0 • December 5, 2007 Expand low-level Select this check box to display hexadecimal, decimal and binary values in the Details view by default. If this check box is cleared, only the most readable information will be displayed. • Expand tree items Select this check box to open all tree branches by default. If this check box is cleared, all tree items will stay closed until manually opened by the user. • Show transactions packets Select this check box to show the packets contained in the transactions. This enables you to watch details of each packet but consumes much more memory. • Show consecutive elements subitems Select this check box to show the subitems of consecutive elements like Start of Frames. This enables you to see details of each consecutive element but consumes a lot more memory. Advanced • Show wrongly connected devices Select this check box to display all packets, even those that belong to devices connected above the analyzer. If this check box is cleared, many wrong packets will be hidden if a device is not properly placed on the analyzed bus. Refer to the Getting Started Manual for more information about the correct connection to your analyzer. USB Analysis Software User Manual Page 13 of 68 Version 3.0.0 December 5, 2007 Chapter 2: Recording options General tab The recording options of the Ellisys USB analysis software can accommodate simple and complex recording scenarios. The General tab let the user configure the circular buffer, the hard-disk streaming, the limits and the split transactions combination. The hard-disk streaming is a unique feature of the Ellisys analyzer. The analyzed data is streamed directly from the hardware to the hard-disk while recording in real-time through the high-performance USB 2.0 high-speed connection. This technique allows recording a huge quantity of data during a quite long period of time. Developers use this technique to debug sporadic issues that only appear once every 24 hours or after several gigabytes of data. USB Analysis Software User Manual Page 14 of 68 Version 3.0.0 December 5, 2007 Filter tab Please note that the filters are only available with the Ellisys USB Explorer 260 Analyzer or the Ellisys USB Explorer 200 Professional Edition. All references to the Ellisys USB Explorer 200 Professional Edition also apply to the Ellisys USB Explorer 260, unless otherwise noted. The Filter tab let the user specify basic and advanced transactions filters. This is useful to reduce the quantity of recorded data in order to save file size or processing time. The advanced filter features the unique partial payload filter. The screen shot above defines a filter that: - Drop all transactions with NAK handshake - Keep only the traffic from Device 1 - Drop all transactions with NYET handshake - Truncate OUT transactions to 8 bytes of payload USB Analysis Software User Manual Page 15 of 68 Version 3.0.0 December 5, 2007 Please note that the custom rules override the "Keep traffic from" rules. In the example above, only traffic from Device 1 will be kept, and the custom rules will be applied on the remaining traffic. The custom rules are applied in the display order. The custom rules are defined using the following dialog. Samples values and rule summary are displayed to ease the rule creation. If the specified criteria match, the rule action will be applied. In case of Keep transaction, the transaction will be kept and stored by the software. In case of Drop, the transaction will be deleted and will not appear in the trace. Trigger tab Please note that the hardware trigger is only available with the Ellisys USB Explorer 260 or the Ellisys USB Explorer 200 Professional Edition. All references to the Ellisys USB Explorer 200 Professional Edition also apply to the Ellisys USB Explorer 260, unless otherwise noted. Introduction The Ellisys USB Explorer 260 and Ellisys USB Explorer 200 Professional Edition are fitted with a powerful and flexible hardware trigger. It enables one to trigger actions when external events happen, in case of repeated events or when specific sequences of events occur. The user interface handling is very quick. A text mode summary is offering a glimpse of events and defined actions. USB Analysis Software User Manual Page 16 of 68 Version 3.0.0 December 5, 2007 External events The hardware trigger can detect numerous conditions happening on the USB bus, specifically various USB packet types, electrical states, error states and trigger external states. USB Analysis Software User Manual Page 17 of 68 Version 3.0.0 December 5, 2007 Events Counters Powerful and flexible event counters are available. They allow counting simple external events as well as events’ sequences. Counters can be reset by any event. USB Analysis Software User Manual Page 18 of 68 Version 3.0.0 December 5, 2007 Events Sequencers Events can be sequenced to trigger actions in intricate conditions. USB Analysis Software User Manual Page 19 of 68 Version 3.0.0 December 5, 2007 Trigger examples Example 1: To generate an impulse on the BNC connector upon a High Speed Handshake event In the “External Events > Bus Conditions” setup page, activate the “High Speed Handshake Success”. Then set up the "Trigger Out" state on the Yes position. A warning is signalled when the BNC connector is set up on input. USB Analysis Software User Manual Page 20 of 68 Version 3.0.0 December 5, 2007 In the "Configuration > Trigger Connector" setup page, check that the connector is activated on output. It is possible to set up the output signal form depending on one’s specific needs. Example 2: To stop recording after detecting a certain amount of low level errors In this example, we’ll set up Packet Error events criterion, then we’ll set up a counter to stop recording. USB Analysis Software User Manual Page 21 of 68 Version 3.0.0 December 5, 2007 In the "External Events > Packet Errors" setup page, activate the "Low Level Error" state. Do not define any actions, this event is going to be used to trigger a counter in the next step. USB Analysis Software User Manual Page 22 of 68 Version 3.0.0 December 5, 2007 In the "Counters > Counter 0" setup page, specify "Packet Error Event" as counter event. We shall use a triggering value of 10 in this example, however a value included between 1 and 65535 can be defined depending on one’s requirements. Define the "Stop Recording" action in order to stop recording when the counter will reach its triggering value. Example 3: Starting to record after detecting a certain amount of transactions containing specific data pattern In this example, we shall set up Token and Data packets criterion, we’ll set up a transaction sequencer, and then we’ll set up a counter to start up recording. USB Analysis Software User Manual Page 23 of 68 Version 3.0.0 December 5, 2007 Go to “External Events > Token Packets” and define Token criterion. We’ll choose to trigger a Token IN for this example. It is possible to define a peripheral (or device) address and a endpoint number if several peripherals (devices) are actually on the bus. USB Analysis Software User Manual Page 24 of 68 Version 3.0.0 December 5, 2007 Go to "External Events > Data Packets" and define criterion. We’ll choose to trigger on a 4 bytes data packet with the pattern "00;00 C0;0F 0A;0F 4C;FF", that is at "XXXXXXXX 1100XXXX XXXX1010 01001100" in binary. This pattern signifies that the Byte 0 can have any value, that the high part of the Byte 1 must be 0xC (the low part is masked and is not relevant), that the low part of the Byte 2 must be 0xA and that Byte 3 must be 0x4C. USB Analysis Software User Manual Page 25 of 68 Version 3.0.0 December 5, 2007 In the "Sequencers > Sequencer 0" setup page, specify the transaction’s sequence, that is to say a Token Packet followed by a Data Packet in the example below. USB Analysis Software User Manual Page 26 of 68 Version 3.0.0 December 5, 2007 In the "Counters > Counter 0" setup page, specify "Sequencer 0 Event" as a counter event. We’ll us a triggering value of 32 in this example, however a value included between 1 and 65535 can be defined depending on one’s requirements. Define the "Start Recording" action to stop recording when the counter will hit its triggering value. USB Analysis Software User Manual Page 27 of 68 Version 3.0.0 December 5, 2007 One must still make sure that the initial recording state is deactivated, which will allow to start the recording solely when the wished for sequences’ count is reached. USB Analysis Software User Manual Page 28 of 68 Version 3.0.0 December 5, 2007 Chapter 3: Real-time Monitoring Please note that the real-time monitoring is only available with the Ellisys USB Explorer 260 Analyzer or the Ellisys USB Explorer 200 Professional Edition. All references to the Ellisys USB Explorer 200 Professional Edition also apply to the Ellisys USB Explorer 260, unless otherwise noted. Overview The Ellisys USB analysis software displays powerful real-time information while recording. The top of the dialog displays the serial number of the unit used for recording, the duration of the recording and the total recorded data. Tabs provide then detailed information about the recording session. A text box at the bottom of the dialog can be used to insert comments in the trace. This is useful to put markers to easily find the position in post-capture analysis. For example the user can enter a text before doing a particular command on his device under test, and search later this comment to see the traffic generated by the command. USB Analysis Software User Manual Page 29 of 68 Version 3.0.0 December 5, 2007 General tab The General tab displays the most common statistics as the quantity of transactions, the NAKed transactions, the invalid transactions, the detected devices and the bus usage. USB Analysis Software User Manual Page 30 of 68 Version 3.0.0 December 5, 2007 Devices tab The Devices tab displays the input, output and total throughput of every detected device. This tab also displays the total link throughput and detected low-level errors. Frames tab The Frame tab displays a graphical representation of the traffic in a frame. The horizontal axis is the time, with the origin set at the Start-of-Frame element. The NAKed transactions, the IN transactions and the OUT transactions are displayed on three separate lines. The vertical axis of these three graphs is the transactions occurrence. The height of the graph represents the occurrence. The Frame composition graph is a combination of the three other graphs. The colors are combined to have a quick understanding of the transactions nature. USB Analysis Software User Manual Page 31 of 68 Version 3.0.0 December 5, 2007 The example below shows the traffic of a mouse, an audio speaker and a flash disk connected to an OHCI host controller. The Audio speaker is using isochronous out streaming. The mouse is not moved and is thus NAKing the interrupt endpoint. The host is reading a file on the flash disk with a bulk endpoint. We can see that the OHCI host leave some space at the beginning of the frame for the bulk traffic, then schedule interrupt and isochronous traffic, and then fill the space left with bulk traffic again. USB Analysis Software User Manual Page 32 of 68 Version 3.0.0 December 5, 2007 Chapter 4: Protocol Summary Please note that the Protocol Summary view is only available with the Ellisys USB Explorer 260 Analyzer or the Ellisys USB Explorer 200 Standard and Professional Edition. All references to the Ellisys USB Explorer 200 Professional Edition also apply to the Ellisys USB Explorer 260, unless otherwise noted. Introduction The Summary pane shows a summary of the traffic being recorded or loaded by reporting the type of communications that occurred and the amount of bytes transferred. The Summary pane can be used to get a quick overview of the number of devices transmitting, the communication between the devices or the amount of errors received: Figure 8 - Protocol Summary view USB Analysis Software User Manual Page 33 of 68 Version 3.0.0 December 5, 2007 The Summary pane is organized in several sections, each organized in several subsections. In addition, most main section also totalizes the count of all subsections. Categories The following categories are available in the Summary: Bus States: This category contains all protocol items that are not directly based on USB packets like electrical states, electrical protocols, etc. Packets: This category shows all packets listed by packets types like Token, Data, Handshake, etc. Transactions: This category shows the transactions listed by various criteria like the device address, the endpoint number, the payload size, etc. Split Transactions: This category shows the split transactions listed by various criteria like the split type, the hub port, etc. Setup Transfers: This category shows the setup transfers listed by various criteria like the recipient, the type, the request, etc. Errors: This category shows the errors on packets, on start-of-frames, by transactions, by split transactions and by LPM transactions. Find Summarized Items Each event counted in a given section can be found in other panes using the Find Next and the Find Previous buttons. To find a specific item, select it in the Summary list and click the Find Next button in the Summary view toolbar. You can also right click on the line and select Find next in the popup menu. The next item that produced a count in the selected line is highlighted and displayed in the Overview pane on the left side. The same procedure applies to find the previous item matching the selected summary line. The Find Previous button on the toolbar is identified by a left arrow. Total and Displayed items Summary The Search is applied on the displayed items, but the summary offers both the total and the displayed items count. The Total column counts all the items that are available in the trace, while the Displayed column only counts the items that are displayed on the screen. USB Analysis Software User Manual Page 34 of 68 Version 3.0.0 December 5, 2007 The Displayed column can be used to count the items matching a particular post-capture filter. Please refer to the chapter Searching and Post-capture Filtering for more information about post-capture filtering. When there is a difference between the Total and the Displayed count, the line is highlighted with a light background color. In the following screen-shot all bus states are filtered-out except the user comments. We can see that all counts are at 0 in the Displayed column: Figure 9 - Protocol Summary view with filtered items Report export The Summary data can be exported to several formats. Three formats are available: Text: The summary data will be exported to a plain text file. This is useful to integrate the data into a report for example. CSV: The summary data will be exported to a Comma Separated Values file. This is useful to open the data in spreadsheet applications like Microsoft Excel. XML: The summary data will be exported to a XML file. This is post-process the data using a custom script. XML parsers are available in all major scripting languages. The XML files can also be open in Internet Explorer to review its content. USB Analysis Software User Manual Page 35 of 68 Version 3.0.0 December 5, 2007 Chapter 5: Searching and Post-capture Filtering Search The search function is used in conjunction with the software's instant filters. A search for the information is only conducted in the displayed elements. Several search modes are available as shown in Figure 10. Figure 10 - Search panel Protocol elements search The protocol elements search allows you to easily find USB elements like transactions, Start Of Frames, Resets, etc. USB Analysis Software User Manual Page 36 of 68 Version 3.0.0 December 5, 2007 Figure 11 demonstrates a search for Start Of Frames and transactions. Figure 11 – Search for protocol elements Transactions search The transactions search enables you to easily find transactions according to their USB token (IN, OUT, or SETUP), their handshake (ACK, NAK or STALL) and their destination (device address and endpoint number). USB Analysis Software User Manual Page 37 of 68 Version 3.0.0 December 5, 2007 Figure 12 demonstrates a search for all NAKed OUT transactions for device 2 on any endpoint. Figure 12 - Search for USB transactions Data search The data search enables you to find data in transfers and transactions. You can perform a data search by entering a sequence of hex bytes or a chain of characters. This method may be used with instant filters for maximum versatility. USB Analysis Software User Manual Page 38 of 68 Version 3.0.0 December 5, 2007 Figure 13 demonstrates a search for hex bytes '12 01 10 01' in all data packets containing 64 bytes that was not addressed to device 1. Figure 13 - Search for endpoints data Setup requests search The Setup requests search allows you to quickly find Setup requests according to their direction (Host-to-Device or Device-to-Host), type (Standard, Class or Vendor), recipient (Device, Interface, Endpoint or Others), bRequest, wValue, wIndex and wLength fields. USB Analysis Software User Manual Page 39 of 68 Version 3.0.0 December 5, 2007 Figure 14 shows a search for vendor specific Setup requests 0xA0 in the device's direction. In addition, the wValue field must match the mask 0x8FFF. Figure 14 - Search for setup requests Search by column Searching for elements by column is an advanced search mode that allows you to find elements in accordance with the text displayed in the various columns. This mode uses the same syntax that the instant filters employ. Refer to the section on Error! Not a valid bookmark self-reference. for further information. USB Analysis Software User Manual Page 40 of 68 Version 3.0.0 December 5, 2007 Figure 15 demonstrates a search for all NAKed OUT transactions coming from device 1 on endpoint 6 with 36 bytes of data: Figure 15 - Search for columns strings Errors search The erroneous elements can be easily searched thanks to this mode. USB Analysis Software User Manual Page 41 of 68 Version 3.0.0 December 5, 2007 Error! Reference source not found. shows a search for all types of errors. Figure 16 - Search of protocol errors Instant filters The instant filters give you an easy way to filter undesirable protocol elements. The filters are composed of a sequence of character chains separated by commas. Wildcards can be specified in the Item, Speed, Status and Comment columns. Ranges can be specified for the Device, Endpoint and Time columns. If an exclamation mark appears in front of the filter, the corresponding elements will be excluded. The filters are not case-sensitive. Start-of-Frames, NAKs and bus states cannot be filtered using the Instant Filters. Please use the buttons available on the toolbar buttons to filter out these elements. The syntax of the filters is as follows: filters = [!]filter[, filter, …] filter = string or wildcard or range wildcard = string containing * and ? characters (only for Item, Speed, Status and Comment columns) range = min..max (only for Device, Endpoint and Time columns) USB Analysis Software User Manual Page 42 of 68 Version 3.0.0 December 5, 2007 Examples The filter illustrated below saves all protocol elements intended for the device with address 1 or 2: The following filter saves all elements belonging to device 1. It also excludes all endpoint 0 elements pertaining to this device: The following filter enables you to display all GetDescriptor requests that have taken place on Low Speed devices: The following filter saves all transactions containing 64 bytes of data that do not belong to device 1: The filter illustrated below enables you to display all transactions that have taken place between 0 and 200 milliseconds: USB Analysis Software User Manual Page 43 of 68 Version 3.0.0 December 5, 2007 Chapter 6: Data Export Introduction This software allows recorded USB transactions, endpoints data, Setup requests or descriptors to be exported. The exporting function can be used in conjunction with instant filters for maximum versatility. Figure 17 - Export panel USB Analysis Software User Manual Page 44 of 68 Version 3.0.0 December 5, 2007 Exporting USB transactions The exportation of USB transactions allows USB traffic to be recorded in a text or XML file. The text format is often used for printing, whereas the XML format may be simply scanned using a script language in order to extract very specific information. You can define whether all USB transactions in a file (All) or only filtered transactions (Only filtered) must be exported (see Figure 18). Advanced options enable you to extend data packets that include transactions, SOF data packets clustered together in a single group, as well as grouped NAK transactions. The file that is generated in this way may be larger, but it also offers the advantage of providing maximum details about the elements. Figure 18 - Export USB transactions USB Analysis Software User Manual Page 45 of 68 Version 3.0.0 December 5, 2007 XML format specifications <Reset duration = time_expression time = time_expression /> <Suspended duration = time_expression time = time_expression /> <Power state = "ON" | "OFF" time = time_expression /> <!-- Packet category: Start of Frame --> <Packet id = "SOF" speed = "LS" | "FS" time = time_expression> <frame>decimal</frame> <crc5>hexadecimal</crc5> </Packet> <!-- Packet category: Token --> <Packet id = "IN " | "OUT" | "SETUP" speed = "LS" | "FS" time = time_expression> <deviceAddress>decimal</deviceAddress> <endpointNumber>decimal</endpointNumber> <crc5>hexadecimal</crc5> </Packet> <!-- Packet category: Data --> <Packet id = "DATA0" | "DATA1" speed = "LS" | "FS" time = time_expression> <length>decimal</length> <data>hexadecimal_data</data> <crc16>hexadecimal</crc16> </Packet> <!-- Packet category: Handshake and special --> <Packet id = "ACK" | "NAK" | "STALL" | "PRE" speed = "LS" | "FS" time = time_expression /> <Transaction type = "IN " | "OUT" | "SETUP" device = decimal endpoint = decimal status = "ACK" | "NAK" | "STALL" | "ERROR" speed = "LS" | "FS" time = time_expression> <!-- Content: Packet --> </Transaction> <ConsecutiveStartOfFrame count = decimal time = time_expression> <!-- Content: Packet id="SOF" --> </ConsecutiveStartOfFrame> USB Analysis Software User Manual Page 46 of 68 Version 3.0.0 December 5, 2007 <ConsecutiveTransaction count = decimal time = time_expression> <!-- Content: Transaction status="NAK" --> </ConsecutiveTransaction> <Container title = string device = decimal endpoint = decimal status = "ACK" | "NAK" | "STALL" | "ERROR" speed = "LS" | "FS" time = time_expression> <!-- Content: Transaction, ConsecutiveStartOfFrame, ConsecutiveTransaction --> </Container> <Document title = string date = string> <!-- Content: Transaction, ConsecutiveStartOfFrame, ConsecutiveTransaction, Container, Reset, Suspended, Power --> </Document> USB Analysis Software User Manual Page 47 of 68 Version 3.0.0 December 5, 2007 XML file sample The Figure 19 shows the enumeration of a USB mouse exported as a XML file in Microsoft Internet Explorer. Figure 19 - XML export sample Text file sample The Figure 19 shows the enumeration of a USB mouse exported as a XML file in Microsoft Internet Explorer. The sample below shows the enumeration of a USB mouse exported as a text file. Filename: Mouse.ufo Date: 23.04.2003 11:50:13 ______________________________________________________________________________ Power state<ON> time<0.000 000> ______________________________________________________________________________ Reset duration<28.8 milliseconds> time<0.011 041> ______________________________________________________________________________ Suspended duration<319.7 milliseconds> time<0.042 809> ______________________________________________________________________________ Reset duration<31.1 milliseconds> time<0.362 537> USB Analysis Software User Manual Page 48 of 68 Version 3.0.0 December 5, 2007 ______________________________________________________________________________ Container title<GetDescriptor (Device)> device<0 (1)> endpoint<0> status<OK> speed<LS> time<0.457 092> Transaction type<SETUP> device<0 (1)> endpoint<0> status<ACK> speed<LS> time<0.457 092> Transaction type<IN> device<0 (1)> endpoint<0> status<ACK> speed<LS> time<0.458 084> Transaction type<IN> device<0 (1)> endpoint<0> status<ACK> speed<LS> time<0.459 076> Transaction type<IN> device<0 (1)> endpoint<0> status<ACK> speed<LS> time<0.460 068> Transaction type<OUT> device<0 (1)> endpoint<0> status<ACK> speed<LS> time<0.462 057> ______________________________________________________________________________ Reset duration<24.1 milliseconds> time<0.463 144> ______________________________________________________________________________ Container title<SetAddress (1)> device<0 (1)> endpoint<0> status<OK> speed<LS> time<0.518 978> Transaction type<SETUP> device<0 (1)> endpoint<0> status<ACK> speed<LS> time<0.518 978> Transaction type<IN> device<0 (1)> endpoint<0> status<ACK> speed<LS> time<0.519 970> ______________________________________________________________________________ Container title<GetDescriptor (Device)> device<1> endpoint<0> status<OK> speed<LS> time<0.581 837> Transaction type<SETUP> device<1> endpoint<0> status<ACK> speed<LS> time<0.581 837> Packet id<SETUP> devAddr<1> epNum<0> crc5<0x1D> speed<LS> time<0.581 837> Packet id<DATA0> length<8> data<80 06 00 01 00 00 12 00> crc16<0xF4E0> speed<LS> time<0.581 860> Packet id<ACK> speed<LS> time<0.581 928> Transaction type<IN> device<1> endpoint<0> status<ACK> speed<LS> time<0.582 828> Packet id<IN> devAddr<1> epNum<0> crc5<0x1D> speed<LS> time<0.582 828> Packet id<DATA1> length<8> data<12 01 10 01 00 00 00 08> crc16<0x7711> speed<LS> time<0.582 852> Packet id<ACK> speed<LS> time<0.582 921> Transaction type<IN> device<1> endpoint<0> status<ACK> speed<LS> time<0.583 820> Packet id<IN> devAddr<1> epNum<0> crc5<0x1D> speed<LS> time<0.583 820> Packet id<DATA0> length<8> data<6D 04 0C C0 10 21 01 02> crc16<0xC3E9> speed<LS> time<0.583 844> Packet id<ACK> speed<LS> time<0.583 912> Transaction type<IN> device<1> endpoint<0> status<ACK> speed<LS> time<0.584 812> Packet id<IN> devAddr<1> epNum<0> crc5<0x1D> speed<LS> time<0.584 812> Packet id<DATA1> length<2> data<00 01> crc16<0x8F3F> speed<LS> time<0.584 836> Packet id<ACK> speed<LS> time<0.584 873> Transaction type<OUT> device<1> endpoint<0> status<ACK> speed<LS> time<0.585 804> Packet id<OUT> devAddr<1> epNum<0> crc5<0x1D> speed<LS> time<0.585 804> Packet id<DATA1> length<0> crc16<0x0000> speed<LS> time<0.585 828> Packet id<ACK> speed<LS> time<0.585 852> USB Analysis Software User Manual Page 49 of 68 Version 3.0.0 December 5, 2007 ______________________________________________________________________________ Container title<GetDescriptor (Configuration)> device<1> endpoint<0> status<OK> speed<LS> time<0.595 740> Transaction type<SETUP> device<1> endpoint<0> status<ACK> speed<LS> time<0.595 740> Transaction type<IN> device<1> endpoint<0> status<ACK> speed<LS> time<0.596 732> Transaction type<IN> device<1> endpoint<0> status<ACK> speed<LS> time<0.597 724> Transaction type<IN> device<1> endpoint<0> status<ACK> speed<LS> time<0.598 716> Transaction type<IN> device<1> endpoint<0> status<ACK> speed<LS> time<0.599 708> Transaction type<IN> device<1> endpoint<0> status<ACK> speed<LS> time<0.600 700> Transaction type<OUT> device<1> endpoint<0> status<ACK> speed<LS> time<0.602 689> ______________________________________________________________________________ Container title<SetConfiguration (1)> device<1> endpoint<0> status<OK> speed<LS> time<0.694 274> Transaction type<SETUP> device<1> endpoint<0> status<ACK> speed<LS> time<0.694 274> Packet id<SETUP> devAddr<1> epNum<0> crc5<0x1D> speed<LS> time<0.694 274> Packet id<DATA0> length<8> data<00 09 01 00 00 00 00 00> crc16<0x2527> speed<LS> time<0.694 298> Packet id<ACK> speed<LS> time<0.694 365> Transaction type<IN> device<1> endpoint<0> status<ACK> speed<LS> time<0.695 266> Packet id<IN> devAddr<1> epNum<0> crc5<0x1D> speed<LS> time<0.695 266> Packet id<DATA1> length<0> crc16<0x0000> speed<LS> time<0.695 289> Packet id<ACK> speed<LS> time<0.695 315> ______________________________________________________________________________ Container title<GetDescriptor (Report)> device<1> endpoint<0> status<OK> speed<LS> time<0.724 188> Transaction type<SETUP> device<1> endpoint<0> status<ACK> speed<LS> time<0.724 188> Transaction type<IN> device<1> endpoint<0> status<ACK> speed<LS> time<0.725 179> Transaction type<IN> device<1> endpoint<0> status<ACK> speed<LS> time<0.726 171> Transaction type<IN> device<1> endpoint<0> status<ACK> speed<LS> time<0.727 163> Transaction type<IN> device<1> endpoint<0> status<ACK> speed<LS> time<0.728 155> Transaction type<IN> device<1> endpoint<0> status<ACK> speed<LS> time<0.729 147> Transaction type<IN> device<1> endpoint<0> status<ACK> speed<LS> time<0.730 139> Transaction type<IN> device<1> endpoint<0> status<ACK> speed<LS> time<0.731 130> Transaction type<OUT> device<1> endpoint<0> status<ACK> speed<LS> time<0.733 120> ______________________________________________________________________________ ConsecutiveTransaction count<674> time<0.744 091> ______________________________________________________________________________ Power state<OFF> time<6.135 733> USB Analysis Software User Manual Page 50 of 68 Version 3.0.0 December 5, 2007 Exporting endpoints data The data can be exported to a binary file (raw data) or to a text file (text) as shown in Figure 20. Figure 20 - Export endpoints data USB Analysis Software User Manual Page 51 of 68 Version 3.0.0 December 5, 2007 Exporting Setup requests Setup requests can be exported to a C header file according to their direction (Host-to-Device or Device-to-Host), type (Standard, Class or Vendor), recipient (Device, Interface, Endpoint or Others), bRequest, wValue, wIndex and wLength fields (see Figure 21). Figure 21 - Export setup transferts Sample The following sample shows the export of Setup requests in a C header file. The array s_setupRequest contains the exported setup requests. The structure SETUP_REQUEST contains the fields and the setup request data. USB Analysis Software User Manual Page 52 of 68 Version 3.0.0 December 5, 2007 struct SETUP_REQUEST { unsigned char bmRequestType; unsigned char bRequest; unsigned short wValue; unsigned short wIndex; unsigned short wLength; unsigned short cbData; const unsigned char* pData; }; const struct SETUP_REQUEST s_setupRequest[] = { { 0x00, 0x05, 0x0001, 0x0000, 0x0000, 0x0000, "" }, { 0x80, 0x06, 0x0200, 0x0000, 0x0000, 0x0000, "" }, { 0x80, 0x06, 0x0300, 0x0000, 0x00FF, 0x0004, "\x04\x03\x09\x04" }, { 0x80, 0x06, 0x0302, 0x0409, 0x00FF, 0x002C, "\x2C\x03\x55\x00\x53\x00\x42\x00\x2D\x00\x50\x00\x53\x00\x2F \x00\x32\x00\x20\x00\x4D\x00\x6F\x00\x75\x00\x73\x00\x65\x00 \x20\x00\x4D\x00\x2D\x00\x42\x00\x41\x00\x34\x00\x37\x00" }, { 0x80, 0x06, 0x0300, 0x0000, 0x00FF, 0x0004, "\x04\x03\x09\x04" }, { 0x80, 0x06, 0x0200, 0x0000, 0x0009, 0x0009, "\x09\x02\x22\x00\x01\x01\x00\xA0\x19" }, { 0x00, 0x09, 0x0001, 0x0000, 0x0000, 0x0000, "" }, { 0x21, 0x0A, 0x0000, 0x0000, 0x0000, 0x0000, "" }, { 0x00, 0x00, 0x0000, 0x0000, 0x0000, 0x0000, NULL } }; Exporting descriptors Description The descriptors can be exported to a C header or to an assembly file with format 8051 (8051 ASM) as shown in Figure 22. Figure 22 - Export descriptors USB Analysis Software User Manual Page 53 of 68 Version 3.0.0 December 5, 2007 Sample The sample below shows USB mouse descriptors export in a C header file. // Device 1 device descriptor static const unsigned char descriptor1[] = { 0x12, 0x01, 0x00, 0x01, 0x00, 0x00, 0x00, 0x08, 0x6D, 0x04, 0x02, 0xC0, 0x20, 0x01, 0x01, 0x02, 0x00, 0x01 }; // Device 1 configuration descriptor static const unsigned char descriptor2[] = { 0x09, 0x02, 0x22, 0x00, 0x01, 0x01, 0x00, 0x19, 0x09, 0x04, 0x00, 0x00, 0x01, 0x03, 0x02, 0x00, 0x09, 0x21, 0x00, 0x01, 0x00, 0x22, 0x48, 0x00, 0x07, 0x05, 0x81, 0x03, 0x00, 0x0A }; 0xA0, 0x01, 0x01, 0x08, // Device 1 string descriptor 0 static const unsigned char descriptor3[] = { 0x04, 0x03, 0x09, 0x04 }; // Device 1 string descriptor 2 static const unsigned char descriptor4[] = { 0x2C, 0x03, 0x55, 0x00, 0x53, 0x00, 0x42, 0x2D, 0x00, 0x50, 0x00, 0x53, 0x00, 0x2F, 0x32, 0x00, 0x20, 0x00, 0x4D, 0x00, 0x6F, 0x75, 0x00, 0x73, 0x00, 0x65, 0x00, 0x20, 0x4D, 0x00, 0x2D, 0x00, 0x42, 0x00, 0x41, 0x34, 0x00, 0x37, 0x00 }; // Device 1 class descriptor static const unsigned char descriptor5[] = { 0x05, 0x01, 0x09, 0x02, 0xA1, 0x01, 0x05, 0x19, 0x01, 0x29, 0x04, 0x15, 0x00, 0x25, 0x95, 0x04, 0x75, 0x01, 0x81, 0x02, 0x95, 0x75, 0x04, 0x81, 0x03, 0x05, 0x01, 0x09, 0xA1, 0x00, 0x09, 0x30, 0x09, 0x31, 0x15, 0x25, 0x7F, 0x75, 0x08, 0x95, 0x02, 0x81, 0xC0, 0x09, 0x38, 0x95, 0x01, 0x81, 0x06, 0x3C, 0x15, 0x00, 0x25, 0x01, 0x75, 0x01, 0x01, 0xB1, 0x22, 0x95, 0x07, 0xB1, 0x01, }; USB Analysis Software User Manual 0x00, 0x00, 0x00, 0x00, 0x00, 0x09, 0x01, 0x01, 0x01, 0x81, 0x06, 0x09, 0x95, 0xC0 Page 54 of 68 Version 3.0.0 December 5, 2007 Exporting generator scripts Description The trace can be exported to an Ellisys USB Explorer 260 Generator script. This is useful to replay erroneous scenarios that were recorded with the analyzer and that are not easy to reproduce. By replaying the scenario with the generator, the developer has the opportunity to fix the issue and ensure it is correctly fixed with a stable setup. All packets of the trace can be exported, or just the packets from the host, as shown in Figure 23. Figure 23 - Export generator script Sample The sample below shows host packets for a GetDescritor (Device) request. void Main() { SendPacket ( SendPacket ( 0x00, 0xDD, WaitPacket( RawData => [ 0x2D, 0x00, 0x10 ], Interval => 0.0 ); RawData => [ 0xC3, 0x80, 0x06, 0x00, 0x01, 0x00, 0x00, 0x40, 0x94 ], Interval => 25.333us ); ); SendPacket ( RawData => [ 0x69, 0x00, 0x10 ], Interval => 108.667us ); WaitPacket( ); SendPacket ( RawData => [ 0x69, 0x00, 0x10 ], Interval => 49.000us ); WaitPacket( ); SendPacket ( RawData => [ 0x69, 0x00, 0x10 ], Interval => 48.167us ); WaitPacket( ); SendPacket ( RawData => [ 0xD2 ], Interval => 95.000us ); SendPacket ( RawData => [ 0x69, 0x00, 0x10 ], Interval => 22.833us ); WaitPacket( ); USB Analysis Software User Manual Page 55 of 68 Version 3.0.0 December 5, 2007 SendPacket ( RawData => [ 0x69, 0x00, 0x10 ], Interval => 48.167us ); WaitPacket( ); SendPacket ( RawData => [ 0x69, 0x00, 0x10 ], Interval => 48.333us ); WaitPacket( ); SendPacket ( RawData => [ 0xD2 ], Interval => 94.833us ); SendPacket ( RawData => [ 0x69, 0x00, 0x10 ], Interval => 22.167us ); WaitPacket( ); SendPacket ( RawData => [ 0x69, 0x00, 0x10 ], Interval => 48.500us ); WaitPacket( ); SendPacket ( RawData => [ 0xD2 ], Interval => 63.500us ); SendPacket ( RawData => [ 0xE1, 0x00, 0x10 ], Interval => 24.167us ); SendPacket ( RawData => [ 0x4B, 0x00, 0x00 ], Interval => 25.333us ); WaitPacket( ); } USB Analysis Software User Manual Page 56 of 68 Version 3.0.0 December 5, 2007 Chapter 7: Software and drivers installation Install or update the analysis software Depending on the type of analyzer, the analysis software's latest version is available either at: http://www.usbexplorer.com/download.php or http://www.usbtracker.com/download.php After you have downloaded the software installation file, run it and follow the step-by-step installation instructions. Please note that the installation requires Microsoft Windows Installer 2.0 or later. If the installation does not run smoothly, or if the system indicates that there is a version error, update your Windows Installer. Automatically install or update the device driver If the latest version of the analysis software is properly installed, the driver should install automatically when the analyzer is connected. If not, please refer to the following paragraph. Manually install or update the device driver 1. Install the latest version of the USB analysis software as explained in the previous section. 2. Connect the USB analyzer. 3. If you are connecting the analyzer for the first time, please wait until Windows displays a message that says it discovered a new device and then jump to step 5. USB Analysis Software User Manual Page 57 of 68 Version 3.0.0 4. December 5, 2007 If you want to update an already-installed device driver, go to the Device Manager (Start | Control Panel | System icon | Hardware tab | Device Manager button). Open “Ellisys protocol analyzers” and right click on your analyzer. Select “Update Driver…” (see Figure 24). Figure 24 - Updating driver from the Device Manager USB Analysis Software User Manual Page 58 of 68 Version 3.0.0 5. December 5, 2007 Select “Install from a list or specific location (Advanced)” and click next (see Figure 25). Figure 25 - Install from a list or specific location It is possible that this screen and the next show up « USB Tracker 110 » instead of « USB Explorer 200 ». USB Analysis Software User Manual Page 59 of 68 Version 3.0.0 6. December 5, 2007 Select only “Include this location in the search” and type the folder path in which you have installed the software (see Figure 26) Figure 26 - Search for the best driver USB Analysis Software User Manual Page 60 of 68 Version 3.0.0 7. December 5, 2007 Windows will find the driver and install it (see Figure 27). Figure 27 - Driver installation USB Analysis Software User Manual Page 61 of 68 Version 3.0.0 8. December 5, 2007 After the new files have been copied, the installation is completed (see Figure 28). Figure 28 – Driver installation completed You can then launch the USB analysis software and use it. Install an optional functionality Follow the steps below to install an optional functionality on your analyzer: 1. Obtain the unlocking software from your local distributor or directly from Ellisys if there is no distributor in your country (see Figure 29). For a list of local distributor, please go to: http://www.ellisys.com/company/distributors.php. Figure 29 - Icon of the unlocking software USB Analysis Software User Manual Page 62 of 68 Version 3.0.0 December 5, 2007 2. If the software is embedded in a compressed file, first decompress it. Current operating systems should be able to decompress it without additional software (see Figure 30). If not, you will easily find some free software on the Web to decompress it. Figure 30 - Extracting compressed software 3. Launch the software. It will display your analyzer serial number on which it is intended to run (see Figure 31). Figure 31 - Software waiting for an analyzer connection USB Analysis Software User Manual Page 63 of 68 Version 3.0.0 December 5, 2007 4. As soon as the analyzer is connected, the software will activate the button "Set Options" (see Figure 32). Only the options displayed in the white rectangle will be activated. If this does not correspond to the options you bought, please contact your local distributor. Figure 32 - Software ready to activate optional functionality 5. If you connect another USB analyzer, an error message will be displayed (see Figure 33). If you connected your analyzer and this message appeared, please contact your local distributor. Figure 33 - Wrong serial number detected USB Analysis Software User Manual Page 64 of 68 Version 3.0.0 December 5, 2007 6. Press "Set Options" to activate the optional functionality. The software will then display a success message (see Figure 34). Figure 34 - Optional functionality properly installed The optional functionality is now installed. USB Analysis Software User Manual Page 65 of 68 Version 3.0.0 December 5, 2007 Chapter 8: Frequently Asked Questions The basic component of USB is the packet, but I can only see transactions and transfers. Is it possible to view packets? Yes, packets for the selected transaction are displayed in the right hand window. We have chosen this method to avoid overloading the transaction tree and because useful information is actually only transmitted when a transaction has been completed. Which standard requests is the software able to decode? The software decodes standard requests and descriptors, but also all classes requests and descriptors, primarily for Audio, Mass Storage, Communication, Human Interface Device, Still Image, Printer, Bluetooth HCI, Video, Wire Adapter, Device Firmware Upgrade and Hub. The software also has an extension enabling the decoding of Vendor Specific protocols. The USB classes decoding is an option sold separately. I would like to filter out certain undesirable information. What do I need to do? A text zone for each column is provided for this. Simply enter '2,3' in the device column to display peripherals 2 and 3 only. In the same way, entering '!0,1' in the endpoint column hides all the endpoints except 0 and 1. The detailed view enables me to see high-level textual information. What do I need to do to see numeric low-level information? Low-level information (decimal, hexadecimal and binary data) is available by clicking on the button (Show low-level) located at top of the frame for the packet (right view). The software shows a descriptor in the detailed view but it seems that some fields are missing. Where are they? The software hides fields that are irrelevant. You can display them by clicking on the (Show full-details) button. Additional fields will appear in a slightly darker color. What do consecutive SOF and NAK mean? Consecutive SOF and NAK gather similar transactions to avoid overloading the screen. So, recording a bus with no activity for a few seconds will gather thousands of SOFs on just one line. Will an invalid SOF packet be lost in a consecutive SOF? No, an invalid SOF will separate the group to which it belongs into two valid groups and will be placed between these two groups. It will also be identified by a logo that indicates it is invalid. USB Analysis Software User Manual Page 66 of 68 Version 3.0.0 December 5, 2007 The software tells me a device is wrongly connected. What does it mean? It is possible that the analyzer is connected on the same bus controller as a device being tested. This configuration is not supported. Please refer to the Getting Started Manual for more information on the appropriate connections. I bought a software option but it is not activated. What can I do? Please ensure you executed the activation software sent by email through your local distributor (read Chapter 7: Install an optional functionality for more information on how to install an optional functionality). Please check afterwards that your software version is the latest available on the download section of our website: http://www.usbexplorer.com/download.php Then restart the software with the analyzer connected. How do I print from the software? Printing is done using the data export feature. Examples of exported data are available in the installation folder of the USB analysis software (by default C:\Program Files\Ellisys\Visual USB). Look for files into the Samples folder. Here is a description of some of the files available in this folder: • Mouse transactions.txt Transactions of a USB mouse exported in text format, easily printable for later analysis. • Mouse transactions.xml Transactions of a USB mouse exported in XML format, analyzable with a custommade software. • Mouse descriptors.h Descriptors of a USB mouse exported in a C header file. • Mouse setup requests.h All Setup requests of a USB mouse exported in a C header file. • Mouse.ufo File used as a base for all exportation samples. Be aware that some exported files may become large and it is often necessary to filter transactions before exportation. Instant Filter can easily suppress any redundant information (See http://www.usbexplorer.com/feature02.php for more information). USB Analysis Software User Manual Page 67 of 68 Version 3.0.0 December 5, 2007 Chapter 9: Troubleshooting I've finished a data acquisition, and I've noticed several CRC errors. What's going on? Check to make sure that the total length of the cables connected to the analyzer DUT does not exceed 3 meters. Then try an analysis of a sales device before reconnecting the device that you wish to test. The analysis software indicates that the devices are not correctly connected to the analyzer. What should I do? The devices connected to the test computer must be below the analyzer for a correct analysis to be carried out. Refer to the Getting Started Manual for more information about correct connection of your analyzer. The analysis software indicates that the analyzer is connected to the same controller as the device under test. What should I do? If you would like to use the analyzer and the device that you want to analyze on the same computer, you must have at least two powerful host controllers. Refer to the Getting Started Manual for more information about correct connection of your analyzer. When traffic is recorded in real time, the software indicates that an overflow error has appeared. What does this mean? This error may appear when you try to analyze a device that uses a substantial amount of bandwidth, such as a USB hard drive, with a computer that is not very powerful or does not have a USB 2.0 connection. The configuration that uses two computers is most suitably adapted for an analysis of this type of device. Make sure that your analysis computer is powerful enough and has a USB 2.0 connection. USB Analysis Software User Manual Page 68 of 68