1
Aalto University
School of Electrical Engineering
Department of Signal Processing and Acoustics
Timo Dönsberg
Improved Reference Infrared Spectrometer
Thesis submitted for examination for the degree of Master of Science in Technology.
Espoo, 27th of January, 2012
Supervisor:
Prof. Erkki Ikonen
Instructor:
Dr. Farshid Manoocheri
AALTO UNIVERSITY
SCHOOL OF ELECTRICAL ENGINEERING
ABSTRACT OF THE
MASTER’S THESIS
Aalto University
School of Electrical Engineering
Department of Signal Processing and Acoustics
Author: Timo Dönsberg
Title: Improved Reference Infrared Spectrometer
Date: 27.1.2012
Number of pages: 8+90
Supervisor: Prof. Erkki Ikonen
Instructor: Dr. Farshid Manoocheri
Language: English
Infrared radiation is electromagnetic radiation with a spectrum ranging from 750 nm to
1 mm in wavelength. It is invisible to the human eye, but has significance in optical
spectroscopy. An optical spectrometer is a device that measures the emission,
absorption, or fluorescence spectrum of a material.
In this work, a reference infrared spectrometer facility at the Metrology Research
Institute was upgraded. The spectrometer can be used to measure spectral responsivity
of detectors, spectral transmittance of optical materials and spectral power distribution
measurements of light sources in the wavelength range of 750 nm to 16 µm. The
measurement setup was improved for full automation using LabVIEW and the previous
calibration and automation procedures were refined. Automated facility is versatile for
different measurement setups and is easy to operate.
Phase sensitive detection is utilized in the measurement setup by using a lock-in
amplifier. It enables the detection of very small signals in the presence of overwhelming
noise. Optical chopping is used to modulate the measurement signal at a known
reference frequency. Typically the linearity of the measurement system is determined
optically. Also in this work, a fully electronic method for linearity measurements of
lock-in amplifiers was developed and tested. This method improves the accuracy in
lock-in comparison measurements.
In addition, a preamplifier for photoconductive detectors was constructed and
characterized. The amplifier was designed so that it can be used with wide variety of
detectors.
Keywords: infrared, spectrometer, automation, linearity, photoconductive detector
i
AALTO-YLIOPISTO
SÄHKÖTEKNIIKAN KORKEAKOULU
KANDIDAATINTYÖN
TIIVISTELMÄ
Aalto-yliopisto
Sähkötekniikan korkeakoulu
Signaalinkäsittelyn ja akustiikan laitos
Tekijä: Timo Dönsberg
Työn nimi: Uudistettu referenssi-infrapunaspektrometri
Päiväys: 27.1.2012
Sivumäärä: 8+90
Työn valvoja: Prof. Erkki Ikonen
Työn ohjaaja: TkT Farshid Manoocheri
Kieli: Englanti
Infrapunasäteily on sähkömagneettista säteilyä, jonka aallonpituus on 750 nn – 1 mm.
Se on tärkeä työväline optisessa spektroskopiassa, vaikka onkin ihmissilmälle
näkymätöntä. Optisella spektrometrillä tarkoitetaan laitetta, joka mittaa materiaalin
emissio-, absorptio- tai fluoresenssispektriä.
Tässä työssä uudistettiin Aalto-yliopiston Mittaustekniikan ryhmän referenssiinfrapunaspektrometriä. Laitetta käytetään ilmaisimen vasteen, aineen läpäisyn ja
lähteen tehojakauman spektrisiin mittauksiin aallonpituusalueella 750 nm – 16 µm.
Mittauslaitteisto automatisoitiin käyttäen LabVIEW-ohjelmistoa. Lisäksi kalibrointi- ja
mittausmenetelmiä paranneltiin. Automatisoitu mittauslaitteisto soveltuu monipuolisesti
erilaisiin mittausjärjestelyihin ja on aiempaa helpompi käyttää.
Mittauksissa käytetään vaihelukittua vahvistinta, joka mahdollistaa hyvin heikkojen
signaalien havaitsemisen suuren kohinasignaalin läsnäolosta huolimatta. Mitattavaa
signaalia moduloidaan katkomalla valolähdettä referenssitaajuudella. Optisen
menetelmän sijaan vaihelukitun vahvistimen lineaarisuusmittauksiin kehitettiin täysin
sähköinen menetelmä, joka parantaa ulkoista tarkkuutta vertailumittauksissa.
Lisäksi osana työtä suunniteltiin, rakennettiin ja karakterisoitiin esivahvistin
valojohtaville ilmaisimille. Tavanomaisesta sovitetusta esivahvistimesta poiketen
laitteen keskeiset parametrit ovat säädettäviä, joten sitä voidaan käyttää lukuisien eri
ilmaisimien kanssa.
Avainsanat: infrapuna, spektrometri, automaatio, lineaarisuus, valojohtava ilmaisin
ii
Acknowledgements
This work has been done at the Metrology Research Institute (MRI) of the Aalto
University School of Electrical Engineering. The research project was funded by the
Centre for Metrology and Accreditation (MIKES).
I would like to thank Professor Erkki Ikonen, the head of the Metrology Research
Institute, for supervising this work, and for giving me the opportunity and
encouragement to work on many challenging and interesting projects.
I am most grateful for my instructor Dr. Farshid Manoocheri for the support, comments
and advices that helped me to overcome all the obstacles on the way. After countless
constructive and instructive conversations I can only admire his wisdom to always ask
the right questions and, moreover, his patience to listen to my answers.
It is a pleasure and a privilege to work among the personnel of the Metrology Research
Institute. The both relaxed and productive working atmosphere is something truly
unique, of which I want to thank all my co-workers.
I am deeply thankful to my parents, who have always given me love, understanding,
support, and the freedom to make my own decisions, and to my sister, who still keeps
guiding her little brother in life. I also want to thank all my friends, who have given me
aid, trust, joy and a change to follow my many passions in life.
Finally, I wish to thank my dear girlfriend Julia for making my life the one I want to
live.
Espoo, 23th of January, 2012
Timo Dönsberg
iii
Table of Contents
Acknowledgements ..................................................................................................... iii
Table of Contents ......................................................................................................... iv
Symbols and Abbreviations .......................................................................................... vi
1
Introduction ............................................................................................................ 1
2
Theory of infrared radiometry................................................................................. 3
2.1
2.1.1
Infrared spectrum .....................................................................................3
2.1.2
Spectrometer ............................................................................................5
2.2
Sources of infrared radiation............................................................................5
2.2.1
Ideal black body .......................................................................................6
2.2.2
Incandescent sources ................................................................................9
2.2.3
Other sources ......................................................................................... 12
2.3
Considerations on infrared optics .................................................................. 13
2.4
Wavelength selection .................................................................................... 15
2.5
Detectors ....................................................................................................... 17
2.5.1
Theory and definitions............................................................................ 18
2.5.2
Photon detectors ..................................................................................... 20
2.5.3
Thermal detectors................................................................................... 22
2.6
3
Fundamentals ..................................................................................................3
Signal amplification ...................................................................................... 23
2.6.1
Lock-in amplifier ................................................................................... 23
2.6.2
Amplifier for photoconductive detectors ................................................ 26
Setup description and improvements..................................................................... 30
3.1
Setup overview .............................................................................................. 30
3.2
Radiation sources and input optics ................................................................. 34
3.3
Wavelength selection and chopping ............................................................... 36
3.4
Output optics and detection ...........................................................................37
3.4.1
Output optics .......................................................................................... 37
3.4.2
Pyroelectric reference detector ............................................................... 38
3.4.3
Other detectors ....................................................................................... 43
3.5
Other equipment ............................................................................................ 44
iv
4
Setup automation .................................................................................................. 45
4.1
5
4.1.1
RS-232 interface drivers ......................................................................... 46
4.1.2
Monochromator...................................................................................... 47
4.1.3
Filter wheel ............................................................................................ 48
4.1.4
Other devices ......................................................................................... 50
4.2
Programs for electrical measurements ........................................................... 50
4.3
Programs for optical measurements ............................................................... 51
Lock-in amplifier linearity .................................................................................... 53
5.1
6
Precision attenuator ....................................................................................... 54
5.1.1
Design.................................................................................................... 54
5.1.2
Performance ........................................................................................... 57
5.2
Measurement setup........................................................................................ 57
5.3
Linearity measurements................................................................................. 58
Preamplifier for photoconductive detectors ........................................................... 61
6.1
Design ...........................................................................................................61
6.1.1
Power supplies ....................................................................................... 62
6.1.2
Biasing circuit ........................................................................................ 63
6.1.3
Amplifier circuit ..................................................................................... 63
6.2
Characterization ............................................................................................ 64
6.2.1
Gain ....................................................................................................... 65
6.2.2
Linearity ................................................................................................ 65
6.2.3
Frequency response ................................................................................ 66
6.3
7
LabVIEW device drivers ............................................................................... 45
Optical measurements ................................................................................... 68
Conclusions .......................................................................................................... 69
References ................................................................................................................... 71
Appendices.................................................................................................................. 78
Appendix A. Radiometric Quantities in SI units ...................................................... 79
Appendix B. Photoconductive detector preamplifier, schematics ............................. 80
Appendix C. Photoconductive detector amplifier, list of components ....................... 84
Appendix D. Photoconductive detector amplifier, program code .............................. 87
v
Symbols and Abbreviations
Ad
Ae
Am
Ao
Ar
As
AC
ADC
APD
b
bc
B
Bn
BNC
c
C
c0
CSV
d
D
D*
DC
DLL
Ee
Eeλ
Eg
Ep
fc
ECPR
EEPROM
FPA
G
h
HUT
Id
Idet
Ie
Ieλ
Iout
IR
JNI
k
kB
Active area of a detector
Electrical area of a detector
Amplitude of a measurand signal
Optical area of a detector
Amplitude of a reference signal
Source area
Alternating Current
Analog-to-Digital Converter
Avalanche Photodiode
Wien's displacement constant
≈ 2,8977685 · 10-3 m·K [1]
Maximum contrast constant
≈ 2,410 · 10-3 m·K [2]
Optical band pass
Noise equivalent bandwidth of measurement system
Bayonet Nut Coupling
Speed of light
Capacitance
Speed of light in vacuum
= 299 792 458 m·s−1 [1]
Comma-Separated Values
Grating constant
Detectivity
Specific detectivity
Direct Current
Dynamic Link Libraries
Irradiance
Spectral irradiance
Band gap energy
Energy of a photon
Cut-off frequency
Electrically Calibrated Pyroelectric Radiometer
Electronically Erasable Programmable Read-Only Memory
Focal-Plane Array
Gain
Planck constant
≈ 6,626 069 57 · 10-34 J·s [1]
Helsinki University of Technology
Dark current
Detector current
Radiant intensity
Spectral radiant intensity
Output current
Infrared
Java Native Interface
Angular wavenumber
Boltzmann constant
≈ 1,3806503 · 10-23 J·K-1 [1]
vi
Le
LASER
LCD
LED
m
Me
MASER
MCT
N
NEB
NEI
NEP
NI
Pinc
PCB
PEM
PSD
PPTC
Qe
QDIP
QWIP
R
R1
R2
Ra
Ra||b
Rb
RD
RIN
RL
RMS
S
SI
SNR
t
T
Text
um
uin
un
ur
̃
UV
Vatt
VB
Vin
Radiance
Spectral radiance
Light Amplification by Stimulated Emission of Radiation
Liquid Crystal Display
Light Emitting Diode
Diffraction order
Radiant exitance or radiant emittance
Microwave Amplification by Stimulated Emission of Radiation
Mercury Cadmium Telluride
Number of measurement samples
Noise Equivalent Bandwidth
Noise Equivalent Irradiance
Noise Equivalent Power
National Instruments
Incident optical power
Printed Circuit Board
Photoelectromagnetic
Phase Sensitive Detector
Polymeric positive temperature coefficient
Radiant energy
Quantum Dot Infrared Photodetector
Quantum Well Infrared Photodetector
Magnitude
Resistance in amplifier model
Resistance in amplifier model
Attenuator resistance to input
Parallel connection of Ra and Rb
Attenuator resistance to ground
Dark resistance
Input resistance
Load resistance
Root Mean Square
Responsivity
International System of Units (French: Système international d'unités)
Signal-to-Noise Ratio
Time variable
Absolute temperature
Temperature of an external enclosure
Measurand signal
Input signal
Noise component
Reference signal
Phase shifted reference signal
Ultraviolet
Attenuated voltage
Bias voltage
Input voltage
vii
Vn
VO
Vout
VAC
VI
VISA
X
w
y
Y
Zin
Zout
α
ΔVO
ΔVO,max
ΔΦe
ε
η
θ
θd
θi
λ
λ0
λc
λc,max
λm
λmax
Λ
υ
̃
ρy
σ
φm
Φe
Φeλ
ωr
Noise voltage
Extraction voltage of a photoconductive detector
Output voltage
Voltage in Alternating Current
Virtual Instrument
Virtual Instrument Software Architecture
Lock-in amplifier X output
Width of a monochromator’s exit slit
Distance from the optical axis
Lock-in amplifier Y output
Input impedance
Output impedance
Ratio of load resistance and dark resistance
Output voltage sensitivity
Maximum of output voltage sensitivity
Net radiant flux
Emissivity
Load resistance efficiency of photoconductive resistor
Angle between viewpoint and surface normal
Diffraction angle
Angle of the incident light
Wavelength
Photon wavelength in vacuum
Cut-off wavelenght
Wavelength for maximum spectral radiance contrast
Wavelength corresponding to diffraction order m
Wavelength for maximum spectral radiance
Nominal attenuation
Frequency
Wavenumber
Reciprocal linear dispersion
Stefan–Boltzmann constant
= 5,670 373 · 10-8 J·s−1·m−2·K−4 [1]
Phase shift
Radiant flux
Spectral power
Reference frequency
viii
1
Introduction
We are constantly surrounded by electromagnetic radiation. Most of it goes unnoticed,
since only a small part of the radiation spectrum is visible to human eye. The vast
region of optical radiation that has longer wavelength than visible light, yet shorter than
microwaves, is known as infrared radiation. A major part of molecular electronic
transitions as well as vibrations and rotations in molecules occur in the energy range of
an infrared photon. Therefore, infrared radiation offers an interesting research field in
the radiometric sciences. Furthermore, common applications of infrared radiation, such
as thermal imaging, medical treatment, surveillance or meteorology, affect our everyday
lives.
This work continues the infrared radiometry project at the Metrology Research Institute.
In the first phase of the project, a facility for spectral responsivity measurements of
infrared detectors was established [3]. The facility was then adapted for transmittance
measurements and the nitrogen purging was also introduced [4]. The latest major
improvement was the extension of the spectral responsivity scale using a pyroelectric
reference detector [5]. The versatile measurement facility is currently capable of
measuring spectral responsivity, spectral transmittance and spectral power distribution
in the wavelength range of 750 nm to 16 µm.
The second chapter outlines the essential theory of infrared radiometry, whereas the
improved measurement setup is introduced in the third. The main improvements are
related to stable sourcing of infrared radiation and refining the quality of measured
electric signal. Also the low frequency response of the pyroelectric reference detector
was determined. In addition, all measurement and control devices were mounted to a
rack cabinet and the setup was completely automated. The setup automation and
measurement procedures are treated in the fourth chapter.
Phase sensitive detection is utilized in the measurements by using a device called a
lock-in amplifier. It enables the detection of very small signals in the presence of
overwhelming noise. Optical chopping is required to modulate the measured light at a
1
known reference frequency. However, the accuracy and linearity of lock-in amplifiers
are poorly reported and test measurements commonly make use of complicated optical
setups. Therefore, development and testing of a purely electrical testing method for the
lock-in amplifier was taken as an objective of this thesis. The method and the
measurements are introduced in the fifth chapter.
Photoconductive detectors are commonly used in infrared measurements. Different
types of detectors have very different properties and are generally used with a matched
preamplifier. As a part of the thesis, requirements for a more universal preamplifier
were studied, and such a device was then designed, built and characterized. The
preamplifier and optical measurement for which it was used are introduced in the sixth
chapter.
2
2
Theory of infrared radiometry
2.1
Fundamentals
The energy of a photon Ep depends only on its frequency υ or inversely, its wavelength
λ via the relation
,
(2.1)
where c is the speed of light and h is the Planck constant (6,626 069 57 · 10-34 J·s or
4,136 667 516 · 10-15 eV·s). Therefore the spectrum of electromagnetic radiation can be
denoted equivalently in terms of energy, frequency or wavelength [6]. It should be
noted that the speed of light and the wavelength of a photon are dependent of the
propagation medium and in general, wavelength refers to photon’s energy using the
speed of light in vacuum c0 (299 792 458 m·s−1) and the corresponding wavelength λ0.
Often used quantities are also the angular wavenumber k and the spectroscopic
wavenumber ̃ [7]:
̃
.
(2.2)
2.1.1 Infrared spectrum
The electromagnetic spectrum with commonly used division to categories is presented
in figure 2.1. Wavelengths ranging from 5 nm to 1 mm are traditionally considered to be
the region of optical radiometry. Only a tiny fraction of the whole range, wavelengths
between 380 nm and 760 nm, are visible light. Slightly different values for both
definitions can be found in literature. In any case, optical radiation with shorter
wavelength, or correspondingly higher energy, and optical radiation with longer
wavelength and lower energy are called ultraviolet (UV) and infrared (IR) radiation,
respectively [8].
3
Figure 2.1 The Electromagnetic spectrum. [9]
There are countless standards and conventions based on context and applications for
subdividing the vast infrared region. For the purposes of this study, a division
commonly used in astronomy was used. This division, also presented in Figure 2.2, was
selected mainly for practical reasons, as it was also used in all the previous works [3],
[4] and [5]. The infrared spectrum is split into three regions. Near infrared region (NIR)
includes wavelengths from the end of the visible spectrum, around 760 nm, up to 5 µm.
Mid infrared region (MIR) covers the range between 5 µm and 30 µm. Far infrared
region extends all the way to the edge of microwave frequencies, from 30 µm to 1 mm.
These regions are also known as short-wave, mid-wave and long-wave infrared regions,
respectively. The region overlapping far infrared and microwave radiations is often
referred as the terahertz waves. The measurement setup improved as a part of this thesis
was originally used mainly in the near infrared region [3], but was later extended to the
mid infrared regime, covering wavelengths up to 16 µm [5].
4
Figure 2.2 One commonly used subdivision for infrared region , also used
in the scope of this work.
2.1.2 Spectrometer
Any device that measures any kind of spectrum is a spectrometer, per se. In an optical
spectrometer, however, the emission, absorption, or fluorescence spectrum of a material
is measured. The wavelength selection can be accomplished for example by using
optical filters, prisms, gratings, Fourier-transform techniques, tunable lasers, or
combinations of the methods mentioned above [10]. The measurement setup concerning
this thesis uses optical filters and a monochromator with a single grating in a so called
Czerny-Turner mount, both discussed later in chapters 2.4 and 3.3.
2.2
Sources of infrared radiation
In general, any device transforming energy into the optical part of the electromagnetic
spectrum is a light source, but for all practical purposes a light source should provide
enough constant radiant power in the wavelength region in hand. The emission of an
optical source can be either spontaneous or stimulated, and both types of radiation
sources are available in infrared region. For the purposes of this work only electrically
powered light sources were studied.
In spontaneous emission a transition from an excited energy state to a lower energy
state occurs. This can happen in an atom, molecule or nanomaterial that is excited, for
instance, by heat, electric arc, electromagnetic radiation or electron-hole pair
recombination. Incandescent lamps are based on thermal excitation and have a broad
output spectrum. Fluorescent lamps usually use ultraviolet light for excitation of
fluorescent material and produce wide spectrum with notable peaks. Gas-discharge
5
lamps have narrow emission lines, which depend on the gas or gas mixture in question,
whereas light emitting diodes typically emit monochromatic light. A broadband
spectrum is usually needed in monochromator-based radiometry, but in some cases also
monochromatic or narrowband sources can be useful.
Stimulated emission on the other hand involves strong energy pumping that excites
atoms or molecules in a lasing media. The excited electron is then stimulated by photon,
causing it to drop to a lower energy level. This creates in a new photon with the same
energy, phase, polarization and direction as the stimulating photon. When the excited
state has more electrons than the lower energy state, the rate of stimulated emission
exceeds that of absorption, resulting in optical amplification. Lasers, masers and optical
amplifiers use stimulated emission.
The theory of an ideal black body radiation source is very useful in many infrared
applications and it is described extensively in the first subchapter. The second
subchapter deals with incandescent light sources, which are the most commonly used
broadband sources in infrared spectroscopy. Various other light sources are introduced
in the third subchapter, main focus being in those of broad spectrum. More information
on optical sources in general is widely available, for example in [10], [11] and [12],
whereas detailed descriptions of infrared sources can be found for instance in [13], [14]
and [15].
2.2.1 Ideal black body
Electromagnetic radiation is emitted from all matter with a temperature above absolute
zero. A black body is a theoretical idealization of a physical body that absorbs all
incident electromagnetic radiation. Since there is no reflected radiation, the black body
radiates incandescently in a continuous spectrum that depends only on the body's
temperature. The spectral radiance of an ideal black body, that is, power emitted per
unit surface area that falls within a given solid angle as a function of wavelength, is
defined by Planck’s law
6
,
(
(2.3)
)
where kB is the Boltzmann constant (1,380 650 3 · 10-23 J·K-1) and T is the absolute
temperature. Spectral radiance of a black body as a function of wavelength in different
temperatures is plotted in Figure 2.3. A black body is also a perfect Lambertian radiator,
meaning that its radiance is independent of view angle, and therefore its radiant
intensity Ie is determined by the Lambert's cosine law
( )
( )
( )
( )
(2.4)
where θ is the angle between the viewpoint and the source surface normal, Le is the
source radiance and As is the source area. [2]
Figure 2.3 Spectral radiance of an ideal blackbody as a function of
wavelength in different temperatures.
From figure 2.3 we can distinctly see that the wavelength at which the spectral radiance
reaches its maximum decreases when temperature increases. Wavelength for maximum
7
spectral radiance at a given temperature can be found by setting the partial derivative of
equation 2.3 equal to zero
.
(2.5)
This results is known as Wien's displacement law, where b is called Wien's
displacement constant (2,8977685 · 10-3 m·K). Using this law we can observe, that
black or grey bodies having a temperature around 3 – 3800 K will peak of emitted
power in the infrared region. Another result somewhat similar to Wien's displacement
law is the law for maximum temperature sensitivity of spectral radiance, also known as
maximum contrast law. By taking both partial derivatives and the setting the result to
zero we can obtain
[
]
,
(2.6)
where bc is a maximum contrast constant (2,410 · 10-3 m·K). So, for instance, at a
temperature of 300 K the spectral radiance has a maximum around 9,7 µm, but the
spectral radiance is most sensitive to temperature changes around 8,0 µm. [2]
The ratio of energy radiated by a physical body to energy radiated by an ideal black
body at the same temperature is called emissivity ε. All real materials have emissivity
less than one, and it is among other things a function of wavelength, angle of radiation,
temperature and surface roughness, but in practice it can often be treated as a constant.
Especially when the emissivity is assumed to be independent of the wavelength, the
shape of the object’s emission spectrum is equivalent to the spectrum of a black body.
This is known as the gray body assumption. The emissivity of real black body cavities
is typically greater than 0,99. [16]
Total radiant emittance of a black body, in other words, the total power radiated per unit
surface area of a black body, can be derived by integrating Planck law over all
wavelengths and over the half-sphere solid angle. The result obtained is known as the
Stefan-Boltzmann law
8
,
(2.7)
where σ is the Stefan–Boltzmann constant, defined as
J·s−1·m−2·K−4 .
(2.8)
Real objects, however, do not emit all the power and therefore the emissivity of the
material has to be taken into account. In the case of a grey body, Stefan-Boltzmann law
takes the form
.
(2.9)
If the body is in an enclosure, such as a cavity or a room having a temperature Text, it
will both radiate and absorb energy. The net radiant flux, or the net radiant power, of a
source area of As becomes then [17]
(
).
(2.10)
2.2.2 Incandescent sources
Incandescent light sources are most used in the near and mid infrared region. At longer
wavelengths, a fundamental problem raises from the conflict between Wien's
displacement law and Stefan-Boltzmann law described in equations 2.5 and 2.7,
respectively. In order to spectral radiance peak at longer wavelengths, the temperature
should be lower. This in turn strongly reduces radiant emittance. Nevertheless, at
shorter wavelengths incandescent sources are irreplaceable.
Most incandescent light sources, such as the common light bulb, are based on a tungsten
filament. The lamps are protected from air by glass envelope that is either evacuated or
filled with inert gas. Lamps usually operate in the area of 1400 – 2400 K [11], but for
special purposes much higher temperatures can be used – with inevitable cost of
shortened lifespan, the absolute upper limit being the melting point of tungsten at
9
3695 K [13]. Spectral power of a common commercial infrared lamp is illustrated in
figure 2.4.
Figure 2.4 Spectral power distribution of Philips IR R125 series infrared
lamps at the nominal filament temperature of 2450 K. [18]
The problem with standard tungsten filament lamps is evaporation on the filament. The
higher the temperature is, the faster the process. The evaporated tungsten builds up to
the inner wall of the bulb and affects the output of the lamp by absorbing some of the
radiation. The filament itself also thins, causing the temperature locally to raise,
filament to evaporate even more, and eventually to break. A halogen lamp, also known
as the quartz-tungsten halogen lamp or the tungsten halogen lamp, offers a solution to
this problem. It has a similar tungsten filament, but it is contained within a mixture of
inert gas and some halogen gas. This halogen compound, for example iodine (I2),
methyl iodide (CH3I) or hydrogen bromide (HBr), both combines with tungsten
attached to the bulb and redeposit it back to the filament. This regeneration is known as
the halogen cycle. Higher temperature causes the tungsten–halogen pair to decompose
more rapidly, so the process automatically targets the thinnest points of the filament.
Because higher filament temperatures can be used, halogen lamps are brighter and more
efficient compared to normal tungsten lamps. Halogen lamps also have to be smaller in
size, since the halogen cycle requires glass surface temperature to be at least 470 K,
usually around 670 – 1300 K.
The glass envelope in a normal or tungsten filament lamp absorbs significantly radiation
that has wavelength above 2,5 µm. The glass acts as a radiator itself, but naturally the
surface temperature is far less than the filaments. The total spectrum of the lamp is
10
combination of these two spectra. The spectrum of a filament lamp can be improved
with a special sapphire glass, which allows good spectral range up to 3 µm. [19]
Incandescent sources don’t necessarily require any kind of enveloping glass. The
simplest solution is merely using electrically heated resistance wire as an infrared
source. This of course has a very limited temperature range, and therefore high
radiances can only be attained briefly. A ceramic element on the other hand can operate
well above 1000 K temperatures and have acceptable emissivity of 0,8 [20]. Spectral
radiance of a commercial ceramic element is presented in figure 2.5. Some ceramic
sources used originally for ignition purposes, reach temperatures around 1800 K [21].
Nernst glower is a similar, nowadays widely obsolete, device composed of a mixture of
certain oxides. It does not conduct electricity at room temperature, but requires external
start-up heating. One of its main replacements is a device alike, but made out of silicon
carbine and commonly known as a globar. These devices make external heating
unnecessary, function at a high temperature and have an emissivity as good as 0,88 [5].
Figure 2.5 Spectral radiance of a ceramic element in different temperatures
[20]. The peaks are noticeably narrower compared to a black body radiator.
11
Higher emissivity can be achieved with cavity blackbody radiators. They are based on a
closed cavity with a small hole for output radiation. This structure captures almost all
incident radiation, and when it is kept at a constant temperature it almost resembles an
ideal black body; although for best performance the temperature and wavelength ranges
might be rather limited. Nevertheless, black bodies with emissivity well above 0,999
have been reported [22], [23].
2.2.3 Other sources
Light emitting diodes for near infrared region have been long available. In fact the very
first LEDs operated in the infrared region. Due advances in quantum technology and
manufacturing, wavelengths up to mid infrared region are reachable. So called quantum
cascade technology enables broadband emission in the infrared region. Originally these
devices required low temperatures to operate, but LEDs have been reported to have
emission in the spectral range of 5 – 8 µm at room temperature [24] and a flat band
from 6 to 8 µm at low temperatures [25]. There is also a recent patent for multiwavelength light source using various semiconductor elements that is specially designed
for spectroscopy in the range of 650 – 2500 nm [26].
The very narrow spectrum of a common laser can be used for instance for calibration
purposes in spectroscopy and there are devices available in the whole infrared region.
Also broadband lasers are available, exploiting various quantum structures. Devices
operating in the room temperature have been reported having continuous spectrum from
7,7 to 8,4 µm [27]. Supercontinuum generation on the other hand offers broadband
radiation in optical fibers. Using this method, a broadband infrared source with
emission up to 3,2 µm is demonstrated [28], while commercial applications with
emission ranging from visible light to 2,5 µm are available [5].
Gas-discharge lamps, as the name suggests, send electric discharge through ionized
noble gas or mixture of gases, usually mixed with other materials like mercury.
Collisions between free electrons and atoms excite some of the electrons in atomic
orbitals to a higher energy level, which then emit light at a material specific emission
12
lines. A special argon arc source has been designed for radiometric purposes. It is
superior to incandescent infrared sources in the 1 – 10 µm wavelength region [29].
Cryogenic application can extend wavelengths up to 20 µm [30].
2.3
Considerations on infrared optics
The principles of optics are fundamentally the same in infrared region than in any other.
Still, some special features have to be taken into account for instance in component and
material selection. The infrared absorption of normal atmosphere is one major concern.
This problem can be solved by using only suitable wavelengths, or performing the
measurements in vacuum or in a purging gas, such as nitrogen. The latter solution of
purging is also used in the measurement setup related to this thesis and is examined
thoroughly in [4].
Absorption is also a problem in optical components. Lens materials commonly used in
the visible region are rather opaque at longer wavelengths. There are many alternative
materials in the near and mid infrared regions, many of which, though, are fragile,
hygroscopic or toxic.
Many metals on the other hand have well known and flat reflectance over wide spectral
range. Therefore reflective components are often a preferable option in the mid and far
infrared regions. The reflectance spectrum of various metal coated mirrors is shown in
figures 2.6 and 2.7.
13
Figure 2.6 The reflectance spectra of aluminum (red), gold (green) and
silver (blue) coated IR mirrors in 0° angle. [31]
Figure 2.7 The reflectance spectra of aluminum (red), gold (green) and
silver (blue) coated IR mirrors in 45° angle. [31]
With black coating materials the problem is completely opposite. These materials are
used in components when reflection is unwanted, such as baffles and cavities. Materials
that are very black in visible light usually are not in the infrared region. For most
purposes commonly used optical blackout sheets, metal blacks, carbon based paints and
polymers are good enough. For more demanding applications a surface treatment
known as the super black can be used. This technique is based upon chemically etched
nickel-phosphorus alloy. The reflectance is around one percent in the near infrared
14
region but rapidly increases thereafter [32]. The best blackbody material so far in a wide
spectral range is a recently discovered nanotube structure, that has a remarkable
reflectance of less than two percent in the 0,2 – 200 µm wavelength range. It is
manufactured by growing a forest of vertically aligned single-walled carbon nanotubes
on a silicon wafer [33].
A comprehensive overview of material selection regarding lenses, mirrors and black
coatings in the infrared region can be found in [5].
2.4
Wavelength selection
This chapter outlines the most important principles and features of diffraction grating
monochromator and filter based wavelength selection. More profound review on the
matter can be found for instance in [10] or [11].
A monochromator uses a diffraction grating or a prism to separate a monochromatic
beam from a broadband radiation. It acts as an optical band pass filter by focusing a
small part of the spatially distributed light. The diffraction grating has multiples slits or
grooves in a periodic configuration that creates a diffraction pattern of the incident light.
This can be expressed mathematically with a so-called grating equation:
(
)
,
(2.11)
where d is grating constant or the distance between the grooves on the grating, θi is the
angle of the incident light, θd is the diffraction angle, m is the diffraction order and λm is
the corresponding wavelength. The reciprocal of the groove constant is known as the
groove density. Figure 2.8 illustrates how multiple wavelengths with different
diffraction order satisfy the equation. [10]
15
Figure 2.8 Illustration of the multiple solutions to grating equations with
different diffraction order. [5]
The monochromator has a narrow but finite band pass. The spatial density of
wavelengths in the diffracted distribution is called reciprocal linear dispersion ρy. It is
measured in the plane of the exit slit transverse to the optical axis and is defined as
,
(2.12)
where y is the distance from the optical axis. The band pass B of the monochromator
can now be approximated:
,
(2.13)
where w is the width of the exit slit. Since the reciprocal linear dispersion is a function
of diffraction angle, the approximation works best when the exit slit width is small. As a
conclusion, smaller exit slit leads to narrower band pass, but of course the overall
optical power decreases.
As a consequence of multiple wavelengths passing the monochromator, a set of filters is
required to eliminate the unwanted wavelengths. Usually this is done using long wave
16
pass filters but in some cases a band pass filter might be beneficial. Infrared filters are
typically made on a germanium substrate but in the near infrared region also silicon can
be used. New type of plastic filters that have good thermal characteristics and tolerance
for harsh chemical environment can be used close to visible light wavelengths [34]. The
performance of a typical germanium based infrared filter is presented in figure 2.9.
2.9 The performance of a typical infrared long wave pass filter on a
germanium substrate . [35]
2.5
Detectors
Optical detectors measure optical power. Based on their operation principle they are
generally divided into photomultiplier tubes, photon detectors and thermal detectors.
The latter two are briefly discussed in the second and third subchapter, respectively,
whereas photomultiplier tubes are beyond the scope of this work. All devices mentioned
above are available for wide a range on radiation, but this thesis highlights the infrared
region. Some general theory and important detector parameters are introduced in the
first subchapter. More information on optical detectors at large can be found for
instance in [10], [12] and [36], while [13], [37] and [38] focus on the infrared range
detection.
17
2.5.1 Theory and definitions
A detector converts incident optical power Pinc to either output voltage Vout or output
current Iout. Only detectors with voltage output will be discussed here, since all the
equations apply when voltage terms are replaced by current terms. The responsivity of
the detector S, also known as the photo sensitivity, is defined
.
(2.14)
If the irradiance Ee on the active area of the detector Ad is constant, one can simply
assume
.
(2.15)
In general, responsivity does not take the radiation spectrum into account. Therefore, it
is defined in terms of suitability for application in question. For instance, the
responsivities of infrared detectors are often measured with the spectrum of a 500 K
black body. Spectral responsivity Rλ instead measures the wavelength dependence of
detectors’ response and is defined in terms of spectral power. The output of an ideal
thermal detector is only dependent on the incident optical power and has therefore flat
spectral response. The output of a photon detector on the other hand is dependent on the
amount of incoming photons and has linearly increasing spectral response up to the cutoff wavelength λc. If the detector material has a band gap energy Eg, according to
equation 2.1 we can determine the cut-off wavelength
.
(2.16)
Noise equivalent power NEP is the quantity of incident power needed to equal the
output and the intrinsic noise level of the detector, or in other words, it is the input
power resulting to signal-to-noise ratio of one:
18
(2.17)
⁄
where Vn is the noise voltage. Similar term noise equivalent irradiance NEI describes
the performance of the whole system and is defined as the irradiance needed at the
entrance aperture for the system output to have the signal-to-noise ratio of one.
The inverse of NEP is called detectivity D, which is proportional to the square root of
detector active area and noise equivalent bandwidth of the measurement system Bn.
Therefore, for detector comparison normalized detectivity is more convenient. The most
used quantity is the specific detectivity D*, that is defined as detectivity normalized to
an effective area of 1 cm2 and noise equivalent bandwidth of 1 Hz. It is expressed as
√
√
(2.18)
and is typically measured in the unit of cm·s−½·W−1 [2]. A comparison of the specific
detectivity of various commercially available infrared detectors and theoretical limits is
presented in figure 2.10. The chopping frequencies used in the figure are 10 Hz and
1 kHz for thermal and photon detectors, respectively.
19
Figure 2.10 Comparison of the specific detectivity of various commercially
available infrared detectors (solid lines) and theoretical limits (dashed
lines). [38]
2.5.2 Photon detectors
Intrinsic, extrinsic and free carrier based semiconductor detectors together with
quantum well and quantum dot structure based detectors are considered to be photon
detectors. They all use electron excitation to detect incident radiation and have an
absolute minimum energy level for detectable photon. The detection of small energy
photons also requires cooling in order to reduce thermal oscillations in detection
material. A simplified model of a general photon detector is presented in figure 2.11.
Usually the optical area Ao and electrical area Ae are tried to be manufactured equal in
size, but when the use of concentrator is possible, the ratio Ao / Ae can be increased.
20
Figure 2.11 Model of a photon detector. [38]
Intrinsic detectors utilize the generation of electron-hole pairs across the semiconductor
band gap in single semiconductor or a junction of semiconductors. Extrinsic detectors
used doped semiconductor materials creating impurity states in the band gap, where
charge carriers can transit. This allows photons with smaller energy to excite an
electron. The disadvantage here is that thermal excitations are also easier and cooling to
a low temperature is necessary. In free carrier detector the photon energy is absorbed by
a free carrier in either conduction or valence band.
Advanced manufacturing techniques enable complicated quantum structures to be
grown on semiconductors. These are based on bound states of an electron and hole,
known as excitons. Confinement in one dimension is called a quantum well and
confinement in all three dimensions is a quantum dot. Especially well structures have
very important applications for example in space technology and thermal imaging. A
quantum well infrared photodetector (QWIP) has been demonstrated in the range of 3 to
80 µm. A focal plane array (FPA) construction of QWIPs allows high performance
imaging at long wavelengths [39]. Quantum dot infrared photodetectors (QDIP) have
also been commercialized for infrared imaging devices and are feasible in high speed
operations [40].
Photon detectors can also be divided into groups by operational mode, which are
photovoltaic, photoconductive, photoemissive and photoelectromagnetic (PEM). Most
21
materials mentioned above can be used in different modes of operation. Photovoltaic
detectors have a semiconductor junction, where a photon absorbed in the depletion
region excites an electron from the valence band to the conduction band. This creates a
potential difference at the junction and current can flow in a closed circuit.
Photoconductive detectors on the other hand do not have a semiconductor junction and
require external voltage across the detector. The electron excitation by absorbed photon
then changes the measured resistance of the detector. Photoemissive detectors are based
on the photoelectric effect, where electrons are emitted from matter as a consequence of
photon absorption. Typical construction is a metal and a semiconductor junction that
creates Schottky barrier. An avalanche photodiode (APD) is a photoemissive detector
that provides high gain by generation of secondary charge carriers. PEM detectors
exploit the photoelectromagnetic effect, where the photon absorbed by the
semiconductor in a magnetic field generates electric current. [38]
2.5.3 Thermal detectors
Thermal detectors operate on the principle that incoming radiation increases their
temperature. Temperature changes are then measured by a temperature-dependent
mechanism, such as thermoelectric voltage, pressure or resistance change or
pyroelectric voltage. Due to this energy conversion process, thermal detectors are
generally slower and require higher power levels than photon detectors. In turn they can
operate at room temperature, are relatively low cost and usually rugged, reliable and in
principle, do not have spectral dependence in responsivity. [38]
Most common type of thermal detectors is the pyroelectric. Detector makes use of
pyroelectric materials that become polarized when heated, much the same as
piezoelectric material becomes polarized under pressure. This generates a tiny electric
current that can be amplified and measured. The polarization charges will eventually
drain, making the pyroelectric material neutralized. Therefore constant or very slowly
modulated radiation cannot be measured.
22
Thermopile detectors exploit the thermoelectric phenomenon, where two different
conductors generate a voltage proportional to a temperature gradient. Many
thermocouple junctions can be furthermore connected in series to multiply the output
level. The response time of a thermopile is typically around milliseconds, but it can be
improved by reducing the active element volume. Semiconductor thermopiles have a
higher sensitivity, but the traditional metal connectors are found to be more suitable for
photometry.
Bolometers use temperature dependent resistance for detection. Semiconductors or
biased active component are typically used to achieve high temperature coefficient of
the resistance. Also some kind of heat absorbing mechanism is needed. The response
time of a bolometer can be adjusted with the design of the heat sinking, but it is around
milliseconds. Cryogenics cooling of the detector improves sensitivity and noise
characteristics, but is not mandatory.
2.6
Signal amplification
Signal amplification itself is a vast science, so the subject has been narrowed down to
two amplifiers most relevant to the thesis. The basic theory of lock-in amplifiers is
discussed in section 2.6.1, and the various lock-in related electrical measurements that
were conducted are presented in chapter 4. Section 2.6.2 deals with the theory related to
the amplification of photoconductive detector’s signal. Such a device was designed and
built as part of this thesis, and is closely examined in chapter 6.
2.6.1
Lock-in amplifier
A lock-in amplifier is a device that uses a phase sensitive detection method, and enables
the detection of very small signals in the presence of overwhelming noise. The method
requires the signal source to be modulated at a known constant reference frequency. A
simplified block diagram of a lock-in amplifier is presented in figure 2.12. For clarity
various filtering and amplifications stages found in real devices have been omitted in
23
this theoretical model. The multiplier stage of the lock-in amplifier is commonly
referred as a phase sensitive detector (PSD). [41]
Figure 2.12 Simplified block diagram of a lock -in amplifier.
The reference signal ur is a sine wave with an amplitude Ar and angular frequency ωr.
The phase shifter is used to generate another reference signal ̃ with 90° or π/2 radians
phase difference
(
), ̃
(
).
(2.19)
The input signal uin is a sum of a possible very large noise component un and the desired
measurand signal um, that has an unknown amplitude Am, and is being modulated with
reference frequency ωr. The measurement setup may cause a delay between reference
and measured signal, which is seen as phase shift φm
(
)
.
(2.20)
Using trigonometric identities one can obtain the result from input and reference signal
multiplication
̃
[
(
)]
[
(
)]
24
(2.21)
.
(2.22)
The multiplied signals are then being filtered with low-pass filter. When the cut-off
frequency is much lower than the reference frequency, ideally only DC signal is left.
The outputs X and Y can then be expressed as
(2.23)
.
(2.24)
So called magnitude R, which is directly proportional to the amplitude of the measured
signal, and phase of the measurement signal can now be calculated from the output
values:
√
(2.25)
(
).
(2.26)
Usually these values are computed in the lock-in amplifier, but if very rapid sampling is
needed, the calculation from X and Y values can be done later. For most devices X, Y
and R are scaled so that they represent the RMS value of measured signal. Usually one
can also measure the signal level at harmonic multiples of the reference frequency. [41]
The phase sensitive detection can be done either analogically or digitally. Modern
digital lock-in amplifiers outperform analog counterparts in virtually all respects. The
main problems in analog multiplication are related to insufficient harmonic rejection,
output offsets, errors in the gain and rather limited dynamic reserve.
Instead of gain, the term sensitivity is used to characterize the amplifications of a lockin amplifier. It is simply the full scale reading of the measured signal, somewhat similar
to a range in a multimeter. When using digital PSDs, averaging allows measurements of
signal levels even below one bit resolution. If N is the amount of measurement samples,
uncorrelated noise is reduced by a factor of 1/N. Oversampling an AC signal is rather
complicated, but since the filtered output of a PSD can be assumed constant, output
25
resolution simply increases by a factor of N. In essence, doubling the amount of
measurement samples adds one bit to output resolution. [42]
Traditionally dynamic reserve is defined as the ratio of the largest tolerable noise to the
full scale signal. However, in case of digital PSD this definition is not practical, because
as mentioned above there is no unambiguous limit to resolution. Instead, dynamic
reserve refers to the distribution of gain between the analog preamplifier and digital
multiplication. For optimum performance, dynamic reserve should be as small possible,
just enough to avoid noise voltage to overload any part of the device. [42]
2.6.2
Amplifier for photoconductive detectors
When an electric potential is applied across the absorbing region of a photoconductive
detector and the energy of an incoming photon exceeds the energy gap between the
valence and the conduction band, a current Idet proportional to the irradiance flows
through the detector [43]. The detector also has a certain dark resistance RD and
corresponding dark current ID. The output signal from a photoconductive detector is
commonly extracted as voltage VO by using a load resistor RL and bias voltage VB as
shown in figure 2.13 [44].
Figure 2.13 Model for extracting the output signal of a photoconductive
detector using load resistor R L and bias voltage V B .
26
When the detector is not illuminated, the output voltage VO is simply
.
(2.27)
A change in output voltage ΔVO due changes in RD when detector is exposed to light can
be approximated with differentiation:
(
.
)
(2.28)
The output voltage sensitivity has a maximum value
|
.
when RD and RL are equal:
(2.29)
In order to optimize the output signal level of the photoconductive detector, the load
resistance should be well matched. By dividing equation 2.28 with equation 2.29, the
efficiency of the detector due to resistor matching η can be calculated:
(
)
,
(2.30)
where α is the ratio RL/RD. The relation between the output efficiency and the ratio α is
shown in figure 2.14. Because the dark resistance values of the detectors can vary
enormously, the amplifier has to either be dedicated to one type of detectors or the load
resistance should be selectable. Typical decade selection of resistors provides the
minimum efficiency of about 73 %, while two resistors per decade increases the
minimum efficiency to about 92 %.
27
Figure 2.14 The relation between the output efficiency and the resistance
ratio R L /R D .
As seen in equations 2.28, the output sensitivity of the detector is also directly
proportional to the bias voltage. Therefore, it is usually beneficial to use as high bias
voltage as the detector can withstand. However, there are some exceptions; lead
selenide and lead antimony detectors have a specific threshold level for bias voltage,
after which the noise levels suddenly rise. So, the bias voltage should not be any higher
than necessary. In some cases the heating of detector element due higher bias voltage
causes a problem as the D* decreases, even the detector itself can endure [44]. In such
cases the manufacturer usually recommends the optimum biasing voltage range.
With mercury cadmium telluride (MCT) detectors the bias current is more important
factor than bias voltage or load resistance matching. Load resistance is usually in the
range of kilo-ohms and the bias voltage is adjusted to achieve the wanted bias current.
Figure 2.15 shows typical signal and noise behavior of MCT detectors as a function of
bias current. [44]
28
Figure 2.15 Typical signal and noise behavior of MCT detectors. [44]
29
3
Setup description and improvements
This chapter introduces the infrared spectrometer measurement setup. The main focus is
in the improvements done as part of this thesis. For more profound description of the
setup the reader is advised to look at the previous theses [3], [4] and [5]. The developed
computer control of the devices and the automation of the measurement setup are
described in the next chapter.
3.1
Setup overview
Figure 3.1 presents the overall layout of the measurement setup and an illustration of the
electrical signal paths. Device controllers and computer connections are omitted from
the figure for clarity. Table 3.1 explains the abbreviations used in the schematic
diagram. The whole setup is built inside three airtight boxes made of polypropylene;
this enables nitrogen purging when it is needed to avoid atmospheric absorptions. Cable
glands are avoided by using airtight feed-through connectors; BNC connectors are used
for measurement signals, DE9 connectors for device control and banana connectors for
high current power supply.
Table 3.1 Abbreviations used in the layout diagram of the measurement
setup in figure 3.1.
Abbreviation
CM
G
IRS
M
OPM
PS
RD
SM
TD
T/H
Meaning
Concave mirror
Diffraction grating
Infrared source
Flat mirror
Off-axis parabolic mirror
Power supply
Reference detector
Spherical mirror
Test detector
Thermohygrometer
30
Wavelength selection
Multimeter
Monochromator
CM
CM
PS
Temperature monitor
Detection
Detection
T/H
OPM
Source
SM
RD
OPM
TD
IRS
M
G
M
PS
OPM
Chopper
Filter wheel
Lock-in amplifier
Multiplexer
Figure 3.1 The layout of the measurement setup and an illustration of the
electrical signal paths.
The spherical mirror is used to collect and focus the radiation from the infrared source
to the monochromator through a filter wheel and an optical chopper. Light travels
through a one inch wide zinc selenide window from a box to another. The optical
chopper is placed in front of the entrance slit of the monochromator. The desired
wavelength is then focused to the exit slit of monochromator. The beam travels through
another optical window to the detection box. The two off-axis parabolic mirrors are
used to collimate and focus the beam to the detector plane. Detectors are mounted on a
linear detector stage, so that the reference detector and detector under measurement can
be, in turn, placed and fine adjusted to the beam. This substitution method is thoroughly
analyzed in [3].
As a part of the setup improvement all measurement and control devices were mounted
to a standard 19 inch rack cabinet shown in figure 3.2. The tag numbers refer to devices
listed in the table 3.2. All devices except the computer and its display are powered via
rack power strip. This allows the setup to turned on and off with a single flick of a
switch. The computer and its accessories are connected to a different phase in the power
31
grid, so that the disturbances caused by the switched-mode power supply could be
avoided. Also most data and power cables run behind the devices while signal cables
are in front, so as to minimize noise. In order to simplify data wirings, all device
communications were implemented with a USB hub and various interface adapters that
were placed behind the display. These connections are further explained together with
setup automation in chapter four.
Table 3.2 List of measurement and control devices mounted to the rack
shown in figure 3.2.
Tag
1
2
3
4
5
6
7
8
9
10
11
12
13
14
15
Device
Cooling fan unit
Linear translator controller
Rack main power switch
Monochromator controller
Power supply
High voltage supply
Multimeter
Lock-in amplifier
Filter wheel controller
Optical chopper controller
Power supply
Precision attenuator
Signal generator
Linear translator controller
Computer and accessories
Model
Self-made
Self-made
Adam Hall 87471
МДР-23
elc AL 924A
Stanford PS325
Agilent 34410A
Stanford SR830
Optec IFW
Terahertz Technologies C-995
Instoma TL201
Self-made
Agilent 33521A
isel IT116 flash
32
Figure 3.2 Measurement and control devices mounted to a standard 19 inch
rack cabinet.
The monochromator controller (number 4 in figure 3.2) and the high current power
supply (5) tend to heat a lot even when they are not active. Therefore, they were placed
under a cooling fan unit (1), which circulates air through the whole rack cabinet. The
cooling unit consists of four air fans and a variable transformer, so that the rate of the
airflow can be adjusted.
The signal generator (13) and the precision attenuator (12) are actually not part of the
spectral responsivity measurement setup. Originally they were used to characterize the
electrical properties of the setup. However, they were left as a part of the setup, as they
provide a simple and fast auto-calibration method for the phase sensitive measurement.
33
3.2
Radiation sources and input optics
The primary source of infrared radiation in the setup is a ceramic glower model
Mini−Igniter™ 301 manufactured by the Saint-Gobain Ceramics. Individual glowers
have significant differences in the material properties; at the nominal 12 V operating
voltage the steady-state current can vary from 1 to 2,4 A. This in turn leads to the
temperature range of 1150 – 1455 °C. More important factor is the power dissipation of
the glower, which can be adjusted by fine tuning the operation voltage. The maximum
rated temperature of the device is 1580 °C [21]. Assuming that the glower is roughly a
gray body, the Wien's displacement law in equation 2.5 predicts the spectral radiance to
peak around 2 µm region when the glower is used in the nominal temperature range.
The previously used glower was damaged and had to be replaced with a new one. The
dimensions of the new version glower were unfortunately changed, even though the
model number is the same. The actual glowing tip has the same dimensions, but the
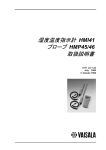
holder part is significantly larger. Due to this a new holder was machined on the basis of
the old one. Also a fitting piece was made that enables the smaller version of the glower
to be used as well. The new holder and the glower in operation are shown in figure 3.3.
Figure 3.3 The new holder and the ceramic glower in operation.
34
The ceramic glower can be used as an infrared radiation source up to 16 µm. For near
infrared operation a halogen lamp can be used. The model commonly used in the setup
is a 50 W Osram Halostar that peaks its optical power around 1,2 µm [3]. It provides a
good source of infrared radiation up to 2,5 µm, after which the glass envelope starts to
absorb the radiation [4].
Both radiation sources use the same power supply. Mastech HY3005D regulated power
supply was previously used in the setup. However, the device in question was measured
to be surprisingly noisy, having a root-mean-square ripple well above the nominal 500
µV [45]. The test measurement was done driving 12 V into an 8 Ω load. It was then
replaced with an elc AL 924A power supply, which is capable of providing voltage up
to 30 V and current up to 10 A. Higher current rating enables higher power light sources
to be used in the future. According to specifications, the absolute maximum ripple of
the device is 1,8 mV RMS and 5 mV peak-to-peak even at maximum current [46]. A
similar ripple measurement was conducted and the new device performed very well; the
RMS noise was less than 100 µV.
The old cabling from the power supply to the infrared source was replaced with a
thicker 4 mm2 cable in order to decrease the voltage drop. In addition to that, separate
voltage sensing cables were installed, so that the actual operating voltage of the source
can be monitored with a multimeter to compensate the voltage drop in the cables.
A concave spherical mirror made of aluminum and a protective layer of magnesium
fluoride is used to collect the radiation from the glower. The diameter of the mirror is 93
mm and the focal length 125 mm. The distance from the source to mirror is 165 mm and
it focuses the light to the entrance slit of the monochromator at a 455 mm distance. This
magnifies the source by a factor of about 2,8 making the image of the 1,3 mm wide tip
of the ceramic glower barely fulfill the 3,6 mm wide entrance slit of monochromator.
35
3.3
Wavelength selection and chopping
An eight position IFW filter wheel from Optec Inc. with a set of long wave pass filters
is used in front of the monochromator. This prevents the pass of unwanted diffraction
orders through the monochromator. Table 3.3 presents the current order of the filters
and their specification.
Table 3.3 Filter wheel arrangement and working regions . [5]
No.
1
2
3
4
5
6
7
8
Cut-on wavelength (5%)
Open aperture
Closed aperture
1,05 ± 0,04 µm
1,65 ± 0,07 µm
2,40 ± 0,09 µm
3,60 ± 0,14 µm
5,60 ± 0,10 µm
10,30 ± 0,10 µm
Working range
1,2 – 2,0 µm
2,0 – 2,7 µm
2,7 – 4,0 µm
4,0 – 6,0 µm
6,0 – 10,5 µm
10,5 – 16,0 µm
Substrate
Si
Ge
Ge
Ge
Ge
Ge
Part-number
LOT-Oriel 50829-FK
LOT-Oriel 50830-FK
LOT-Oriel 50831-FK
LOT-Oriel 50832-FK
BARR A36
BARR X0041
Terahertz Technologies C-955 optical chopper is placed in front of the monochromator.
It should be as close to the entrance slit as possible, since this minimizes the loss caused
by the finite aperture of the chopper. This also guarantees sharp rectangular shape of
modulation even with low chopping frequencies.
The chopper has two apertures, inner and outer, with frequency ranges of 4 – 500 Hz
and 40 – 5000 Hz, respectively. Both provide the 0,01 % accuracy and 1 mHz
resolution. Normally only the inner aperture is used, since it provides smaller phase
jitter, shorter rise and fall time of chopped optical signal and larger beam diameter.
The most important part of wavelength selection is the Czerny-Turner type
monochromator МДР-23. It was originally built to cover working range of 200 – 2000
nm [47], but the range has been extended by purchasing new gratings with smaller
groove frequency. All available gratings and their properties are listed in the table 3.4.
36
Table 3.4 Available gratings and their properties. Original accessories of
the monochromator are underlined . [5]
Grating
G1200 I
G1200 II
G600
G300
G150
G75
Groove frequency
[lines/mm]
1200
1200
600
300
150
75
Working
range [µm]
0,2 – 0,5
0,35 – 1,0
0,7 – 2,0
1,5 – 4,0
3,0 – 8,0
6,0 – 16,0
Type
Scaling
factor
Ruled
1
Ruled
1
Ruled
2
Holographic 4
Ruled
8
Ruled
16
The monochromator can be driven manually or with an external controller. The external
controlling is simply done by giving clock pulses to the driver of the stepper motor
rotating the grating. With the scaling factor of one the theoretical resolution is 3 pm per
clock pulse. For computer controlling via serial port a custom made controller is used
[48]. It was working inconsistently until a large filtering capacitor was added to the
supply voltage taken from the monochromator. The device uses a first degree
polynomial function to compute the needed amount of pulses to drive the
monochromator to a wanted wavelength, although separate clock pulses can also be
driven. A more sophisticated nonlinearity correction of the monochromator is done in
the computer program either by a higher degree polynomial function or spline function.
For instance a narrow bandwidth laser can be used as a calibration source. Without
filters all diffraction orders are seen in the output and the whole scale can be calibrated.
The nonlinearity correction functions are further discussed in section 4.1.2.
3.4
Output optics and detection
3.4.1 Output optics
The output beam of the monochromator travels through a zinc selenide window to the
third polypropylene box. The window has an antireflection coating, which improves the
transmittance to approximately 80 percent in the wavelength range of 1 to 15 µm. The
37
beam is diverging at this point, but it is then collimated with a bare gold coated off-axis
parabolic mirror placed at its focal length 152 mm from the monochromator exit slit.
Another similar mirror is used to focus the beam to the detector plane. A linear
translator is used to change detectors in the detection plane.
3.4.2 Pyroelectric reference detector
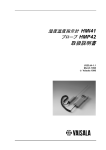
A hybrid pyroelectric detector SPH-49 from Spectrum Detector, shown in figure 3.4, is
used as a transfer standard for infrared responsivity measurements. The device consists
of a large lithium tantalate LiTaO3 pyroelectric element and a 100 GΩ transimpedance
amplifier. The detector was previously characterized up to 13 µm and was found to be
very linear as expected. Detector’s spectral responsivity in the wavelength range of 2,8
to 6 µm is shown in figure 3.5. In order to link the spectral responsivity of the
pyroelectric detector, the method of substitution was used to compare the pyroelectric
detector with the primary reference at wavelengths of 3 and 5 µm [5]. The primary
reference is an electrically calibrated pyroelectric radiometer (ECPR) that is traceable to
a cryogenic radiometer via comparison with silicon trap detectors [49].
Figure 3.4 Hybrid pyroelectric detector used as a transfer standard for
infrared responsivity measurements. In the left side picture a hemispherical
reflector is used for reflectance correction.
38
Figure 3.5 Spectral responsivity of the transfer standard between 2,8 and
6 µm measured at 15 Hz chopping frequency. The data points shown as red
dots were obtained by comparing the responses of the transfer standard and
the primary reference. [5]
The frequency response of the transfer standard, on the other hand, is known to be very
poor [50]. To confirm this behavior and to acquire more accurate correction
coefficients, the relative responsivity was measured at low chopping frequencies from 4
to 15 Hz, shown in figure 3.6. Values are compared to the responsivity at 15 Hz
chopping frequencies, which is also used in the comparison measurements with the
primary standard. More detailed documentation about the transfer standard is available
in [5].
39
Figure 3.6 Frequency response of the transfer standard at low frequencies.
Relative values are compared to the responsivity at 15 Hz chopping
frequency.
Strong noise signal level at line frequency and its multiples has been reported
previously to cause problems in measurements around same frequency range. This was
confirmed by measuring the output signal of the detector with an oscilloscope when the
input aperture was closed. Figure 3.7 shows the measured disturbance signal having a
peak-to-peak voltage of over 500 mV.
40
Figure 3.7 Output signal of the pyroelectric detector with blocked input
aperture.
The preamplifier of the detector was supplied by a typical bench top power supply
which seemed to cause most of the noise signal. Multiple power supplies were tested,
but the proximity of the devices to the detector seemed to cause similar effect in any
case. This is most likely due to the fact that the casing of the detector is connected
straight to amplifier’s ground potential. The problem was eventually solved by placing
the power supply two meters away from the detector and placing an external RC filter
network to supply lines close to the detector. The schematic of the filter is shown in
figure 3.8 and the resulting output with the improved arrangement in figure 3.9. The
level of the line frequency disturbance attenuated over 24 dB.
Figure 3.8 RC filter for the pyroelectric detector.
41
Figure 3.9 Output signal of the pyroelectric detector with blocked input
aperture after installing the RC filter. The attenuated disturbance signal
has a peak-to-peak voltage of about 60 mV.
Also has a high frequency noise component around 900 kHz was observed both with
and without the supply voltage filtering. The signal, shown in figure 3.10, has a peak-topeak voltage of around 3 mV. Fortunately this high frequency causes negligible error in
the low frequency lock-in measurements.
Figure 3.10 900 kHz disturbance signal measured at the pyroelectric
detector output.
42
3.4.3 Other detectors
Various other detectors have been used in the setup, of which the most important ones
are introduced in this section. The previous reference detector used in the setup was a
pyroelectric radiometer RK-5700 from Laser Precision with an internal chopper. This
device can still be used for instance in comparison measurements.
An indium arsenide photodiode model J12TE1-66D-R02M manufactured by the Judson
Technologies was previously mounted to the integrating sphere, but is now used
separately. The device has an internal preamplifier and thermoelectric cooling element.
The colder the photodiode is kept, the higher the responsivity, but also the wavelength
of the peak responsivity shortens. Typically measurement temperature is around -20 ˚C,
corresponding to 7,7 kΩ resistance in the thermoelectric cooling element. This results in
a peak wavelength of 3,3 µm. At longer wavelength the responsivity rapidly decreases.
Two photoconductive photodiodes, model P2038-03 lead selenide detector by
Hamamatsu Photonics and model J13TE1-3CN-S01M lead sulfide detector by Judson
Technologies, are also being used. These devices are compared in table 3.5.
Table 3.5 Comparison of the two photoconductive detectors used in the
setup. [51], [52]
Manufacturer
Model
Material
Temperature range [˚C]
Nomimal temperature [˚C]
Wavelenght range [µm]
Peak wavelength [µm]
Peak D* [cm·s−½·W−1]]
Typical D* [cm·s−½·W−1]]
Active area [mm2]
Dark resistance [MΩ]
Nominal bias voltage [V]
Maximum bias voltage [V]
Hamamatsu
P2038-03
lead selenide
-30 to +50
-10
1,5 to 5,1
4,1
3·109
3·108
3x3
1,7 – 7,0
50
100
43
Judson Tech.
J13TE1-3CN-S01M
lead sulfide
-30 to +50
-10
1,0 to 3,5
2,5
1,5·1011
1,5·109
10 x 10
0,5 – 8,0
240
500
3.5
Other equipment
Whenever possible, built-in preamplifiers of the photovoltaic detectors are used. In
other cases common current to voltage converter, such as Vinculum SP042 or Stanford
SR570 are used. For photoconductive detectors on the other hand a versatile
preamplifier was built, that is discussed in chapter 6. This device has an internal biasing
possibility of up to 64 volts. For higher voltages Stanford Research PS325 supply is
used as an external bias, which can provide DC voltage up to 2,5 kV and current up to
10 mA [53]. The output signals of various detectors and preamplifiers are routed to the
lock-in amplifier via Signal Recovery 3830 multiplexer. It has six floating channels that
can be used as either inputs or outputs and are coupled to one of two common buses
[54].
The temperature and humidity of the detection box can be monitored during the
measurement with a Vaisala HMI41 thermohygrometer. The temperature is measured
with 0,2 °C accuracy and relative humidity with 2 % accuracy [55]. More important
factor here is the stability of both values in comparison measurements. Some detectors
have an internal temperature control, but in other cases the temperature of detector is
controller with a Thorlabs TED200 temperature controller.
A step motor driven linear translator isel LES 5 is used in the detector plane. It was
previously driven with a self-made controller based on the escap EDM-453 stepper
motor drive circuit that allowed microstep operation up to 64 microsteps per full step,
resulting in 25600 microsteps per revolution [56]. At this resolution, the movement was
understandably agonizingly slow and because the stepping mode could not be changed,
it was typically used without microstepping. The former controller had broken down, so
a new controller was purchased. This new isel IT 116 Flash controller provides the same
maximum resolution of 25600 microsteps per turn [57] and the resolution can easily be
changed.
44
4
Setup automation
The first version of the measurement setup was controlled manually, but when nitrogen
purging was introduced, the setup was automated for most parts. The original
automation software was written in Java, but also used routines written in C and C++,
external C++ libraries with Java Native Interface (JNI), dynamic link libraries (DLL),
Windows ActiveX components and various native support packages. All in all, the
software was rather complicated, platform-dependent, sometimes unreliable and
laborious to modify and update.
When the development of the setup began, it became clear that various parts of the
original code had to be rewritten, and also the old computer had to be replaced. As a
part of the setup modernization the automation programs were decided to be rewritten
with visual programming language LabVIEW from National Instruments (NI). It is a
widely used system design platform and development environment very appropriate for
device control and automation. It is also de facto standard in the laboratory
measurements, since it provides a large selection of ready-made device drivers and data
processing libraries. [58]
Unlike a set of compiled Java programs, LabVIEW allows very adaptive programming,
so that built tools can be used with ease for any type of measurement. LabVIEW
functions are coded as separate virtual instrument files or VIs that act as building blocks
for new programs. A VI used inside another is commonly referred as a subVI. All code
was written with LabVIEW 9.0f3, being the latest available version of the software
available at the time.
4.1
LabVIEW device drivers
With the exception of preamplifiers, two power supplies and the cooling unit, all
devices in the measurement setup are computer controllable. These devices along with
their connection interfaces and used LabVIEW drivers are presented in table 4.1. For
four devices LabVIEW drivers were not available and they were self-written. The
45
multimeter Hewlett-Packard 3458A is not part of the measurement setup per se, but it
was used in various thesis related measurements and still provides a good tool for
calibration measurements.
All devices lacking a LabVIEW driver were coincidentally connectable via RS-232
serial port. This allowed many of the same type VIs to be used in all the drivers with
some modifications. The section 4.1.1 concerns general aspects of RS-232 interfacing
and the other sections focus on the actual device drivers that were written.
Table 4.1 Device connections and used LabVIEW drivers. Drivers that were
modified are unde rlined.
Device
Filter wheel
Optical Chopper
Monochromator
High voltage supply
Multiplexer
Lock-in amplifier
Multimeter
Thermohygrometer
Linear translator
Model
Optec IFW
Terahertz Technologies C-995
МДР-23
Stanford PS325
Signal Recovery 3830
Stanford SR830
Agilent 34410A
Vaisala HMI41
isel IT116 Flash
Interface
RS-232
RS-232
RS-232
GPIB
USB
GPIB
GPIB
RS-232
RS-232
Signal generator
Multimeter
Agilent 33521A
Hewlett-Packard 3458A
USB
GPIB
LabVIEW driver
Self-made
Self-made
Self-made
NI certified driver
Signal Recovery
NI certified driver
NI certified driver
Self-made
Techno Linear
Motion Systems
NI certified driver
NI certified driver
4.1.1 RS-232 interface drivers
LabVIEW’s built in communication tool called the Virtual Instrument Software
Architecture (VISA) was used for serial connection. This takes care of the port settings,
data flow and error handling. Most of device functions only require sending a command
and then parsing the replied information. Therefore, all drivers share similar connection
initialization and closing VIs, as well as message send and read VIs. In addition to VIs
listed in this chapter many utility VIs were written to perform simple tasks. These are
considered self-evident and are mainly excluded from the thesis.
46
The initialization VI is used to assign the serial connection related parameters. These are
the speed of the connection (bits/s), buffer flow control and the number of data, parity
check and stop bits. This is done using VISA Configure Serial Port VI. Also the possible
usage of termination character is specified. Some devices require some start-up data or a
command to enter remote mode. These are also sent by the initialization VI when
necessary. In order to ensure stable operation, an appropriate delay is set before exiting
the initialization VI.
The send and read VI sends a message to the device and waits for a possible reply. The
reading of the reply may also be ignored when it is unnecessary. Before sending
anything to the device the serial read buffer is emptied, since it tends to fill from unread
replies. A specific timeout is also defined, which cancels the execution of the VI in case
the connection is lost.
The connection closing VI sets the device to initial state and sends a command to exit
remote mode when needed. Finally VISA Close subVI is used to terminate the
connection and check whether any errors occurred.
4.1.2 Monochromator
Short descriptions of VIs related to controlling the monochromator are presented in
table 4.2. Get position VI gives position of the monochromator and Move to position
moves the monochromator to a given position. Also a given distance or a given number
of stepper motor pulses can be moved with VIs Move distance and Move pulses,
respectively. The Stop VI forces the movement to stop, and is the only command that
can be given while other command is being executed. The monochromator controller
uses linear correction, the parameters of which can be read with Get gain and Get offset
and written with Set gain and Set offset. Calibrate controller is a standalone VI to read
and write both parameters simultaneously.
The VIs listed above only utilize the linear correction done by the monochromator
controller. Additional three VIs are available if more precise nonlinearity correction is
47
needed. Both require calibration data for the grating in question, which is read from user
specified text file. Each line of the file must contain data in the form
<expected wavelength>
<measured wavelength>
where both values are in nanometers and comma is used as a decimal mark.
Table 4.2 Descriptions of VIs related to controlling the monochromator.
VI name
Initialize
Send and read
Close
Get position
Move distance
Move pulses
Move to position
Stop
Get gain
Get offset
Set gain
Set offset
Calibrate controller
Description
Initialize connection
Send commands and read replies manually
Close connection
Read current position
Move a given distance
Move the stepper motor a given number of individual pulses
Move to a given position
Force all movement to stop
Read the linear correction gain of the controller
Read the linear correction offset of the controller
Write the linear correction gain of the controller
Write the linear correction offset of the controller
Read all linear correction data and if desired, write new values
Polynomial correction VI uses least squares method to fit polynomial correction
function of given degree to calibration data, or manually given coefficients can be used
with Manual correction. Spline correction VI on the other hand creates a spline
function from given calibration data and uses it to interpolate corrected wavelengths.
4.1.3 Filter wheel
VIs used for filter wheel control are listed in Table 4.3. The VIs used for wheel
movement are quite self-explanatory. Select filter position drives the wheel to a given
position using shortest rotating route. Select home moves the wheel always clockwise
and stops when it detects the first wheel position. This may take up to 20 seconds and is
48
necessary only if the device is moved both manually and in the remote mode. Other
option is to use the Get filter position function to ensure current wheel position.
Table 4.3 Description of VIs related to controlling the filter wheel.
VI name
Initialize
Send and read
Close
Select home
Get filter position
Select filter position
Identify wheel
Identify filter
Read wheel data
Write wheel data
Calibrate
Description
Initialize connection
Send commands and read replies manually
Close connection
Driver filter wheel to home position
Read current position of the filter wheel
Driver filter wheel to a given position
Identify current filter wheel
Identify a given filter
Read the whole data of the current filter wheel
Write the whole data of the current filter wheel
Calibrate filter wheel movement
Many wheels can be used with one controller and therefore all wheels are given a letter
identifier. Current wheel can be read with Identify wheel VI, which is useful if multiple
wheels are being used. Also each filter is given a name, which can be read with Identify
filter VI. All filter wheel data can be read at once with Read wheel data VI.
The wheel data is stored in the controller in a non-volatile EEPROM memory. The data
has to be stored one byte at a time and storing one character takes about 25 ms. For this
purpose a standalone Write wheel data VI was coded. It modifies the given text data to a
suitable format and takes care of the storing process. For practical reasons, the
wavelength ranges of the filters were saved as their names.
The filter wheel has an offset correction for both counterclockwise and clockwise
movement. Basically this is a small angle correction to make sure that the filter always
stays in the center of the device aperture. This is done using the Calibrate VI. To
simplify the usage, correction values to factory presets are given instead of absolute
values. The device used in the setup was verified working properly with correction
value +2 clockwise and zero correction counterclockwise.
49
4.1.4 Other devices
The optical chopper is rather easy to control. In an addition to common initialization,
manual command sending and closing VI, typical user only needs two additional VIs.
The current status of the chopper is read with a VI Get status, which returns the selected
frequency range, possible usage of external frequency source and current frequency.
The first two parameters are only selectable via device front panel, but frequency can be
set with the VI Set frequency. If the given frequency is not within the device’s limit, the
highest or lowest possible frequency is set.
The remote interface of the thermohygrometer is somewhat complicated, but using the
device with LabVIEW was made really simple. When the connection is initialized, the
device is automatically set to suitable measurement mode and kept there until
connection is closed. All data handling is done using the Get data VI. The device sends
all the data in one long string of which all the values are parsed. Most used are
temperature and relative humidity, but also available are absolute humidity, dew point
temperature, wet-bulb temperature, mixing ration and device battery voltage.
The high voltage supply uses NI certified drivers that are suitable for controlling all
Stanford PS300 series voltage supplies. All except one VI of the driver worked
seamlessly; the function for setting the voltage was evidently meant for different
version of the device. The problem was remedied by partially rewriting the VI. So,
instead of using the original VI Set voltage, one should use the modified version Set
voltage fix.
4.2
Programs for electrical measurements
Various programs were written for electrical testing methods. The programs were also
used to characterize the lock-in amplifier and these measurements are further discussed
in chapter 5. Linearity measurements use Agilent 33521A signal generator and an
attenuator to sweep voltage levels in decades to measure lock-in amplifiers linearity.
Frequency response is measured by changing the frequency with the signal generator
50
within a given frequency range. All values are then saved to a comma-separated values
(CSV) file, the name and folder of which are either given in advance or prompted at the
end of the measurement.
Lock-in linearity VI measures the output of the lock-in amplifier using manually
selected parameters, such as the time constant and settling time, at the given signal
generator voltages and frequencies. The possible usage of attenuator is also specified.
By default, the sensitivity range is optimized by the measurement VI, but it can also be
selected manually or by using the auto-gain function of the lock-in amplifier.
Frequency response VI can be used in a wide variety of measurements that require
frequency sweeping. A given number of points are measured within the user specified
frequency range, or a manual list of measurement frequencies can be given. A linear or
exponential sweeping can be selected, the latter being often more rational when large
frequency range is used. Measurements are done by using either the lock-in amplifier or
the multimeter. When high accuracy is required, also the frequency response of the
signal generator should be measured for comparison.
Most accurate AC measurements can be done with the multimeter using a so called
synchronous sub-sampled computed true RMS technique. It provides excellent linearity
and a frequency range of 1 Hz to MHz. However, the method required the input signal
to be repetitive, so measurements using changing frequency or noise are impossible. At
frequencies below 1 kHz the accuracy is typically around 0,01 percent. The VI
Multimeter sub-sampled was written to simplify the usage of the method. The VI takes a
given number of measurements at a given precision target precision. It should be noted
that the measurements at precision are very time-consuming. More details about the
measurement technique can be found in [59].
4.3
Programs for optical measurements
Typically a measurement setup requires rather customized measurements procedure.
Therefore, measurement programs were written only for the two most common
51
measurements, where either wavelength or chopping frequency is controlled. More
complicated measurements can easily be built with LabVIEW using the building blocks
mentioned above.
Spectral measurement VI controls the monochromator and the filter wheel to take
measurements with the lock-in amplifier at different wavelengths. The wavelength
range and step increment are specified by user as well as all measurement related
parameters. By default, a suitable filter is selected automatically, but manual selection is
also possible. This is useful for example when testing or calibrating devices. Frequency
measurement VI is very similar to electrical measurement Frequency response VI,
except it controls the optical chopper instead the signal generator. Combined
measurement VI combines these two measurements, so that both the wavelength and the
chopping frequency are varied.
52
5
Lock-in amplifier linearity
There are not that many linearity measurements of a lock-in amplifier reported. Even
though signals are processed digitally in modern lock-in amplifiers, they still require
analog amplification, filtering and signal generation. These analog components are the
main cause of nonlinearities in the amplifier. For many devices the linearity factor can
change more than 0,1 % over a factor of two change in the output. However, the
nonlinearity characteristics are found to be independent of the used reference frequency
and time constants. [60]
Comparison measurements done between different amplifiers suggest that the linearity
characteristics vary from one instrument to another [60]. When signals of very different
magnitude are measured, the sensitivity of the lock-in amplifier has to be changed
between measurements. This automatically changes the gain of the device’s
preamplifier. During the measurements it was found that this has a similar effect to the
linearity characteristics as for changing from lock-in amplifier to another.
Typical linearity measurements involve an optical setup where comparison is done
between different lock-in amplifiers. However, in this thesis a different approach was
developed. The measurements were done with purely electrically generated signals in
order to minimize all other nonlinearity sources from the measurement. Unfortunately,
very low signal levels are required, which makes this method somewhat complicated.
Compared to DC voltage, very low and precise AC voltage levels are hard to produce.
Typical signal generators usually operate in volt and millivolt scale, yet measurements
well below microvolt are often required in spectroscopy. In order to solve the problem,
a precision attenuator was built. Its specifications and performance are explained in the
first subchapter, the actual measurement setup is introduced in the second and the
results of the linearity measurements are shown in the third.
53
5.1
Precision attenuator
In order to produce very small AC signals a precision attenuator was designed and built.
This allows a signal generator to be used at constant signal level when the performance
of the lock-in amplifier is measured at different voltage levels and frequencies. The
attenuator was left as a part of the setup, since it provides a handy tool for calibrations.
5.1.1 Design
Because the attenuator is only used with low frequency signals, a straightforward
method of attenuation based on resistance dividers was considered as the most suitable.
The schematic of the device is presented in figure 5.1. The resistor network construction
guarantees that the minor contact resistance of the rotary switch has virtually no effect
to the attenuation. The circuit provides attenuations in decades from 1 to 10 -5, while the
input resistance of the device is deliberately constant 200 kΩ at all attenuations.
Figure 5.1 Schematic of the precision attenuator.
The right selection of resistors was the main issue in the design. In order to minimize
the stray capacitances and impedances, 3.2 × 1.6 mm surface mount resistors were used.
For values between 18 Ω to 180 kΩ high performance metal film resistors were used,
but for the smallest 2 Ω resistance only thick film resistors were available. The key
parameters of these components are shown in table 5.1.
54
Table 5.1 List of resistors used in the attenuator . [61], [62], [63]
No.
R1
R2
R3
R4
R5
R6
Tech.
Thin film
Thin film
Thin film
Thin film
Thin film
Thick film
Mfr.
Panasonic
Panasonic
Panasonic
Panasonic
Koa Speer
Vishay
Part number
ERA8AEB184V
ERA8AEB183V
ERA8AEB182V
ERA8AEB181V
RN73H2BTTD18R0B25
CRCW12062R00FNEA
Value
180 kΩ
18 kΩ
1,8 kΩ
180 Ω
18 Ω
2Ω
Toler.
±0,1 %
±0,1 %
±0,1 %
±0,1 %
±0,1 %
±1 %
Temp. coeff.
±25 ppm/°C
±25 ppm/°C
±25 ppm/°C
±25 ppm/°C
±25 ppm/°C
±100 ppm/°C
Figure 5.2 illustrates the model for attenuator connection. All signal sources have
nonzero output impedance Zout. In signal generators the practice is to use 50 Ω or 75 Ω
resistances in the output to match the impedance of coaxial cables. This causes a small
voltage drop when the generator is loaded with the 200 kΩ input impedance of the
attenuator that has to be taken into account. The first position in the attenuator’s rotary
switch only loads the signal source, but does not attenuate the output, so the actual
voltage over the attenuator Vin can be measured and used as a reference value.
Figure 5.2 Model for attenuator connection. The voltage over the
attenuator V i n can be measured using the first position of the atte nuator.
Also the input impedance of the measurement device connected to the attenuator causes
an error to actual attenuated voltage Vatt. According to Thévenin's theorem, a resistive
attenuator is equivalent to a single voltage source and a single series resistor. Figure 5.2
illustrates the principle. Parameter Λ is the nominal attenuation
55
(5.1)
and the resistance Ra||b is the parallel connection of Ra and Rb
||
.
(5.2)
The actual attenuated voltage Vatt can now be determined
||
.
(5.3)
The assembled attenuator is presented in Figure 5.3. The attenuator’s enclosure is
galvanically isolated from the signal ground. This allows separate grounding to be used
for noise cancellation. That is done most conveniently by using a floating signal
generator with a separate guard wire for case grounding.
Figure 5.3 Precision attenuator assembled. The chassis ground marked
GND and the signal ground are galvanically isolated.
56
5.1.2 Performance
The value Rb was measured using four-point measurement method for each attenuation
setting. Keithley 263 calibrator was used as a current source and voltage was measured
with Hewlett-Packard 3458A multimeter. The input resistance of the device was
measured in the same way, which actually corresponds to value Ra+Rb. It was measured
to be 199995,8 ± 1,1 Ω. From these values also the nominal attenuations Λ and parallel
resistances Ra||b were calculated. The results are shown in table 5.2.
Table 5.2 Measured resistances and calculated parameters of the
attenuator. The uncertainty of the nominal attenuation is 400 ppm for the
10 - 5 setting and 150 ppm for the rest.
Setting
10-1
10-2
10-3
10-4
10-5
Resistance Rb [Ω]
20000,52 ± 0,1
2000,213 ± 0,007
200,0327 ± 0,0007
20,01394 ± 0,00007
2,000625 ± 0,000023
Nominal attenuation Λ
1,0000E-01
1,0001E-02
1,0002E-03
1,0007E-04
1,0003E-05
parallel resistance Ra||b [Ω]
18000,38 ± 0,2
1980,208 ± 0,016
199,8326 ± 0,0016
20,01194 ± 0,00016
2,000605 ± 0,000040
Since AC signals are attenuated, the frequency response of the attenuator is also crucial.
It was measured using Agilent 33521A as signal source. Measurements were done using
the synchronous sub-sampled computed true RMS technique of the Hewlett-Packard
3458A multimeter. Linearity was determined by a comparison between attenuated and
unattenuated signals in order to cancel out the nonlinearity of signal source. Frequencies
up to 10 kHz were measured and the nonlinearities were less than 1 %. In the range of
optical measurement frequencies, the attenuator performed better; the change in
attenuation was less than 200 ppm up to 200 Hz with all attenuations.
5.2
Measurement setup
The measurement setup is shown in figure 5.4. The signal generator can produce signals
in the RMS amplitude range of 1 mV to 1 V. The attenuator then allows the
57
measurements to be done in the range of 10 nV to 1 V. A separate BNC cable is used to
provide the digital frequency reference to the lock-in amplifier. For comparison, signals
in the range of 1 µV to 1 mV were measured with four different combinations of
generator output and attenuation. The differences in results with different combinations
were negligible.
Figure 5.4 Measurement setup for electrical linearity and frequency
response.
A noise generator was added to the measurement setup; both the noise and the signal
generator have an output impedance of 50 Ω, so they were merely connected in series.
The noise generator allows measurements below the single bit level of the lock-in
amplifiers analog to digital converter (ADC). The noise causes a bit to change in the
device and it can then be filtered as explained in section 2.6.1.
5.3
Linearity measurements
Linearity measurements were done within sensitivity ranges from 100 µV to 1 V. The
sensitivity at the full range input voltage of a particular sensitivity ranges was used as a
comparison value for relative sensitivity. For all ranges the nonlinearity was less than
1 % when the input voltage was more than 1 % of the full range voltage, and less than 2
% when the input voltage was more than 0,1 % of the full range voltage. Measuring
signals below 1 % of the signal level is highly discouraged for the sheer problem of
limited bits in the output value. As an example, the relative sensitivity of the lock-in
58
amplifier at 1 V range is shown in figure 5.5. For this range the measurements were also
repeated by using the signal generator without the attenuator. The results for both
measurements converge.
Figure 5.5 Relative sensitivity of the lock-in amplifier at 1 V range.
Also a comparison measurement between sensitivity ranges from 100 nV to 1 V was
done. The sensitivity for every range was measured using 50 % of the full range voltage
as the input voltage. These values were then scaled with the nominal sensitivity and
compared to the 1 V sensitivity range. The determined values can be used as correction
coefficients when different sensitivities are used in comparison measurements. The
results are shown in figure 5.6.
An error of almost 15 % was measured in the 100 nV sensitivity range. This suspicious
result was confirmed with two different signal generator signal levels using two
different attenuations. The possibility of noise causing the measurement error was
canceled out by repeating the two measurements with very long time constant of 30 s.
Based on this result, one can conclude, that measurements using this sensitivity range
59
must be avoided. Fortunately omitting one sensitivity range is not a problem, because
the measurements can be done with 1 µV sensitivity range as well.
Figure 5.6 Comparison of sensitivity ranges. The sensitivities are scaled
with nominal sensitivity of the range and compared to the value of the 1 V
sensitivity range.
The test setup used for electrical linearity measurements was left to the spectrometer
measurement setup. The linearity related uncertainty in comparison measurements is
thus reduced from previous 0,35 % to 0,2 %, as correction coefficients for signals of
different magnitude can easily be determined.
60
6 Preamplifier for photoconductive detectors
A preamplifier for photoconductive detectors was designed and built to replace a broken
preamplifier. The old device was made according to the manufacturer’s general
recommendations for photodiode preamplifier. The design was mainly used with
Hamamatsu Photonics P2038-03 lead selenide detector, albeit the gain, bias voltage and
load resistance were optimized for MCT detectors and does not suit well for the specific
detector [51]. Detailed schematics of the previous amplifier and along with explanatory
text can be found in [3].
The design of the new amplifier is introduced in the first subchapter and the second
focuses on the characterization of the device. Optical measurements done with the new
amplifier are discussed in the third. Specifications of the amplifier are shown in table
6.1. The bandwidth of the amplifier is discussed more thoroughly in section 6.3.2.
Table 6.1 Specifications of the amplifier.
Gain
Internal load resistance
Input resistance
Bandwidth
Internal biasing voltage
Internal biasing current
External biasing voltage
6.1
0, 20, 40 or 60 dB
1 kΩ - 32 MΩ, two values per decade
100 MΩ
10 Hz - 200 Hz within 0,1 dB
1 Hz - 1,5 kHz within 3 dB
0 - 64 V
Max. 120 mA
Max. 400 V
Design
The new amplifier was designed so that it could be used with a wide variety of
detectors. The old design served as a starting point for the new device and the basic
amplifier topology is similar to the one demonstrated in [44]. The main feature of the
new amplifier is the possibility to select gain, biasing voltage and load resistance, which
61
makes it a truly universal design. Complete schematics of the device and the list of
components are in the appendices B and C, respectively.
The block diagram of the device is shown in figure 6.1. In addition to the actual
preamplifier circuit, a biasing circuit is used to provide very stable biasing voltage
through appropriate load resistance. Both the amplifier and the biasing circuit are
controlled and monitored by the Arduino Uno microprocessor and front panel circuitry.
The microcontroller is also used to control the front panel LCD. The complete program
code along with comment text is listed in appendix D.
Figure 6.1 Block diagram of the preamplifier. Analog, digital and powe r
signals are shown green, black and red, respectively.
6.1.1 Power supplies
Common linear regulators are used to maintain stable operating voltages of ±15 V.
Input voltages for the regulators are provided from a single 15 VAC secondary coil
using two parallel half-wave rectifiers in opposite polarity and reservoir capacitors.
Third linear regulator is used to decrease the +15 V operating voltage to +9 V for the
microcontroller. The microcontroller’s own regulator is used to provide the +5 V logic
voltages. However, a separate +5 V precision voltage reference is used with the
microcontroller’s ADC.
Two 25 VAC and one 15 VAC secondary coils are used in series to obtain a 65 VAC
voltage. This is then rectified to a DC voltage of approximately +90 V. A high voltage
regulator is then used to regulate a stable +75 V voltage for the biasing circuit. A
62
polymeric positive temperature coefficient device (PPTC) is placed before the regulator
to limit the maximum current of the high voltage supply to around 120 mA. Toroidal
transformers are used in the power supply to minimize electromagnetic interference,
while a suppression filter is used to prevent radio frequency interference from the power
grid.
6.1.2 Biasing circuit
A multi-turn potentiometer is used to adjust the biasing voltage. A 0 to 5 V setpoint
voltage from the potentiometer is amplified with a high voltage operational amplifier to
correspond to 0 to 64 V in the biasing output. NPN and PNP power transistors are used
as a common-collector amplifier in front of the operational amplifier to boost the output
current. The setpoint voltage is also measured with the microcontroller’s ADC and the
biasing voltage is displayed in the front panel LCD.
The front panel switch allows the user to select internal or external biasing voltage, or to
use the amplifier without biasing at all. A rotary switch and a resistor network are used
to select the load resistance. There are two built-in resistor values per decade, ranging
from 1 kΩ to 32 MΩ. The last position of the rotary switch short-circuits internal load
resistance network, enabling an arbitrary value external component to be used.
6.1.3 Amplifier circuit
A very simplified model of the amplifier circuit is shown in figure 6.2. Among other
things, the model omits high pass filtering, overvoltage protection and gain selection
implemented in the actual device.
63
Figure 6.2 Simplified model of the amplifier circuit.
A large input resistance RIN is used to keep the DC-component of the amplifier circuit
zero. The low pass cut-off frequency fc is determined by the RIN and the filter
capacitor C:
.
(6.1)
The gain G is determined by the resistors R1 and R2:
.
(6.2)
In the preamplifier the resistors R1 and R2 are replaced with a high precision integrated
thin film network. A multiplexer controlled by the microcontroller is then used to
change the feedback circuitry when gain is changed.
6.2
Characterization
Agilent 33521A signal generator was used with the attenuator introduced in chapter 5.1
as a signal source in the characterization measurements. Output voltages were measured
with a Hewlett-Packard 3458A multimeter using the synchronous sub-sampled
computed true RMS technique.
64
6.2.1 Gain
The gain of the amplifier was determined by comparing the input voltage from the
signal generator and the output voltage from the preamplifier. Table 6.2 shows the
measurement results. The difference between the nominal and measured gain is most
likely due to the accuracy of the resistor network, with is 0,1 % for each separate
resistor element. However, much more important factors are the high stability and low
temperature coefficient of the divider network. The ratio between the decade dividing
resistor, and thus the gain of the device, changes less than 50 ppm per year and the
difference in temperature coefficients between two resistors is less than 2,5 ppm/°C
[64].
Table 6.2 Measured gains of the preamplifier measured at 80 Hz.
Nominal gain
Input
voltage
[mV]
0 dB
20 dB
40 dB
60 dB
1001,471
100,1426
9,99342
0,99936
Output
Measured Relative expanded
voltage [V] gain
uncertainty of measured
gain [%] (k = 2)
0,015
1,000937 0,99947
0,03
0,998642 9,9722
99,951
0,09
0,99885
0,1
0,99754
998,17
6.2.2 Linearity
Linearity of the amplifier was measured by keeping the amplitude of the signal
generator constant and measuring the output voltage at different attenuations. The
results are shown in figure 6.3. At all nominal gains, smaller input voltage resulted in
smaller measured gain.
65
Figure 6.3 Linearity of the preamplifier measured at 80 Hz. Values are
normalized with the value at 1V, 100 mV, 10 mV and 1 mV at gains 0, 20,
40 and 60 dB, respectively .
6.2.3 Frequency response
Low frequency response in the range of 10 to 200 Hz is shown in figure 6.4. This is the
most interesting range, since it is important in optical measurements. In this range the
three smallest gains have an very flat response and even the highest gain is flat within
0,1 dB.
Also the high frequency response was measured up to 10 kHz and is shown in
figure 6.5. Due to the constant feedback capacitance of the amplifier circuit and the
changing feedback resistance, the cutoff frequency lowers when gain is increased. But
even with the highest gain the 6 dB cutoff frequency is around 6 kHz.
66
Figure 6.4 Frequency response of the preamplifier in the range of
10 to 200 Hz. Values are normalized with gain at 75 Hz frequency.
Figure 6.5 Frequency response of the preamplifier in the range of
100 Hz to 10 kHz. Values are normalized with gain at 100 Hz frequency.
67
6.3
Optical measurements
For comparison, optical measurements were done with Hamamatsu Photonics P2038-03
lead selenide detector with which the previous preamplifier was also used. With
nominal biasing voltage of 50 V and with well-matched load resistance the responsivity
of the detector increased approximately by a factor of 5 as compared to the values
measured with the old preamplifier. The new amplifier also provides over 40 dB larger
gain if needed, which improves the measurement of small signals.
According to the manufacturer’s specifications, the responsivity of the P2038 -series
detector is linear up to an incident energy level of around 1 mW/cm2, after which it
starts to decrease approximately by a factor of five per decade [51]. This behavior was
confirmed, when the responsivity of the detector was measured with laser at power
levels of 10 µW to 1 mW. Absolute values were obtained by comparison measurement
with the pyroelectric reference detector. The results are shown in figure 6.5.
Figure 6.5 Responsivity of the PbSe photoconductive detector measured
with 1,523 µm lase r at 15 Hz chopping frequency. The detector was kept at
a temperature just above 0 °C and a bias voltage of 30 V and a load
resistance of 320 kΩ were used.
68
7
Conclusions
The fundamentals of optical radiometry and the theory of infrared sourcing, filtering
and detection were considered. The current state of infrared radiation sources and
detectors was reviewed. Furthermore, two amplification methods, phase sensitive
detection and amplification of photoconductive detectors using load resistance for
voltage extraction, were studied.
A facility for infrared measurements was extensively improved. The whole setup was
refurbished and measurement and control devices were mounted to a rack to enhance
and simplify the usability of the setup. The stability of the infrared sourcing and the
quality of the measured signal from the reference detector were greatly enhanced. Also
the previously uncharted low frequency response of the reference detector was
determined. In addition, the improved facility enables a larger repertoire of infrared
sources to be used.
The upgraded infrared spectrometer measurement setup is capable of measuring spectral
responsivity of detectors, spectral transmittance of optical materials and spectral power
distribution of light sources. Infrared detectors can be calibrated using the available
solid-state detectors as working standards in the wavelength range of 1 to 5,1 µm and
the pyroelectric reference detector in wavelength range of 750 nm to 16 µm. The
expanded uncertainty of spectral responsivity calibrations is less than 3,7 %.
The automation software of the spectrometer measurement setup was fully updated.
Virtually all measurement and control devices are now computer-controlled. Many
aspects relating to computing and signal processing, for example the compensation for
the nonlinearity in the monochromator’s wavelength scale, was optimized. The most
essential measurement and calibration programs were written. In addition, the versatile
facility provides a user-friendly selection of tools for a wide variety of other
measurement procedures.
The linearity of phase sensitive detection devices is not well known. The problem was
studied in order to gain better understanding of nonlinearities in lock-in amplifier
69
measurements. As a result, a fully electrical method for linearity measurements of lockin amplifiers was developed and tested. This method improves the accuracy in lock-in
comparison methods and for example the nonlinearity component in the uncertainty of
responsivity measurements is reduced to 0,2 %. The method can also be utilized for
characterization of other amplifiers.
The amplification of a photoconductive detector’s signal requires various parameters of
the amplifier to be matched to the detector in question. Commonly a preamplifier is
dedicated to some type of detectors. As a part of the thesis, a universal preamplifier for
photoconductive detectors was designed, built, characterized and tested. It allows a
single device to be used with a large variety of detectors. The preamplifier was also
used in measurements to confirm the decrease in the response of lead selenide detectors
at high power levels.
70
References
[1]
Mohr P. J., Taylor B. N., Newell D. B., The 2010 CODATA Recommended
Values of the Fundamental Physical Constants, Web Version 6.0, National
Institute of Standards and Technology, 2011. [Referred: 19.11.2011]. Internet:
http://physics.nist.gov/constants.
[2]
Dereniak, E. L., Boreman, G. D., Infrared Detectors and Systems, New York,
Wiley, 1996. 592 pp. ISBN 978-0471122098.
[3]
Lano J., Facility for Spectral Responsivity Measurements of Infrared Detectors,
Master’s Thesis, HUT, Department of Electrical and Communications
Engineering, Espoo, 2006. 54 pp.
[4]
Valkonen M., Development of Dry Nitrogen Purged Spectrometer for Infrared
Region, Master’s Thesis, HUT, Department of Electrical and Communications
Engineering, Espoo, 2007. 64 pp.
[5]
Ahonen P., Extension of Spectral Responsivity Scale for Infrared Detectors,
Master’s Thesis, HUT, Department of Electrical and Communications
Engineering, Espoo, 2009. 92 pp.
[6]
Phillips A. C., Introduction to Quantum Mechanics. Chichester, John Wiley &
Sons Ltd, 2003. 282 pp. ISBN 0-470-85323-9.
[7]
Settle F. A., Handbook of Instrumental Techniques for Analytical Chemistry,
Englewood Cliffs, New Jersey, Prentice-Hall, 1997. 995 pp. ISBN 9780131773387.
[8]
Parr A.C., Datla R.U., Gardner J.L., Experimental Methods in the Physical
Sciences: Vol 41. Optical Radiometry, Amsterdam, Elsevier / Academic Press,
2005. 565 pp. ISBN 978-0124759886.
71
[9]
Nash, M., An investigation into the photocatalytic properties of microporous
titanosilicate materials, Doctoral Thesis, University of Delaware, Department of
Chemical Engineering, Neward, 2008. 231 pp.
[10]
Malacara D., Thompson B. J., Handbook of Optical Engineering, New York,
Marcel Dekker Inc., 2001. 978 pp. ISBN 978-0-8247-9960-1.
[11]
Pedrotti F. L., Pedrotti L. S., Pedrotti L. M., Introduction to Optics,3rd edition,
New Jersey, Pearson Prentice Hall, 2007. 622 pp. ISBN 978-0131499331.
[12]
Kingston R. H., Optical Sources, Detectors, and Systems, San Diego, Academic
Press, 1995. 198 pp. ISBN 978-0124086555.
[13]
Wolfe W. L, Zissis G. J., The Infrared Handbook, 4th printing of revised edition,
Michigan, Environmental Research Institute of Michigan, 1993. 1700 pp. ISBN
0-9603590-1-X
[14]
Shumaker D. L., Accetta J. S., The Infrared and Electro Optical Systems
Handbook, Bellingham, SPIE Optical Engineering Press, 1993. 3524 pp. ISBN
978-0819410726
[15]
Jones R. W., Infrared Technology. Kirk-Othmer Encyclopedia of Chemical
Technology, 2000. [Referred: 2.11.2011]. Internet:
http://onlinelibrary.wiley.com/doi/10.1002/0471238961.0914061810151405.a01
/full
[16]
Ballico M., A simple technique for measuring the infrared emissivity of blackbody radiators, Metrologia, 2000. Vol. 37. Pp. 295-300. ISSN 1681-7575.
[17]
Hecht E., Optics, 4th edition, San Fransisco, Addison Wesley, 2002, 698 pp.
ISBN 0-321-18878-0.
[18]
Product datasheet: Incandescent reflector: infrared heat lamps/industrial,
Philips, 2002.
72
[19]
Product datasheet: Tungsten ribbon filament strip lamp, The Pyrometer
Instrument Company, Inc, 2008. [Referred 2.11.2011]. Internet:
http://www.pyrometer.com/PDF_files/Optical%20Strip%20Lamp%20012008.pdf.
[20]
Product datasheet: IR-12 Series Miniature 8 to 11 Watt Infrared Emitter, Boston
Electronics Corporation, 2004. [Referred 2.11.2011]. Internet:
http://www.boselec.com/documents/CWSourcesWWW5-3-05.pdf.
[21]
Product datasheet: Mini-IgniterTM model 301, Saint-Gobain Ceramics, 2007.
[22]
Sperfeld P., Metzdorf J., Yousef Galal S., Stock K. D., Möller W., Improvement
and extension of the black-body-based spectral irradiance scale, Metrologia,
1998. Vol. 35. Pp. 267-271. ISSN 1681-7575.
[23]
Yousef Galal S., Sperfeld P., Metzdorf J., Measurement and calculation of the
emissivity of a high-temperature black body, Metrologia, 2000. Vol 37. Pp. 365368. ISSN 1681-7575.
[24]
Yang R. Q., Lin C-H., Murry S J., Pei S. S., Interband cascade light emitting
diodes in the 5–8 µm spectrum region, Applied Physics Letters, 1997. Vol. 70,
Pp. 2013-1015. ISSN 0003-6951.
[25]
Zibik E. A., Ng W. H., Revin D. G., Wilson L. R., Cockburn J. W., Groom, K.
M., Hopkinson, M., Broadband 6 μm<λ<8 μm superluminescent quantum
cascade light-emitting diodes, Applied Physics Letters, 2006. Vol. 88. 121109.
ISSN 0003-6951.
[26]
Jayaraman V., Strand T. A., Leonard D. B., Patent: Multi-wavelength light
source for spectroscopy, US Patent No. 7880882 B2, 2011.
[27]
Ng, W., Zibik E. A., Soulby M. R., Wilson L. R., Cockburn J. W., Broadband
quantum cascade laser emitting from 7.7 to 8.4 µm operating up to 340K,
Journal of Applied Physics, 2007. Vol. 101. 046103. ISSN 1089-7550.
73
[28]
Kim J., Chen M., Yang C., Lee J., Yin S. S., Ruffin P., Edwards E., Brantley C.,
Luo C., Broadband IR supercontinuum generation using single crystal sapphire
fibers, Optics Express, 2008. Vol. 16. Pp. 4085-4093. ISSN 1094-4087.
[29]
Bridges J. M., Migdall A. L., Characterization of argon arc source in the
infrared, Metrologia, 1995/96. Vol. 32. Pp. 625-628. ISSN 0026-1394.
[30]
Schrama C. A., Bloembergen P., van der Ham E. W. M., Monochromator-based
cryogenic radiometry between 1 µm and 20 µm, Metrologia, 2000. Vol. 37. Pp.
567-570. ISSN 0026-1394
[31]
Product datasheet: IR Mirrors, Thorlabs, 2009. [Referred: 22.11.2011]. Internet:
http://www.thorlabs.de/Navigation.cfm?Guide_ID=2143.
[32]
Brown R. J. C., Brewer P. J., Milton M. J. T., The physical and chemical
properties of electroless nickel–phosphorus alloys and low reflectance nickel–
phosphorus black surfaces, Journal of Materials Chemistry, 2002. Vol. 12. Pp.
2749-2754. ISSN 1364-5501.
[33]
Mizuno K., Ishii J., Kishida H., Hayamizu Y., Yasuda S., Futaba D. N., Yumura
M., Hata K., A black body absorber from vertically aligned single-walled carbon
nanotubes, Proceedings of the National Academy of Sciences of the United
States of America, 2009. Vol. 106. 6044-7. ISSN 0027-8424.
[34]
Product datasheet: Optical Cast Infrared (IR) Longpass Filters, Edmund Optics
Ltd., 2011. [Referred 7.11.2011]. Internet:
http://www.edmundoptics.com/products/displayproduct.cfm?productid=1918 .
[35]
Product datasheet: IR Long Pass Filters, Wavelength technology Ltd., 2011.
[Referred 7.11.2011]. Internet: http://www.wavelength-tech.com/IROptics/IRLongPassFilter.jsp.
[36]
Donati S., Photodetectors: Devices, Circuits and Applications, New Jersey,
Prentice Hall, 1999, 432 pp. ISBN 978-0130203373.
74
[37]
Rogalski A., Infrared detectors: an overview, Infrared Physics & Technology,
2002. Vol 43. Pp. 187-210. ISSN 1350-4495.
[38]
Rogalski A., Infrared detectors: status and trends, Progress in Quantum
Electronics, 2003. Vol. 27. Pp. 59-210. ISSN 0079-6727.
[39]
Gu riau V., de l’Isle . ., erurier A., Huet ., Manissadjian A., acoetti H.,
Marcadet
., Carras M., Trinit V., Nedelcu A., Quantum well infrared
photodetectors: present and future, Optical Engineering, 2011. Vol. 50. 061013.
ISSN 0091-3286.
[40]
Liu H. C., Quantum dot infrared photodetector, Opto-Electronics Review, 2003.
Vol 11. Pp. 1-5. ISSN 1896-3757.
[41]
Stanford Research Systems Inc., Application Note #3: About Lock-In Amplifiers,
Stanford Research Systems Inc., 2004. [Referred: 11.11.2011]. Internet:
http://www.thinksrs.com/downloads/PDFs/ApplicationNotes/AboutLIAs.pdf
[42]
User Manual: Model SR830 DSP Lock-In Amplifier, revision 6/2005, Stanford
Research Systems Inc., 2005.
[43]
McNaught A. D., Wilkinson A., IUPAC Compendium of Chemical Terminology,
Second Edition, Hoboken, New Jersey, Blackwell-Wiley, 1997. 464 pp. ISBN
978-0865426849.
[44]
Hamamatsu Photonics K.K., Technical Information SD-12: Characteristics and
use of infrared detectors, 2011. [Referred: 18.10.2011]. Internet:
http://sales.hamamatsu.com/assets/applications/SSD/infrared_kird9001e04.pdf.
[45]
User manual: DC Power Supply HY3000 – HY5000 double series, Precision
Mastech Enterprises Co., 2006. [Referred: 16.11.2011]. Internet:
http://hades.mech.northwestern.edu/images/f/f7/Mastech_power_supply_manual
.pdf.
[46]
User manual: DC Power Supply AL 924A, revision 12/09, elc, 2009.
75
[47]
User manual: МДР-23 Technical Description and Operating Instructions Ю34.14.515 ТО, 1988.
[48]
Henricson J., Monochromator controller, Special assignment, Metrology
laboratory, HUT, 2003. 22 pp.
[49]
Manoochehri F., Kärhä P., Palva L., Toivanen P., Haapalinna A., Ikonen E.,
Characterisation of optical detectors using high-accuracy instruments,
Analytica Chimica Acta, 1999. Vol. 380. Pp. 327-337. ISSN 0003-2670.
[50]
Product datasheet: SPH-40 Series: Hybrid Pyroelectric Detector, Spectrum
Detector Inc., 2010. [Referred: 17.11.2011]. Internet:
http://www.crazyfingers.com/spectrum/pdf/datasheets/SPH-40.pdf.
[51]
Product datasheet: PbSe photoconductive detector P791/P2038/P2680 series,
P3207-05, Hamamatsu Photonics K.K., 2008. [Referred 2.11.2011]. Internet:
http://sales.hamamatsu.com/assets/pdf/parts_P/p791-11_etc_kird1020e07.pdf.
[52]
Product datasheet: Lead Sulfide / Lead Seledine Detectors, J13 / J14 Series,
Judson Technologies LLC, 2002.
[53]
User manual: Series PS300 High Voltage Power Supplies, Stanford Research
System Inc., 2007. [Referred 23.11.2011]. Internet:
http://www.thinksrs.com/downloads/PDFs/Manuals/PS300m.pdf.
[54]
User manual: Signal Recovery Model 3830 multiplexer, Ametek Advanced
Measurement Technology Inc., 2004.
[55]
User manual: HMI41 Indicator and HPM41/45/46 Probes, Vaisala, 1998.
[56]
Talvitie H., Narrowing the spectral linewidth of a semiconductor laser, Master’s
Thesis, HUT, Department of Electrical and Communications Engineering,
Espoo, 1993. 48 pp.
[57]
User manual: IT116 flash / IT116 mini, isel, 2009.
76
[58]
User manual: LabVIEW 2011, National Instruments, 2011. [Referred:
16.1.2012]. Internet: http://www.ni.com/pdf/manuals/371361h.zip.
[59]
User manual: HP 3458A Multimeter edition 3, Hewlett Packard, 1994.
[60]
Theocharous E., Absolute linearity characterization of lock-in amplifiers,
Applied Optics, 2008. Vol. 47. Pp. 1090-1096. ISSN 0003-6935.
[61]
Product datasheet: Metal Film (Thin Film) Chip Resistors, Type: ERA 2A, 3A,
6A, 8A, Panasonic, 2011. [Referred 25.11.2011]. Internet:
http://industrial.panasonic.com/www-data/pdf/AOA0000/AOA0000CE26.pdf.
[62]
Product datasheet: Surface Mount Resistors RN73H, KOA Speer Electronics,
2011. [Referred: 25.11.2011]. Internet:
http://www.koaspeer.com/products/resistors/surface-mount-resistors/rn73h/.
[63]
Product datasheet: Standard Thick Film Chip Resistors D/CRCW e3, Vishay,
2011. [Referred: 25.11.2011]. Internet:
http://www.vishay.com/docs/20035/dcrcwe3.pdf.
[64]
Product datasheet: CNS 471 Decade Divider Thin Film Resistor Networks,
Vishay, 2006. [Referred: 12.1.2012]. Internet:
http://www.vishay.com/docs/60043/cns471st.pdf.
[65]
Taylor B. N., Thompson A., NIST Special publication 330, 2008 edition: The
International System of Units (SI), National Institute of Standards and
Technology, 2008. [Referred: 31.10.2011]. Internet:
http://physics.nist.gov/Pubs/SP330/sp330.pdf.
77
Appendices
Appendix A. Radiometric Quantities in SI units
Appendix B. Photoconductive detector preamplifier, schematics
Appendix C. Photoconductive detector preamplifier, list of components
Appendix D. Photoconductive detector preamplifier, program code
78
Appendix A. Radiometric Quantities in SI units
Table A1 presents radiometric quantities in SI units. It should be noted that a wide
range of different symbols are commonly used in the literature. Spectral quantities can
also be given per unit frequency, in which case they are commonly denoted with
suffix υ.
Table A1. SI units in radiometry. [43], [65]
Quantity
Symbol Unit
Radiant
energy
Qe
J = kg·m−2·s−2
Radiant
flux
Spectral
power
Radiant
intensity
Spectral
radiant
intensity
Φe
W = kg·m−2·s−3
Φeλ
W·m−1 = kg·m−3·s−3
Radiant power per wavelength
Ie
W·sr−1 = kg·m−2·s−3
·sr−1
Radiant power per unit solid angle
Ieλ
W·m−1 ·sr−1
= kg·m−3·s−3 ·sr−1
Radiant intensity per wavelength
Radiance
Le
Spectral
radiance
Leλ
Irradiance
Spectral
irradiance
Radiant
exitance
or radiant
emittance
Definition
The total energy emitted,
transferred or received as
radiation in a defined period of
time
Power emitted, transferred or
received as radiation
W·m−2 ·sr−1
= kg·m−4·s−3 ·sr−1
W·m−3 ·sr−1
= kg·m−5·s−3 ·sr−1
Radiant power per unit solid angle
per unit projected source area.
Ee
W·m−2 = kg·m−4·s−3
Radiant power incident on a
surface
Eeλ
W·m−3 = kg·m−5·s−3
Irradiance per wavelength
Me
W·m−2 = kg·m−4·s−3
Power emitted per unit source
Radiance per wavelength
79
Appendix
B.
Photoconductive
detector
schematics
Figure B1. Schematic of the preamplifier circuit.
80
preamplifier,
Figure B2. Schematic of the power supply and mains voltage wiring .
81
Figure B3. Schematic of the biasing circuit.
82
Figure B4. Schematic of the front panel circuitry and microcontroller wiring
83
Appendix C. Photoconductive
detector
amplifier, list of
components
B1
C1
C2
C3
C4
C5
C6
C7
C8
C9
C10
C11
C12
C13
C14
C15
C16
C17
C18
C19
C20
C21
C22
C23
C24
C25
C26
C25
C26
C27
C28
C29
C30
C31
C32
C33
C34
C35
C36
C37
C38
C39
C40
C41
D1
D2
D3
D4
D5
D6
D7
Diode bridge
Capacitor, Polyester film
Capacitor, Polyester film
Capacitor, Polyester film
Capacitor, Aluminum electrolytic
Capacitor, Aluminum electrolytic
Capacitor, Polyester film
Capacitor, Polyester film
Capacitor, Polyester film
Capacitor, Polyester film
Capacitor, Aluminum electrolytic
Capacitor, Aluminum electrolytic
Capacitor, Aluminum electrolytic
Capacitor, Aluminum electrolytic
Capacitor, Polyester film
Capacitor, Polyester film
Capacitor, Aluminum electrolytic
Capacitor, Polyester film
Capacitor, Polyester film
Capacitor, Aluminum electrolytic
Capacitor, Aluminum electrolytic
Capacitor, Aluminum electrolytic
Capacitor, Tantalum electrolytic
Capacitor, Multilayer ceramic
Capacitor, Multilayer ceramic
Capacitor, Polyester film
Capacitor, Polyester film
Capacitor, Polyester film
Capacitor, Polyester film
Capacitor, Ceramic Disc
Capacitor, Polyester film
Capacitor, Polyester film
Capacitor, Aluminum electrolytic
Capacitor, Aluminum electrolytic
Capacitor, Aluminum electrolytic
Capacitor, Aluminum electrolytic
Capacitor, Aluminum electrolytic
Capacitor, Aluminum electrolytic
Capacitor, Tantalum electrolytic
Capacitor, Tantalum electrolytic
Capacitor, Polypropylene film
Capacitor, Multilayer ceramic
Capacitor, Multilayer ceramic
Capacitor, Ceramic Disc
Diode, Standard rectifier
Diode, Standard rectifier
Diode, Standard rectifier
Diode, Standard rectifier
Diode, Standard rectifier
Diode, Standard rectifier
Diode, Fast recovery rectifier
GBU4K
MMK5 103K400J01L4
MMK5 103K400J01L4
MMK5 103K400J01L4
ECOS1VP472BA
ECOS1VP472BA
MKS0C026800C00KSSD
MKS0C026800C00KSSD
MKS0C026800C00KSSD
MKS0C026800C00KSSD
RE3-25V471M
RE3-25V471M
EETED2D102CA
EETED2D102CA
MMK10 473K400A01L4
MMK15 105K100B04L4
MCGPR100V107M13X21
MKS2D031001A00KSSD
MKS2D031001A00KSSD
RE3-25V471M
RE3-25V471M
RE3-25V471M
CB1E106M2CCB
B37984M5105K
K104K15X7RF5TH5V
MMK15 105K100B04L4
MKS0C026800C00KSSD
MMK15 105K100B04L4
MKS0C026800C00KSSD
MCCHU7101J5
MMK15 105K100B04L4
MKS0C026800C00KSSD
MCGPR100V226M8X11
MCGPR100V107M13X21
RE3-25V471M
RE3-25V471M
RE3-25V471M
RE3-25V471M
CB1E106M2CCB
CB1E106M2CCB
FKP1R021005D00KSSD
B37984M5105K
B37984M5105K
MCCHU7101J5
1N4007
1N4007
1N4007
1N4007
1N4007
1N4007
MR858
84
4A
10 nF
10 nF
10 nF
4700 µF
4700 µF
680 nF
680 nF
680 nF
680 nF
470 µF
470 µF
1000 µF
1000 µF
47 nF
1 µF
100 µF
100 nF
100 nF
470 µF
470 µF
470 µF
10 µF
1 µF
100 nF
1 µF
680 nF
1 µF
680 nF
100 pF
1 µF
680 nF
22 µF
100 µF
470 µF
470 µF
470 µF
470 µF
10 µF
10 µF
10 nF
1 µF
1 µF
100 pF
1A
1A
1A
1A
1A
1A
3A
800 V
400 V
400 V
400 V
35 V
35 V
63 V
63 V
63 V
63 V
25 V
25 V
200 V
200 V
400 V
100 V
100 V
100 V
100 V
25 V
25 V
25 V
25 V
50 V
50 V
100 V
63 V
100 V
63 V
50 V
100 V
63 V
100 V
100 V
25 V
25 V
25 V
25 V
25 V
25 V
1250 V
50 V
50 V
50 V
1000 V
1000 V
1000 V
1000 V
1000 V
1000 V
800 V
±10%
±10%
±10%
±20%
±20%
±10%
±10%
±10%
±10%
±20%
±20%
±20%
±20%
±10%
±10%
±20%
±10%
±10%
±20%
±20%
±20%
±20%
±10%
±10%
±10%
±10%
±10%
±10%
±5%
±10%
±10%
±20%
±20%
±20%
±20%
±20%
±20%
±20%
±20%
±10%
±10%
±10%
±5%
85 °C
85 °C
85 °C
85 °C
105 °C
105 °C
85 °C
85 °C
85 °C
85 °C
85 °C
85 °C
85 °C
85 °C
85 °C
85 °C
D8
D9
DIS1
F1
FIL1
IC1
IC2
IC3
IC4
IC5
IC6
IC7
IC8
LED1
PTC1
POT1
POT2
Q1
Q2
R1
R2
R3
R4
R5
R6
R7
R8
R9
R10
R11
R12
R13
R14
R15
R16
R17
R18
R19
R20
R21
R22
R23
R24
R25
R26
R27
R28
R29
R30
R31
R32
R33
R34
R35
R36
R37
R38
RN1
S1
Diode, Zener
Diode, Zener
LCD module
Fuse, Slow blow
Filter, Power line suppression
Linear regulator
Linear regulator
Linear regulator
Linear regulator
Voltage reference
Operational amplifier, High voltage
Operational amplifier, Low noise
Analog multiplexer
Light-emitting diode
Resettable fuse
Potentiometer, Precision
Potentiometer
Transistor, Bipolar NPN
Transistor, Bipolar PNP
Resistor, Metal film
Resistor, Metal film, flameproof
Resistor, Metal film, flameproof
Resistor, Metal film
Resistor, Metal film
Resistor, Metal film
Resistor, Metal film
Resistor, Carbon composition
Resistor, Carbon composition
Resistor, Carbon composition
Resistor, Carbon composition
Resistor, Carbon composition
Resistor, Carbon composition
Resistor, Metal film
Resistor, Metal film
Resistor, Metal film
Resistor, Metal film
Resistor, Metal film
Resistor, Metal film
Resistor, Metal film
Resistor, Metal film
Resistor, Thick film
Resistor, Metal film
Resistor, Thick film
Resistor, Metal film
Resistor, Metal film
Resistor, Metal film
Resistor, Metal film
Resistor, Metal film
Resistor, Metal film
Resistor, Metal film
Resistor, Metal film
Resistor, Metal film
Resistor, Metal film
Resistor, Metal film
Resistor, Metal film
Resistor, Metal film
Resistor, Metal film
Resistor network, 6 decade divider
Switch, Toggle ON-ON
1N5245B
1N5245B
MC1602F-SYR
RIX-0342-H
MC7815CT
MC7915CT
TL783CKCSE3
MC7815CT
REF02APG4
OPA445AP
OPA27GP
DG409DJZ
LVR012K
3590S-2-103L
3310C-1-203L
TIP31C
TIP31C
SPRX1/2C
SPRX1/2C
HTS00635006JPB17
HTS00631006JPB17
CNS471A6
RT 556
85
15 V
15 V
16 x 2 CH
500 mA
3A
+15 V
-15 V
1.25-125 V
+9 V
+5 V
±45V
8 MHz
4 x 2 CH
5 mm
120 mA
10 K
20 K
3A
3A
1 kΩ
330 mΩ
330 mΩ
100 kΩ
100 kΩ
330 kΩ
82 Ω
30 kΩ
30 kΩ
30 kΩ
30 kΩ
30 kΩ
30 kΩ
220 kΩ
10 MΩ
10 kΩ
27 kΩ
330 kΩ
100 Ω
220 mΩ
220 mΩ
500 MΩ
100 Ω
100 MΩ
220 kΩ
220 kΩ
220 Ω
1 kΩ
2,2 kΩ
6,8 kΩ
22 kΩ
68 kΩ
220 kΩ
680 kΩ
2,2 MΩ
6,8 MΩ
20 MΩ
2,2 MΩ
0,1%
2A
500 mW
500 mW
5 x 20 mm
50 Hz
1A
1A
700 mA
1A
0.2%
70 kHz
40 Ω
Blue
240V
10 turn
TO-220
TO-220
TO-220
TO-220
DIP8
DIP8
DIP8
DIP16
40 W
TO-220
40 W
TO-220
600 mW ±2%
500 mW ±5%
500 mW ±5%
600 mW ±2%
600 mW ±2%
600 mW ±2%
600 mW ±2%
1W
±5%
1W
±5%
1W
±5%
1W
±5%
1W
±5%
1W
±5%
600 mW ±2%
600 mW ±2%
600 mW ±2%
600 mW ±1%
600 mW ±1%
600 mW ±2%
600 mW ±5%
600 mW ±5%
500 mW ±5%
600 mW ±2%
500 mW ±5%
600 mW ±2%
600 mW ±2%
600 mW ±2%
600 mW ±1%
600 mW ±1%
600 mW ±1%
600 mW ±1%
600 mW ±1%
600 mW ±1%
600 mW ±1%
600 mW ±1%
600 mW ±1%
600 mW ±1%
600 mW ±1%
±25ppm/°C SIL8
250 VAC
S2
S3
S4
S5
TAB1
TAB2
TAB3
TAB4
TAB5
TR1
TR2
X1
X2
X3
X4
X5
X6
X7
X8
X9
X10
X11
X12
X13
X14
µC
Switch, Toggle ON-OFF-ON
Switch, Rotary 1 x 12
Switch, Pushbutton SPST-NO
Switch, Pushbutton SPST-NO
Tab, Straight
Tab, Straight
Tab, Straight
Tab, Straight
Tab, Straight
Transformer, Toroidal
Transformer, Toroidal
Connector, Terminal block
Connector, Terminal block
Connector, Terminal block
Connector, Terminal block
Connector, Terminal block
Connector, Terminal block
Connector, Terminal block
Connector, BNC socket, PCB
Connector, BNC socket, PCB
Connector, Terminal block
Connector, Terminal block
Connector, Terminal block
Connector, BNC socket, bulkhead
Connector, Terminal block
Microcontroller
MS-500H
CK1059
R13-24AL-05-BB
R13-24AL-05-BR
726386-2
726386-2
726386-2
726386-2
726386-2
MCFE015/15
MCFE015/25
MSB03005
MSB02005
MSB02005
MSB03005
MSB02005
MSB03004
MSB03005
1-1337543-0
1-1337543-0
MSB02004
MSB03005
MSB02004
1-1337452-0
MSB02004
Arduino Uno
86
6A
125 VAC
250 mA
300 VAC
3A
125 VAC
3A
125 VAC
6,3 x 0,8 mm
6,3 x 0,8 mm
6,3 x 0,8 mm
6,3 x 0,8 mm
6,3 x 0,8 mm
2 x 15 V
15 VA
2 x 25 V
15 VA
13 A
250 V
13 A
250 V
13 A
250 V
13 A
250 V
13 A
250 V
12 A
150 V
13 A
250 V
50 Ω
1500 V
50 Ω
1500 V
12 A
150 V
13 A
250 V
12 A
150 V
50 Ω
1500 V
12 A
150 V
4 GHz
4 GHz
4 GHz
Appendix D. Photoconductive detector amplifier, program code
#include <LiquidCrystal.h>
// Mapping pins
#define BIAS_VOLTAGE
#define TOGGLE
#define EXT_BIAS
#define INT_BIAS
#define POWER
#define GAIN0
#define GAIN1
// LCD related pins
#define ENABLE
#define RS
#define DB4
#define DB5
#define DB6
#define DB7
A0
A4
A2
12
11
8
9
3
2
6
4
7
5
// Voltage calculation coefficient
#define GAIN_COEFF
159.84375
// Object for LCD
LiquidCrystal lcd(RS, ENABLE, DB4, DB5, DB6, DB7);
// byte that carries gain information. Gain bits are the two least
signicant bits of the byte.
byte gain = 0;
// Boolean value for the toggle buttons last value
boolean last_toggle = false;
void setup()
{
// Setting inputs and outputs
pinMode(BIAS_VOLTAGE, INPUT);
pinMode(TOGGLE, INPUT);
pinMode(EXT_BIAS, INPUT);
pinMode(INT_BIAS, INPUT);
pinMode(POWER, OUTPUT);
pinMode(GAIN0, OUTPUT);
pinMode(GAIN1, OUTPUT);
// Lighting up the power LED
digitalWrite(POWER, HIGH);
// Setting pull-up resistors
digitalWrite(TOGGLE, HIGH);
digitalWrite(EXT_BIAS, HIGH);
digitalWrite(INT_BIAS, HIGH);
87
// Initializing LCD
lcd.begin(16,2);
// Setting ADC reference to external
analogReference(EXTERNAL);
// Printing start message to LCD
for(int i = 0; i <= 15; i++) {
lcd.setCursor(0,0);
lcd.print("Powering up...");
lcd.setCursor(i,1);
lcd.print("*");
delay(300);
}
lcd.clear();
}
void loop() {
/* Checking the bias switch position,
calculating bias voltage and
updating LCD values
*/
// If using external bias
if(digitalRead(EXT_BIAS) == LOW) {
lcd.setCursor(0,0);
lcd.print("Bias: External ");
}
// If no bias at all
else if(digitalRead(INT_BIAS) == HIGH) {
lcd.setCursor(0,0);
lcd.print("Bias: Off
");
}
// If using internal bias
else {
// Reading bias voltage value by taking 10 samples to average out
the noise
long bias_value = 0;
for(int i = 0; i <= 9; i++) {
bias_value += analogRead(BIAS_VOLTAGE);
}
// Averaging
float print_value = (float)bias_value/GAIN_COEFF;
// Rounding off the value
print_value *= 10.0;
print_value += 0.5;
bias_value = (int)print_value;
print_value = (float)bias_value/10.0;
88
// Printing text
lcd.setCursor(0,0);
lcd.print("Bias:
Volts");
// Moving cursor to right position depending on the number of
digits
if(bias_value < 100) {
lcd.setCursor(7,0);
}
else {
lcd.setCursor(6,0);
}
// Printing the calculated value
lcd.print(print_value);
// Masking off an extra zero
lcd.setCursor(10,0);
lcd.print(" ");
}
/* Checking if changing the gain is
needed and updating LCD values
*/
// If the toggle button is being pushed yet without
operation?
if(digitalRead(TOGGLE) == LOW && last_toggle == false) {
toggle
// Wait for a moment and check again to avoid double contacts.
delay(25);
if(digitalRead(TOGGLE) == LOW) {
last_toggle = true;
gain += 1;
}
}
// If not pressing, change last toggle to false
if(digitalRead(TOGGLE) == HIGH) {
// Wait for a moment and check again to double contacts.
delay(25);
if(digitalRead(TOGGLE) == HIGH) {
last_toggle = false;
}
}
// Changing gain if needed and updating the LCD
lcd.setCursor(0,1);
switch (gain % 4) {
case 0:
lcd.print("Gain: 1
");
if(digitalRead(GAIN0 == HIGH))
89
digitalWrite(GAIN0, LOW);
if(digitalRead(GAIN1 == HIGH))
digitalWrite(GAIN1, LOW);
break;
case 1:
lcd.print("Gain: 10
");
if(digitalRead(GAIN0 == LOW))
digitalWrite(GAIN0, HIGH);
if(digitalRead(GAIN1 == HIGH))
digitalWrite(GAIN1, LOW);
break;
case 2:
lcd.print("Gain: 100
");
if(digitalRead(GAIN0 == HIGH))
digitalWrite(GAIN0, LOW);
if(digitalRead(GAIN1 == LOW))
digitalWrite(GAIN1, HIGH);
break;
case 3:
lcd.print("Gain: 1000
");
if(digitalRead(GAIN0 == LOW))
digitalWrite(GAIN1, HIGH);
if(digitalRead(GAIN1 == LOW))
digitalWrite(GAIN1, HIGH);
break;
default:
lcd.print("Undefined gain! ");
}
delay(50);
}
90