1
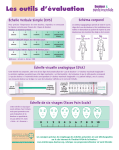
Visual Analogue Scale (VAS)
Plusieurs auteurs depuis 1974
Instrument
mesure
Abréviation
de
Visual Analogue Scale
VAS
Auteur
Huskisson, E. C. (1974). Measurement of pain. Lancet, 2, 11271131.
Thème
Management des symptômes de la douleur
Objectif
Evaluer la douleur chez le patient
Population
Non spécifiée
Relevé
Nombre d’items
Dispensateur de soins
1 item
Présence
du
Oui
patient requise
Localisation de
l’instrument
de http://www.ndhcri.org/
mesure
Objectif
Contrôle de la douleur chez le patient à l’aide d’un autorapport sur une échelle à un
item.
Groupe cible
Le groupe cible visé par la Visual Analogue Scale (VAS) est divers. La validité de
l’instrument de mesure a déjà été étudiée chez des enfants/ adolescents (Stinson,
Kavanagh, Yamada, Gill, & Stevens, 2006), chez des adultes (Bijur, Silver, &
Gallagher, 2001; Carey, Turpin, Smith, Whatley, & Haddox, 1997), ainsi que chez
des personnes âgées (Carey, Turpin, Smith, Whatley, & Haddox, 1997; Mawdsley,
Moran, & Conniff, 2002; Pautex et al., 2006). Des études valident l’utilisation de la
VAS pour diverses catégories de patients telles que les patients en service de
chirurgie (Gagliese, Weizblit, Ellis,& Chan, 2005; Jensen, Chen, & Brugger; 2002),
les déments (Pautex et al., 2005; Pautex et al., 2006), les patients souffrant de
problèmes musculo-squelettiques (Mawdsley et al., 2002; Pomeroy et al., 2000;
Tamiya et al., 2002; Triano, McGregor, Cramer, & Emde, 1993) et d’autres patients
présentant des formes spécifiques de douleur (Crossley, Bennell, Cowan, & Green,
2004; Freeman, Smyth, Dallam, & Jackson, 2001; Gallagher, Bijur, Latimer, & Silver;
2002; Gagliese & Katz, 2003).
Par conséquent, l’utilisation de la VAS comme instrument de mesure pour le
management de la douleur peut être généralisée pour une large population de
patients.
Description
La VAS est une ligne de 100 mm dont les deux extrêmes sont limités par les termes
« Aucune douleur » et « Pire douleur possible ». L’intention est que le patient indique
sur la ligne l’intensité de la douleur qu’il ressent au moment du relevé. L’écart entre
le point zéro (« Aucune douleur ») et le marquage du patient est ensuite mesuré en
mm par le dispensateur de soins.
La version la plus connue de la VAS a une ligne d’orientation horizontale, bien
qu’une orientation verticale soit aussi courante pour l’évaluation de la douleur du
patient. Il existe de nombreuses variantes à la version originale de la VAS. Des
différences se retrouvent notamment da ns la terminologie que l’on utilise pour
délimiter le point final (ex. douleur extrême, douleur la plus atroce, …), la présence
de pointillés de séparation sur l’échelle et l’unité de longueur utilisée (cm ou mm).
Fiabilité
La VAS présente une haute fiabilité. Cela peut être amplement étayé à l’aide de
résultats de différentes études qui ont déjà été réalisées.
De nombreuses études font état d’une intra-rater reliability de 0.90 et plus (Bijur et
al., 2001; Mawdsley, 2002; Pautex et al. 2005; Pautex et al., 2006). Quelques études
mentionnent même une valeur de 0.99 (Gallagher et al., 2002; McGrath et al., 1985
in Stinson et al., 2006). Le nombre d’études avec une faible intra-rater reliability (r <
0.75) est limité (Pomeroy et al., 2000; Tamiya et al., 2002). De plus, nous notons que
les mesures répétées sont caractérisées, dans ces études, par de grands intervalles
temporels (> 1 jour), ce qui explique peut-être la variabilité des scores de douleur à la
suite de changements dans le vécu de la douleur.
Des résultats positifs sont également générés pour l’interrater reliability. Dans les
études retrouvées, cette corrélation est toujours supérieure à 0.70 (Benaim et al,
2007; Herr, Spratt, Mobily, & Richardson, 2004; Pautex et al. 2005; Pautex et al.,
2006).
Le coefficient alpha de Cronbach entre la VAS et d’autres échelles de mesure à un
item a été vérifié dans l’étude de Herr et al. (2004) et dans l’étude de Carey et al.
(1997). La corrélation atteignait respectivement α = 0.97 (VAS – Numeric Rating
Scale – Verbal Descriptor Scale – Verbal Numeric Scale – Faces Pain Scale) et α =
0.88 (VAS – Faces Rating Scale – Numeric Rating Scale).
Validité
La VAS est un instrument de mesure valide pour l’appréciation de la douleur.
Plusieurs études ont comparé des scores VAS de patients avec des scores sur
d’autres échelles de douleur (Benaim et al, 2007; Freeman et al., 2001; Hicks, von
Baeyer, Spafford, Korlaar, & Goodenough, 2001; Gagliese et al., 2005; Kim &
Buschmann, 2006; Mawdsley et al., 2002; Pautex et al. 2005; Pautex et al., 2006;
Stinson et al., 2006; van Dijk, Koot, Saad, Tibboel, & Passchier, 2002). La corrélation
plutôt importante entre la VAS et d’autres échelles de valeur valides confirme la
concurrent validity de l’échelle.
Afin de vérifier la construct validity de la VAS, Gagliese et al. (2005) et Herr et al.
(2004) ont effectué une analyse des principaux composants. Dans les deux études, 1
facteur a été abstrait au départ des scores de douleur sur les différents instruments
de mesure à un item.
Des corrélations significatives ont également été rapportées entre des scores VAS et
l’administration d’analgésiques (Abu-Saad & Holzemer in Stinson et al., 2006;
Aradine et al. in Stinson et al., 2006; Gagliese & Katz, 2003; Tyler et al. in Stinson et
al., 2006), le taux de protéine C réactive (Tamiya et al., 2002), l’intensité de la
douleur causée (Herr et al., 2004), des observations comportementales chez des
patients souffrant de douleurs (Koho, Aho, Watson, & Hurri, 2001), …
La sensitivité de la VAS est confirmée par des études avec un repeated measures
design (Crossley et al., 2004; Jensen et al., 2002). Ces études ont corrélé les scores
VAS de patients à des enregistrements de douleur entre les différentes mesures. Les
évolutions de la douleur rapportées par les patients (« ma douleur a augmenté ou a
diminué) étaient nettement rattachées aux scores VAS.
Utilisation de la VAS chez les enfants
La VAS a déjà été amplement étudiée chez les enfants et fait état d’une bonne
validité pour la plupart des enfants à partir de l’âge de 8 ans (Champion et al. in
Stinson et al., 2006). La VAS est toutefois moins indiquée pour les enfants de moins
de 8. La fiabilité de l’instrument de mesure diminue dans cette catégorie d’âge
(Beyer and Aradine in Stinson et al., 2006; Shields et al. in Stinson et al., 2006). La
Faces Pain Scale peut représenter une possible alternative pour la population
composée des enfants âgés de moins de 8 ans.
Utilisation de la VAS chez les personnes âgées
Une étude démontre que les personnes âgées peuvent éprouver des difficultés à
compléter et à comprendre la VAS (Freeman et al., 2001; Herr, Mobily, Kohout &
Wagenaar, 1998; Jensen & Karoly in Dworkin et al., 2005; Pautex et al., 2005;
Pautex et al., 2006). C’est particulièrement le cas pour les personnes d’un âge
avancé et les déments pour lesquels, par exemple, la Faces Pain Scale ou la Verbal
Rating Scale sera plus indiquée.
Il est fait état de plus de problèmes avec l’utilisation de la VAS horizontale en
comparaison avec la VAS verticale. La VAS verticale est recommandée, étant donné
que cet instrument de mesure génèrerait moins de relevés erronés et serait plus
facilement compréhensible pour les personnes âgées (Gagliese et al., 2005).
Convivialité
La convivialité de la VAS a été évaluée par 33 dispensateurs de soins travaillant
dans les services d’oncologie médicale/radiothérapie et d’oncologie pédiatrique de
l’hôpital universitaire de Gand.
94% des personnes interrogées constatent que la VAS peut être relevée en moins
de 3 minutes. De plus, la plupart des dispensateurs de soins sont d’avis que la VAS
est simple à compléter (85%) et est claire et univoque (91%). Le mode d’emploi est
également précis pour 94% des dispensateurs de soins. L’évaluation de la
convivialité de la VAS est donc extrêmement positive. Notons toutefois que 1
dispensateur de soins sur 2 est d’avis qu’une formation complémentaire est requise
pour l’utilisation de l’instrument de mesure.
Remarques
Plusieurs études font état de difficultés chez des patients pour compléter la VAS
(Gagliese et al., 2005; Herr et al., 2004; Paice & Cohen 1997; Pautex et al., 2006).
Des comparaisons entre la VAS et la Numeric Rating Scale (NRS) montrent que
l’utilisation de cette dernière échelle pose moins de problèmes. De plus, la NRS
bénéficie aussi d’une fiabilité/validité élevée et comparable. En outre, les patients
indiquent eux-mêmes qu’ils préfèrent la NRS et d’autres échelles de douleur à la
VAS (Carey et al., 1997; Dworkin et al., 2005; Gagliese et al., 2005; Herr et al., 2004;
Paice & Cohen 1997). Cela peut indiquer que la NRS est plus indiquée que la VAS
pour l’évaluation de la douleur. Plusieurs études de validation recommandent donc la
NRS comme étant l’instrument le plus adéquat pour l’évaluation de la douleur
(Downie et al., 1978; Dworkin et al., 2005; Jensen et al., 2003). Cela doit être
quelque peu nuancé, étant donné qu’aucune échelle de douleur ne peut être utilisée
pour toutes les formes de douleur ou pour toutes les catégories d’âge.
Références
Benaim, C., Froger, J., Cazottes, C., Gueben, D., Porte, M., Desnuelle, C., &
Pelissier, J. Y. (2007). Use of the Faces Pain Scale by left and right hemispheric
stroke patients. Pain, 128, 52-58.
Bijur, P. E., Silver, W., & Gallagher, E. J. (2001). Reliability of the visual analog scale
for measurement of acute pain. Acad Emerg Med, 8, 1153-1157.
Carey, S. J., Turpin, C., Smith, J., Whatley, J., & Haddox, D. (1997). Improving pain
management in an acute care setting. The Crawford Long Hospital of Emory
University experience. Orthop.Nurs., 16, 29-36.
Crossley, K. M., Bennell, K. L., Cowan, S. M., & Green, S. (2004). Analysis of
outcome measures for persons with patellofemoral pain: which are reliable and valid?
Arch Phys Med Rehabil, 85, 815-822.
Downie, W. W., Leatham, P. A., Rhind, V. M., Wright, V., Branco, J. A., & Anderson,
J. A. (1978). Studies with pain rating scales. Ann Rheum Dis, 37, 378-381.
Dworkin, R. H., Turk, D. C., Farrar, J. T., Haythornthwaite, J. A., Jensen, M. P., Katz,
N. P. et al. (2005). Core outcome measures for chronic pain clinical trials: IMMPACT
recommendations. Pain, 113, 9-19.
Freeman, K., Smyth, C., Dallam, L., & Jackson, B. (2001). Pain measurement scales:
a comparison of the visual analogue and faces rating scales in measuring pressure
ulcer pain. J.Wound.Ostomy.Continence.Nurs., 28, 290-296.
Gagliese, L. & Katz, J. (2003). Age differences in postoperative pain are scale
dependent: a comparison of measures of pain intensity and quality in younger and
older surgical patients. Pain, 103, 11-20.
Gagliese, L., Weizblit, N., Ellis, W., & Chan, V. W. (2005). The measurement of
postoperative pain: a comparison of intensity scales in younger and older surgical
patients. Pain, 117, 412-420.
Gallagher, E. J., Bijur, P. E., Latimer, C., & Silver, W. (2002). Reliability and validity of
a visual analog scale for acute abdominal pain in the ED. Am.J.Emerg.Med., 20, 287290.
Herr, K. A., Mobily, P. R., Kohout, F. J., & Wagenaar, D. (1998). Evaluation of the
Faces Pain Scale for use with the elderly. Clin J Pain, 14, 29-38.
Herr, K. A., Spratt, K., Mobily, P. R., & Richardson, G. (2004). Pain intensity
assessment in older adults: use of experimental pain to compare psychometric
properties and usability of selected pain scales with younger adults. Clin.J.Pain, 20,
207-219.
Hicks, C. L., von Baeyer, C. L., Spafford, P. A., van, K., I, & Goodenough, B. (2001).
The Faces Pain Scale-Revised: toward a common metric in pediatric pain
measurement. Pain, 93, 173-183.
Jensen, M. P., Chen, C., & Brugger, A. M. (2002). Postsurgical pain outcome
assessment. Pain, 99, 101-109.
Jensen, M. P., Engel, J. M., McKearnan, K. A., & Hoffman, A. J. (2003). Validity of
pain intensity assessment in persons with cerebral palsy: a comparison of six scales.
J Pain, 4, 56-63.
Kim, E. J. & Buschmann, M. T. (2006). Reliability and validity of the Faces Pain Scale
with older adults. Int J Nurs Stud., 43, 447-456.
Koho, P., Aho, S., Watson, P., & Hurri, H. (2001). Assessment of chronic pain
behaviour: reliability of the method and its relationship with perceived disability,
physical impairment and function. J Rehabil Med, 33, 128-132.
Mawdsley, R. H., Moran, K. A., & Conniff, L. A. (2002). Reliability of two commonly
used pain scales with elderly patients. Journal of Geriatric Physical Therapy, 25, 1620.
Paice, J. A. & Cohen, F. L. (1997). Validity of a verbally administered numeric rating
scale to measure cancer pain intensity. Cancer Nurs, 20, 88-93.
Pautex, S., Herrmann, F., Le Lous, P., Fabjan, M., Michel, J. P., & Gold, G. (2005).
Feasibility and reliability of four pain self-assessment scales and correlation with an
observational rating scale in hospitalized elderly demented patients. J.Gerontol.A
Biol.Sci.Med.Sci., 60, 524-529.
Pautex, S., Michon, A., Guedira, M., Emond, H., Le Lous, P., Samaras, D. et al.
(2006). Pain in severe dementia: self-assessment or observational scales? J Am
Geriatr Soc, 54, 1040-1045.
Pomeroy, V. M., Frames, C., Faragher, E. B., Hesketh, A., Hill, E., Watson, P. et al.
(2000). Reliability of a measure of post-stroke shoulder pain in patients with and
without aphasia and/or unilateral spatial neglect. Clin.Rehabil., 14, 584-591.
Stinson, J. N., Kavanagh, T., Yamada, J., Gill, N., & Stevens, B. (2006). Systematic
review of the psychometric properties, interpretability and feasibility of self-report pain
intensity measures for use in clinical trials in children and adolescents. Pain, 125,
143-157.
Tamiya, N., Araki, S., Ohi, G., Inagaki, K., Urano, N., Hirano, W. et al. (2002).
Assessment of pain, depression, and anxiety by visual analogue scale in Japanese
women with rheumatoid arthritis. Scand J Caring Sci, 16, 137-141.
Triano, J. J., McGregor, M., Cramer, G. D., & Emde, D. L. (1993). A comparison of
outcome measures for use with back pain patients: results of a feasibility study.
J.Manipulative Physiol Ther., 16, 67-73.
van Dijk, M., Koot, H. M., Saad, H. H., Tibboel, D., & Passchier, J. (2002).
Observational visual analog scale in pediatric pain assessment: useful tool or good
riddance? Clin.J.Pain, 18, 310-316.
Localisation de l’instrument de mesure
http://www.ndhcri.org/
VISUAL ANALOGUE SCALE (VAS)
VERSCHEIDENE AUTEURS SINDS1974
Author
(year)
Setting
Sample
(n)
Design
Reliability
Validity
Pautex, S., Michon, A.,
Guedira, M., Emond, H., Le
Lous, P., Samaras, D. et al.
Geriatrics hospital
and a geriatric
psychiatry service.
129 patients aged 65 and older
hospitalized during a 15 month-period
who met DSM criteria for dementia,
with a Mini-Mental State Examination
score less than 11 and a Clinical
Dementia Rating of 3 or greater.
(n = 129)
Repeated measures design:
Patients were asked to indicate
their current level of pain on
different scales (VAS, Faces Pain
Scale and Verbal Rating Scale).
This was repeated 30 minutes later
either by the same investigator
(50% of the cases) or by a different
examiner who was blinded to the
first assessment.
S
E
CrV
Toronto General
Hospital, University
Health Network and
Mount Sinai
Hospital, Toronto,
Ontario.
Patients scheduled to receive patientcontrolled analgesia following general
surgery.
(n = 504)
Comparative study: the VAS was
compared with the Numeric Rating
Scale (NRS), the Verbal Descriptor
Scale (VDS) and the pain intensity
measures of the McGill Pain
Questionnaire (MPQ).
(2006)
Gagliese, L., Weizblit, N., Ellis,
W., & Chan, V. W.
(2005)
FV
CrV
CsV
Reliability: Stability (S), Internal consistency (IC), Equivalence (E)
Validity: Face validity (FV), Content validity (CtV), Criterion validity (CrV), Construct validity (CsV)
Sensitivity (Sen), Specificity (Sp), Positive Predictive Value (PPV), Negative Predictive Value (NPV), Receiver Operating Curve (ROC), Likelihood
Ratio (LR), Odds Ratio (OR)
Results reliability
Results validity
Commentary
(S) Intra-rater reliability:
R = 0.98 (p < 0.001)
(CrV) Concurrent validity:
- Correlation between VAS and different scales at first assessment:
1. Correlation VAS – Verbal Rating Scale: r = 0.67 (p<0.001)
2. Correlation VAS – Faces Pain Scale: r = 0.45 (p<0.001)
3. Correlation VAS – Doloplus 2 (observational pain scale): r = 0.25
(p<0.001)
- Correlation between VAS and different scales at second assessment:
4. Correlation VAS – Verbal Rating Scale: r = 0.73 (p<0.001)
5. Correlation VAS – Faces Pain Scale: r = 0.66 (p<0.001)
6. Correlation VAS – Doloplus 2 (observational pain scale): r = 0.24
(p<0.001)
Weak correlations between
VAS and Doloplus 2.
(FV) Face validity;
Patients rated the VAS as the least accurate and least preferred instrument for
future assessments.The VAS had the highest proportion of patients making
errors (p ≤ 0.005).
The vertical VAS was
associated with lower error
rates and greater face validity
than the horizontal VAS.
(E) Interrater reliability:
R = 0.88 (p < 0.001)
A significant better
comprehension of the Verbal
Rating Scale (VRS) and the
Faces Pain Scale (FPS) scale
was found. This might suggest
that the VAS is not the most
appropriate pain assessment
scale for patients with severe
dementia.
(CrV) Concurrent validity:
- Correlation between VAS and VDS and NRS:
1. Patients aged > 60 years: r = 0.60-0.93 (p<0.001)
2. Patients aged ≤ 60 years: r = 0.72-0.91 (p<0.001)
- Correlation between VAS and MPQ was lower.
(CsV) Principal components analysis:
A one-factor model was extracted from the different measurement scales and
accounted for 82% of the total variance in the young group and 85% of the
variance in the older group. Factor loadings were 0.95 for horizontal VAS and
0.91 for vertical VAS.
Reliability: Stability (S), Internal consistency (IC), Equivalence (E)
Validity: Face validity (FV), Content validity (CtV), Criterion validity (CrV), Construct validity (CsV)
Sensitivity (Sen), Specificity (Sp), Positive Predictive Value (PPV), Negative Predictive Value (NPV), Receiver Operating Curve (ROC), Likelihood
Ratio (LR), Odds Ratio (OR)
Author
(year)
Setting
Sample
(n)
Design
Freeman, K., Smyth, C.,
Dallam, L., & Jackson, B.
Hospital.
Adults who had one or more stage 1
to 4 pressure ulcer, and had some
ability to explain their pain
experience.
(n = 44)
Comparative study: the VAS was
compared with the Faces Rating
Scale (FRS).
2 urban emergency
departments.
Convenience sample of patients with
the chief complaint of acute
abdominal pain.
(n = 101)
Repeated measures design:
VAS measurements 1 minute apart
every 30 minutes over two hours.
Not specified.
123 patients who had undergone
knee surgery and 124 women who
had undergone a laparatomy .
(n = 227)
Repeated measures design.
Baseline measurement with 16
additional measures up to 24h
following surgery.
(2001)
Gallagher, E. J., Bijur, P. E.,
Latimer, C., & Silver, W.
(2002)
Jensen, M. P., Chen, C., &
Brugger, A. M.
(2002)
Reliability
Validity
CrV
S
Sen
Sen
Reliability: Stability (S), Internal consistency (IC), Equivalence (E)
Validity: Face validity (FV), Content validity (CtV), Criterion validity (CrV), Construct validity (CsV)
Sensitivity (Sen), Specificity (Sp), Positive Predictive Value (PPV), Negative Predictive Value (NPV), Receiver Operating Curve (ROC), Likelihood
Ratio (LR), Odds Ratio (OR)
Results reliability
Results validity
Commentary
(CrV) Concurrent validity:
A mathematical transformation of the FRS in a numeric value was highly
correlated with the VAS (r = 0.92). There was a significant increase in
variability in VAS with increasing values of the FRS (p < 0.05).
(S) Intrarater reliability:
r = 0.99 (95% CI 0.989 to 0.992).
Bland-Altman analyses:
50 percent of the differences between
the repeated VAS scores (time 0 and 1
minute later) were between -3mm and
+2mm, 90 % were between -8mm and +
9mm, and 95% of the scores were within
±11mm of the 100 mm VAS.
(Sen) After completing the VAS at the end of each 30 minute interval, patients
were also asked to contrast current pain with their pain at the previous using
one of 5 categorical descriptors: ‘much less pain’, ‘a little less pain’, ‘about the
same pain’, ‘a little more pain’, or ‘much more pain’. Differences in VAS scores
increased linearly as pain descriptors escalated from ‘much less’ to ‘much
more pain’ (F = 79.4, p < 0.001).
(Sen) Repeated measures ANOVA:
Dependent variables: VAS and VRS pre- to post treatment difference scores
Independent variables: time and analgeticum treatment
- VAS tended to be more sensitive than VRS showing the smallest F values (p
< 0.001).
- A composite measure made up of a standardized average of three measures
of outcome (VAS difference score, VRS difference score and a pain relief
rating was not more sensitive to treatment effects (analgetica) than any one
measure.
Reliability: Stability (S), Internal consistency (IC), Equivalence (E)
Validity: Face validity (FV), Content validity (CtV), Criterion validity (CrV), Construct validity (CsV)
Sensitivity (Sen), Specificity (Sp), Positive Predictive Value (PPV), Negative Predictive Value (NPV), Receiver Operating Curve (ROC), Likelihood
Ratio (LR), Odds Ratio (OR)
Author
(year)
Setting
Sample
(n)
Design
Reliability
Validity
Pautex, S., Herrmann, F., Le
Lous, P., Fabjan, M., Michel, J.
P., & Gold, G.
The inpatient
dementia
consultation of the
Geneva Geriatric
Hospital.
Elderly who met DSM criteria for
dementia.
(n = 160)
Repeated measures design:
Patients were asked to indicate
their current level of pain on
different scales (horizontal/ vertical
VAS, Faces Pain Scale and Verbal
Rating Scale). This was repeated
30 minutes later either by the same
investigator (50% of the cases) or
by a different examiner who was
blinded to the first assessment.
S
E
CrV
(2005)
Reliability: Stability (S), Internal consistency (IC), Equivalence (E)
Validity: Face validity (FV), Content validity (CtV), Criterion validity (CrV), Construct validity (CsV)
Sensitivity (Sen), Specificity (Sp), Positive Predictive Value (PPV), Negative Predictive Value (NPV), Receiver Operating Curve (ROC), Likelihood
Ratio (LR), Odds Ratio (OR)
Results reliability
Results validity
Commentary
(S) Intra-rater reliability horizontal VAS:
r = 0.95 (p < 0.001)
Intra-rater reliability vertical VAS:
r = 0.94 (p < 0.001)
(CrV) Concurrent validity:
- Correlation between horizontal VAS and different scales at first assessment:
1. Correlation VAS – Verbal Rating Scale: r = 0.91 (p<0.001)
2. Correlation VAS – Faces Pain Scale: r = 0.88 (p<0.001)
3. Correlation VAS – Doloplus 2 (observational pain scale): r = 0.35
(p<0.001)
- Correlation between horizontal VAS and different scales at second
assessment:
4. Correlation VAS – Verbal Rating Scale: r = 0.85 (p<0.001)
5. Correlation VAS – Faces Pain Scale: r = 0.87 (p<0.001)
6. Correlation VAS – Doloplus 2 (observational pain scale): r = 0.36
(p<0.001)
Weak correlations between
VAS and Doloplus 2.
(E) Interrater reliability horizontal VAS:
r = 0.90 (p < 0.001)
Interrater reliability vertical VAS:
r = 0.87 (p < 0.001)
The authors reported a trend
towards better comprehension
of the horizontal VAS.
- Correlation between vertical VAS and different scales at first assessment:
1. Correlation VAS – Verbal Rating Scale: r = 0.89 (p<0.001)
2. Correlation VAS – Faces Pain Scale: r = 0.89 (p<0.001)
3. Correlation VAS – Doloplus 2 (observational pain scale): r = 0.40
(p<0.001)
- Correlation between vertical VAS and different scales at second
assessment:
4. Correlation VAS – Verbal Rating Scale: r = 0.89 (p<0.001)
5. Correlation VAS – Faces Pain Scale: r = 0.90 (p<0.001)
6. Correlation VAS – Doloplus 2 (observational pain scale): r = 0.39
(p<0.001)
Reliability: Stability (S), Internal consistency (IC), Equivalence (E)
Validity: Face validity (FV), Content validity (CtV), Criterion validity (CrV), Construct validity (CsV)
Sensitivity (Sen), Specificity (Sp), Positive Predictive Value (PPV), Negative Predictive Value (NPV), Receiver Operating Curve (ROC), Likelihood
Ratio (LR), Odds Ratio (OR)
Author
(year)
Setting
Sample
(n)
Design
Reliability
Validity
Bijur, P. E., Silver, W., &
Gallagher, E. J.
Two emergency
departments.
Convenience sample of adults with
acute pain as a component of their
chief complaint.
(n = 69)
Repeated measures design:
VAS measurements 1 minute apart
every 30 minutes over two hours.
S
Sen
Nursing homes
among other things.
Stroke patients experiencing shoulder
pain.
(n = 33)
Repeated measures design: 3
measures in one week.
S
E
(2001)
Pomeroy, V. M., Frames, C.,
Faragher, E. B., Hesketh, A.,
Hill, E., Watson, P. et al.
(2000)
Reliability: Stability (S), Internal consistency (IC), Equivalence (E)
Validity: Face validity (FV), Content validity (CtV), Criterion validity (CrV), Construct validity (CsV)
Sensitivity (Sen), Specificity (Sp), Positive Predictive Value (PPV), Negative Predictive Value (NPV), Receiver Operating Curve (ROC), Likelihood
Ratio (LR), Odds Ratio (OR)
Results reliability
Results validity
(S) Intra-rater reliability:
r = 0.97 (95% CI 0.96 to 0.98)
(Sen) Convergent validity:
After completing the VAS at the end of each 30 minute interval, patients were
also asked to contrast current pain with their pain at the previous using one of
5 categorical descriptors: ‘much less pain’, ‘a little less pain’, ‘about the same
pain’, ‘a little more pain’, or ‘much more pain’. Differences in VAS scores
increased linearly as pain descriptors escalated from ‘much less’ to ‘much
more pain’ (F = 79.4, p < 0.001).
Bland-Altman analyses:
50 percent of the differences between
the repeated VAS scores (time 0 and 1
minute later) were within 2mm, 90 %
were within 9mm, and 95% of the scores
were within 16mm of the 100 mm VAS.
(S) Intra-rater reliability:
r = 0.70
(E) Interrater reliability:
r = 0.79
Commentary
Examination of the raw data
indicated that 27% of the
ratings were in exact
agreement because all raters
gave a score of zero.
Day-to-day variation could
account for some of the lack of
intra-rater agreement.
Reliability: Stability (S), Internal consistency (IC), Equivalence (E)
Validity: Face validity (FV), Content validity (CtV), Criterion validity (CrV), Construct validity (CsV)
Sensitivity (Sen), Specificity (Sp), Positive Predictive Value (PPV), Negative Predictive Value (NPV), Receiver Operating Curve (ROC), Likelihood
Ratio (LR), Odds Ratio (OR)
Author
(year)
Setting
Sample
(n)
Design
Reliability
Validity
Herr, K. A., Spratt, K., Mobily,
P. R., & Richardson, G.
Subjects were
recruited through
college bulletin
board displays,
community faith
centers, seniorcitizen centers,
senior-housing, and
long-term facilities.
86 younger adults (age 25-55) and
89 older adults (age 65-94).
(n = 175)
Repeated measures design:
Noxious heat stimili were delivered
to the ventral forearm by an
electronically controlled contact
thermode. The heat stimili were
programmed to last 5 seconds and
to present randomly 43°C, 45°C,
46°C, 47°C, 48°C, 49°C or 51°C. A
2 minute trial interval followed each
stimulus presentation during which
the subject rated the stimulus on 5
scales.
IC
E
CsV
Sen
(2004)
Reliability: Stability (S), Internal consistency (IC), Equivalence (E)
Validity: Face validity (FV), Content validity (CtV), Criterion validity (CrV), Construct validity (CsV)
Sensitivity (Sen), Specificity (Sp), Positive Predictive Value (PPV), Negative Predictive Value (NPV), Receiver Operating Curve (ROC), Likelihood
Ratio (LR), Odds Ratio (OR)
Results reliability
Results validity
Commentary
(IC) Internal consistency:
Intercorrelations between the scales
were all statistically significant at every
temperature (p < 0.001).
Cronbach’s alpha within each scale
across the 7 temperature values:
VAS: 0.88
NRS: 0.88
VDS: 0.86
VNS: 0.88
FPS: 0.88
(CsV) Principal components analysis:
A one-factor model was extracted from the different measurement scales. The
correlation of each scale to the isolated factor was as follows:
VAS: 0.94
NRS: 0.96
VDS: 0.95
VNS: 0.95
FPS: 0.86
The VAS had a significant
higher failure rate (6.7%) in
comparison with the NRS, VDS,
VNS, and FPS.
Cronbach’s alpha within temperature
across the 5 scales:
43°C: 0.96
45°C: 0.96
46°C 0.96
47°C: 0.97
48°C: 0.97
49°C: 0.97
51°C: 0.97
(E) Interrater reliability:
VAS: 93.5% agreement
NRS: 100% agreement
VDS: 100% agreement
VNS: 100% agreement
FPS: 100% agreement
(Sen) Each tool demonstrated significant increases in score associated with
increase in temperature (p < 0.001).
The VNS demonstrated
significantly higher levels of
pain report than the other 4
scales.
The psychometric scale
evaluation was conducted using
an experimental pain stimulus
instead of using clinical pain
stimili.
The scales most preferred in
order by the total sample:
NRS (35.3%);
VDS (25.3%);
VNS (15.9%);
FPS (12.9%);
VAS (10.6%).
Reliability: Stability (S), Internal consistency (IC), Equivalence (E)
Validity: Face validity (FV), Content validity (CtV), Criterion validity (CrV), Construct validity (CsV)
Sensitivity (Sen), Specificity (Sp), Positive Predictive Value (PPV), Negative Predictive Value (NPV), Receiver Operating Curve (ROC), Likelihood
Ratio (LR), Odds Ratio (OR)
Author
(year)
Setting
Sample
(n)
Design
Reliability
Validity
Van Dijk, M., Koot, H. M.,
Saad, H. H., Tibboel, D., &
Passchier, J.
Not specified.
9 studies were reviewed on reliability;
6 studies were reviewed on validity.
Review.
E
CrV
Inpatient units of
the Crawford Long
Hospital, Atlanta.
The admitted diagnosis for 39.5% of
the sample was acute pain, 40.3 with
chronic pain and 20.2 with no pain.
(n = 267)
Comparative study:
The VAS was compared with FRS
and NRS.
IC
An outpatient
setting.
Elderly with musculoskeletal injury or
disorders with pain aged 61 to 84.
(n = 32)
Repeated measures design:
VAS and NRS measurements 15
minutes apart.
E
Two urban jewelry
stores.
Children aged 5 to 12.
(n = 76)
Validation study.
To validate a revised version of the
FPS (FPS-R) with 6 faces instead
of 7.
(2002)
Carey, S. J., Turpin, C., Smith,
J., Whatley, J., & Haddox, D.
(1997)
Mawdsley, R. H., Moran, K. A.,
& Conniff, L. A.
(2002)
Hicks, C. L., von Baeyer, C. L.,
Spafford, P. A., van, K., I, &
Goodenough, B.
CrV
(2001)
Reliability: Stability (S), Internal consistency (IC), Equivalence (E)
Validity: Face validity (FV), Content validity (CtV), Criterion validity (CrV), Construct validity (CsV)
Sensitivity (Sen), Specificity (Sp), Positive Predictive Value (PPV), Negative Predictive Value (NPV), Receiver Operating Curve (ROC), Likelihood
Ratio (LR), Odds Ratio (OR)
Results reliability
Results validity
(E) Inter-observer reliability:
Inter-observer reliability between
professionals’ VAS ratings (nurses,
physician or researcher):
r = 0.42 to 0.91 (median = 0.75)
(CrV) Concurrent validity:
Correlation coefficients between self reported VAS of children (VAS sr) and
VAS results of observational professionals ranged from 0.23 to 0.85 (median
0.53).
Correlation coefficients between VAS sr and VAS results of observational
parents ranged from 0.46 to 0.83 (median 0.70).
Inter-observer reliability between
professionals and parents’ VAS ratings:
r = 0.36 to 0.85 (median = 0.52)
Commentary
Correlation VAS results of observers and other pain instruments:
r = 0.42 to 0.86 (median = 0.68)
(IC) Cronbach’s alpha:
Intercorrelations between 3 scales was α
= 0.88.
Patients selected the FPS as
‘easiest to use’ (48.6%),
followed by the NRS (35.3%)
and the VAS (16.1%).
(S) Intra-rater reliability NRS:
r = 0.74
Intra-rater reliability VAS:
r = 0.92
(CrV) Concurrent validity:
A strong positive correlation (r = 0.93, p < 0.001) was found between the
ratings of pain intensity on the VAS and FPS-R.
The psychometric scale
evaluation was conducted using
an experimental pain stimulus
instead of using clinical pain
stimili.
Reliability: Stability (S), Internal consistency (IC), Equivalence (E)
Validity: Face validity (FV), Content validity (CtV), Criterion validity (CrV), Construct validity (CsV)
Sensitivity (Sen), Specificity (Sp), Positive Predictive Value (PPV), Negative Predictive Value (NPV), Receiver Operating Curve (ROC), Likelihood
Ratio (LR), Odds Ratio (OR)
Author
(year)
Setting
Sample
(n)
Design
Triano, J. J., McGregor, M.,
Cramer, G. D., & Emde, D. L.
The National
College of
Chiropractic
Center.
Patients presenting to the National
College of Chiropractic Center for the
first time, as well as those who had
not been seen in outpatient clinic
within the previous 6 months. A total
of 145 of 186 completed the final 6
weeks follow up. 41 subjects
completed only the first follow up.
(n = 186)
Repeated measures design:
VAS and other outcome measures
(Oswestry Low Back Pain Disability
Questionnaire, Modifief Zung
Depression Scale, Pain Drawing,
Modified Somatic Perception
Questionnaire and Pain Locus of
Control) for use with back pain
patients were administered (a) prior
to clinical evaluation for chief
compliant of the patient (b)
immediately after clinical evaluation
and before treatment and (c) 6
weeks later.
General community
and private
practice.
71 persons with patellofemoral pain
were used to evaluate the VAS’
validity; a subset of 17 persons was
used to assess the reliability.
(n = 71)
RCT.
The experimental treatment was a
physiotherapy intervention
(quadriceps muscle retraining,
patellar tape, stretching, education)
and the placebo treatment
consisted of a sham ultrasound.
Outcome measures:
- VAS for usual pain (VAS-U)
- VAS for worst pain (VAS-W)
- VAS for pain on 6 aggravating
activities: walking, running,
squatting, sitting, ascending and
decending stairs (VAS-activity)
(1993)
Crossley, K. M., Bennell, K. L.,
Cowan, S. M., & Green, S.
(2004)
Reliability
Validity
Sen
S
CsV
Reliability: Stability (S), Internal consistency (IC), Equivalence (E)
Validity: Face validity (FV), Content validity (CtV), Criterion validity (CrV), Construct validity (CsV)
Sensitivity (Sen), Specificity (Sp), Positive Predictive Value (PPV), Negative Predictive Value (NPV), Receiver Operating Curve (ROC), Likelihood
Ratio (LR), Odds Ratio (OR)
Results reliability
(S) Intra-rater reliability:
Participants completed a second set of
questionnaires within 7 days of the
original assessment but before their first
appointment for a treatment session.
Intra-rater reliability VAS-U:
r = 0.56
Results validity
Commentary
(Sen) There was a statistically significant difference between VAS scores at
time 1 vs. time 3 (F = 53.23, p < 0.001) and at time 2 vs. 3 (F = 47.84, p
<0.001).
Correlation between VAS at time 1 and VAS at time 2 was high (r = 0.87) and
decreased substantially when measured between VAS at time 2 and VAS at
time 3 (r = 0.26).
The Oswestry Low Back Pain
Disability Questionnaire and
VAS were both more valid and
reliable than other instruments
for application for treatment of
musculoskeletal disorders.
(CsV) Convergent validity:
Measures were completed at baseline and at the conclusion of the 6-week
treatment program. The change from baseline to final assessment was
calculated. The mean change scores were moderately correlated with a global
rating of change as perceived by the patient:
∆ VAS-U: r = -0.67
∆ VAS-W: r = 0.69
∆ VAS-Activity: r = -0.68
Intra-rater reliability VAS-W:
r = 0.76
Intra-rater reliability VAS-activity:
r = 0.83
Reliability: Stability (S), Internal consistency (IC), Equivalence (E)
Validity: Face validity (FV), Content validity (CtV), Criterion validity (CrV), Construct validity (CsV)
Sensitivity (Sen), Specificity (Sp), Positive Predictive Value (PPV), Negative Predictive Value (NPV), Receiver Operating Curve (ROC), Likelihood
Ratio (LR), Odds Ratio (OR)
Author
(year)
Setting
Sample
(n)
Design
Gagliese, L. & Katz, J.
Not specified.
Men scheduled for radical
prostatectomy and who were eligible
for postoperative patient controlled
analgesia. Two groups, younger and
older, were formed based on a split of
the sample at the median age of 62
years.
(n = 95)
Repeated measures design:
VAS assessed intensity of pain at
rest (VAS-R) and in response to a
standard mobilization exercise
(VAS-M) after sitting upright from a
lying position and taking two
maximal inspirations, McGill Pain
Questionnaire (MPQ) and Present
Pain Intensity (PPI) were compared
on postoperative day 1 (POD1) and
postoperative day 2 (POD2).
Patients were
recruited during
routine return visits
to the clinic of a
rheumatoid
specialist in Tokyo.
Female rheumatoid arthritis (RA)
patients.
(n = 145)
Comparative study:
VAS was compared with affect
measurements (VAS Anxiety, VAS
Depression and VAS Life
satisfaction).
(2003)
Tamiya, N., Araki, S., Ohi, G.,
Inagaki, K., Urano, N., Hirano,
W. et al.
(2002)
Reliability
Validity
CrV
CsV
S
CsV
Reliability: Stability (S), Internal consistency (IC), Equivalence (E)
Validity: Face validity (FV), Content validity (CtV), Criterion validity (CrV), Construct validity (CsV)
Sensitivity (Sen), Specificity (Sp), Positive Predictive Value (PPV), Negative Predictive Value (NPV), Receiver Operating Curve (ROC), Likelihood
Ratio (LR), Odds Ratio (OR)
Results reliability
Results validity
Commentary
(CrV) Concurrent validity:
There were significant moderate interscale correlations in both age groups. In
the older group, on POD 1, the correlations between MPQ and both VAS
ratings, and between PPI and VAS-M, failed to reach significance. The
remaining correlations were significant. On POD 2, the only nonsignificant
correlation was between VAS-M and MPQ. The magnitude of the correlations
did not differ between the groups except for VAS-R and MPQ. On both POD 1
(p ≤ 0.05) and POD 2 (p ≤ 0.004), this correlation was lower in older than
younger patients.
(CsV) Convergent validity:
On all scales, there was a significant decrease in scores with time. The
amount of morphine self-administered also decreased over time in both groups
but the decrease (POD 1 minus POD 2) was greater in the younger (27.68 ±
22.93 mg) than the older (20.51 ± 19.58 mg) patients (p ≤ 0.02).
(S) Intra-rater reliability VAS Pain at the
same day of administration (n = 47):
r = 0.84 (95% CI = 0.78–0.88)
Intra-rater reliability VAS Pain measured
7 days after the initial measurement (n =
47):
r = 0.64 (95% CI = 0.43–0.78)
(CsV) Convergent validity:
- VAS Pain was moderately positively correlated with VAS Anxiety (0.49, p <
0.001) and VAS Depression (0.36, p < 0.001) and moderately negatively
correlated with VAS Life satisfaction (-0.23, p < 0.05).
- VAS Anxiety explained 30% of the variance in pain (F = 21.1; d.f. = 1, 49; p <
0.001).
- VAS Depression explained 17% of the variance in VAS Pain (F = 9.8; d.f. = 1,
49; p = 0.003).
- Higher CRP levels were associated with greater pain (F = 6.09; d.f. = 4, 95; p
= 0.015).
Day-to-day variation could
account for some of the lack of
intra-rater agreement 7 days
after the initial measurement.
Reliability: Stability (S), Internal consistency (IC), Equivalence (E)
Validity: Face validity (FV), Content validity (CtV), Criterion validity (CrV), Construct validity (CsV)
Sensitivity (Sen), Specificity (Sp), Positive Predictive Value (PPV), Negative Predictive Value (NPV), Receiver Operating Curve (ROC), Likelihood
Ratio (LR), Odds Ratio (OR)
Author
(year)
Setting
Sample
(n)
Design
Reliability
Validity
Stinson, J. N., Kavanagh, T.,
Yamada, J., Gill, N., &
Stevens, B.
Not appropriate
(review).
Children aged 3 – 18 years.
Review on self report measures of
single-item ratings of pain intensity
for use in clinical trials in children
and adolescents.
S
CrV
Sen
Patients were
referred by the
Social Insurance
Institute to the
chronic pain
management
programme at
ORTON
Rehabilitation
Centre in Helsinki,
Finland.
Patients (45.5%) had radiation of pain
below the level of the knee. Other
signs of root compression e.g. reflex
changes or neurological defences
were observed in 38.6% of the
patients.
(n = 51)
Comparative study: Observations of
pain behaviour were compared with
VAS and other outcome measures
indirect related to pain (e.g.
depression, disability,…).
CsV
A large tertiary care
hospital.
A convenience sample of 50 adult
oncological patients with pain.
(n = 50)
Comparative study: the VAS was
compared with NRS and Simple
Descriptor Scale (SDS).
CrV
(2006)
Koho, P., Aho, S., Watson, P.,
& Hurri, H.
(2001)
Paice, J. A. & Cohen, F. L.
(1997)
Reliability: Stability (S), Internal consistency (IC), Equivalence (E)
Validity: Face validity (FV), Content validity (CtV), Criterion validity (CrV), Construct validity (CsV)
Sensitivity (Sen), Specificity (Sp), Positive Predictive Value (PPV), Negative Predictive Value (NPV), Receiver Operating Curve (ROC), Likelihood
Ratio (LR), Odds Ratio (OR)
Results reliability
Results validity
(S) Intra-rater reliability:
Test - retest evidence for VAS indicated
a moderate to strong positive median
correlation (r = 0.70) between pain
intensity ratings reported by 5–6 year
olds over a two-week interval (McGrath
et al. in Stinson et al., 2006). The
strength of the median between-session
correlation increased in children aged 13
- 15 years (r = 0.99).
(CrV) Concurrent validity:
VAS have demonstrated moderate to strong correlations (r = 0.63 – 0.90) with
several other pain measures (e.g., Faces Pain Scale and Oucher) (Beyer &
Aradine in Stinson et al., 2006; Tyler et al. in Stinson et al., 2006; Goodenough
et al. in Stinson et al., 2006; Migdal et al. in Stinson et al., 2006).
Commentary
(Sen) VAS have also shown responsivity to change following surgery (Tyler et
al. in Stinson et al., 2006), administration of analgesics (Abu-Saad and
Holzemer in Stinson et al., 2006; Aradine et al. in Stinson et al., 2006; Tyler et
al. in Stinson et al., 2006) and following application of a local anesthetic
(Migdal et al. in Stinson et al., 2006).
(CsV) Convergent validity:
VAS-scores demonstrated weak correlations with observations of pain
behaviour: r = 0.40 (p < 0.05).
CrV) Concurrent validity:
-The strong positive correlation between the VAS and the NRS was statistically
significant: r = 0.847, p < 0.001.
-VAS was also correlated to SDS: r = 0.708, p < 0.001
A majority of subjects (50%)
preferred the use of the NRS
when comparing the three
scales used to measure pain
intensity. Fewer patients
preferred the SDS (38%), with
the VAS chosen least often
(12%).
Eleven subjects (20%) in this
study were unable to complete
the VAS or did so with great
difficulty. All subjects were able
to complete the NRS and SDS
without apparent difficulty.
Reliability: Stability (S), Internal consistency (IC), Equivalence (E)
Validity: Face validity (FV), Content validity (CtV), Criterion validity (CrV), Construct validity (CsV)
Sensitivity (Sen), Specificity (Sp), Positive Predictive Value (PPV), Negative Predictive Value (NPV), Receiver Operating Curve (ROC), Likelihood
Ratio (LR), Odds Ratio (OR)
Author
(year)
Setting
Sample
(n)
Design
Reliability
Validity
Benaim, C., Froger, J.,
Cazottes, C., Gueben, D.,
Porte, M., Desnuelle, C., &
Pelissier, J. Y.
2 rehabilitation
units.
Patients who suffered a first unilateral
middle cerebral artery stroke. A
distinction was made between left and
right hemispheric stroke patients
(LHSP –RHSP).
(n = 127)
5 year period prospective study.
FPS was compared with vertical
VAS and Verbal Ratings Scale
(VRS).
S
E
CrV
A children’s
hospital.
Children aged 4 to 12 and who were
hospitalized for surgical treatment in
68 cases (75%) including abdominal
(n = 18), ear/ nose/ throat (n = 12),
orthopedic (n = 12), urological (n = 7),
and other (n = 19). The remaining 22
cases (25%) were hospitalized for
non-surgical painful conditions:
abdominal (n = 5), respiratory (n = 5),
orthopedic/ rheumatological (n = 4),
and other (n = 8).
(n = 90)
Validation study.
To validate a revised version of the
FPS (FPS-R) with 6 faces instead
of 7.
(2007)
Hicks, C. L., von Baeyer, C. L.,
Spafford, P. A., van, K., I, &
Goodenough, B.
(2001)
CrV
Reliability: Stability (S), Internal consistency (IC), Equivalence (E)
Validity: Face validity (FV), Content validity (CtV), Criterion validity (CrV), Construct validity (CsV)
Sensitivity (Sen), Specificity (Sp), Positive Predictive Value (PPV), Negative Predictive Value (NPV), Receiver Operating Curve (ROC), Likelihood
Ratio (LR), Odds Ratio (OR)
Results reliability
Results validity
Commentary
(S) Intra-rater reliability (n = 33):
Kappa coefficients for FPS were 0.74
(0.13) and 0.53 (0.10) in LHSP and
RHSP, respectively. Kappa coefficients
for VRS were 0.39 (0.14) and 0.57 (0.15)
in LHSP and in RHSP, respectively. ICC
for VAS were 0.78 (0.46–0.92) and 0.90
(0.74–0.96) in LHSP and in RHSP,
respectively.
(CrV) Concurrent validity (n = 51):
LHSP scores on the FPS were highly correlated with VAS (r = 0.82, p < 0.001)
and with VRS scores (r = 0.65, p < 0.01). In the RHSP group, correlations
were also high (r = 0.72, 0.72; p < 0.001 respectively).
Among 71 patients, most LHSP
preferred FPS (16/32) to VAS
(6/32) and VRS (10/32), most
RHSP preferred VAS (18/39) to
FPS (11/39) and VRS (10/
39). The difference was
statistically significant (p <
0.05).
(E) Interrater reliability (n = 43):
Kappa coefficients for FPS were 0.64
(standard error = 0.11) and 0.44 (0.09) in
LHSP and RHSP, respectively. Kappa
coefficients for VRS were 0.46 (0.12) and
0.52 (0.12) in LHSP and in RHSP,
respectively. ICC for VAS were 0.72
(95% CI = 0.44–0.88) and 0.86 (0.68–
0.94) in LHSP and in RHSP,
respectively.
(CrV) Concurrent validity:
The child was asked to estimate his or her current pain on the FPS-R, followed
by either the VAS or the colored analogue scale (CAS). Each child was
randomly assigned to use either the VAS or the CAS. Correlations between
the FPS-R and the CAS and between the FPS-R and the VAS were
respectively r = 0.84 and r = 0.92.
Reliability: Stability (S), Internal consistency (IC), Equivalence (E)
Validity: Face validity (FV), Content validity (CtV), Criterion validity (CrV), Construct validity (CsV)
Sensitivity (Sen), Specificity (Sp), Positive Predictive Value (PPV), Negative Predictive Value (NPV), Receiver Operating Curve (ROC), Likelihood
Ratio (LR), Odds Ratio (OR)
Author
(year)
Setting
Sample
(n)
Design
Kim, E. J. & Buschmann, M. T.
A general hospital
and an oriental
medical hospital in
Korea.
85 older adults with chronic pain (i.e.,
a state of pain ≥ 6 months duration
and for which the cause of the pain
could not be removed) were recruited.
(n = 85)
Comparative study.
(2006)
Reliability
Validity
CrV
Reliability: Stability (S), Internal consistency (IC), Equivalence (E)
Validity: Face validity (FV), Content validity (CtV), Criterion validity (CrV), Construct validity (CsV)
Sensitivity (Sen), Specificity (Sp), Positive Predictive Value (PPV), Negative Predictive Value (NPV), Receiver Operating Curve (ROC), Likelihood
Ratio (LR), Odds Ratio (OR)
Results reliability
Results validity
Commentary
(CrV) Concurrent validity:
Results indicate that pain intensities by the FPS, the NRS and the VAS were
not significantly different (F(1.00, 68.00) = 2.93, p = 0.09); likewise the tools
were not different in reporting the intensity of patient’s pain. The VAS had
moderately strong correlation with the FPS (r = 0.73, p < 0.001) and the NRS
(r = 0.91, p < 0.001). Correlation between the VAS and the NRS of the
cognitively impaired group (r = 0.88, p < 0.001) was weaker than the
correlation of the cognitively intact group (r = 0.92, p < 0.001), correlation
between the FPS and the NRS of the cognitively impaired group (r = 0.75, p<
0.001) was slightly stronger than correlation of the cognitively intact group (r =
0.70, p< 0.001).
Reliability: Stability (S), Internal consistency (IC), Equivalence (E)
Validity: Face validity (FV), Content validity (CtV), Criterion validity (CrV), Construct validity (CsV)
Sensitivity (Sen), Specificity (Sp), Positive Predictive Value (PPV), Negative Predictive Value (NPV), Receiver Operating Curve (ROC), Likelihood
Ratio (LR), Odds Ratio (OR)