1
Time Series Modelling Version 4.25
User’s Manual
James Davidson
28th February 2008
This document is also accessible through the program Help pages.
Contents
What's New? ..............................................................................................................6
TSM 4.25 ...............................................................................................................6
TSM 4.24 ...............................................................................................................6
TSM 4.23 ...............................................................................................................6
TSM 4.22 ...............................................................................................................6
TSM 4.21 ...............................................................................................................6
TSM 4.20 ...............................................................................................................7
TSM 4.19 ...............................................................................................................7
TSM 4.18 ...............................................................................................................7
TSM 4.17 ...............................................................................................................7
TSM 4.16 ...............................................................................................................8
TSM 4.15 ...............................................................................................................8
0. Introduction............................................................................................................9
0.1 TSM Basics......................................................................................................9
1. ENTERING DATA................................................................................................................9
2. MENUS AND DIALOGS......................................................................................................9
3. COMPUTING ESTIMATES, TESTS AND FORECASTS ..................................................9
4. SAVING PROGRAM SETTINGS ......................................................................................10
5. ORGANIZING YOUR WORK ...........................................................................................10
6. SIMULATION.....................................................................................................................10
7. MODELS .............................................................................................................................10
8. PROGRAMMING WITH TSM...........................................................................................11
9. TYPES OF MODEL ............................................................................................................11
10. SELECTING VARIABLES...............................................................................................11
11. VARIABLE "TYPES" ......................................................................................................12
12. PARAMETER VALUES...................................................................................................12
13. CODED FUNCTIONS.......................................................................................................12
14. SYSTEMS OF EQUATIONS ............................................................................................13
15. OUTPUT CONVENTIONS...............................................................................................13
0.2 How To .... ....................................................................................................14
1. HOW TO LOAD A DATA SET..........................................................................................14
2. HOW TO PLOT DATA SERIES.........................................................................................14
3. HOW TO RUN A SIMPLE REGRESSION. .......................................................................14
4. HOW TO GENERATE QUARTERLY DUMMIES ...........................................................15
5. HOW TO TAKE LOGARITHMS OF YOUR DATA.........................................................15
6. HOW TO TEST THE SIGNIFICANCE OF THE REGRESSION......................................15
7. HOW TO TEST FOR A UNIT ROOT ................................................................................15
8. HOW TO ESTIMATE AN ARMA(p,q) MODEL...............................................................15
9. HOW TO FORECAST WITH AN ARMA/ARIMA MODEL ............................................16
10. HOW TO ESTIMATE A SIMPLE VAR MODEL............................................................16
11. HOW TO ESTIMATE A GARCH MODEL .....................................................................17
1. User Interface.......................................................................................................18
1.1 The Menus .....................................................................................................18
1
© James Davidson 2008
1.2 Status Bar and Tool Bar.................................................................................19
1.3 The Results Window......................................................................................20
1.4 Dialogs ...........................................................................................................21
1.5 Entering Formulae .........................................................................................22
TYPING FORMULAE ............................................................................................................22
RESERVED NAMES ..............................................................................................................24
2. File .......................................................................................................................26
2.0 File: General Information ..............................................................................26
MRU LISTS.............................................................................................................................27
RESTART................................................................................................................................27
2.1 File / Settings .................................................................................................28
IMPORTING MODELS ..........................................................................................................29
EXPORTING SETTINGS .......................................................................................................29
SETTINGS AS TEXT..............................................................................................................30
2.2 File / Data.......................................................................................................30
MISSING OBSERVATIONS ..................................................................................................32
PERIODIC OBSERVATIONS AND DATES.........................................................................32
DATED OBSERVATIONS.....................................................................................................33
2.3 File / Results ..................................................................................................34
2.4 File / Listings .................................................................................................35
2.5 File / Graphics................................................................................................35
3. Setup ....................................................................................................................36
3.1 Setup / Set Sample ........................................................................................36
3.2 Setup / Data Transformations and Editing.....................................................36
EDIT COMMANDS ................................................................................................................37
TRANSFORM COMMANDS.................................................................................................40
3.3 Setup / Model Manager..................................................................................42
STORING MODELS ...............................................................................................................43
LOADING MODELS ..............................................................................................................44
DEFAULTS .............................................................................................................................44
MODEL DESCRIPTIONS ......................................................................................................44
DELETING MODELS.............................................................................................................45
3.4 Setup / Automatic Model Selection ..............................................................45
AUTOMATIC REGRESSOR SELECTION ...........................................................................45
MULTIPLE ARMA MODELS................................................................................................45
3.5 Setup / Recursive/Rolling Estimation............................................................46
3.6 Setup / Compute Summary Statistics.............................................................47
3.7 Setup / Nonparametric Regression ................................................................47
3.8 Setup / Semiparametric Long Memory..........................................................48
3.9 Setup / Cointegration Analysis ......................................................................49
3.10 Setup / Monte Carlo Experiments................................................................50
OPTIONS:................................................................................................................................52
RUNNING AN EXTERNAL PROCESS ................................................................................54
ADDITIONAL OPTIONS .......................................................................................................54
3.11 Setup / Tail Probabilities and Critical Values.............................................55
4. Model ...................................................................................................................56
4.0 Model / General .............................................................................................56
BUTTONS ...............................................................................................................................56
SPECIFYING SYSTEMS OF EQUATIONS ..........................................................................56
4.1 Model / Linear Regression.............................................................................57
VARIABLE AND LAG SPECIFICATION ............................................................................59
WALD TEST OF CONSTRAINTS.........................................................................................59
COINTEGRATING REGRESSION........................................................................................59
4.2 Model / Dynamic Equation............................................................................60
ESTIMATION CRITERIA ......................................................................................................61
MODEL SPECIFICATION .....................................................................................................62
2
© James Davidson 2008
VARIABLE SELECTION.......................................................................................................62
LINEAR REGRESSION .........................................................................................................63
BILINEAR MODEL................................................................................................................63
NONLINEAR MOVING AVERAGE (SPS)...........................................................................63
OTHER MODEL FEATURES ................................................................................................64
SYSTEMS OF EQUATIONS..................................................................................................64
ESTIMATING TYPE I (V)ARFIMA PROCESSES ...............................................................65
4.3 Model / Conditional Variance........................................................................65
MULTIVARIATE GARCH.....................................................................................................66
4.4 Model / Coded Function... .............................................................................67
METHODS ..............................................................................................................................68
INTERACTIVE CODING.......................................................................................................68
TYPES OF FORMULAE ........................................................................................................68
TEXT BOX CONTROLS ........................................................................................................70
PARSING THE MODEL.........................................................................................................70
PARAMETER NAMES...........................................................................................................70
VARIABLE NAMES...............................................................................................................71
OX CODING ...........................................................................................................................71
4.5 Model / Regime Switching... .........................................................................73
4.6 Model / Parameter Constraints... ...................................................................75
REGRESSOR SIGNIFICANCE TEST....................................................................................75
CODED_RESTRICTIONS......................................................................................................76
4.7 Model / Equilibrium Relations... ...................................................................77
4.8 Model / Select Instruments... .........................................................................79
5. Values ..................................................................................................................81
5.0 Values: General..............................................................................................81
BUTTONS ...............................................................................................................................81
VALUES FIELDS ...................................................................................................................81
FIXED PARAMETERS...........................................................................................................81
PARAMETER BOUNDS ........................................................................................................82
GRID PLOTS...........................................................................................................................82
WALD TESTS AND LINEAR RESTRICTIONS...................................................................82
5.1 Values / Equation...........................................................................................83
5.2 Values / Equilibrium Relations......................................................................84
5.3 Values / Distribution... ...................................................................................84
5.4 Values / Switching Regimes... .......................................................................84
6. Actions .................................................................................................................86
6.1 Actions / Run Estimation...............................................................................86
BATCH JOBS..........................................................................................................................86
6.2 Actions / Evaluate at Current Values.............................................................86
6.3 Actions / Estimate Multiple ARMA Models .................................................86
6.4 Actions / Automatic Regressor Selection ......................................................87
6.5 Actions / Recursive/Rolling Estimation ........................................................88
6.6 Actions / Plot Criterion Grid..........................................................................89
6.7 Actions / Multi-Stage GMM..........................................................................89
6.8 Actions / Compute Test Statistic ...................................................................90
SCORE (LM) TEST.................................................................................................................90
MOMENT (M or CM) TEST...................................................................................................91
WALD TEST OF SET RESTRICTIONS ................................................................................91
SPECIFIED DIAGNOSTIC TESTS ........................................................................................91
TEST FOR I(0) DEPENDENT VARIABLE ...........................................................................91
6.9 Actions / Compute Forecasts .........................................................................92
6.10 Actions / Retrieve Series..............................................................................92
6.11 Actions / Simulate Current Model ...............................................................93
6.12 Other Commands .........................................................................................93
SET DEFAULT VALUES.......................................................................................................93
3
© James Davidson 2008
CLEAR VALUES....................................................................................................................93
CLEAR RESULTS WINDOW................................................................................................94
CLOSE ALL DIALOGS..........................................................................................................94
RESTORE DIALOGS .............................................................................................................94
7. Graphics ...............................................................................................................95
7.0 Graphics: General Information .....................................................................95
7.1 Graphics / Show Data Graphic ......................................................................95
7.2 Graphics / Equation Graphics ........................................................................97
7.3 Graphics / Monte Carlo Graphics ..................................................................98
8. Options...............................................................................................................101
8.0 Options: General Information and Defaults.................................................101
8.1 Options / Output and Retrievals ..................................................................103
SAVING DATA FILES.........................................................................................................103
OUTPUTTING TABLES AND SERIES...............................................................................103
EXPORTING AND PRINTING LISTINGS .........................................................................104
RETRIEVING GENERATED SERIES.................................................................................104
8.2 Options / Tests and Diagnostics ..................................................................104
Q TESTS FOR SERIAL DEPENDENCE .............................................................................104
DIAGNOSTIC TESTS...........................................................................................................105
SCORE (LM) TESTS ............................................................................................................105
CONDITIONAL MOMENT (CM) TESTS ...........................................................................106
OTHER DIAGNOSTIC TESTS ............................................................................................106
BOOTSTRAP TEST OF I(0).................................................................................................107
COVARIANCE MATRIX FORMULAE ..............................................................................107
HAC KERNEL FORMULAE AND BANDWIDTH.............................................................108
MODEL SELECTION CRITERIA........................................................................................108
LM TESTS OF RESTRICTIONS AND "FIXED" VALUES................................................108
SUPPLYING AN EDF FILE FOR P-VALUES ....................................................................109
8.3 Options / Forecasting ... ..............................................................................109
FORECASTS .........................................................................................................................109
FORECAST TYPE ................................................................................................................110
MULTI_STEP FORECAST METHOD ................................................................................110
MONTE CARLO SETTINGS ...............................................................................................111
ACTUALS IN FORECAST PLOT........................................................................................111
CONFIDENCE BANDS .......................................................................................................112
PLOT DISPLAY....................................................................................................................112
IMPULSE RESPONSES .......................................................................................................112
8.4 Options / Simulation and Resampling ... .....................................................112
SIMULATION OPTIONS .....................................................................................................112
SIMULATION PRESAMPLE MODE ..................................................................................114
TYPE I FRACTIONAL PROCESSES ..................................................................................114
INFERENCE BY RESAMPLING.........................................................................................115
RESAMPLING CONFIDENCE INTERVALS .....................................................................116
NEWTON-RAPHSON ALGORITHM..................................................................................116
8.5 Options / Graphics ... ...................................................................................116
GRAPHICS FILE FORMATS...............................................................................................116
DATES IN PLOTS ................................................................................................................117
BITMAP DIMENSIONS .......................................................................................................118
'ACTUAL-FITTED-RESIDUAL' PLOTS .............................................................................118
CONFIDENCE BANDS ........................................................................................................118
MULTIPLE SERIES DISPLAY............................................................................................118
LINES AND SYMBOLS .......................................................................................................119
LEGENDS .............................................................................................................................119
CRITERION PLOTS .............................................................................................................119
DENSITY PLOTS .................................................................................................................119
LINE STYLES .......................................................................................................................119
SCATTER_PLOT OPTIONS ................................................................................................120
8.6 Options / ML and Dynamics .......................................................................121
4
© James Davidson 2008
ML PARAMETERIZATION ................................................................................................121
DYNAMIC MODEL SETTINGS..........................................................................................121
GARCH PARAMETERIZATION.........................................................................................122
OPTIMIZATION SETTINGS ...............................................................................................123
8.7 Options / Optimization and Run ... ..............................................................123
OPTIMAND CONVENTION................................................................................................123
NUMBER OF GRID POINTS...............................................................................................123
BOUND ON DYNAMIC PARAMETERS ...........................................................................124
OPTIMIZATION SETTINGS: BFGS ALGORITHM..........................................................124
SIMULATED ANNEALING ................................................................................................124
NON-CONVERGENCE ........................................................................................................124
RUNNING AN EXTERNAL PROCESS ..............................................................................125
8.8 Options / General Options ... .......................................................................125
OPERATIONAL SETTINGS ................................................................................................125
DISPLAY SETTINGS ...........................................................................................................126
LINEAR REGRESSION MODE...........................................................................................127
DEFER EXTERNAL JOBS...................................................................................................127
ASSIGNABLE TOOLBAR BUTTONS................................................................................127
9. Help....................................................................................................................128
USER'S MANUAL ................................................................................................................128
VIEW TEXT FILES ..............................................................................................................128
DESCRIPTIONS....................................................................................................................128
REGISTRATION...................................................................................................................128
10. Interpreting the Output.....................................................................................130
PARAMETER LABELLING ................................................................................................130
PARAMETER ROOT TRANSFORMATIONS....................................................................130
STANDARD ERRORS, TEST STATISTICS AND P-VALUES ........................................131
SELECTION CRITERIA AND SUMMARY STATISTICS.................................................131
CONVERGENCE ISSUES....................................................................................................132
GRAPHICS FOR REGIME SWITCHING MODELS ..........................................................132
BOOTSTRAP AND SUBSAMPLING P-VALUES..............................................................133
11 Directories and Files .........................................................................................133
DIRECTORIES (Windows folders):......................................................................................133
FILES .....................................................................................................................................134
FILE TYPES ..........................................................................................................................134
12. Hints and Tips ..................................................................................................135
NUMERICAL OPTIMIZATION ..........................................................................................136
CHOICE OF SYSTEM ESTIMATORS ................................................................................137
USING THE RESULTS WINDOW AS A TEXT EDITOR .................................................137
ENTERING DATA BY HAND.............................................................................................138
MAINTAINING AND EXPORTING PROGRAM SETTINGS ...........................................138
DOING SIMULATIONS.......................................................................................................139
STARTING TSM FROM WINDOWS EXPLORER ............................................................140
RUNNING SEVERAL INSTANCES OF TSM ....................................................................141
TROUBLESHOOTING .........................................................................................................141
5
© James Davidson 2008
What's New?
TSM 4.25
*
Bootstrap test of I(0).
*
'RGB' scatter plots, with observation dates colour-coded.
*
Improved Monte Carlo output format and EDF handling.
NOTE: further revision of EDF file format!
*
New data editing/transformation options.
*
Improved sample selection options.
*
Consolidates a large number of small modifications and fixes
TSM 4.24
*
Improved facilities for running and sharing Ox code. Code files now
bundled with exported settings, and viewable from the Help menu.
*
EDF files for tabulations of different sample sized can now be merged.
p-values are generated by interpolating the tabulations according to
actual sample size.
NOTE: EDF file and Ox function formats are changed in 4.24!
Files created with and for previous versions of TSM must be modified.
*
External batch processing option for estimation and Monte Carlo runs
- allows multi-tasking and avoids tying up the GUI for long jobs.
*
Improved plotting controls: legends and boxes.
TSM 4.23
*
*
Plug-in bandwidth selection and pre-whitening for HAC
covariance estimation.
New graphics options, including forecast fan charts, selectable
line widths, and 8 selectable line style options for series plotting.
TSM 4.22
*
Kiefer-Vogelsang-Bunzel (KVB) inference with inconsistent
covariance matrix estimation.
TSM 4.21
*
*
*
*
*
Nonlinear moving average (SPS) model feature, providing
close approximations to STOPBREAK and STIMA models.
Recursive coded equations can include the lagged value as
an argument.
Extended options for coding nonlinear models, including
nonlinear ECMs, and nonlinear MAs using the recursion
feature.
Panel to create/edit/view a model description. Text is saved
with the model.
Forecast confidence bands now plotted in system forecasts.
System impulse response option.
6
© James Davidson 2008
TSM 4.20
*
*
*
*
*
*
*
*
Automatic regressor selection by optimizing info. criterion.
Local Whittle ML long memory estimation.
Nyblom-Hansen model specification tests.
Coded (nonlinear) equilibrium relations.
Supplied EDF option for critical values extended to Ox-coded
test statistics.
Text files can be loaded into the results window for editing.
"Restart" option, for one-click incorporation of changes to user's
Ox code.
Randomized coded simulation models.
TSM 4.19
*
*
*
*
*
*
*
*
A formula parser enables three new features:
o
Algebraic data transformations.
o
Nonlinear parameter restrictions (replaces existing procedure).
o
Nonlinear equation estimation - complements the existing ability to
compile Ox functions into the program. More limited in scope, but
much simpler to implement.
Save and use tabulations of test EDFs. This feature implements size
correction and estimation of true test powers in simulation experiments.
Can also be used to make bespoke tabulations of non-standard tests.
"Save Selected" command - write selected variables from data set to new
file.
Harris-McCabe-Leybourne (HML) test for long memory of data/residuals.
Two assignable toolbar buttons, + other interface improvements.
Improved implementation of supplied Ox-coded statistics.
Fourier bootstrap option.
Nyblom-Hansen model stability tests.
TSM 4.18
Code recompiled under Ox 4.02. Dedicated "Stop" button on toolbar to pause
calculations. Data plots can be displayed directly, by clicking the variable list in any
dialog, and then the "Chart" button. Excel dates for weekly and daily data are read
with the data, and used in the output and plots.
TSM 4.17
Progress indicator for numerical optimizations shows the number of
iterations and current criterion value.
Improved code for setting model specifications. Parameter values and settings
are now preserved under deletion/restoration of regressors. In systems,
equations can be deleted/restored without losing values and settings.
Enhanced Monte Carlo module allows multiple experiments in a single run,
Experiments can also be extended with additional replications.
'User-supplied statistic' option allows the Monte Carlo module to have a fully
general application. The distribution of any function of the data set, coded by the
user in Ox, can be studied by simulation, after using TSM's modelling facilities
(or user-supplied code) to generate the data.
7
© James Davidson 2008
TSM 4.16
In the Windows installation, the program can now be started by simply clicking
on a ".tsm" (settings) file in Windows Explorer. These files are identified by the
TSM icon, as for the Start Menu shortcuts.
A new File / Import Models... function allows model specifications to be copied
from one settings file to another.
The File / Export... command is enhanced to save the data and listings files as
part of the ".tsm" file. A single settings file can now record a complete working
environment, including data, models, graphs and parameter values, and be
opened by a single keystroke on a different installation. When an exported file
is opened, the data and listing files are recreated automatically in the Start-in
directory.
Additional resampling options – sieve-AR bootstrap.
Scatter plots now show regression lines superimposed.
TSM 4.15
has a redesigned interface. Here are the main changes from Versions 4.14 and
earlier.
*
The Estimation and Sample dialog has been replaced with a simplified
Set Sample dialog. This no longer has a toolbar button, but is
accessible as a floating window in all the model specification
dialogs.
*
Estimator selection buttons and 'System of Equations' checkboxes
are now located as appropriate in the redesigned Linear Regression
and Dynamic Equation dialogs.
*
A Parameter Bounds / Grid-Plotting checkbox is located in each
Values dialog. The Minimand option is selectable in Options /
Optimization and Run.
*
Kernel selection for HAC estimators has been moved from Options /
General to a redesigned Options / Tests and Diagnostics dialog.
*
The Options / Bootstrap and Simulation dialog is now renamed as
Simulation and Resampling, and controls both bootstrap and the
new subsampling options.
*
The new "Dialog" toolbar button can be used in two ways. By default
it re-opens the last dialog closed, excepting dialogs with their own
buttons. Hover the mouse over it to see its current assignment.
Alternatively, it can be permanently assigned to one of a range of
dialogs normally accessible from the menus. Set your choice in
Options / General.
8
© James Davidson 2008
0. Introduction
0.1 TSM Basics
TIME SERIES MODELLING Version 4 is an interactive package for modelling and
forecasting time series. It is designed primarily for nonlinear dynamic model
estimation, including ARMA and ARFIMA models, conditional variance models
(ARCH/GARCH and several variants), regime-switching and smooth transition.
It also functions well as a user-friendly, general purpose regression package.
To enhance its power and ease of use, the program has various special features not
found in comparable packages. It is strongly recommended to read through this
introduction before starting work with TSM. It does not aim to describe all the
capabilities of the package. These can best be discovered by browsing the menus
in conjunction with the Help pages provided for each. Its purpose is to outline
TSM's unique design and operating conventions to first-time users.
****************
Working with TSM
****************
1. ENTERING DATA
Regression packages often have their own proprietary database formats, and getting
data into them from different sources can be troublesome. By contrast, TSM reads
either ASCII files or spreadsheet files directly. It works smoothly in conjunction
with popular spreadsheet programs such as Microsoft Excel, Lotus 123 and
OxMetrics, for preliminary data organization, and for further analysis and graphing
of outputs. It can itself merge datasets with different start and finish dates and use
and display date information, including daily dates in Excel format. It offers flexible
single-observation editing, series transformations, and dummy creation capabilities.
2. MENUS AND DIALOGS.
TSM is operated in Graphical User Interface (GUI) mode by setting the options in
a number of dialogs. These can be opened from the menu bar or by shortcut buttons
on the tool bar. Some operations can be performed in several different ways. For
example, an estimation run can be launched from the menus, from the "Running
Man" toolbar button, and also from the "Go" buttons in several dialogs. The action
of the toolbar button can vary depending on the dialog currently open.
3. COMPUTING ESTIMATES, TESTS AND FORECASTS
The basic method of operation is as follows:
1)
Specify the calculations and settings desired, using the Setup, Model,
Values and Options menus.
2)
Launch the estimation module using one of the commands on the Actions
menu, a dialog button, or a tool bar button.
Both the "Running Man" and the "Calculator" buttons on the tool bar launch closed
form (non-iterative) estimations, such as OLS and IV, and associated tests and
forecasts. For nonlinear estimation (if enabled) the "Running Man" button launches
the optimization algorithm, while the "Calculator" button just performs postestimation computations (forecasts or tests) using the currently stored parameter
values, either obtained on the latest run or entered by the user.
9
© James Davidson 2008
NOTE: forecasts and tests are not computed by merely specifying them in the
Options dialog! Use the menu items in the Actions menu for this purpose. The
Calculate button performs all the currently specified calculations and generates the
complete estimation output for the current parameter values.
Each run has a unique ID number to identify the outputs associated with it, such as
graphics files, spreadsheet files, and settings files.
4. SAVING PROGRAM SETTINGS
TSM has a large number of optional settings that most users will want to change
only occasionally. The program automatically saves all current settings in a special
file called "settings.tsm". When the program is restarted the working environment,
with all selected options, is exactly as it was in the last session. (There is an option
to discard model specs. at shut-down, and save only the current options.)
Named settings files (with .tsm extension and 'red TSM' Windows icon) can be
saved and re-loaded manually at any time.
5. ORGANIZING YOUR WORK
The File / Settings / Export... command saves a complete image of the current
session, including options, model specifications, data, generated series, tables and
graphics. 'Exported' .tsm files do not contain local path information and are fully
portable between installations. When they are opened, the data file and temporary
storage (.tsd) files are recreated. This provides an ideal way to share work with
collaborators, move between home/office installations and distribute classroom
exercises. Double-clicking on a .tsm file icon in Windows Explorer starts the
program and loads the file contents automatically.
6. SIMULATION
Part of the TSM philosophy is that any model that can be estimated by the program
can also be simulated, using randomly generated disturbances or bootstrapped
(randomly resampled) residuals. The former can be Gaussian, or generated from the
distribution specified by the selected likelihood function. This feature can be used for
one-off simulations whose output is graphed. Comparing the simulation of the fitted
model with the original data can be a useful informal diagnostic tool. However, the
main application for the simulation module is to running bootstrap tests and Monte
Carlo experiments. A flexible interactive Monte Carlo module is provided.
7. MODELS
A "model" is a complete set of specifications and values to estimate, simulate or
forecast an equation or system of equations. Any number of these specifications
can be stored and recalled during a session, as well as saved permanently in the
settings (.tsm) file. For example, this option allows the user to run an exploratory
regression on the fly, while working on a complex multiple-equation model,
without losing any settings and values. Just use the Model Manager to store the
current settings and values to a named model (optionally including the data set).
Load the model to restore them again. The generated series, graphics and
(optionally) data set associated with a model are stored in a file with '.tsd'
extension and 'blue TSM' Windows icon
Models are also used for running Monte Carlo experiments. Select one model
10
© James Davidson 2008
to generate the data using the simulation module, and another (or the same)
model for estimating, allowing a very flexible approach to misspecification
analysis.
8. PROGRAMMING WITH TSM
TSM can be called as a module in your own Ox program. It is easy to
write out the commands and options set by TSM dialogs as lines of Ox code.
Your program can call the main program functions such as "Run_Estimation"
and "Run_Simulation", and perform further operations on the output.
The special scripting language is fully detailed in the programming manual. To see
what your current set of (non-default) options looks like in coded form, give the
command File / Settings / Display/Save Text... and inspect the listing created.
The reverse operation is also possible. Write out a set of coded commands in
the TSM launch file, and these options are then set when the GUI program is
started. This provides an alternative way to set and maintain your list of
favourite program options.
*****************
Modelling with TSM
*****************
9. TYPES OF MODEL
There are two main model specification dialogs, called respectively Linear
Regression and Dynamic Equation. The "regression scatter" and "space shuttle"
toolbar buttons give direct access to these. (The latter can be optionally hidden
to simplify the interface, if these features are not being used.)
Linear Regression is used to specify linear models for estimation by a closedform expression (or, at most, a fixed, finite sequence of calculations). These
include OLS, 2SLS, SUR and 3SLS.
Although linear regressions can also be specified in the Dynamic Equation dialog,
its special role is to set up nonlinear dynamic models. All estimation in this dialog,
even of linear models, is done by optimizing a log-likelihood or other criterion
function numerically, using the BFGS and/or simulated annealing algorithms.
Model choices include Gaussian, Student t and GED continuous distributions,
binary logit and probit models, and count data models. All these models can
feature conditional variances, and Markov switching or smooth transition
nonlinearity.
10. SELECTING VARIABLES
Model specification dialogs include a list of variable names, corresponding to the
currently loaded data file. Selecting a variable is a two-step procedure. First select a
radio button specifying the variable Type - dependent variable(s), one of several
types of explanatory variables, instruments, and so forth. Next, click on the desired
name in the list, to highlight it. The list can be scrolled, if it is too long to display
complete in the dialog. Note that when one or more variables are selected in a
category, the corresponding radio button is highlighted with a lighter-grey panel.
To see which variables are currently selected in a particular category, click on the
radio button in question. A little practice helps to get variable selection smooth and
rapid, and it is a good idea to click on each highlighted button in turn to check the
specification is as desired, before launching the estimation run. To deselect a
variable, simply click on it again to remove the highlight. There is also a "Clear"
11
© James Davidson 2008
button to remove all the current selections.
NOTE: to display time plots of one or more variables, highlight them in the list
and click the 'Data Graphics' button on the toolbar
11. VARIABLE "TYPES"
Explanatory variables in an equation can be of two, or three, different "Types", with
a different radio button assigned to each. In some models "typing" is irrelevant
(in which case, just choose Type 1), but it has a number of common uses. In linear
regressions, it is used to allow lags to be treated differently. Lags up to a specified
order can be included automatically, so that lagged values do not need to be created
and stored individually in the database. The number of lags is selected with the scroll
bar, for all variables of the given Type. For example, assign non-lagged variables
such as dummies to Type 1, and distributed lag regressors to Type 2. To allow easy
inclusion of the lagged dependent variable, the dependent variable in a regression
can be assigned as a Type 2 regressor with lags specified. The current value is
omitted from the regressor set automatically. This also works in system models such
as VARs.
In the Dynamic Equation dialog, "typing" regressors in combination with specifying
autoregressive and moving average components has a special additional role,
allowing an equation to feature "structural dynamics" and/or "error dynamics". See
the relevant Help pages and the TSM main document, for details on this.
12. PARAMETER VALUES
A special feature of TSM is the Values dialogs, where values and conditions for
model parameters can be set. Among the uses of these dialogs are
*
Setting starting values for numerical optimization
*
Fixing parameters at chosen values during estimation
*
Setting inequality constraints on parameters during estimation
*
Setting zero or linear restrictions on parameters, either for constrained
estimation, or calculation of Wald tests.
The Values dialogs can be accessed from the menu bar, or by the "Values" button in
the relevant model specification dialog.
Parameter values obtained in the latest estimation run can be viewed in the Values
dialogs, and will form the starting values for the next run unless edited or cleared.
Alternatively, the menu item Evaluate at Current Values (or the "Calculator"
button) generates the program outputs at these values, without re-optimizing.
13. CODED FUNCTIONS
General nonlinear models can be estimated by creating coded formulae. The
program features a formula parser which can evaluate functions of data and/or
parameters typed using standard notations. This feature is used to create
functions for estimation and parameter restrictions for testing, as well as data
transformations.
Alternatively, TSM can estimate a model programmed by the user in the Ox
language, while making use of all the estimation, testing and forecasting features
of the package. (This feature is distinct from, though compatible with, calling
TSM from within an Ox program.)
12
© James Davidson 2008
14. SYSTEMS OF EQUATIONS
Setting up a system of equations is greatly simplified by requiring that the righthand side of every equation has the same specification. In this way, only one
specification has to be created and stored. This is the natural approach for an
unrestricted VAR, for example. To have the equations different from each other
(e.g. with identifying restrictions imposed) the method is to create an inclusive
specification of which all the actual equations are special cases, and then "fix" the
surplus parameters at zero in the Values dialogs - enter 0 in the value fields, and
check the 'Fixed' checkboxes. While editing values, one can switch easily from
one equation to another, using the 'Next Equation' button or the choice widget
on the tool bar. Parameters fixed at 0 are not reported in the output, although
those fixed at non-zero values are listed as such.
Systems of coded nonlinear functions can be estimated in the same way. While
their specifications can differ, each has the common set of named parameters
assigned to it - "fix" the surplus ones in Values / Equation, so that the search
algorithm ignores them.
Simultaneous equation systems can be specified by including variables as both
dependent variables and Type 1 regressors. When their presence in both sets is
detected by the program, the system is estimated by FIML. It is the user's
responsibility to ensure that identifying restrictions are imposed on the equations,
in this case.
In vector ARMA and GARCH models specified in the Dynamic Equation dialog,
the lags of all the variables are included by default in each equation. For example,
a VAR(2) system of three equations has 6 regressors in each equation. Of course,
some of these regressors can be suppressed if desired, by fixing their coefficients
at 0 in the Values dialogs.
Note that a VAR can be set up in either the Linear Regression dialog or the Dynamic
Equation dialog. In the first case it will be estimated in two steps, by SUR
(equivalently OLS, if unrestricted). In the second case it will be estimated
numerically, by Least Generalized Variance or ML.
15. OUTPUT CONVENTIONS
The outputs from TSM are not always the same as those of other packages.
t-ratios and p-values are not reported in those cases where "zero" is not the
natural null hypothesis for the parameter (variances for example). The Durbin
Watson statistic is not reported by default, since it is often not valid in dynamic
regressions. See the Tests and Diagnostics Options dialog to select it. A valid
LM statistic or M-statistic for residual autocorrelation, or neglected ARCH,
can always be computed if desired, and provides an equivalent test to the DW
in those cases where it is valid. Autocorrelation Q statistics for residuals and
squared residuals are reported by default, as are standard model selection
criteria, although these outputs can be optionally suppressed.
Robust standard errors are reported by default. These will not match the "naive"
(conventional) standard error formulae reported by most packages, and note that
the latter are often based on incorrect assumptions, although they can always be
computed as an option. Heteroscedasticity and autocorrelation consistent (HAC)
13
© James Davidson 2008
standard errors are also optionally available. Test p-values and confidence intervals
can also be computed by the parametric bootstrap, based on resampling model
residuals and using the fitted model to simulate data under the null hypothesis.
Asymptotic chi-squared statistics are reported by default for the standard tests of
restrictions and mis-specification, although reporting in 'F-statistic' form is a
selectable option. (Note that in most time series applications, 'F statistics' are
not truly F distributed in finite samples.) Bootstrap p-values can be computed if
desired, for improved test performance in small samples. Another approach related
to the bootstrap is to tabulate test statistics by simulation and use the EDF tabulations
to generate p-values.
0.2 How To ....
For the first-time user who doesn't want to spend too much time with the user's
manual, here are some simple step-by-step instructions to get you started.
1. HOW TO LOAD A DATA SET
*
*
Click the "Open File" button on the tool bar. In the file dialog, navigate to
the Windows folder containing your file in the usual way, and click on it.
Several different file formats are supported, but an Excel worksheet is a
popular choice. The series should be stored in columns, starting in column 2,
with the first row of the spreadsheet containing the variable names.
2. HOW TO PLOT DATA SERIES
*
*
*
Click with the mouse on the variable list in any open dialog.
Click the "Chart" button on the toolbar, to display plots of all the highlighted
series on the list.
Clicking the "Chart" button without first clicking a variable list opens the
Graphics / Show Data Graphic dialog.
3. HOW TO RUN A SIMPLE REGRESSION.
*
*
*
*
*
*
*
*
*
Click on the "regression scatter" button to open the Linear Regression dialog.
In the Select Estimator box choose Ordinary Least Squares (the default).
Choose the dependent variable from the list, and highlight the name by
clicking on it with the mouse. At most one name can be selected at once.
Note that the radio button is highlighted to show you have made a selection
In the "Select Regressors" panel, click on the "Type 1" radio button. Then
select the regressors from the list, as for the dependent variable. Any
number of names can be selected. The radio button is highlighted.
Click the check-box for Intercept, and, if appropriate, for Trend.
To ensure your selection of variables is as you intend, it's a good idea the
click alternately on the highlighted radio buttons. Note how your selections
on the data list are highlighted in turn.
Click the "Go" button in the dialog - or the "Running Man" or "Calculator"
buttons on the tool bar. All have the same action, in this case.
The results appear in the window. To view the Actual-Fitted and Residual
plots, click the "Twin-Graph" button on the tool bar.
To use less than the complete sample for estimation, click the "Select
Sample" button to open the sample-setting dialog. Use the scroll bars to
14
© James Davidson 2008
*
select the first and last observation.
When you launch an estimation run, open dialogs are closed automatically
to show the results window. Click the "Windows" button on the tool bar
to restore them to their previous locations on the screen.
4. HOW TO GENERATE QUARTERLY DUMMIES
*
*
*
*
Click the "f(X)" button on the tool bar.
Click the Edit button, then scroll down the choice widget until you find
"Make Seasonals".
A scroll bar to choose the frequency appears. Select "4", and press Go.
Four dummy variables are added to the data set. Add only three of them
to your regression if you have an intercept!
5. HOW TO TAKE LOGARITHMS OF YOUR DATA
*
*
*
*
*
Click the "f(X)" button on the tool bar.
Click the Transform button, then scroll down the choice widget until you
find "Logarithm".
Highlight all the variables on the list you wish to transform.
Click Go. The transformed variables are added to the data set, identified
with the prefix "Log-" added to the name.
To give a more convenient name, if desired, select Edit and Rename with the
choice widget, and enter the new name in the field provided.
6. HOW TO TEST THE SIGNIFICANCE OF THE REGRESSION
*
*
*
*
The following procedure provides a valid time series implementation of the
"F test of the Regression" reported routinely by many packages. It tests all
exogenous regressors, but automatically excludes the trend, seasonal
dummies, and lagged dependent variables from the test set. Thus, the null
hypothesis can be a valid univariate representation of the dependent
variable.
In the Linear Regression dialog, check "Wald Test of Constraints".
Use the button beside the checkbox to open the Constraints dialog, and check
the box "Test Joint Significance of Regressors".
The test is computed by running the regression, or by choosing Actions /
Compute Test Statistics / Wald Test of Set Restrictions.
7. HOW TO TEST FOR A UNIT ROOT
*
*
*
*
Open the Setup / Compute Summary Statistics dialog.
Check the "Report I(0)/I(1) Tests" checkbox.
Choose the variable you want to test and press Go.
The Augmented Dickey-Fuller test and Phillips-Perron statistics are among
the results reported. The order of lags in the ADF test is chosen automatically
to optimize the Schwarz model selection criterion over the range up to M =
O(T^1/3). The bandwidth settings for the Phillips-Perron test can be changed
in Options / General...
8. HOW TO ESTIMATE AN ARMA(p,q) MODEL
*
Click the "Space Shuttle" button on the tool bar to open the Dynamic
Equation dialog. (If this is not shown, open Options / General, check
"Enable Optimization Estimators", and restart TSM.)
15
© James Davidson 2008
*
*
*
*
*
*
*
*
*
In the Select Estimator box, choose Least Squares.
Select your dependent variable from the list.
Use the scroll bars to select the desired AR and MA orders (p and q).
Select a Type 2 intercept (this is identified even if you have a unit root).
You cannot have both types at once, so deselect the Type 1 intercept
first, if necessary.
Press "Go", or the "Running Man" button.
If your run has been successful, you should see "Strong Convergence"
in the results window.
If you aren't sure what p and q to choose, you can have the program try
each pair in succession up to a chosen maximum. Click Setup / Multiple
ARMA Models... and select the maximum values you want to try.
Click the Running Man with this dialog open, and see the estimates
computed successively in the results window.
You can choose a preferred specification by comparing the Akaike,
Schwarz or Hannan-Quinn selection criteria for each model.
To estimate an ARIMA(p,1,q) model check the "Impose Unit
Root" box.
9. HOW TO FORECAST WITH AN ARMA/ARIMA MODEL
*
*
*
*
*
*
Having selected your model, choose Options / Forecasting..., and use the
scroll bar to select the number of post-sample periods to forecast. Note
that you cannot forecast beyond the end of the data set if your model
contains exogenous variables.
Select the options "Ex-ante Multi-Step" and "Analytic".
Now open the Options / Output and Retrieval dialog, and in the panel
Print in Results Window, check the option "Forecasts & MA Coeffs".
If the model has already been estimated, click the "Calculator" button on
the tool bar. This will evaluate the model and forecasts. Otherwise, click
"Running Man" to run the estimation and forecast calculation in one step.
To see the point forecasts and confidence intervals graphically, select
Graphics / Ex-Ante Forecasts.
The forecasts can also be exported to a spreadsheet file. Click File /
Listings / Save Forecasts.
10. HOW TO ESTIMATE A SIMPLE VAR MODEL
*
*
*
*
*
*
*
Open the Linear Regression dialog and check the box "System of
Equations". You are now allowed to select two or more dependent
variables.
In the Select Regressors panel, click on the Type 2 radio button. Make the
*same* selections as you made for the dependent variables.
Use the Lags scroll bar to choose the VAR order.
Select an intercept, if desired. Any exogenous variables can be added to
the model as regressors of Type 1.
Press "Go", or the "Running Man" or "Calculator" buttons to estimate the
model.
Note that when endogenous variables are entered as Type 2 Regressors,
the current values are automatically suppressed, making it easy to specify
lagged dependent variables.
A VAR or VARMA can also be estimated in the Dynamic Equation dialog.
16
© James Davidson 2008
11. HOW TO ESTIMATE A GARCH MODEL
*
*
*
*
*
*
*
*
Open the Dynamic Equations dialog.
Specify the 'mean equation' as appropriate. This could be an ARMA, or
a regression model, for example.
In the Select Estimator panel, choose Gaussian ML.
Click on Conditional Variance Model. The Conditional Variance dialog
box opens.
Select the GAR and GMA orders.
To see the model in the form usually reported (the 'Bollerslev form') open
the Options / ML and Dynamics dialog box and, under "GARCH Settings",
uncheck the first two checkboxes. (Note, the model you fit is identical in
either case. Only the interpretation of the coefficients is affected by these
options.)
Press the Go or Running Man buttons to estimate.
Estimation of GARCH models can sometimes be tricky. Poor starting values
can cause convergence failure. See Help / Hints and Tips for advice on
optimization in case of difficulty.
17
© James Davidson 2008
1. User Interface
1.1 The Menus
Clicking on most menu items opens a dialog in which program settings can be
changed. As many dialogs as desired can be open simultaneously.
*
The File menu controls loading and saving of settings, data and results.
*
The Setup menu controls basic operations such as choice of sample size,
data transformations, and storing and loading models. It contains dialogs
to control special estimation routines such as multiple ARMA models and
recursions, for preliminary data analyses including summary statistics,
nonparametric and log-periodogram regression, and cointegration tests.
Monte Carlo experiments are also launched from this menu.
*
The Model menu is where model specifications are set up.
*
The Values menu is for setting starting values and selecting options for model
parameters.
*
The Actions menu does things. Some of these menu items open dialogs, but
most perform actions directly.
*
The Graphics menu is to display graphs. An estimation must be run before the
equation graphics options are available.
*
The Options menu is to change program settings.
*
The Help menu gives access to the complete user's manual (also available in
PDF format) and the list of data names and descriptions, if these have been
created. It also contains commands to open the Registration dialog and
"About" window.
Notes:
1.
Close a dialog by clicking the "Close" button ([X]) on the menu bar.
2.
Positions on the screen of closed dialogs are remembered, even between
sessions. This allows the user to create a personalized work layout on the
desktop. Use the Reset Dialogs command to centre all dialog positions.
3.
Submenus and menu items are "greyed out" when the command is currently
unavailable. For example: a data file must be loaded before any action apart
from changing options is possible.
4.
Remember that to activate a model option (e.g. Conditional Variances,
Regime Switching) it must be selected in the Model / Dynamic Equation
dialog. Just setting the required options in the dialog does not do this!
5.
Values dialogs will not reflect a change in the model specification until either
18
© James Davidson 2008
the dialog is refreshed or the Values button pressed in the relevant dialog.
6.
If a dialog gets hidden behind others, bring it to the top by reselecting it from
the menu bar.
7.
Default settings (set with 'New' in File / Settings) are listed in Option /
General .
1.2 Status Bar and Tool Bar
The status bar at the bottom of the results window shows the name and path of the
currently open data file, the currently selected estimator, and the currently selected
sample. The symbol "(B)" also appears if bootstrap inference is selected, and the
symbol "(S)" if subsampling inference is selected
The tool bar buttons provide quick access to the most frequently used actions and
dialogs.
*
"Open Folder" button: shows the File / Data / Open dialog.
*
"f(x)" button: opens the Setup / Data Transformation and Editing dialog
*
"MM" button: opens the Setup / Model Manager dialog.
*
"Regression line" button: opens the Model / Linear Regression dialog.
*
"Space Shuttle" button (optional): opens the Model / Dynamic Equation
dialog
*
"Running Man" button (optional): normally, launches Actions / Run
Estimation. Also duplicates the function of the "Go" button in an open
dialog.
*
"Calculator" button: launches Actions / Evaluate at Current Values. This
is equivalent to Actions / Run Estimation in the case of linear regression.
*
"Chart" button: Dual action.
o
Displays the plot of the variable(s) selected in the variable list in
any dialog (first click the list).
o
Opens the Graphics / Show Data Graphic dialog if no variable list
has the focus.
*
"Double Chart" button: displays combined chart of actual and fitted values,
and residuals. Only available following an estimation run. Optionally, can
also show the actual-fitted scatter and residual histogram and kernel
density (see Options / Graphics).
*
"Dialog 1" and "Dialog 2" buttons: can be assigned by the user to open any
dialog lacking a dedicated toolbar button. To assign a button, simply open
the Options / General dialog, open the target dialog or command, and press
19
© James Davidson 2008
the assignment button. see Section 8.8 for details.
*
"Windows" button: Toggle action.
o
Restores dialogs in previous positions (duplicating Actions / Restore
Dialogs) if dialogs closed,
o
Closes all dialogs (duplicating Actions / Close All Dialogs) if dialogs
open.
*
"Stop" button: only displayed when an iterative calculation is in progress.
Pauses the calculation and opens a choice box, to Abort or Continue.
Notes:
1.
The "Space Shuttle" and "Running Man" buttons can be optionally omitted
from the button bar (deselect "Enable Optimization Estimators" in Options /
General). This option can be used to simplify the interface for classroom
use.
2.
When TSM is running, two "TSM" icons appear on the Windows task bar.
The icon enclosed in a white square represents Ox, running in a minimized
console window. Click it to view the window. The icon without the white
square represents the GUI "front end" running under the Java Runtime
Environment.
Note: if TSM is started by clicking on a settings file in Windows explorer,
the Windows “DOS box” icon appears instead of the first TSM icon.
3.
The "Windows" button remembers which dialogs were open between
sessions. Pressing it at start-up restores the window configuration existing
at a recent close-down. To avoid an excessive clutter of dialogs getting
re-opened the configuration is reset if the time lag between sessions
exceeds 11 hours.
4.
When lengthy computations such as optimizations, recursive estimations,
grid plots, and Monte Carlo experiments are running, a "Stop" button
appears on the tool bar. Clicking the button opens a choice box, with the
choice of aborting the run or continuing.
Note: there may be some delay before the box opens.
1.3 The Results Window
The text area is editable. Comments and aide-memoires can be typed in and saved
with the output.
Text can be highlighted with the mouse (hold down the mouse button and drag the
"I-beam" cursor) and then cut or copied to the Windows clipboard. Use the right
mouse button to open the context menu. The command File / Save Selected
Text allows highlighted text to be written to a named file.
The results for an estimation run are printed with a heading showing the version
number of the program, a run ID number incremented before each run, and the
date and time. The ID number is used to identify retrieved series, and also listings,
20
© James Davidson 2008
graphics and settings files optionally generated in the run. This makes it easy to
verify which piece of output goes with which run, at the end of a session. The
current ID is stored in the file settings.tsm. It is preserved when settings are
restored to defaults (File / Settings / New). It is reset to 0 only when settings.tsm
is deleted.
The text size can be changed from the default of 12-point in the Options / General
dialog. The window can be resized by dragging the corner with the mouse, and
also maximized to fill the screen. Dialogs are displayed on top of the window.
In maximized display mode, dialogs can conveniently be arranged on the
right-hand side of the screen, with the results printed on the left-hand side.
The command File / Load Text File allows the window to be used as a text
editor. To save text, highlight it and use the File / Save Selected Text command.
The main intended purpose of this feature is to allow a user's code to be
conveniently edited "on the fly", without needing to start up OxEdit. The
command File / Restart closes and restarts the program in exactly its previous
state, including window contents, allowing the amended code to be compiled.
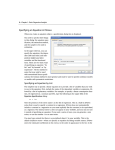
1.4 Dialogs
Dialogs are where most interactions between user and program take place.
They contain objects of the following kinds
Buttons:
Checkboxes:
Radio Buttons:
Choice Widgets:
Scrollbars:
Text fields:
Lists:
To initiate actions, including opening/closing other dialogs.
To turn program options on and off.
To choose from a set of mutually exclusive options.
To make a choice from a list of mutually exclusive options.
To input numerical values, usually integers, e.g. sample size.
To input strings of characters from the keyboard. These may
represent names to label the output, or real numerical values.
Columns of names, usually of data series, that can be selected
and deselected with the mouse.
Notes:
1.
In model specification dialogs, the choice of radio button may determine the
interpretation of list selections. The correct sequence of actions is:
*
Click the radio button to select the type of variable.
*
Click list items to select/deselect them.
To avoid unintended choices it is a good practice, before launching an
estimation run, to click each radio button in turn, and note which variables
are highlighted in the list for each case.
2.
Choice widgets are similar in function to radio buttons, convenient for
larger numbers of alternatives. The widget shows the current selection in
the window. Click the down-arrow to display the list, which can be
scrolled if necessary, then click the desired selection.
3.
Lists are equipped with vertical scroll bars when there are more items than
can be displayed at one time. Drag the bar to bring then into view.
21
© James Davidson 2008
Horizontal scrolling allows long names to be viewed. On occasion Java can
fail to display the scrollbars correctly. If this happens try closing and
re-opening the dialog, or just drag on the list to scroll it.
4.
In some cases (e.g. selecting the dependent variable) only one list selection
is allowed at a time. In others, multiple selections are allowed. Clicking a
name has a toggle action, select when unselected, deselect when selected.
In some dialogs, double-clicking a list item simultaneously selects the item
and launches the appropriate action on it, e.g. displaying a plot.
5.
To quickly select a block of adjacent names on a list, use 'drag-select'.
In other words: click the first name, then click the last name and drag
the mouse briefly with the button held down. The dragging action
highlights all the names between the two selected cases. Deselection of a
selected block works the same way - click the first highlighted name, then
'drag' the last highlighted name. A simple way to clear all the selections in
the list is to first drag-select the whole list, then drag-deselect it.
6.
The dialog object most recently clicked on is said to 'have the focus', and is
outlined by a broken rectangle. If the variable list of any open dialog has the
focus, clicking the "Chart" button on the toolbar displays the plot of the
highlighted variable(s).
Note: The current settings in the Graphics / Show Data Graphic... dialog
control what items are plotted.
7.
Options may be "greyed-out" (disabled) if they are not compatible with other
selected options. For example, GARCH and Markov switching options are
not available unless a maximum likelihood estimator is selected. In some
cases, a reminder message is displayed if an illegal selection is attempted.
8.
Make a selection with a horizontal scrollbar by dragging the slider, or by
clicking the arrow buttons at each end, for step-by-step selection. Some
scrollbars (e.g. for numbers of Monte Carlo replications) are incremented
in jumps (10s, 100s) depending on the range of the selection.
1.5 Entering Formulae
Algebraic formulae can be submitted to the program in three contexts.
A.
Data transformation
B.
Nonlinear parameter constraints
C.
Nonlinear equations for estimation or simulation (including equilibrium
relations, nonlinear MA terms and nonlinear ECMs)
Formulae are typed into a text box which is opened by the following commands:
Case A:
Setup / Data Transformation and Editing / Edit / Make Formula.
Case B:
Model / Constraints / Enter Code (select "Coded Restrictions")
Case C:
Model / Coded Function.
TYPING FORMULAE
The general syntax is of the form "name = formula",
22
© James Davidson 2008
Case A:
"name" is a new variable name
Case B:
"name" is an existing parameter name.
Case C, "Equation": "name" is optional (must match selected dependent
variable(s) in Dynamic Equation dialog).
Case C, "Residuals": Omit "name" and " = " (formula implicit).
A formula can be constructed from the following components depending
on the formula type, as indicated.
AC:
variables, by name or number (see Notes 1, 5) optionally followed
by an integer lag (negative) value or lead (positive) value, enclosed
in braces {}.
BC:
parameters, by name or number (see Notes 1, 6).
ABC:
real numeric constants, containing digits 0-9, optionally including a
decimal point (.) and optionally preceded by a minus sign (-).
ABC:
the operators + (add), - (subtract), * (multiply), / (divide),
^(raise to a power).
ABC:
parentheses (...) enclosing sub-formulae.
ABC:
the functions log( ), exp( ), cos( ), sin( ), abs( ), sqrt( ), int( ),
sgn( ), pos( ) and neg( ) where the parentheses can contain a
variable, parameter, constant or sub-formula.
ABC:
The names Pi, pi, PI and pI are reserved, and are replaced by
the constant 3.14159..., to machine accuracy.
Notes:
1.
The first character of a variable or parameter name MUST be a letter
(from the sets a-z, A-Z).
2.
The following characters can also appear in variable or parameter names:
!#$%&',0123456789:;<>?@\_~|
3.
Names are case-sensitive! E.g. 'Alpha', 'ALPHA' and 'alpha' are all
treated as different names.
4.
An alternative to typing a variable name in full is to type x[i] or X[i] where
"i" denotes the number of the variable in the data list. When the text field is
opened, variable numbers are appended in the appropriate data list , i.e.:
*
In case A, Setup / Data Transformation and Editing
*
In case C, Model / Dynamic Equation.
5.
An alternative to typing a parameter name in full is to type a[i] or p[i] or
A[i] or P[i] (all forms are equivalent) where "i" is the parameter number.
Parameter numbers are shown in the Values / Equation dialog(s).
6.
The characters +-*/^.()[]{} must NOT appear in names of variables or
parameters. Any other characters, in particular spaces, are ignored. Use
23
© James Davidson 2008
spaces optionally to improve readability.
WARNING: Variable names generated automatically in Setup
/ Data Transformation and Editing may contain illegal
characters!!
Rename such variables before including in a formula.
7.
The * sign to denote multiplication is mandatory. Omitting it will cause a
syntax error.
8.
Numeric constants can contain the symbols .0123456789
The symbol "." (decimal point) may appear ONLY as part of a numeric
constant. An isolated "." is parsed as the number 0.
9.
Constants are nonnegative. A leading "-" (minus) in any formula is parsed
as a unary operator, and changes the sign of the operand.
10.
Definitions of special functions:
sgn(x) = -1 if x < 0, 1 otherwise.
pos(x) = x if x > 0, 0 otherwise.
neg(x) = x if x < 0, 0 otherwise.
int(x) = integer nearest to x.
flr(x) = largest integer not exceeding x.
Indicators:
ips(x) = 1 if x > 0, 0 otherwise.
ing(x) = 1 if x < 0, 0 otherwise.
izo(x) = 1 if x = 0, 0 otherwise.
These functions are not differentiable, so may not be used in parameter
constraints. This results in a parsing error.
Also note:
pos(x - y) + y = max(x, y)
neg(x - y) + y = min(x, y)
x - y*flr(x/y) = x mod y (x,y integers)
1 - ips(y - x) = 1 if y <= x, 0 otherwise
etc, etc. Other uses include creating period dummies. If t is an integer,
dummy = neg(pos(Trend - t) - 1) + 1
= 0 up to date t, 1 from date t onwards.
11.
Reminder: the following uses are mandatory!
*
Parentheses ( ) for function arguments and sub-formulae;
*
Square brackets [ ] for parameter/variable numbers;
*
Braces { } for lags and leads.
12.
If the formula cannot be parsed (e.g. non-matching parentheses, missing
operators) an error message is printed and the calculations are terminated.
If an operation is illegal (e.g. square root of negative number) the output
of the formula will be NaN.
RESERVED NAMES
13.
The parameter names U#, u#, and N#, n# are reserved, and are treated
differently depending on the function call.
In estimation runs they are assigned the value 0. In simulation runs, and
24
© James Davidson 2008
data transformations, U# and u# are replaced by a uniform[0,1] random
drawing, and N# and n# are replaced by a standard normal random
drawing.
This feature is primarily to allow the generation of randomized models for
(e.g.) test power evaluation.
14.
The variable names E#{-j}, e#{-j}, where j represents a positive integer,
are reserved for use in recursive functions. They are replaced by the
function value itself lagged j periods. E# without a lag is replaced by 0.
In systems of equations, the names E#1{-j}, E#2{-j}, ..., denote the
values for each equation.
15
The variable names Z# and z# are reserved for used in nonlinear ECMs,
and are replaced by the values of the equilibrium relation. In models with
two or more equilibrium relations, use Z#1, Z#2, ..., to denote the values.
25
© James Davidson 2008
2. File
2.0 File: General Information
This menu gives access to submenus for:
Settings
>>
Save and load ".tsm" files.
Data
>>
Save and load data files, including empirical
distributions for test statistics.
Results
>>
Control the saving to a file of output from the results
window.
Listings
>>
Save items of output from estimation or simulation runs
to spreadsheet files.
Graphics
>>
Save a copy of the most recently displayed graphic.
Load Text File
Allows the results window to be used as a text editor. The
contents of the chosen file will be appended to the existing
window contents.
Save Selected Text
Allows any part of the text in the results window to be saved to
a file. Give this command after highlighting the desired text by
dragging with the mouse. The options presented are to append
the text to the current results file, and to write to (overwrite) a
new (existing) named file.
Restart
These options close the program, saving all settings and
(optionally) data, and immediately restart it. These are
convenient shortcuts for loading user's code. (Windows only!)
>>
Restart/Load User Code
A choicebox gives the options of loading the currently
specified user Ox code, and selecting a different code
file in the file dialog.
Restart/Load Text Input
A choicebox gives the option of selecting a text file
containing a set of TSM text commands, for loading as
program settings and/or model specifications.
Restart/Load Text Defaults
Loads default settings which (if different from the programmed
defaults) will be set with the File / Settings / Clear All
command, and also if the settings file is renewed.
Restart/ Simple Restart
The system is restarted without changing load options.
Quit
Closes the program. The prompts to save specification and
data before closing can be optionally switched off; go to
Options / General.
26
© James Davidson 2008
Notes:
1
Selected text can be cut, copied or deleted. After highlighting, click the right
mouse button and select from the context menu.
2.
The contents of the Windows clipboard can be pasted into the results window
at the cursor position. Right-click with the mouse, and select "Paste".
MRU LISTS
3.
Commands for loading, saving and exporting settings and data files open a
popup menu listing the most recently used (MRU) files. The leading item,
'File Dialog...', opens the operating system's file dialog for selecting other
files.
4.
If a list is empty, the popup menu is skipped and the file dialog opens
directly.
5.
The maximum number of files on the MRU lists is an installation option see Appendix B. The default setting is 5.
6.
MRU lists are stored in the settings file. When settings are loaded the
current lists are appended to the new ones, as space permits.
RESTART
7.
The Restart/Load User Code command causes the file "usercode.ox" to be
created if necessary, then edited to contain the line
#include "[chosen file]".
The chosen file must have extension '.ox'! If necessary, the executable Ox
file tsmod_run.ox is also edited to include and #define USER_CODE '
' #include "usercode.ox" ' compiler directives.
Note: Only one code file at a time can be compiled. Any other '#include...'
statements are deleted from usercode.ox. Other lines are
commented out.
8.
The Restart/Load Text Input command causes tsmod_run.ox to be edited
to include the directive '#define TEXT_INPUT ' and the statement
' Text_Input(){ #include "[chosen file]" } ', which include the contents
of the chosen text file as lines in the Text_Input function. After the restart,
these lines are deleted to restore tsmod_run.ox to its previous state.
9.
The Restart / Load Text Defaults option edits tsmod_run.ox with permanent
effect. To restore the standard default settings, edit the file and comment
out the '#define TEXT_DEFAULTS' line. The defaults file can also be
modified in a text editor. See the programming manual for information on
text commands.
10.
If the Restart command is given after editing the user's code, resulting in a
compilation error, the program will fail to restart. In this event, check the
console window for error messages. TSM can always be restarted using
the default shortcut if required. This shortcut uses the unchanged copy of
tsmod_run.ox in [TSM-HOME].
27
© James Davidson 2008
11.
Use 'Simple Restart' for option changes that require a restart, such as
hiding/showing advanced estimation features.
2.1 File / Settings
Settings files (extension ".tsm") save the current state of the program, including
optional program settings, model specifications, and parameter values. If the option
to save the specifications was selected when it was saved, loading a settings file
recreates the exact state of the program at that time, including operational settings,
model specifications and starting values. Otherwise, it restores the operational
settings only.
The file settings.tsm in the working directory is automatically loaded at start-up, if it
exists. It is saved (with the model specifications and starting values) before each
estimation call, and also at shutdown. The current state can be saved at any time in a
named settings file, and reloaded subsequently.
The available commands are
Open…
Loads settings from a selected file. Only files with extension
".tsm" can be opened.
Save
Saves settings to the default file, "settings.tsm".
Save As...
Saves settings to a named settings file. The extension ".tsm" is
added to the file name if not supplied.
Import Models...
Adds the model specifications stored in a named .tsm file
to the current settings. Existing models and options are not
changed.
Export...
Exports settings, listings and data to a .tsm file.
Settings as Text
>>
Display/Save Settings...
Writes all the non-default settings as text, in TSM script
format, either to the results window or to a file.
Save Current Model...
Writes the non-default specifications for the currently
loaded model to a file
Save System Defaults...
Writes the current system settings as text.
Clear
Replace all settings with defaults (see Options / General
Information and Defaults for a list.)
Notes:
1.
Settings are saved automatically to the default file "settings.tsm" before any
estimation run and at closedown. Therefore, there is normally no need to save
them manually, except to a different named file to store them for subsequent
reloading.
28
© James Davidson 2008
2.
In the Windows installation, TSM can be started by double-clicking on
a settings file. This loads the file in question, as if loaded by the "Open..."
command. Note that settings are saved to the default "settings.tsm" as usual.
Use "Save As..." to update a named file.
IMPORTING MODELS
3.
The "Import Models..." command can be used to combine models from
different files, and also to copy specifications to other installations without
affecting operational settings. The models' .tsd files (which can contain the
associated data sets, see Setup / Model Manager) should be located in the
Start-in or results directory of the installation, so that they can be read.
4.
Models cannot be imported from settings files that have been created with
the "Export..." command, nor from files that were created with the option
"Save Current Results with Settings" checked in Options / General. In this
case, load a settings file and save it without these options, before attempting
to import from it. Alternatively, save and load the model specifications in
text format, see 8 below.
EXPORTING SETTINGS
5.
6.
The "Export..." option allows model specifications to be distributed to other
users. This option has the following features:
*
All relevant information is saved in the .tsm file, including the current
data set(s), model listings (usually saved in separate .tsd files), and
supplied Ox code.
*
All local path information, including MRU lists, is omitted from the
file.
*
When the file is loaded, the stored data and listings files are
automatically saved in the local "Start-in" directory. In this way,
the local installation can exactly reproduce the set-up existing
on the machine where the 'export' file was created.
To be exported using "Export...", supplied Ox code must be contained
in one of the following locations:
1)
The standard file "usercode.ox" located in the Start-in directory;
2)
7.
The file named in a "#include" compiler directive in "usercode.ox".
In this case,
*
any executable code in "usercode.ox" itself is ignored.
*
only the first "#include" directive in "usercode.ox" is
recognised. Any additional inclusions are ignored.
Any text in the results window which is highlighted when the File / Export...
command is given is stored in the settings file, and written back to the
results window at start-up. This trick allows instructions and notes about
the contents of the exported file to be easily conveyed to recipients of the
file.
29
© James Davidson 2008
SETTINGS AS TEXT
8.
The "Display/Save Settings" command opens a choice box, with the options
of printing the text in the results window, and opening the file dialog for
saving the text. In the latter case, a ".txt" file extension is recommended.
See the programming manual for details of the scripting language.
9.
The "Save Current Model" command saves just the loaded model settings to
a file. To view these settings in TSM, store the model with the "Automatic
Descriptions" option checked, then click the "Model Description" button.
The main function of this command is to allow the settings to be imported
into another instance of TSM using "File / Restart / Load Text Input".
10.
The "Save System Defaults" command saves a file for loading at start-up.
This options allows the user to control the state of the program set by the
File / Settings / Clear All command, or renewing the settings file. Use the
File / Restart command to set up the system to read the designated file.
2.2 File / Data
Data can be read in one of seven formats, and saved in one of five formats. The
format is specified by the file extension.
".xls"
Excel Worksheet. The first row of the sheet must contain
variable names.
".csv"
Comma delimited text file. Format as for .xls.
".wk1", ".wks"
Lotus 123 worksheet. The first row of the sheet must
contain variable names.
".in7"
GiveWin file. See Ox and Givewin documentation for details.
".dht"
GAUSS data file. (Not available for saving.)
".dta"
STATA (Versions 4-6) data file. (Not available for saving.)
".dat"
Ox/Givewin "data with load information" file. See the
documentation for details.
".mat", or any other. ASCII file containing a matrix, with variables in columns
and observations in rows. The first line of the file must contain
two integers, number of rows followed by number of columns.
In this case the variable names assigned are "Var1", "Var2",
etc. These can be changed in the Data Transformation and
Editing dialog.
The available commands are
Recent
Submenu to select one of the five most recently selected files.
Any data currently in memory are over-written.
Open…
Opens the operating system's file dialog, for opening. Any data
30
© James Davidson 2008
currently in memory are over-written.
Merge…
Merges new file with data already loaded. After selecting the
file, a dialog is presented to enter the 'row offset'; that is, the relative
position in the current file of the first observation of the new file. The
offset is:
>
zero if start dates match,
>
positive if start date of new series is later, or
>
negative if start date of new series is earlier.
Close the dialog either by pressing "Return" or clicking the Close
symbol on the menu bar.
Save
Saves data under the name specified in the last Open or Save As
command.
Save As…
Opens the operating system's file dialog, for saving. The type of file
saved (options are Excel, Lotus123, GiveWin, ASCII with load
information, or matrix file), is determined either by the extension or, if
no extension is added, by the current selection in Options / Output and
Retrieval Options.
Clear
Clears the current data set.
Tabulations / Load EDF File
Loads a previously prepared spreadsheet file containing an empirical
distribution function. This can be displayed in Setup / Look Up
Probability and Setup / Look Up Critical Value, and used by the
program to generate test p-values. Files with the correct format are
generated by the Monte Carlo module, see Setup / Monte Carlo
Experiment.
Tabulations / Merge EDF File
Combines selected file with the resident EDF file. When combining
tabulations for different sample sizes, the names and specifications for
the two tests must be identical.
Tabulations / Clear EDF Table
Removes table from memory. The table is saved with model listings,
('.tsd' files) so use this command before storing a model to avoid
bulky files .
Tabulation / Load Density Plot
Loads a previously saved spreadsheet file containing data for
generating density plots in the dialog Graphics / Stored MC
Distributions. The file contents are merged with any existing plot data.
If a loaded plot has an existing name, the name is augmented with
"(1)".
Notes:
1.
Excel (.xls) spreadsheet files are (since version 4.12) the default data format
for TSM, being a common standard that can handle missing values properly.
31
© James Davidson 2008
Data can always be read in this format, and exported to a different format for
editing in an application other than Microsoft Excel, if desired.
2.
Data files may be loaded by the program automatically, as when a settings
file or a stored model is loaded. If the file in question is not found on the
stored path, other paths known to the program are searched, in the
following order: the path to the current settings file; the current data folder;
the current results folder; and the start-in folder. Messages are printed
to show that this has occurred, or if the file is not found anywhere. This
feature makes it possible to transfer a settings file to another system on
which the stored paths are inappropriate. However, since the file found
might not be the one intended, it is important to check the program
messages.
3.
If data are saved in .MAT format, the variable names are listed in the results
window.
4.
Ox cannot read or save a data file containing only zeros! See the caveats on
artificial data creation using 'Extend Sample' in Setup / Data Transformation
and Editing.
5.
When the Clear command is given, all menu items and toolbar buttons that
operate on data are disabled. The purpose of this command is to allow
new data to be created or entered in the Setup / Data Transformation and
Editing dialog.
6.
The name of a variable, which for convenience should not exceed about 20
characters, can be extended by a longer description. When preparing the data
file (e.g. in Excel) optionally divide the name field by the symbol @. All
characters following the @ form the description. Descriptions can be viewed
by the command Help / Data Descriptions, and edited in Setup / Data
Transformations and Editing, see 'Descriptions'. The divider character can
be changed during installation, by editing the file tsmgui4.h and setting the
function Get_NameCharacter().
MISSING OBSERVATIONS
7.
The input file may have missing observations (e.g. blank cells in an Excel file)
and these are replaced in the data matrix by NaN (= Not a Number). If the
variable in question is included in a model, the sample period is automatically
truncated, as necessary, to exclude NaN observations.
PERIODIC OBSERVATIONS AND DATES
8.
If provided, date information (years, quarters, months etc.) is used to label
graphs and printouts, and is presented in the Setup / Set Sample dialog for
selecting the sample.
9.
A data file created with GiveWin will contain the date information. If using
Excel or other program to create the data file, the date information can be
included in the following way. Create a variable with the name
!STARTDATE! This must have entries in the first three positions, as follows:
1.
The year of the first observation
32
© James Davidson 2008
2.
The period (quarter/month/week/weekday/day) of the first
observation
3.
The frequency: one of
2 (half-years)
4 (quarters)
12 (months)
52 (weeks)
260 (weekdays)
365 (days).
The rest of the column can contain anything, or be blank.
This item is removed after being read, so it will not appear in the variable list.
If you now save the data file, it will contain the date information in Ox
format - the first column of the file will contain the dates in the format
"year - period". This column will be used to create date information next time
the file is loaded.
10.
If files are merged, the date information of the first-loaded file is used unless
the merged file contains a !STARTDATE! column, in which case this
information is used to date the combined observations. However, GiveWin
date information in the merged file is ignored.
11.
The periods must have equal length (e.g. no missing holidays, or leap years,
in daily data). Otherwise, the data must be treated as undated. However,
ignoring these irregularities may be permissible for labelling graphs.
DATED OBSERVATIONS
12.
To set individual daily dates, create the data set in Microsoft Excel. Enter the
dates in column A of the file in Excel date format (yyyy-mm-dd). If present,
these dates will be used by TSM to label the observations. This is the preferred
method of dating weekly and daily data, since the irregularities noted in 11 are
taken care of.
Note: You must use Excel or equivalent software to create the dates. This
cannot be done in TSM.
13.
If dated files are merged in TSM, the dating information in both files is
ignored. Use Excel or equivalent software to perform merging operations
before loading.
14.
Dating information is used automatically if it is present. To over-ride this
behaviour and set periodic dates in the default manner, use the "Set Dates"
command in Setup / Date Transformation and Editing (Edit). In this case,
the existing date information is deleted.
15.
When dated observations are saved in Excel format, column A of the
spreadsheet contains the usual Ox default dating information. The column of
dates is created as column B, with the heading Date in row 1. The first column
is ignored when TSM reloads the file, and can be deleted from the spreadsheet
if desired.
33
© James Davidson 2008
2.3 File / Results
Results and information appear in the program's text window.
The output can be saved to disk files in two ways.
1.
Select part or all of the window's contents, using the mouse, and append these
lines to a designated file.
2.
Have all the output saved automatically to a file, in the background.
Both methods can be used at the same time, if desired.
The available commands are
* Enable Background Saving
Switches on Background Save mode
* Disable Background Saving
Switches off Background Save mode.
* New Results File…
Opens the file selection dialog. Choice can be an
existing text file, or a new one.
* Locate Results Folder/File.
Show/change the current path to the folder
for results and graphics. Optionally,
show/change the results file name.
Notes:
1.
Results are always appended to a file. To start a new file, choose a new name,
or delete the existing file first.
2.
The default results file is "tsmresults.txt", in the working directory. This will
be created automatically if it does not exist. There is no default name for
selections. You are prompted for a file name if one is not currently specified.
If background saving is enabled, the New Results File command designates a
new file for background saving. If background saving is disabled, the chosen
file will be used for selected text.
3.
If the directory for a new results file is different from the current working
directory, the working directory is changed accordingly. Listings files and
graphics will be saved thereafter to the same location. However, the settings
file must always reside in the "Start in" directory, so it can be found at launch.
4.
To guard against attempting to append text to an existing binary file, results
files must have extension ".txt". This is appended to the chosen name if it is
not present.
5.
Yet another way to save results is to use the Windows clipboard. Just highlight
the desired text in the results window, Copy (right-click for the context menu),
and Paste into your favourite text editor.
6.
The 'Locate Results Folder/File' command displays a text field containing the
current path to the results folder. This can be edited to change the folder. If
the new path does not point to an existing folder, the change is ignored.
NOTE: if no path is displayed, this means that the results folder is the same as
the "Start-in" folder, the default.
34
© James Davidson 2008
7.
Pressing the "Locate Results File" button displays both the path and the name
of the current results file. The text can be edited to set a new results file
and/or path. This is an alternative to giving the "new Results File..."
command to open the file dialog.
8.
Either method of changing the results file also changes the results folder to the
one containing the file. Graphics are always saved in the current results folder.
The 'Start-in' folder is used as the results folder by default, but note that the
current path is saved between sessions in "settings.tsm".
2.4 File / Listings
This command saves different types of estimation outputs in tabular form:
*
Series: (Actuals, Fitted Values, Residuals, Conditional Variances, Regime
Probabilities)
*
Correlograms and Q Statistics for Residuals and Squared Residuals
*
Solved moving average coefficients
*
Forecasts
*
Recursive estimation outputs
*
Recursive forecasts
*
Criterion plots
Notes:
1.
Only results for the most recent estimation run can be saved. Be sure to save
desired outputs before launching another run.
2.
Files are named uniquely with a descriptive title and the run ID number. They
are saved to the currently selected results folder.
3.
Available file formats are the same as for data, and are selected in When
saving in ".MAT" format, the columns headings are listed in the results
window.
4.
There is an option to save all listings automatically, see Options \ Output and
Retrieval.
2.5 File / Graphics
Saves the most recently displayed graphic to a file.
Notes:
1.
File types and bitmap dimensions (.PNG files) are selected in Options /
Graphics.
2.
There is an option to save all graphics automatically as they are displayed;
see Options / Graphics.
35
© James Davidson 2008
3. Setup
3.1 Setup / Set Sample
Select the sample for estimation and other data analysis procedures using the
scrollbars. Date information is given if provided with the data. The maximum
sample is selected by default.
Notes:
1.
The sample is automatically truncated to exclude missing values of any
variable in the model specified. Remember that missing values are created
by taking lags, leads and differences.
2.
The sample count is initialized at the first line of the data file, not the first
available (non-missing) observation.
3.
The "All Available Observations" button is useful to check for missing
observations. The largest sample available for all the variables in the
currently specified model is selected. The actual sample used for
estimation is in any case restricted to this set.
4.
This dialog can also be accessed from within other dialogs controlling
functions where a sample must be specified. Five different sample
selections can be set concurrently, for different program functions.
The sample set depends on where the dialog is opened from. The
locations are
Setup / Recursive/Rolling Estimation .
.
.
Sample 1
Setup / Summary Statistics .
.
.
.
Sample 2
Setup / Nonparametric Regression .
.
.
Sample 3
Setup / Semiparametric Long Memory
.
.
Sample 3
Setup / Cointegration Analysis
.
.
.
Sample 4
Model / Linear Regression .
.
.
.
Sample 1
Model / Dynamic Equation .
.
.
.
Sample 1
Graphics / Show Data Graphic
.
.
.
Sample 5
The function of the dialog when opened from the menu bar depends
on which dialog is currently open. By default, it sets Sample 1.
5.
Sample selections 1, 3 and 4 are stored as part of a model, and
retrieved by reloading the model. Selections 2 and 5 are saved with
general program settings.
6.
Click the "Simulate" button if the sample is being set for a simulation
run, not for estimation. In this case, the "Available Sample" to be
checked corresponds to included regressors only, ignoring the
'dependent' variable to be simulated.
*
The button is highlighted when the option is selected. Cancel
it by clicking again, or by closing the dialog.
*
The button is disabled unless the dialog is opened from either
the menu bar or one of the Model dialogs.
36
© James Davidson 2008
3.2 Setup / Data Transformations and Editing
In this dialog, data series can be edited, renamed, deleted, and created through
as dummies or by transformations of existing variables. The data can be
rearranged, sorted, reversed and and written to new files. The commands
are arranged under the two headings, editing and transformation.
*
Press either "Edit" or "Transform" buttons to bring up the desired list of
choices.
*
Use the choice widget to choose the desired operation or transformation.
Scroll down to see the full list of options (for details see below).
*
To execute an edit command or transformation, either highlight one or more
variables in the list and press 'Go', or just double-click a variable.
*
To mark a variable, highlight it on the list, and press "Mark". To remove
the mark, press "Mark" with no variable highlighted.
*
If changes are made, the "Save Modified Data" button is enabled. Use this
to open the choice box for for saving, either to the original file or as a new
file.
EDIT COMMANDS
Note: commands marked with * do not operate on individual variables.
Simply press 'Go' to execute. Any highlights in the variable list are ignored
in these cases.
"List/Edit/Compare"
Opens a new dialog with a listing of the highlighted series, with observation
numbers/dates.
*
Use the 'Mark' button to compare two series. If this command is
given for a variable while another is marked, the two series are listed
side by side.
*
To edit an observation, either double-click it, or highlight and press
'Edit Observation'. The existing value appears highlighted in the Edit
field. Type the new value, then press
o
'Enter' (or the [Enter] key) to save the new value, move the
highlight to the next observation, and load this for editing.
o
'Copy' to save the new value, move the highlight to the next
observation, but retain the new value in the Edit field.
o
'Cancel' to discard the new value.
Press Close, or the [X] button, to close the editing dialog, or,
Press >>>>> or <<<<< to list the next/previous series in the data set.
Notes:
1.
Use the copy button to repeatedly copy the same value to successive
observations for (e.g.) easy creation of dummies for sub-periods.
2.
The marked (right-hand) series cannot be edited.
3.
CAUTION: editing cannot be undone.
37
© James Davidson 2008
"Rename"
After selecting a variable and pressing 'Go', a text field appears for typing the
new name. The dialog is frozen until 'OK' or the [Enter] key is pressed to
complete the entry. If multiple variables are highlighted, each is presented for
renaming in turn.
"Delete"
A confirmation box appears. Press the 'All Selected' button to delete all
highlighted variables at once, otherwise each is presented in turn for
confirmation.
CAUTION! This command cannot be undone.
"Description"
Allows the optional description(s) of the variable(s) to be created or edited.
View these descriptions in Help / Data Descriptions.
"Set Dates" *
Allows the dates of observations to be set or changed. This works exactly like
the method for inserting date information into a data file prior to loading;
see File / Data. for details. A new column of the data set is created with name
!STARTDATE!, and opened for editing. Enter the initial year in the first row,
the initial sub-period in the second row, and the sub-period frequency in the
third row. Enter 2 for half-years, 4 for quarters, 12 for months, etc.
Notes:
1.
The new column is deleted immediately after the new information is
processed.
2.
The date information is saved with the data in GiveWin or other
spreadsheet formats, and also in ".dat" files, although not in matrix
(.mat) files.
3.
CAUTION! This operation is not reversible. If the observations
are already dated, the existing date information will be lost, including
individual daily dates.
4.
If the period is set to 0, the series is treated as undated. Observations
are numbered from 1.
"Save Selected"
Allows a subset of the variables to be saved in a new named file. Highlight
any number of variables in the list before giving the command. This opens
the file dialog for saving, provide a new name and type for the file. The
existing data set is unaffected.
"Make Formula" *
Allows any algebraic function of variables to be computed as a new variable.
Pressing Go opens the text entry field. For information on typing formulae, see
Section 1.5, 'Entering Formulae'.
TEXT BOX CONTROLS
"Cancel"
Closes the text box, discarding changes. No variable created.
"Delete"
Deletes the currently displayed formula, clears field.
"Next"
Displays the next formula, if it exists.
"New"
Opens a new blank formula where there is no "Next".
"Previous"
displays the previous formula, if it exists.
38
© James Davidson 2008
"OK"
Closes the text box and creates the new variable
[Return]
Equivalent to pressing "OK".
Closing the text box with the Windows Close button [x] is equivalent to
pressing "Cancel".
Note: To evaluate a recursive formula use E#{-j}, where j is a positive
integer, to denote the function value lagged j periods.
"Make Seasonals" *
For frequency N, create N dummy variables with every Nth observation
= 1, otherwise 0. Set N = 4 for quarterly data, N = 12 for monthly, etc.
"Move Up", "Move Down"
Use these commands to re-order the variables in the data set. Pressing "Go"
repeatedly will move a single highlighted variable up or down as many
positions as required. Alternatively, move a block of highlighted variables
with a single command, but in this case the highlighting is cleared for all but
the last.
"Resize Sample" *
Use this command to create additional space for data to be entered by hand,
or created by simulation. Type the desired number of observations into the
text box provided.
*
If this number is less that the number of observations already existing,
the sample is trimmed to the specified length.
CAUTION: Excess observations are deleted, this operation is not
reversible.
*
If the number is greater than the current length, existing series are
extended with NaN values. A new variable "Zeros" is created
automatically with the full number of observations, with value 0.
Notes:
1.
Use Zeros as the dependent variable when specifying a model for
simulation, renamed as required.
2.
If the data set is initially empty when this command is given (give the
command File / Data / Clear to clear the current set) the new data
set receives the associated file name 'newdata.xls'.
"Set Sample Start" *
Trims the number of observations specified from the start of the sample.
When lags are created, additional rows are added to hold the "pre-sample"
observations with other variables set to NaN. This command can be used to
remove these extra rows if desired.
CAUTION: this operation is not reversible.
"Delete Selected Rows"
This command deletes complete rows from the data matrix for which the
the selected variable equals the constant entered in the box. The constant
value can be .NaN, to delete all rows where the selected variable is missing.
E.g., to extract the observations for a particular quarter from a quarterly
data set, create seasonal dummies and delete the cases where the dummy
for the chosen quarter is 0.
CAUTION: this operation is not reversible. Be careful to save the
39
© James Davidson 2008
reduced data set under a new name!
"Make Zeros", "Make Intercept", "Make Trend" *
These commands create dummy variables. Intercept has values 1, Trend
has values 1,2,3,...,T for a sample of T observations.
Notes:
1.
To create an event dummy, first create Zeros, then edit it observation
by observation in List/Edit/Compare.
2.
Use the built-in intercept and trend dummies for estimation wherever
possible.
"Make Normal(0,1)", "Make Student t(df)" *
Uses the built-in random number generator to create series of independent
observations with the specified distribution.
"Make PDL"
Creates polynomial distributed lag variates (see main document for details)
for highlighted variable(s), with lag length specified by the scroll bar. Five
new variables are created, corresponding to terms of order 0 up to 4 in the
lag polynomial. Delete any unneeded cases.
"Reverse Data" *
Operates on the whole data set, listing the observations in reverse order.
"Sort Data By" *
Operates on the whole data set, sorting the observations according to the
ascending order of the highlighted variable. Don't select more than one If two or more are selected, only the last choice is effective.
"Undo Sort" *
Reverses the action of the Reverse Data and Sort Data By commands,
restoring the data set to its original order.
"Shape" *
Re-assembles, by rows, a data series of length T into c columns of length
ceil(T/c), where c > 1 is selectable. In case T is not divisible by c, the
columns are padded to equal length with zeros, and then with NaNs to fill
the rest of the data matrix.
Uses for Shape include the following:
1
Separate the real and imaginary components of a discrete Fourier
transform. Set c = 2.
Note: the jth periodogram point, for j = 1,..., [T/2], is the
sum of squares of the jth row elements of these columns.
2.
Separate seasonal data into its seasonal components. For example,
with quarterly data, set c = 4. If the first observation is from Quarter
1, then the first column created will contain the Quarter 1
observations, the second column the Quarter 2 observations,
and so on.
TRANSFORM COMMANDS
*
Most commands in this menu can also be executed using the Edit / Make
40
© James Davidson 2008
*
*
*
*
*
Formula command. Here, they can be perfomed with a single click on
any number of highlighted variables.
Created series is/are added to the end of the list, with a self-explanatory
prefix or suffix appended to the name(s). Use Edit / Rename to change
the automatically created name, if desired. Use Edit / Delete to remove
any unwanted series.
Xt, t = 1,...,T denotes a highlighted variable in the data set.
Mt, t = 1,...,T denotes the 'marked' variable, if any.
j represents the scrollbar setting for leads/lags/differences.
C, d, E represent values entered in the text field.
"Lag"
.
.
"Lead"
.
"Difference" .
.
"Log-Difference"
.
"% Difference"
"Fractional Difference"
.
.
.
.
.
.
"Cumulate" .
.
.
"Logarithm" .
.
.
"Exponential".
.
.
"Logistic"
.
.
.
"Log-Odds" .
.
.
"Square"
.
.
.
"Square Root"
.
"Reciprocal" .
.
.
"Power"
.
.
.
"Sine" .
.
.
.
"Cosine"
.
.
.
"Absolute Value"
.
.
"Max(X,C) (C#Marked)"
.
"Min(X,C) (C#Marked)"
.
"Sign"
.
.
.
"Add C (C#Marked)".
.
"Subtract C (C#Marked)" .
"Multiply by C (C#Marked)"
"Divide by C (C#Marked)" .
"Centre (Mean-Devs)"
.
"Standardize" .
.
.
"Detrend"
.
.
.
"Fourier Transform" .
.
Xt-j
Xt+j
Xt - Xt-j
log(Xt) - log(Xt-j)
100.(Xt - Xt-J)/Xt-j
Sum{i=0,...,t-1}Bi*Xt-i, where Bi =
Gamma(i-d)/(Gamma(d).Gamma(i+1))
Sum{j=0,...,t-1}Xt-j
log(Xt)
exp(Xt)
exp(Xt)/(1 + exp(Xt))
log(Xt/(C - Xt)) (C = 1 or 100)
Xt^2
Xt^(1/2)
1/Xt
X^E (E an integer), |Xt|^E (otherwise)
sin(Pi*C*Xt)
cos(Pi*C*Xt)
|Xt|
max(Xt, C) (max(Xt, C*Mt))
min(Xt, C) (min(Xt, C*Mt))
+1 if Xt >= 0, -1 otherwise
Xt + C (Xt + C*Mt)
Xt - C (Xt - C*Mt)
Xt*C (Xt*C*Mt)
Xt/C (Xt/(C*Mt))
Xt - Mean(X)
(Xt - Mean(X))/SD(X)
Xt - a - b*t (by regression).
See 5. below.
Additional Notes:
1.
When leads, lags are created, the sample selected for estimation will
be truncated accordingly. The excess observations are not discarded,
however. The end (start) of the data matrix is extended with missing
observations represented by NaN.
2.
NaN is returned in the case of illegal values (e.g., negative arguments
of log(.) and (.)^(1/2), x < 0 and x > C in log-odds.)
41
© James Davidson 2008
3.
The 'Power' transformation returns the power of the absolute value for
noninteger exponents. The square root transformation is an alternative
way to take the power of 1/2, but behaves differently, assigning NaN
to negative observations.
4.
The symbols # and % are used in the new variable names to denote
multiplication and division in variable names. The more logical choices
'*' and '/' cannot be used in file names.
5.
"Fourier Transform" computes the FFT of the selected series. The real
and imaginary parts of the transform are vectorized to give a real series
of the same length of the original, with cosine and sine terms alternating.
The components can be separated again if required, using Edit / Shape.
Note: The series as generated are of length 2T, and are trimmed to fit
the existing data set. To avoid losing these points, first extend
the data set using Edit / Re-Size Sample.
3.3 Setup / Model Manager
A "model" is the complete set of specifications, values and results from estimation
or simulation of an equation or system of equations. At any time, the program holds
in memory the specifications that the user has selected, and either starting values
entered, or estimated values following an estimation run. This dialog allows
model specifications and results to be stored under identifying titles, and
subsequently recalled. Material stored includes parameter estimates with information
on restrictions or bounds, estimation and testing options, generated series, forecasts,
recursive estimates and criterion plots. The latter series can be used to produce
additional plots and test statistics without re-running the estimation. Stored models
are also used to set up Monte Carlo experiments.
"Load Model"
Loads the model whose title is highlighted in the list.
"Store Current Model"
Opens a text field for the entry of a model title.
To complete the entry and store the model, either
press Return or click the "OK" button, otherwise
click "Cancel" .
"Model Description"
Opens a text box where details of the highlighted model
can be entered by the user for later reference. Click the
button again to close the box.
"Move Up"/"Move Down" Use these buttons to arrange the order of the models
in the list.
"Delete a Model"
Opens a confirmation box, and removes the model
whose title is currently highlighted in the list if the
action is confirmed.
"Clear All Models"
Opens a confirmation box, and removes all models
in the list if the action is confirmed.
42
© James Davidson 2008
STORING MODELS
1.
By default, the model title "Run ###" is displayed in the text box, where ###
denotes the current run ID number. The entry can then be edited as desired.
If an existing title is first highlighted, this name appears in the text box. If
"OK" is pressed without changing it, the current specifications overwrite the
ones stored under that title. This option allows a stored model to be modified
or updated. Rename a model by loading it, saving it under the new title, and
then deleting the original copy.
2.
The Store command places the model specifications in a memory buffer, but
does not save them to disk. Give the command File / Settings / Save or Save
As... to save them permanently in a .tsm file. When a settings file is reloaded,
the stored models it contains will be accessible as before.
3.
The least squares and IV estimation options have different actions,
depending on whether estimation is launched from the Linear Regression
dialog, or the Dynamic Equation dialog. In the latter case, estimation is
done numerically. To make sure the desired estimator is recorded as part
of the stored model, have the appropriate dialog open when the "Store"
command is given.
4.
There is an option to store the estimated model automatically following a
successful estimation run - see Options / General. Note that a maximum of
50 models can be stored. To store additional models, save the settings in a
named .tsm file, see File / Save As...
5.
In addition to parameter values, results and listings associated with a model
are stored in a file with the name of the model and the suffix ".tsd". These
files are not intended to be read or manipulated outside TSM. To save
results to spreadsheet files, use the commands under File / Listings. However,
note that the latter data cannot be read back into the program for purposes
such as graphing, or calculating tests.
6.
If the Store Current Model command is given following a Monte Carlo
experiment, the replications or frequency tables (whichever have been
specified) are stored in the ".tsd" file under the given model title.
7.
If the "Store Data with Model" box is checked, a copy of the data set is
saved in the ".tsd" file. This will be loaded automatically when the model
is re-loaded. If this box is not checked, you are prompted to save the
current data file if it has been edited, and the file with this name is reloaded
with the model - however, there is no protection against it being altered in
the interim, in this case.
8.
If "Store Results with Model" is checked, the text of the last-run estimation
output is stored as a string. When the model is re-loaded, the next tile Actions
/ Evaluate at Current Values is chosen (or "Calculator" button pressed) causes
a choice box appears, presenting the option of re-displaying the results.
9.
If the "Save as Generic Model" checkbox is checked, the data file is not
43
© James Davidson 2008
reloaded with the model, which is the default action. This setting is
appropriate for models intended to be adapted to different data sets.
For example, such a model may specify inputs for a user-coded estimate
or test.
Note: If this option is selected, the "Store Data with Model" and "Store
Results with Model" options are disabled.
10.
Stored models include the current settings for the Semiparametric Long
Memory and Cointegration Analysis dialogs. Different settings for these
modules can therefore be stored and recalled in the same way as for
the main equation specifications.
LOADING MODELS
11.
Loading a model overwrites the current settings. Store these first, if they will
be needed subsequently.
12.
See 8 above: press the "Evaluate" button to re-display the estimation output,
if this has been saved with the model. This saves time if re-evaluating the
results would be time-consuming, as when output of bootstrap inference is
selected.
13.
The data file specified in the model will be reloaded automatically, provided it
has not been deleted or moved. It can have been edited, or had series added
to it, but any variables that appear in the model must of course be present in
the file, otherwise an error occurs. It is the user's responsibility to ensure this,
and the safest way is to check the "Store Data with Model" box so that a
dedicated copy of the data is saved.
DEFAULTS
14.
When program settings are cleared and restored to defaults, a model called
"Defaults" is created automatically. It is recommended to set up your preferred
options for routine operations, and use Defaults to store these settings. They
can then be easily restored, by loading this model.
MODEL DESCRIPTIONS
15.
When the descriptions box is open, other dialog functions are disabled.
However, the description displayed can be changed by selecting a different
model from the list. Use the PgUp and PgDn keys to scan rapidly through
the list.
16.
If the "Automatic Descriptions" checkbox is checked, non-default model
settings are written to the descriptions box automatically when the model is
stored. These are coded in the scripting language detailed in the programming
manual. This provides a convenient way to check that the model specification
is as intended.
Note: If either the Semiparametric Long Memory or the Cointegration
Analysis dialogs are open when the Store command is given, the
settings written relate to those modules; otherwise, the usual model
settings are written.
17.
If the "Print Descriptions" checkbox is checked, the model description, if any,
44
© James Davidson 2008
is written to the results windows when the model is loaded.
DELETING MODELS
18.
When a model is deleted, the associated ".tsd" file is deleted from the disk.
Also note that these files are overwritten when a new model is stored with
the same name.
19.
There is an option to remove all the ".tsd" files automatically at shutdown.
Their contents, except for Monte Carlo results, can be regenerated by running
the command Evaluate at Current Values with appropriate options set.
3.4 Setup / Automatic Model Selection
Two options for estimating a sequence of models automatically are controlled
from this dialog. Note that they cannot be run simultaneously.
AUTOMATIC REGRESSOR SELECTION
When this option is selected in the Actions menu, or by pressing the "Run
Regressor Selection" button, the program chooses the set of regressors to
optimize the chosen model selection criterion, out of the specified regressors
in a baseline model. The option is described in detail in 6.4 Actions /
Automatic Regressor Selection. Use the checkboxes in this dialog to choose
which regressor 'Types' are to be included in the initial set to search over.
For example, select 'focus' variables (to be included in every specification)
as Type 1 regressors, and 'nuisance' variables, whose inclusion is optional,
as Type 2 regressors. To conduct the search over the latter set only, uncheck
the box "Include Type 1 Regressors" and check the box "Include Type 2
Regressors".
Notes.
1.
To set the selection criterion (one of Akaike, Schwarz and Hannan-Quinn)
open Options / Tests and Diagnostics, and select the radio button under
"Model Selection Criterion".
(This setting is also used for choosing lag lengths in ADF cointegration tests
and Saikkonen-Stock-Watson efficient estimation.)
2.
Tip: to make the lags of a focus (Type 1) variable optional, set Type 1 lags
to 0, and then create the one-period lag in Setup / Data Transformation and
Editing. Include this variable as a Type 2 with Lags set to the desired
maximum.
3.
A confirmation box opens to guard against accidental launches. This reminds
you what selection criterion is currently chosen.
MULTIPLE ARMA MODELS
When this option is selected in the Actions menu, or by pressing the "Run
Multiple ARMA" button, the program automatically estimates all the ARMA(p,q)
or ARFIMA(p,d,q) specifications, for all values of p and q in the indicated
ranges.
45
© James Davidson 2008
*
Enter max p, max q and max p+q in the text fields provided. With the default
settings (all entries = 2) the program estimates the following cases of (p,q), in
the order shown: (0,0), (1,0), (2,0), (0,1), (1,1), (0,2).
*
A confirmation box appears to guard against accidental launches.
*
See Actions / Estimate Multiple ARMA Models for additional details.
3.5 Setup / Recursive/Rolling Estimation
This dialog sets up the options for recursive estimation. For details on the output
produced by this option, see Contents / Actions Menu / Recursive/Rolling
Estimation.
*
Choose rolling estimation (fixed sample size) or incremental estimation
(extending sample size) with the radio buttons.
*
Set the initial sample in the usual way as the usual estimation sample. Access
the Set Sample dialog either using the button provided, or in Setup / Set
Sample, or a model dialog.
*
'Step size' is the number of extra observations added at each step. Set by
dragging the scrollbar. Setting this equal to 1 may be excessively slow to
execute. If it is set greater than 1, the sequences of estimates are plotted
as step functions.
*
The terminal observation required will in most cases be the maximum
available. This scrollbar allows it to be set smaller. Note that the lower limit
is constrained by the initial sample and step size settings.
*
The first check box allows the option of saving regression diagnostics and
test statistics to be selected. This is on by default.
*
The second check box allows saving to a file of all the forecasts for each
estimation period.
NOTE: The forecasts, other than the N-step-ahead, cannot be displayed
interactively.
*
The 'Go' button duplicates the Actions Recursive/ Rolling estimation button.
If this dialog is open, the "Run" button on the toolbar is a third way to
launch the run. A confirmation box opens to guard against accidental
launches.
*
By default the number of forecast steps (N) is fixed, and the N-step
forecast is reported for each recursion step. If the second check box is
checked, the terminal forecast date is fixed, so that N contracts as the
end of the sample advances. This option can be used to compare the
forecasts of a particular date from different standpoints.
46
© James Davidson 2008
3.6 Setup / Compute Summary Statistics
This dialog presents the variable list. Select a variable and press 'Go' to print a
table of summary statistics. Alternatively, just double-click the variable.
Optionally, the following tests for integration order (I(0) or I(1) are computed:
*
Lo's (1991) R/S test for I(0) against I(d), for d > 0 or d < 0. A bounding
p-value (probability of the statistic exceeding the computed value under
H0) is given in braces.
*
The Kwiatkowski et al. (1992) (KPSS) test of I(0), against I(1). A
bounding p-value (probability of the statistic exceeding the computed value
under H0) is given in braces.
*
The Harris-McCabe-Leybourne (2006) N(0,1) test of short memory (see
8.2 Options / Tests and Diagnostics for additional details.
*
Phillips-Perron (1988) test of I(1) against I0). A bounding p-value (probability
of the statistic lying below the computed value under H0) is given in braces.
*
The augmented Dickey-Fuller test of I(1) against I(0). The number of lags is
chosen to optimize the Schwarz information criterion over the range 0 to
[T^1/3].
*
Robinson's semiparametric estimator of d. See Robinson, Anns. Stat. 22
(1994), 515-539. The statistic corresponds to eq. (4.2) of the paper with
lamda_m = 2 pi n^{-0.35} and q = 0.5 .
Notes:
1.
Check the 'Detrend?' box to compute the statistics for the series after
detrending by OLS.
2.
Check the 'Differenced?' box to compute the statistics for the differenced
series in addition to the undifferenced series.
3.
Choose the order of correlograms of the series and squared series, with
associated Q statistics, using the scroll bar. If this is set to 0, no
correlograms are computed. Choice of Box-Pierce or Ljung-Box Q test
variants is selected in Options / Tests and Diagnostics.
4.
Check the "Data Correlations?" box to see the correlation matrix of two
or more series. In this case, no other statistics appear and the correlograms
scrollbar is "greyed out". If only one series is selected with this option set,
no output is produced.
5.
Check the "Quantiles" checkbox to report the following quantiles of
the data distribution: 0.01, 0.05, 0.1, 0.3, 0.5, 0.07, 0.09, 0.95, 0.99.
For small samples the extreme cases are omitted.
*
Note that if detrending is specified, the mean of the distribution
is zero by construction.
47
© James Davidson 2008
6.
The "Sample..." button opens a dialog to set the sample period to be
analysed (Sample 2). See Setup / Set Sample for details.
7.
The test p-values are computed from the published tables and are not
available for every ordinate. The values given are upper bounds.
Dickey-Fuller's table for the maximum sample size is quoted for the
ADF and Phillips-Perron tests, and in this case the probabilities refer to
the lower tail.
3.7 Setup / Nonparametric Regression
Opens a dialog to specify a Nadaraya-Watson estimate of the conditional mean,
using the Gaussian kernel. Two variables must be selected from the list, the
dependent variable y and regressor x. Use the radio buttons to toggle between
these choices.
Press "Sample ..." to open the Set Sample dialog and select the sample to be
analysed (Sample 3). This sample is shared with the semiparametric long
memory estimators, and can be set in either dialog.
By default, the bandwidth used is S.n^{-1/5} where n = sample size and S is
the sample standard deviation of the regressor. Use the scroll bar to increase
or decrease this setting by factors of 2.
The function is plotted with the y-x scatter optionally superimposed.
3.8 Setup / Semiparametric Long Memory
This dialog computes estimates of the long-range dependence parameter d, using
one of three semiparametric methods:
*
"Narrow-band" log periodogram regression (Geweke and Porter-Hudak,
1983) The log-periodogram points for j=1,...,M are regressed on
-2log(sin(pi.j/T)) where T is sample size, and M/T --> 0.
*
"Broad-band" log periodogram regression (Moulines and Soulier, 1999)
The log-periodogram points for j=1,...,[T/2] are regressed on
-2log(sin(pi.j/T)) and P Fourier terms (cosine functions of pi.j/T) to
approximate omitted short-range components, where P --> infinity but
P/T --> 0.
*
Local Whittle Gaussian maximum likelihood (Kunsch 1987, Robinson 1995)
Maximizes the frequency domain Gaussian likelihood as function of d, using
the first M periodogram points where M/T --> 0.
The outputs from this option includes point estimate, asymptotic standard error and
t-test of significance. The log-periodogram regression methods also return a
Hausman-type test for the presence of bias (Davidson and Sibbertsen 2006).
48
© James Davidson 2008
Notes:
1.
To run the estimation, select a variable or variables from the list, and press
Go. Multiple selections are permitted, and will be computed in succession.
Alternatively, just double-click on a variable in the list.
2.
The series may be either differenced, or detrended by regression, prior
to computing the periodogram. Choose option with the radio buttons.
3.
Press "Sample ..." to select the sample for estimation (Sample 3). This is
stored independently of the sample selection for other program functions,
but is shared with Nonparametric Regression, and can be set in either
dialog. See Setup / Set Sample for details.
4.
For the GPH bandwidth and trim options, and MS Fourier terms, the
power of T being selected (to nearest integer below) is shown as a guideline.
Note that the optimal bandwidth is typically a power of T times a constant
factor, that may be small. The weight here is 1.
5.
The GPH bandwidth setting is chosen with the scroll bar GPH recommended
M = O(T^(1/2)). The minimum MSE setting is known to be M =
O(T^(4/5)), but the bias can be large with this choice. Experimentation is
recommended to see how sensitive the estimate of d is to the selection.
6.
The GPH trimming option also omits the lowest frequencies. See the relevant
literature for guidance on this setting. If in doubt, keep at 0.
7.
The bandwidth used to compute the GPH bias test (see Davidson and
Sibbertsen 2006) should be set to the maximum (T/2) to test the hypothesis of
a pure fractional process. Use this setting if in doubt. Setting the bandwidth to
CT^beta for 4/5 < beta < 1 yields a test of a more general hypothesis, allowing
any short-run dependence that does not induce bias. Note that the test is
inconsistent with beta <= 4/5.
8.
The choice of MS Fourier order is also a trade-off between bias and
efficiency - see MS paper for recommendations, or experiment.
9.
The smoothing option, available for both estimators, uses local nonoverlapping averages of periodogram points in the regression. If in doubt,
keep this setting at 1.
3.9 Setup / Cointegration Analysis
This dialog allows a Johansen-type multivariate cointegration analysis to be
carried out on any subset of the data. The available procedures are:
*
Testing hypotheses of I(0) and I(1) on the selected variables.
*
Lag length selection for the Johansen CIVAR, by Akaike, Schwarz or
Hannan-Quinn selection criteria.
49
© James Davidson 2008
*
Johansen maximum eigenvalue and trace tests for cointegrating rank.
*
Wald tests of structural exclusion restrictions on the cointegrating vectors,
including MINIMAL analysis.
Select the variables to be included and CIVAR options, then select the desired
procedure using the radio buttons. To execute the procedure press Go, or the
Run or Evaluate buttons on the tool bar.
Notes:
1.
Open the Set Sample dialog using the "Sample ..." button to set the desired
sample (Sample 4). This selection is independent of those set for other
program functions. See Setup / Set Sample for details.
2.
The KPSS test of I(0) and P-P test of I(1) are also available in the Actions /
Summary Statistics dialog, but here, for convenience, are computed for all
the selected variables at once.
3.
The p-value inequalities reported are taken from the tables of the eigenvalue
and trace tests in Osterwald-Lenum (1992)
4.
A check box allows the inclusion/exclusion of drift terms in the CIVAR.
If the drift is suppressed, intercepts of the estimated cointegrating vectors can
be computed. However, note that standard errors are not computed for these.
5.
MINIMAL analysis is described in Davidson (1998a). A sequence of
chi-squared tests is computed to estimate the set of 'irreducible'
cointegrating relations (such that cointegration is not a property of any subset
of the included variables.) Identified, structural cointegrating relations must
belong to this set. If the cointegration hypothesis is not rejected, estimates
of the vectors are reported, with asymptotically valid standard errors, and
Phillips-Perron statistics for the corresponding 'cointegrating residuals'.
6.
There is the option to specify a single test of the hypothesis that the
cointegrating space contains an element subject to specified zero restrictions.
When the radio button for this option is selected, the variable list shows only
the currently selected CIVAR variables. Select a subset of these to test the
hypothesis that they form a "cointegrating subset".
7.
Scroll bars allow the setting of lag length, and also the cointegrating rank
to be assumed for computing the 'beta' matrix of cointegrating vectors.
This setting is taken as given in the MINIMAL analysis.
8.
See Davidson (1998a) for details of the "rule of thumb" adjustment to the
chi-squared critical values.
3.10 Setup / Monte Carlo Experiments...
This dialog provides the options to set up and run one or more simulation
experiments. To make use of it, there should normally be at least one model
50
© James Davidson 2008
stored using the Setup / Model Manager dialog. If two different models are
stored, one can be used to generate the artificial data and the other to specify
the estimation, allowing a flexible approach to misspecification analysis.
*
Select one or more Data Generation Models (DGMs) from the list
*
Select one or more Models for Estimation (EMs) from the list (can be the
same as or different from the DGMs).
*
Use the scroll bar to select the number of replications, and set other
options with the checkboxes.
*
Press "Run" to perform the experiment(s). To interrupt a run in progress,
press the "Stop" button on the toolbar, with the options of aborting or
continuing.
*
Press "Results" to re-display the tables from the experiment last run with
the currently loaded model.
Notes:
1.
Multiple experiments can be set up by selecting two or more models in
either category.
o
If one EM is selected and two or more DGMs, then the experiment
is performed on the EM using each DGM in turn.
o
If two or more EMs are selected and one DGM, then the experiment
is performed on each EM using the specified DGM.
o
If multiple models are selected in both categories, then all the possible
experiments are performed - each DGM with each EM in turn.
o
The same model(s) can be selected in both categories.
2.
In a single experiment, pressing "Run" a second or further time results in
additional replications (the number currently selected) being added to the
current set. To start a new experiment, change any model selection, or
any option other than number of replications.
This feature is not available when multiple experiments are specified.
3.
The sample period for estimation is always defined by the DGM. The sample
settings for the EM are ignored. To have a dynamic simulation run for a
number of start-up periods, select the "Presample Data Random in
Simulations" option in Options / Simulation and Resampling. Then set the
DGM sample period as desired for estimation.
4.
If no models are defined, the current specifications are stored as a model with
the default name (run ID) and used for both DGM and EM.
5.
The DGM specification MUST include a choice of shock distribution
(Gaussian, Model or Bootstrap) selected in the Options / Simulation and
Resampling dialog. Set the shock variance in the same dialog for the Gaussian
option, and appropriate parameter values in the Values dialogs for the Model
option. Make these selections before saving the DGM.
51
© James Davidson 2008
6.
Between 1 and 1 million replications can be specified. The selectable values
are in the ranges 1,2,..,5,10,...,50, 100,...,1000, 1500,...,10000, 15000,...,
100000, 150000,...1000000.
7.
If a test takes a variable parameter, such as degrees of freedom or
number of tested restrictions, the tables display this value enclosed in
square brackets appended to the test name. The suffix is omitted if the
parameter has a default value, such as 1 in the case of t-ratios.
OPTIONS:
8.
The parameter moments reported are the mean, standard deviation,
skewness and kurtosis of the Monte Carlo distribution of parameter
estimates.
9.
Optionally, moments can be computed for the estimated standard errors
of the estimates, using whatever formula is specified in the estimation
model (standard, robust or HAC). The mean of this distribution may, for
example, be compared with the SD of the Monte Carlo distribution of
the estimate.
10.
Parameter biases and RMSE can be reported in cases where the DGM
and the estimated model have comparable specifications. If the models
are not comparable (having different sets of parameter names) this option
is cancelled automatically. However, provided the parameter sets match,
the models can otherwise be different. In particular, parameters can be
'fixed' in the estimated model to values different from the DGM, such as
0. This option allows the analysis of omitted variable bias, for example.
11.
Any optional tests that are specified in the estimation model will be
included in the tabulations. The routinely computed diagnostic tests
(Jarque-Bera test and Q tests) can be optionally included in the
tabulations. By default, they are omitted.
12.
The upper-tail quantiles of the distributions of the test statistics (50%,
10%, 5%, 2.5%, 1%) are optionally reported in the case of parameter t
values. By default, the absolute t values are tabulated, so that, for example,
the 5% tail quantile should be approximately 1.96 in large samples when
the null hypothesis is true.
13.
Also optionally reported are the empirical distribution function (EDF)
points for the nominal p-values. If the test criteria are correctly sized,
these distributions should be Uniform [0,1] if the null hypothesis is true,
and 100x% of replications should lie below x. Over-rejection yields a
value larger than the nominal one. The cases tabulated are x = 0.01,
0.025, 0.05, 0.1, 0.5.
14.
Optionally, the signed t statistics can be tabulated instead of the absolute
t statistics, to allow the evaluation of one-tailed tests. In this case, the 5%
tail quantiles should be approximately 1.64 in large samples when the null
hypothesis is true. Note that the upper tail is tabulated, so be sure the
parameters are signed appropriately.
52
© James Davidson 2008
15.
When the models match, the t statistics can optionally be centred on
the 'true' parameter values specified by the DGM. With this option
selected, the distributions of the test statistics can be studied under the
(true) null hypotheses that the parameters takes their DGM values. This
option is available only in those cases where the bias and RMSE are
available.
16.
When the distribution of test statistics follows the distribution specified for
the null hypothesis, the p-values should be uniformly distributed, so that their
c.d.f is the 45-degree line of the unit square. The Kolmogorov-Smirnov
statistic (the maximum absolute difference between the p-value EDF and the
uniform distribution) can optionally be calculated. This provides an alternative
to the quantiles to assess how closely the distributions match.
Nominal critical values for the K-S distribution, assuming 80+ bins, are
1.22 (10%), 1.35 (5%), 1.63 (1%).
Note: this option is only available if the frequency table is enabled, see
19 below.)
17.
If GMM is simulated, there are two options available, the "one-step"
estimator, and the efficient GMM estimator using the first-round estimates
to compute the weight matrix. Check the "iterated GMM" checkbox to
select the latter option. Further iterations are not possible, in this release.
18.
Check the box to do a simulation on log periodogram regression. In this
case, choose the desired options and variable for study in the Setup /
Log Periodogram Regression dialog before storing the model for estimation.
The other settings are of course ignored in this case. Note that the DGM
may either specify a long memory model, or another model (e.g. a switching
model) for an investigation of 'spurious long memory'.
Note: Although the DGM may feature a 'true' d (ARFIMA) parameter, the
bias/RMSE option cannot be selected since the models assumed are
not comparable. The bias and RMSE can of course be handcomputed from the information reported.
19.
By default, the individual replications are stored. These can be plotted as
kernel densities or histograms (see Graphics menu) , or written out to a
spreadsheet file for further analysis using Files / Listings / Save MonteCarlo
Replications. However, when very large simulations are run this option may
put pressure on available memory. Checking the option Save Frequency
Table results in the frequencies being accumulated during the run. The actual
replications are discarded, so there is no memory constraint. A different
routine is used to generate the frequency plots in this case.
20.
Increasing the number of bins used to generate the frequency distributions
gives more accurate estimates of quantiles and test sizes, at the cost of
greater computing time. The default setting of 100 gives sizes estimated to
the nearest percentage point.
21.
Check the "Save EDFs" checkbox to save tabulations of the empirical
53
© James Davidson 2008
distribution of test statistics. If the t statistics are centred on the true
parameter values, or otherwise if the null hypothesis of interest is set to be
true in the simulation, these distributions can be used to provide critical
values, and hence to estimate true test powers by simulating cases of the
alternative. These tables can also be used to generate p-values for tests in
observed data.
22.
EDFs are saved as spreadsheet or matrix files of the type specified by
Options / Output and Retrieval / "Export Listings to Files of Type". The
assigned file names are of the form "EDF_Run" + run i.d. + extension.
These files can be renamed, merged and/or edited either in TSM or a
spreadsheet program (see below). See Appendix G for details of the
EDF file format.
RUNNING AN EXTERNAL PROCESS
23.
Check the "Run as External Process" checkbox to launch the run as a
batch job in a console window. The calculations are a run in a new
instance of Ox, running in a console window. A temporary executable
Ox file is created to be run in batch mode.
24.
This option allows the TSM GUI to remain under the user's control
for other tasks while a long Monte Carlo job is performed. It also allows
two or more jobs to run be concurrently. Since Ox is not multi-threaded,
this is the best way to make full use of a multi-core processor.
25.
When the run is completed the results are sent to a text file that can be
loaded in the TSM window using the command File / Load Text File.
The temporary ".ox" file created to run the job is deleted at closedown
if "Delete Temporary Files on Exit" is checked in Options / General.
26.
If the checkbox "Defer External Jobs" is checked in Options / General, the
Ox file containing the job is created, but not run. Use this option if the
job is to be run on a different machine, for example.
ADDITIONAL OPTIONS
27.
The results of the experiment, including tables and plots data, are
automatically stored, with the Data Generation model, at the end of the
run. Reloading this model allows the tables (using the "Results" command)
and graphics to be re-displayed at any time. When performing a sequence
of experiments, save the Data Generation model under a new name
before modifying it, so as to preserve these results for future study.
28.
The complete set of replications (or the frequency table if this option is
selected) can be also exported to a spreadsheet file for further analysis.
Give the command File / Listings / Save Monte Carlo Replications. The
distributions can also by displayed graphically. The command Graphics /
Monte Carlo Distributions opens a dialog to select and display the
empirical densities of each parameter, test statistic and p-value. These
are optionally displayed in both histogram and kernel density form.
The normal curve with matching mean and variance can be optionally
superimposed for comparison; see Options / Graphics.
54
© James Davidson 2008
29.
See 7.3 Graphics / Monte Carlo Graphics for further information about
creating plots, including the ability to combine density plots from different
experiments, for comparison.
3.11 Setup / Tail Probabilities and Critical Values...
This dialog gives access to tabulations and plots of standard distributions:
the standard normal and Student t, either signed or absolute, and the chisquared and F distributions.
*
Select the radio button for the distribution required.
*
Set degrees of freedom as appropriate (except for "EDF from File",
see Note 4 below).
*
Depending on the dialog opened, enter either the critical value to get
the tail probability, or the tail probability to get the critical value.
*
To show the probability/critical value (also printed in the results window)
press the right-hand button. To plot the density with the tail area shaded,
press the left-hand button.
Notes:
1.
The "tail probability" is the area of the upper tail of the density, to the
right of the critical value. Use the critical value to perform a 1-tailed
test with the corresponding significance level.
2.
The distributions "|Normal|" and "|Student t|" allow calculation of p-values
for 2-tailed tests. These correspond to the p-values reported with the
estimation output.
3.
Use the signed distributions "Normal" and "Student t" to calculate p-values
for 1-tailed tests. Just cut and paste the test statistic into the "Look Up Tail
Probability" dialog. Change its sign for tests of the lower tail.
4.
Select "EDF from File", then press "Select", to choose a test statistic
from the currently open EDF file - the file dialog opens automatically
if no EDF file is currently open. To open a different EDF file, use
the command File / Data / Load EDF.
5.
The density plot is the same in either dialog. The shaded region is the
area corresponding to the tail probability, and equivalently, the area to
the right of the critical value.
55
© James Davidson 2008
4. Model
4.0 Model / General
The special model features specified in these dialogs (conditional variance,
supplied function, regime switching, equilibrium relations, parameter constraints)
are turned "on" and "off" by checking/unchecking the relevant boxes in the main
"Dynamic Equation..." dialog. The current settings are retained even when the
feature is deselected, and can be re-activated by checking it again. The current
selection is shown by check marks against the menu items, as well as by the
check boxes.
All dialogs are closed before an estimation is run. Restore them to their original
positions by the Actions / Restore Dialogs command, or by clicking the Windows
button on the tool bar. Alternatively, select the option to have them restored
automatically; see Options / General.
BUTTONS
1.
The "Values" button either opens the corresponding Values dialog, or
refreshes it with new settings if it is already open. If any parameters are
"fixed" in this dialog, the button is highlighted as a reminder.
2.
The "Clear" button sets all specifications in the dialog to the defaults.
3.
The "Go" button, where provided, is an alternative way to launch an
estimation, equivalent to selecting the "Run" button on the toolbar, or the
Actions / Run Estimation menu item.
4.
Where provided, the "Sample" button opens the Setup / Set Sample
dialog.
5.
Where provided, the "Options" button opens the last-opened estimation
options dialog from the Options menu. By default, this is the Tests and
Diagnostics dialog.
Notes:
1)
Pressing the Options button repeatedly cycles through all the
accessible options dialogs.
2)
Only relevant options are accessible from this button, depending
on whether it is located in the Linear Regression or Dynamic
Equation dialog. All options dialogs are accessible in the usual
way, through the menu or the >>> and <<< bars.
SPECIFYING SYSTEMS OF EQUATIONS
6.
A system of equations is specified by checking this option in the main
Model dialogs, and then selecting a set of two or more dependent variables.
All the equations are given the same specifications (AR/MA components,
regressors, etc.). The specification of individual equations is changed by
selecting restrictions on individual parameters in the Values dialogs.
56
© James Davidson 2008
7.
To modify the specification of an equation, first open the corresponding
Values dialog. Use the choice widget appearing on the tool bar to switch
between equations. To exclude a regressor (or lag) from an equation,
select the "Fixed" checkbox for the parameter(s) in question, and then
make sure that 0 is entered in the Values field. If desired, any other fixed
value can be set.
8.
Variables selected as endogenous can also appear on the right-hand sides
of the equations as Type 1 regressors, to allow a simultaneous system.
Three Stage Least Squares can be selected as an option in the Model
/ Linear Regression dialog. In the Dynamic Equation dialog, the presence
of such variables automatically causes the FIML estimator to be computed,
provided suitable identifying restrictions have been imposed on the equations.
See the relevant help pages for further details.
9.
Equilibrium relations can be embedded in systems of equations to create an
error correction model or cointegrating VAR. The Model / Equilibrium
Relations dialog allows the selection only of a set of variables to be
included in all the relations. The Values dialog is used to impose restrictions,
which must include a normalizing restriction (fixed at -1, typically) on one
variable.
4.1 Model / Linear Regression...
This dialog is for specifying a linear equation, for estimation by Ordinary Least
Squares (OLS) or Instrumental Variables (IV/2SLS). When a system of equations
is enabled in Setup / Estimation and Sample, it also permits estimation by the three
stage least squares (3SLS) and the "seemingly unrelated regressions" (SUR)
system estimators.
*
Select the type of estimator required under Select Estimator. Note that the
options depend on whether the System of Equations checkbox is checked.
For IV estimation, select the instruments in the Model / Select Instruments
dialog.
*
Use the radio buttons to choose whether to specify the dependent variable(s),
or regressors of Types 1 or 2. Then click on the variable(s) desired in the list.
Any number of regressors of either type can be selected, but only one
dependent variable, unless the "Systems of Equations" box is checked in
Setup / Estimation and Sample.
*
Set the 'Lags' scrollbar to automatically include lags, up to the set order, of
all variables of the Type whose radio button is currently selected.
*
Use the check-boxes to include an intercept and/or a trend dummy.
*
Use the check-box to enable a Wald test of parameter constraints. The
type of test is specified in Model / Parameter Constraints (press the square
button to open this dialog). Parameters for zero and linear restrictions must
be specified in the Values / Equation dialog.
57
© James Davidson 2008
*
Enable the "Cointegrating Regression" options by checking the checkbox.
Then:
o
check either or both of the Cointegration Test checkboxes to
compute the residual Phillips-Perron and/or augmented
Dickey-Fuller statistics.
o
Check "Fully Modified Least Squares" to compute the PhillipsHansen (1990) FMLS efficient estimator.
o
Check "SSW Efficient Least Squares" to compute the least squares
estimator augmented by leads/lags of regressor differences as
proposed by Saikkonen (1991) and Stock and Watson (1993)
(SSW-LS).
*
For Instrumental Variables estimation (IV/2SLS/3SLS), use the Choose
Instruments button to open the selection dialog.
*
The “Sample …” button opens the Set Sample dialog. Use this to select the
observations to be used for estimation. The setting is the same as if opened
from Setup / Set Sample. Pressing the "Simulate" button allows the
"All Available Observations" button to show the available sample of
exogenous variables for a simulation of the dependent variable.
*
The Options button opens the most recently opened estimation options dialog
from the Options menu. By default, this is the Tests and Diagnostics dialog.
Click the horizontal <<<< and >>>> bars in these dialogs to switch between
them.
*
The Values button opens the equation Values dialog, or refreshes it if it is
already open.
*
To compute the estimates, press the Go button. This duplicates the 'Evaluate'
button on the toolbar, and the Actions / Run Estimation menu item.
Notes:
1.
For models specified in this dialog the estimates are computed by the
usual analytic formulae. Equations specified in the Model / Dynamic
Equation dialog are estimated by numerical optimization, whether or not
their form is linear.
2.
When this dialog is opened, the Dynamic Equation, Conditional Variance,
Supplied Function and Regime Switching dialogs are all closed
automatically. These features are all disabled ("greyed out"), until it is
closed again. All estimators except Least Squares and IV are also
unavailable.
3.
See Model / Select Instruments for details of the instrument selection
procedure.
58
© James Davidson 2008
4.
Use the 'Clear' button to remove all selections.
VARIABLE AND LAG SPECIFICATION
5.
When one or more variables are selected in any category, the
corresponding radio button is highlighted (lighter grey). To see the
actual variable(s) (highlighted in the variable list) and the lag order
selected, click on the radio button in question.
6.
Regressors of Type 1 can have a different lag order specified from those
of Type 2. It is recommended to (e.g.) make variables for lagging of Type
2, and others, such as dummies, of Type 1. If lags are not specified, then
regressors of Types 1 and 2 are equivalent.
7.
In single equation mode, if the dependent variable is selected as a
regressor of Type 2, and Lags > 0, only its lagged value(s) are included
in the set. This provides an alternative way to estimate an autoregression,
without numerical optimization. In all other cases (as a regressor of Type 1,
or with Lags = 0) the dependent variable is ignored.
8.
In Equations System mode, selecting the same set variables as the
"Dependent Variables" and as "Regressors of Type 2", with k > 0 lags
selected, results in the unrestricted VAR(k) system being estimated.
9.
The trend term, if selected with the checkbox, is a regressor of Type 1.
With this option selected, lags of Type 1 regressors are disabled to
avoid collinearity.
WALD TEST OF CONSTRAINTS
10.
Estimation subject to constraints is not available for linear regressions.
LM tests of parameter constraints and fixing restrictions are likewise
disabled, although parameters can be fixed in the usual way. However,
note that Wald and LM tests are equivalent in this case.
11.
To perform an F test of “significance of the regression”, check the Wald
Test checkbox, and also the "Test Joint Significance of Regressors" box
in the Model / Constraints dialog. Note that lagged dependent variables,
current endogenous variables in simultaneous systems and the trend term
are not included in this set by default, but can be added to it by checking
the Wald Test checkboxes in the values dialog..
COINTEGRATING REGRESSION
12.
The cointegration options are all disabled if the Systems checkbox is
checked, or the Estimator selection is IV/2SLS. The Phillips-Perron
and ADF statistics are only available with OLS estimation. These
options are disabled if FMLS or SSW-LS are selected.
13.
The Phillips-Perron test and FMLS estimator both make use of a
Heteroscedasticity and Autocorrelation Consistent (HAC) covariance
estimator. Set the desired kernel and bandwidth in Options / Test and
Diagnostics Options.
59
© James Davidson 2008
14.
The SSW-LS estimator includes leads and lags of the differences
of all variables included as Type 1 regressors. The coefficients of these
ancillary regressors are not reported in the output. Lagging Type 1
regressors is disabled. Type 2 regressors can be included, with lags
chosen by the user (not chosen automatically). For valid application
of the method, the dependent variable and Type 1 regressors must all be
I(1), while the Type 2 variables must all be I(0) (stationary).
15.
The ADF test and the SSW-LS estimator depend, respectively, on
a choice of lag length, and of lead/lag length. The lengths L can be
selected in two ways:
*
Automatically, by optimizing a model selection criterion over the
interval 0 <= L <= [n^(1/3)] . The selection criterion is is set in
Options / Test and Diagnostics. It is the Schwarz IC by default.
*
Manually, using the lag selection scrollbar. To enable this option,
set the model selection criterion to "None" in Options / Test
and Diagnostics.
16.
FMLS and SSW-LS cannot both be selected at once. Uncheck to latter to
select the former.
4.2 Model / Dynamic Equation...
This dialog sets up the specifications for a dynamic model. As well as setting the
basic ARIMA and ARFIMA specifications, as specified in equation (3.1) of the
main document, it also specifies which additional model features will be
activated.
*
Use the radio buttons to select an estimator. The estimation criteria (see
main documentation for details) are:
o
Least Squares / Least Generalized Variance / FIML
o
Instrumental Variables / GMM
o
Conditional Maximum Likelihood with Gaussian (normal) errors
o
Conditional Maximum Likelihood with Student's t errors
o
Conditional Maximum Likelihood with skewed Student's t errors
o
Conditional Maximum Likelihood with General Error Distribution
o
Whittle (frequency domain) ML with Gaussian errors
o
Probit (0-1 binary data)
o
Logit (0-1 binary data)
o
Poisson (count data)
o
Negative Binomial I (count data)
o
Negative Binomial II (count data)
*
Use the scroll bars to choose the order of ARMA model.
*
Use the checkboxes to select the ARFIMA (long memory) specification,
impose a unit root, select a nonlinear moving average (see 16 below) and
include intercepts of Type 1 or 2, and a trend dummy. Only one type of
intercept can be selected at a time.
60
© James Davidson 2008
*
Use the radio buttons to switch between selection of the four categories of
variable: the dependent variable, and regressors of Types 1, 2 and 3. Then
highlight the variables required in the list.
*
Set the 'Lags' scrollbar to a positive value to include lags, up to this order, of
all the variables of the Type whose radio button is currently selected.
*
Use the lower scrollbar to select the number of lags of the error to include in
the bilinear specification. If set to zero, this corresponds the usual
AR(F)IMA(p,d,q) model.
*
Use the other check-boxes to select or deselect additional model features
(conditional variance model, coded nonlinear function, regime switching,
equilibrium relations and parameter constraints). Press the button to the left
of the checkbox to open the corresponding dialog, if currently closed.
*
For Instrumental Variables estimation (IV/GMM), use the Choose Instruments
button to open the selection dialog.
*
The "Sample ..." button opens the Set Sample dialog. Use this to select the
observations to be used for estimation. The setting is the same as if opened
from Setup / Set Sample. Pressing the "Simulate" button allows the
"All Available Observations" button to show the available sample of
exogenous variables for a simulation of the dependent variable.
*
The Options button opens the most recently opened estimation options dialog
from the Options menu. By default, this is the Tests and Diagnostics dialog.
Click the horizontal <<<< and >>>> bars in these dialogs to switch between
options dialogs.
*
The Values button opens the equation Values dialog, or refreshes it if it is
already open.
*
To compute the estimates, press the Go button. This duplicates the 'Run'
button on the toolbar, and the Actions / Run Estimation menu item.
Notes:
ESTIMATION CRITERIA
1. Note limitations on the application of some estimators.
*
GARCH and Markov switching options are unavailable with least
squares and GMM.
*
Systems of equations are unavailable with skewed Student errors,
and all discrete data options.
*
The Whittle method is only implemented for univariate ARFIMA
models.
2.
If no conditional heteroscedasticity or regime-switching features are specified,
the difference between Least Squares/LGV and Gaussian ML is that in the
latter case the error variance (or covariance matrix, for systems) is estimated
jointly with the other parameters .
61
© James Davidson 2008
3.
Multi-stage GMM, with efficient weights matrix based on first-stage residuals,
is effected by running the estimation repeatedly. See Actions / Run
Estimation. For this option to be active, the type of covariance matrix
desired ('Robust', or 'HAC') must be selected in Options / Test and
Diagnostics Options. If 'Standard' is selected, only one-step GMM is
available.
4.
"Binary data" means that the dependent variable may take only
two values, zero and one.
"Count data" means that the dependent variable may take only zero or
positive integer values.
MODEL SPECIFICATION
5.
Check the 'Impose Unit Root' option to estimate an ARIMA(p,1,q) model,
and also an ARFIMA(p,1+d,q) where -0.5 < d < 0.5. This option is distinct
from performing the estimation on the pre-differenced series, because the
regression statistics, plots and forecasts are all generated for the original
series of levels.
Note:
*
Any Type 1 regressors included are differenced along with the
dependent variable(s).
*
If a trend is included, it becomes in effect an intercept for the
differenced model. A Type 1 intercept is unidentified, and is not
permitted. A Type 2 intercept can enter as an alternative to the trend,
but will be suppressed if a trend is specified.
*
Type 2 and Type 3 regressors enter as usual, and are not differenced.
*
Lagged dependent variables, included as either simple regressors of
Type 2 or as components of equilibrium relations, are not differenced.
*
In fractional cointegration models, the program modifies the reported
value(s) of d3 in the appropriate way, such that 1 is added to the order
of difference d1, as reported.
6.
Use the 'Values' button to open the relevant Values dialogs, and update them
with new settings if already open. Use the 'Clear' button to remove all
selections in this dialog. The 'Go' button launches an estimation run
(duplicates the Run button and Actions / Run Estimation).
VARIABLE SELECTION
7.
The three regressor Types correspond to the vectors denoted x_1t, x_2t and
x_3t in equation (3.1) of the main document. Therefore, the estimated
coefficient of a particular regressor can be different depending its Type, when
AR and/or MA components are specified. Type 1 and 2 intercepts must be
interpreted similarly.
8.
When one or more variables are selected in any category, the corresponding
radio button is highlighted (lighter grey). To see the actual variable(s) selected
(highlighted in the variable list) click on the radio button in question.
9.
Only one variable can be selected as dependent, unless the "Systems of
Equations" box is checked. Multiple selection is allowed in the regressor
62
© James Davidson 2008
categories.
10.
The 'Lags' setting allows different orders of lag for the regressors of each
Type. For example, include variables for lagging in the Type 2 category, and
non-lagged variables such as dummies in the Type 1 category. Individual
lags can be suppressed by 'fixing' the coefficients at zero in the Values dialog.
If neither lags nor ARMA components are selected, and there are no current
endogenous variables, the regressor Types are all treated equivalently.
11.
If the dependent variable is selected as a regressor of Type 2, and Lags > 0,
only the lagged values are included. This provides an alternative way (from
setting AR Order > 0) of including the lagged dependent variable as a
regressor. This feature is for compatibility with the Linear Regression option.
LINEAR REGRESSION
12.
A linear equation can also be specified in the Model / Linear Regression
dialog, and in that case will be estimated by the usual analytic formulae.
Models specified in this dialog are always estimated numerically.
13.
This dialog and the Linear Regression dialog cannot both be open at once.
One is disabled whenever the other is open. The variable selections (Type
1 and 2 regressors) are common to both.
14.
An autoregression can be estimated either in this dialog, numerically, or as
a linear regression by using the Lags feature (see 5 above).
BILINEAR MODEL
15.
Remember that if the bilinear order (r) is increased from 0 to 1, this adds p
parameters to the model , where p is the AR order. However raising r further
only adds one additional parameter at each step (not p) due to the imposed
restrictions. This is different behaviour from the commonly described
unrestricted bilinear model.
NONLINEAR MOVING AVERAGE (SPS)
16.
Selecting this feature replaces the error term Ut with the expression
Ut - Ut-1(alpha + beta/(1 + exp(gamma*(Ut-1 - c1)*(Ut-1 - c2))))
where alpha, beta, gamma, c1 and c2 are additional parameters.
Combine this option with an imposed unit root to get models which can
switch stochastically between I(0) and I(1).
17.
Variants:
*
To implement a close approximation to the STOPBREAK
model, fix alpha = -2, beta = 2, c1 = c2 = 0 .
*
To obtain the STIMA model, fix gamma =100 (or any sufficiently
large value), impose the constraint c1 = -c2. Then, alpha is the
MA coefficient for small deviations (|Ut-1| < c1) and alpha +
beta for large deviations.
*
Alternatively, all the parameters can (in principle) be freely
estimated.
18.
Nonlinear MA models can also be implemented by coding the required
63
© James Davidson 2008
formula, see Models / Coded Equations. If both options are selected,
this one is over-ridden.
OTHER MODEL FEATURES
19.
The selectable model features are conditional variances (ARCH/GARCH),
coded functions, regime switching, equilibrium relations, and constraints.
Select these features to be included in the model with the checkboxes at the
lower left side of the dialog.
20.
If a feature checkbox is "greyed out" (disabled) this means that the feature is
unavailable with current settings, usually choice of estimator. For example,
conditional variance models need an ML estimator to be selected.
Also, "Coded Function" is greyed out if coded equilibrium relations are
specified in the Equilibrium Relations dialog. For this case the Coded
Function dialog is dedicated to specifying equilibrium relations.
21.
Model features generally require options to be set in the corresponding
dialogs to be active. It is not possible to select a feature with the checkbox,
unless some model options have been set.
22.
Click the square buttons to the left of the checkboxes to open the
corresponding dialogs. If options are set, these buttons are highlighted. The
dialogs can also be opened from the Model menu.
23.
NOTE: Values dialog(s) corresponding to model features (equilibrium
relations, switching regimes) are not accessible unless the feature is checked.
24.
To compute a Wald test as part of the run, as well as to estimate subject to
constraints, the "Parameter Constraints" box must be checked. Wald tests
can also be performed separately, see Actions / Compute Test Statistics /
Wald Test.
SYSTEMS OF EQUATIONS
25.
Select system estimation by checking the "System of Equations" checkbox.
26.
When a system of equations is specified, the estimator computed depends
on the estimator selection.
*
If the option "LGV/FIML" is selected, the log-determinant of the
error covariance matrix is minimized (Least Generalized Variance),
or FIML in the simultaneous equations case (see 22 below). In these
cases, the covariance parameters are concentrated out, and do not
appear in the vector of parameters.
*
If the option "IV/2SLS/GMM/3SLS" is selected, the estimation
method is system GMM with the instruments selected. If the
estimation is launched with the Actions / Run Estimation commands
or the "Run" button, the error covariance matrix set equal to the
identity matrix. However, if the command Actions / Multi-Stage
GMM is given twice in succession, the second run uses the efficient
weights matrix estimated from the current residuals. This iteration
64
© James Davidson 2008
can be repeated as often as desired. The form of the weights matrix
used depends on the Covariance Matrix Formula setting (see
Options / Tests and Diagnostics), either standard, robust (allowing for
heteroscedasticity) or HAC.
*
If the Gaussian ML, Student t ML or GED ML estimation options are
selected, the error variances and contemporaneous correlations
are estimated as additional parameters. The variances may be modelled
by ARCH and other processes by selecting the "Conditional Variance
Model" feature. These parameters (variances and correlations) can
also be subject to regime switching.
27.
If current endogenous variables are included as Type 1 regressors, the FIML
variant of the LGV and ML estimators is automatically selected. That is, the
log-determinant of the square matrix of coefficients is incorporated in the
maximand. Suitable identifying restrictions must be imposed on the
coefficients for this option to proceed. The "coefficient" of the normalized
variable in each equation is automatically fixed at 0 in this case.
Note: Endogenous variables specified as Type 2 regressors are ignored. If
lags are specified, only the lagged values are included.
28.
In a VARFIMA model, it is possible to parameterize the fractional difference
parameters for Equations 2,... as the differences from the parameter of
Equation 1. This makes it easy to constrain and test equality of the
parameters across equations. To select this option, set the third checkbox
in the Model / Equilibrium Relations dialog. This setting applies even if error
correction terms are not specified.
ESTIMATING TYPE I (V)ARFIMA PROCESSES
29.
It is possible to correct for the omission of the presample data in a fractionally
integrated model by including some generated regressors (depending on the d
and variance parameters). This option is enabled by setting the "Type I
Fractional" text box in Options / General to a positive integer value,
corresponding to the number of generated regressors to be included. In the
output the estimated coefficients are denoted typeIFrac-Z1, typeIFrac-Z2,....
These are akin to principal components of the omitted stochastic terms.
30.
Recommended settings are for the number of components are 1 or 2. The
columns of higher order are very small, so including too many may produce
unstable results.
4.3 Model / Conditional Variance...
This dialog sets up the specifications for equations (5.1)/(5.2) or equations (6.1)/(6.2)
of the main document. In the latter case, the specification set applies to the
conditional variances of each equation.
*
Use the scroll bars to choose order of GARCH specification.
*
Use the radio buttons and checkboxes to select other model options.
65
© James Davidson 2008
*
Use the radio buttons to switch between selection of the three possible types
of GARCH regressor, then click on the variable list to make the selections.
*
Distributed lags of the GARCH regressors can be specified using the 'Lags'
scrollbar, just as in the conditional mean model.
*
Check the "Abs." checkbox to take absolute values of the regressors
automatically.
Notes:
1.
This menu item is checked if a conditional variance model is specified. Its
settings are ignored unless a ML estimator is selected and "Conditional
Variance Model" is checked in the Model / Dynamic Equation... dialog.
2.
The 'regressor' radio buttons are highlighted (lighter grey) to show a selection
has been made.
3.
Clear all specifications with the Clear button.
4.
If the 'GARCH' radio button is selected, the 'Asymmetry' checkbox selects
the Threshold GARCH (GJR) model. In the other cases, the signed terms
of the APARCH or EGARCH are included/suppressed, depending on the
setting of this checkbox.
5.
The dependent variable(s) in the equation(s) can be chosen as GARCH
regressors of Type 2, provided the lag length is set to 1 or greater. In this
case the zero-order lag is suppressed, and the lagged dependent
variable(s) act as GARCH regressors. This is similar to the option in the
mean model. Dependent variables are NOT permitted as regressors of
Types 1 or 3. These options are cancelled automatically.
6.
If the 'Abs' checkbox is checked, the output shows the variable names
enclosed in "|" . It is recommended to check this option when lagged
dependent variables are selected, especially when running simulations.
7.
The Garch-M panel allows either the conditional variance, or conditional
standard deviation, to be added to the regressors selected in Equation…
Choose the regressor Type, and Mode, using the radio buttons.
MULTIVARIATE GARCH
8.
If the equation system option is selected, the default is to have fixed
correlations between the variance-adjusted residuals. An alternative is the
DCC model, in which the elements of the correlation matrix are generated
by a common GARCH(1,1)-type model. The interpretation of the
coefficients depends on the setting, standard vs. "ARMA in squares" form,
see Options / ML and Dynamics. In the first case the fitted parameters are
alpha and beta, in the second case they are delta = alpha + beta and beta.
Note:
1)
The DCC parameters are displayed in the Values / Distribution
dialog.
66
© James Davidson 2008
2)
The MA form setting in Options / ML and Dynamics does not
affect the DCC specification.
9.
If a multiple equation model is specified, the BEKK-Multivariate Garch
model can be selected. This is the case K = 1 as defined by Engle and
Kroner (1995). Be careful to interpret the parameters correctly in this
case. Selecting Equation i in the Values / Conditional Variance dialog,
using the choice widget, displays the ith columns of the Aj and Bj lag
polynomial matrices, and although note that these matrices really define the
dynamic structure of the vectorized conditional covariance matrix, Vec H_t.
See the main document for details of the model. The estimates are reported
in the results window in the same style.
Note: Neither the MA form nor the GARCH form options (Options / ML
and Dynamics) affect the BEKK parameterization.
10.
Evaluation of the DCC and BEKK likelihood functions both require
T NxN-matrix inversions, where T is the sample size and N is the number
of equations. Function evaluation could therefore be very slow for large
systems.
11.
If the BEKK option is selected, the GARCH_M variables consist of the
conditional variances and covariances of all equations. The SD mode
is not available in this case.
12.
In a system of equations with multivariate FIGARCH or HYGARCH
disturbances, it is possible to parameterize the fractional difference
parameters for Equations 2,... as the differences from the parameter of
Equation 1. This makes it easy to constrain and test equality of the
parameters across equations. To select this option (which will also apply
to VARFIMA parameters, if specified) set the checkbox in the Model /
Equilibrium Relations dialog. This works even if error correction terms
are not specified.
4.4 Model / Coded Function...
This dialog is used to set up nonlinear functions coded by the user. Coded
functions can form complete models for estimation, or components of
models. Test statistics can also be coded. See the main TSM document,
Section 3.2.8, for the details. The dialog is also used to specify coded
functions for simulated data generation.
*
Specifications created in this dialog are ignored unless the "Coded
Function" checkbox in Model / Dynamic Equation is checked.
The checkbox cannot be checked unless a specification exists.
*
The "Clear" button clears all text fields, both the parameter names
and the contents of the formula fields. Use with caution!
*
The "Clear Built-In Components" button is provided as a convenience,
for the case where the coded function represents the complete model.
67
© James Davidson 2008
Then, all other model features need to be disabled. In particular,
make sure that items such as the built-in intercept are deselected, to
avoid duplication and an unidentified model.
METHODS
There are three ways to code a model for estimation:
I.
Type coded formulae for equations or equation components into the
text box, interactively.
II.
Supply the code for the model equations as an Ox function, and
compile this with the program.
III.
Write Ox code as in II, but for the complete likelihood function.
Method I is easiest to implement, but limits the function to a single line of code.
Methods II and III allow any degree of generality, but require a minimum
of programming expertise. Since the function is compiled with the program,
TSM must be stopped and restarted to make changes to the specification.
INTERACTIVE CODING
To set up the model, do as follows:
1)
Open the Model / Coded Equations dialog, and select one of the radio
buttons "Equation", "Residual", "Nonlinear MA" and "Nonlinear ECM".
2)
Select the dependent variable(s), in the usual way, in the Model / Dynamic
Equation dialog.
3)
Type the equation formulae in the text fields. Use "Previous" and "Next"
to navigate the fields, "Clear" to initialize the formula and "Cancel" to
discard changes and revert to the stored text.
4)
Press "Test" to check the model parses OK, and list the parameter
names in the name fields below.
Notes:
1.
See Section 1.5 (General / Entering Formulae) for detailed
instructions on entering codes into the text field.
2.
Parameters removed from the equation are not deleted
automatically, but are 'suspended'. Clear the name field manually to
delete a parameter permanently from the model.
3.
Increase the 'Maximum Parameters' value and refresh the dialog to
display additional fields.
TYPES OF FORMULAE
"Equation"
The equation is entered explicitly, in the format " = [Formula]",
where the formula corresponds to the explained part of the
model, and implicitly the dependent variable named in the
heading appears on the left of the "=". The residuals
(corresponding to the function f1(.) in equation (3.29) of the main
document) are computed as the difference between the left- and
right-hand sides of the equation. Use this style whenever the
model can be represented in the form required - which is most cases.
"Residual"
Enter an expression which itself equates implicitly to the residuals
of the model (f1(.) in equation (3.29)). In this case, no "=" sign
68
© James Davidson 2008
should appear in the formula. The purpose of this option is to
allow models in which the dependent variable(s) enter(s)
nonlinearly. Since the model cannot be solved automatically,
no Actual/Fitted plots, forecasts or simulations are available
in this case. This option is also used for the formulation of
equilibrium relations for ECM models.
"Nonlinear MA"
With this option, the model disturbance term Ut is replaced by
the moving average formulation
Ut = Et - f3(Et-j, j > 0).
Enter the formula for the function f3(.) using the reserved variable
names E#{-j}to represent the disturbances lagged j periods.
(E here corresponds to v in equation (3.29) of the main document.)
As in "Residual" the formula should be in implicit form, do not
include "=".
In multi-equation models, use the variable names E#1{-j},
E#2{-j}, ..., to represent the disturbances for each equation.
Presample lags are replaced by 0.
Notes:
1.
With this option the function has to be evaluated recursively.
Iterative estimation of these models could be timeconsuming!
2.
A pre-programmed nonlinear MA model can be accessed
from the Model / Dynamic Equation dialog, and should be
faster to estimate than the coded version. Use this option
except to implement other variants. If both options are
selected, the coded version takes priority.
"Nonlinear ECM"
In error correction models, equations can contain nonlinear
functions f2(Z) of the lagged equilibrium relation Z. Three popular
forms are pre-programmed. For other cases, enter the
function(s) f3 in implicit form, using the reserved variable name
Z# to denote the equilibrium relation or, in case of two or more
relations, the names Z#1, Z#2, ...
Lags can be included as Z#{-j} for j>0. Note that the lag j is
relative to the minimum lag specified in the Model / Equilibrium
Relations dialog. Presample lags are replaced by 0.
Notes:
1.
For the Equation option, an equation code must pair with a selected
dependent variable - see the field heading. It is not possible to add
an equation without first selecting a variable. Equations can be validly
entered in the explicit format "Dependent Variable = [Formula]".
The name of the dependent variable is added implicitly, if omitted.
2.
In the Residuals option, the dependent variables must still be selected
even though there is no explicit normalization. The number of
equations formulated must be equal the number of selected variables.
Checking that the formulated equations have a solution for the chosen
69
© James Davidson 2008
variables is the responsibility of the user.
3.
For the Residuals option, the typed equations define the model
to be estimated. Dependent variable selections in Model / Dynamic
Equation are ignored! Be sure to delete any unwanted equations
using "Clear".
4.
When "System" is checked in Models / Dynamic Equation, and two
or more endogenous variables are selected, coded specifications can
be created for each equation. Switch between these with the "Next"
and "Previous" buttons. If no function is specified for a variable,
enter "= 0" in the corresponding field.
NOTE: Simultaneity is not allowed!!
*
"Equation" specifications should contain ONLY exogenous
or lagged endogenous variables on the right-hand side.
*
"Residual" specifications may be estimated, subject to the
caveat of containing only one endogenous variable each,
but may NOT be used for simulation.
It is the user's responsibility to respect these restrictions. The
program cannot monitor violations, and incorrect estimates and
simulations will result!!
5.
When the "Coded Equilibrium Relations" option is selected in the
Model / Equilibrium Relations dialog, only the Residuals option is
selectable in this dialog.
TEXT BOX CONTROLS
"Cancel"
Discard changes and restore existing formula.
"Clear"
Clears displayed formula. Enters left-hand side for "Equation"
entry.
"Next"
Displays the next formula, where present, disabled otherwise.
"Previous"
Displays previous formula where present, disabled otherwise.
"Test"
Tests parsing of the current model equation(s).
Closing the dialog with the Windows Close button [x] is equivalent to
pressing "Cancel".
PARSING THE MODEL
Parsing fails in cases including the following:
*
Variable name does not match any variable in the data set.
*
Non-matching or misplaced brackets/parentheses/braces.
*
Missing/misplaced operators.
*
Wrong left-hand side variable ("Equation").
An error message is displayed in a pop-up window, and should assist the
debugging process
Note: A name not appearing in either the variable list or current parameter
list is assumed to be a new parameter, and added to the list. Check the
list carefully to see if it's what you intend.
PARAMETER NAMES
*
"P[i]" where "i" is the parameter number shown beside the text field, is
always a legitimate choice of name. It must be still typed explicitly in the
70
© James Davidson 2008
field, so that the program knows how many parameters are specified.
*
Nine parameter name fields are displayed by default. To change the
number, type the value in the "Maximum Parameters" field. To redraw
the dialog box click any button, e.g. "Cancel".
*
Be careful that parameter names do not duplicate variable names. The
convention of naming a coefficient by the variable it multiplies must be
avoided here!
*
In multi-equation models, the same names appear in each equation, but refer
to different parameters. They are distinguished in the output by prefixes
"Eq1:", "Eq2:" etc.
*
If a parameter is named but does not appear in an equation, it is fixed at
0 in that equation. It appears in the Values dialog, but is suppressed in the
output. This allows equation-specific parameters to be named distinctively
VARIABLE NAMES
*
These can be spelled out in full or replaced by the short form "x[i]" where
"i" is the position of the variable in the list, starting from 0. The line numbers
are displayed in the variable list in Models / Dynamic Equation whenever
the text field is open.
*
Under the "Equation" coding option, select the the dependent variable(s)
in the Model / Dynamic Equation dialog first. Unless the formula fields
already contain formulae (press Clear to delete these), opening a field
will automatically insert the variable name and " = ", ready for the rest
of the formula to be typed.
OX CODING
See Appendix C of the main document for information on compiling supplied
code into the program.
Supplied Ox code can be used to return five types of object, according to the
selection made with the radio buttons Residuals: Return a vector/matrix of equation residuals, as a function of
data and parameters from UserEquation(). Return solved
values and forecasts from UserSolve().
Log-likelihood:
Return a vector of log-likelihood contributions as a function of
data and parameters from UserLikelihood().
Statistic:
Return a statistic or vector of statistics as a function of data
and optional constants (passed as parameters) from
UserStatistic().
Data Generation:
Return a generated data set as a function of existing data and
constants passed as parameters from UserGenerate().
Test Only:
Choose this setting if the only coded function to be returned is
71
© James Davidson 2008
a test statistic from UserTest(), based on the regular estimation
outputs, selected with the "Test" checkbox. If this option is set,
the "Coded Function" checkbox is automatically deselected.
Notes.
1.
If the coded functions have been set up for selection by name, as described
in Appendix C, they can be selected in the dialog using the Previous and
Next buttons to navigate the list. Preset names cannot be edited. If no naming
function has been defined, a function can still be selected by typing its name
into the field.
1.
The test statistic option, from UserTest(), accessed by checking the "Test"
checkbox, is compatible with any estimated model. This includes linear
equations, and the Ox Residuals and Log-likelihood options, but not Statistic
or Data Generation.
2.
If a coded test is the only programmed option, select "Test Only" and
do NOT check the "Coded Function" checkbox in Model / Dynamic
Equation.
3.
If "Coded Equilibrium Relations" is selected in Model / Equilibrium
Relations, and "Equilibrium Relations" is checked in Model / Dynamic
Equation, the "Coded Function" checkbox in in Model / Dynamic
Equation is disabled. Note that in this case the parameter values for the
coded relations are displayed in Values / Equilibrium Relations
4.
For all options except the coded test and coded equilibrium relations,
the "Coded Functions" checkbox must be checked in Model / Dynamic
Equation to activate the option.
5.
Enter names of parameters in the text fields provided in the dialog.
Optionally, an identifying name can be entered in the 'Function Name'
field. This is used to identify the output and can also select the function
from a code library maintained in the run file. Alternatively, a name
can be passed from the function itself. To activate this option, leave the
Function Name field blank.
6.
When residuals or the log-likelihood are returned, setting dependent
variable(s) in the Model / Dynamic Equation dialog is optional, though
recommended. If set, it/they should correspond to the normalized
variable(s) in the supplied functions. These settings are not used to
compute the estimates, but allow the correct plots, series and
forecasts to be generated.
7.
It is the user's responsibility to set the sample period (see Setup / Set
Sample) to ensure that all observations are available for the variables in
the model. This is done automatically for models specified through the
program options, but the program cannot know whether variables
included in the user's function have missing observations.
8.
For statistics and data generation, there is the option to enter names
72
© James Davidson 2008
for constants in the parameter name fields, then set values for these in the
Values / Equation dialog. These values are not modefied by TSM, but
are passed through directly to the user's function. If this feature is utilised,
it provides a means for quick changes of specification, without editing the
code.
9.
To generate data, "placeholder" variables must exist in the data set. The
contents of these columns is unimportant, being replaced by the generated
series when the simulation runs. For example, they can be created using the
Extend Sample, Make Zero and Rename commands in Setup / Data
Transformation and Editing. Then select these variables as the Dependent
Variable(s) in Model / Dynamic Equation.
4.5 Model / Regime Switching...
This dialog allows the choice of
*
number of regimes,
*
type of switching - simple Markov switching, explained switching, Hamilton's
model, or smooth transition (ST).
*
which model components to switch,
*
specification of the explained switching probabilities or transition function,
where these options are selected.
Notes:
1.
Regime switching is not activated until at least one model component is
selected for switching!
2.
Except for the smooth transition model, regime switching requires a timedomain maximum likelihood estimator. Options are "greyed out" until
a valid selection is made.
3.
In the Markov and Hamilton models, both the matrix of estimated transition
probabilities p_{ji}, and the unrestricted parameters t_{ji} with standard
errors are reported in the output. The latter are labelled "Logistic of P(j|i)".
See the main document for details.
4.
In Hamilton's model, the "Intercept" selection in Models / Dynamic
Equation is ignored. The intercept is specified as shown in the TSM
document.
5.
In the explained switching case, the radio buttons allow the choice of
variables to explain the probability of switching into the given regime at
date t. An intercept can be optionally added to the equation.
6.
Distributed lags are not implemented for switching regressions, but the
'Lag' scrollbar allows a fixed lag to be applied to the variable(s). If and
only if the lag is positive, the dependent variable(s) can be included in
the set.
7.
There are two versions of the explained switching model. In the first
73
© James Davidson 2008
version, the equation for the probability of switching into regime j at date t
may depend on the current regime (i) only through an intercept shift, by
inclusion of a dummy variable for the intercept in question, with Regime 1
as the reference case. In the second version, the switching equations may
be fully regime-dependent, and switch just like other model components.
Check the box "Regime-Dependent Coeffs." to enable this case.
8.
The second explained-switching model contains the first one as a special
case, but the latter is set up in a slightly different way, with regime dummies,
and is retained for backwards compatibility and simplicity. If dummies (or
switching intercepts) but no explanatory variables are specified in explained
switching, the model represents an alternative parameterization of the regular
Markov-switching model. In form, log-odds transformations of the
switching probabilities are estimated as unconstrained parameters, and
standard errors and test statistics are implemented.
9.
In the smooth transition (ST) case, select the transition indicator (z_t) from
the variable list after clicking the first radio button. Only one selection is
possible. If no transition indicator is selected, the smooth transition option
is cancelled and the type setting reverts to Markov switching.
10.
The inclusion of an ST intercept is selected by a checkbox. If both this and
explanatory variables are omitted, the dominant regime depends on the sign
of z_t. The second set of parameters is unavailable unless 'Double
Transition' is checked.
11.
The number of regimes is fixed at 2 for the ST model.
12.
If the type of switching selected changed from either explained switching
or smooth transition, the variable selections for those options are cancelled.
13.
The option "Estimate Regime Differences" selects the parameterization that
allows individual significance tests of differences between the regimes.
However, note that in a test for *no* differences between regimes (= test
for number of regimes) the switching probabilities or ST parameters are
unidentified under the null hypothesis. This is a well-known testing pitfall,
and the standard tests don't apply.
14.
If "Estimate Regime Differences" is selected with Markov or Hamilton
switching, then rows 2,...,M of the Markov transition matrix are likewise
expressed as differences from row 1. This allows a test of the hypothesis
that transition probabilities are independent of the current regime.
15.
Analytic forecasts are not available for ST models in this release. Use the
Monte Carlo forecast option.
16.
Analytic forecasts are available for the Markov switching models.
However, the number of calculations needed to compute the multi-step
forecast 2-standard error bands increases exponentially with the number
of steps, and can become excessive. Standard error calculations are
terminated after 100 seconds has elapsed, and only the point forecasts
74
© James Davidson 2008
are reported for further steps. A warning message is printed in this case.
The SE bands can also be omitted, see Options / Graphics.
17.
The ST model has two identical maxima of the likelihood, since
interchanging both the regimes and the sign of the smoothness parameter
(gamma) yields the same likelihood, by construction. Be careful to
interpret the estimates correctly.
4.6 Model / Parameter Constraints...
This dialog sets options for imposing restrictions on the coefficients.
Three types of restrictions can be set up:
a)
zero restrictions,
b)
multiple linear restrictions, and
c)
general restrictions specified as coded formulae.
In case (b), only the constants (intercepts) of the constraint functions
are set in this dialog. The linear functions themselves, like the parameters
for zeroing, are set in the Values dialogs.
Restrictions can be implemented in either of two ways:
*
Tested on the unconstrained estimates, using the Wald principle,
*
Imposed in estimation.
In the latter case, the LM test for the restrictions is computed, if this option is
selected in the Options / Tests and Diagnostics dialog. In this case, any fixing
restrictions on the parameters will be treated as part of the maintained model
and not tested. To test fixing restrictions, make sure the Parameter Constraints
option is deselected in Model / Dynamic Equation... or Model / Linear
Regression
Notes:
1.
Up to 10 linear restrictions can be specified with nonzero constant terms.
However, up to 20 additional restrictions could be set with zero constant
terms.
2.
Estimation subject to constraints is not available with OLS and IV estimation.
This option is disabled ("greyed out") when the Model / Linear Regression
dialog is open.
3.
By default, the statistic reported is asymptotically chi squared. Set the
check box to report the F statistic, with the reported p-value taken from
the F tabulation. Note that this setting is shared with the user-specified LM
and moment tests (see Actions / Compute Test Statistics). It can be
selected/deselected in any of the relevant dialogs.
REGRESSOR SIGNIFICANCE TEST
4.
The option "Test Joint Significance of Regressors" provides a valid time
series implementation to the "F test of the regression" computed by many
75
© James Davidson 2008
packages.
5.
In a single equation it sets up a Wald test of the joint significance of all
regressors in the mean model, all Types and components of equilibrium
relations (if any) but excluding the intercept, trend and seasonal dummies,
and lagged endogenous variables. The null hypothesis can therefore be set
up as a univariate time series representation of the dependent variable.
Note that this test can be performed in the usual way by selecting the
parameters individually in the Values dialogs, but this option provides a
handy shortcut.
6.
The program "knows" a regressor is a seasonal dummy if the string
"seasonal dummy" or "seasonal dummies" is part of the data description.
This is set up automatically if the dummies are generated in Setup / Data
Transformations and Editing.
7.
In equation systems, all exogenous regressors of all types in all equations
and in equilibrium relations are included in the test, but intercepts, trends
and current and/or lagged endogenous variables are excluded.
"Endogenous" means any variable explained by the system.
8.
Additional parameters can be added to the test set in the usual way, by
checking the relevant "Wald Test" box in the Values dialogs.
9.
Variables having parameters "fixed" are excluded from the test.
CODED_RESTRICTIONS
10.
A coded restriction on the parameters is set up by typing the equation
into a text field. After selecting the restriction type with the radio button,
press the Code button to open the text box.
TEXT BOX CONTROLS
"Cancel"
Close box, discarding changes.
"Delete"
Delete the currently displayed formula.
"Next"
Displays the next formula, where present.
"New"
Opens a new blank formula where there is no "Next".
"Previous"
Displays previous formula, where present.
"OK"
Closes the text box and stores current formulae.
[Return]
Equivalent to pressing "OK".
Closing the dialog with the Windows Close button [x] is equivalent to
"Cancel".
For information on entering formulae, see Section 1.5
11.
Parameters can be written in the notation "a[i]" where "i" is the number
appearing in the left-hand column in the Values dialogs. "p[i]", "A[i]"
and "P[i]" are all permitted variants, but the square brackets are
mandatory, note.
CAUTION: Parameters can also be identified by name. However,
some parameters are named differently in the Values dialogs and in
the output. If in doubt use the number notation, which is unambiguous.
12.
Suppose there are P restrictions. Using the numbering notation
76
© James Davidson 2008
described in Section 1.5 (in practice, parameter names can also be
used) the restrictions must be entered in the solved form
a[j1] = f1(a[k1],...,a[kM])
...
a[jP] = fP(a[k1],...,a[kM])
for k1,...,kM not equal to j1,...jP, where f1(),..,fP() are differentiable
algebraic expressions. The program imposes the restrictions by
replacing a[j1],...,a[jP] with the given functions of a[k1],...,a[kM].
13.
Restrictions cannot be entered in implicit form!
Example:
a[0] = a[1]*a[3];
a[2] = exp(a[1] - a[4]);
is OK.
a[0] = a[1]*a[2];
a[2] = a[1] + a[3];
is NOT valid! (Not solved form.) A valid form of the first
equation would be
a[0] = a[1]*(a[1]+a[3]);
4.7 Model / Equilibrium Relations...
An Equilibrium Relation (Eq.R.) is defined as a linear combination of lagged
variables that is inserted as a "regressor" in one or more equations of a system,
with the combining coefficients being either restricted or estimated. This is
sometimes called an Error Correction Model (ECM). Most often, an Eq.R. has the
interpretation of a cointegrating relation in a system of I(1) variables, although it
could also, in principle, appear in a model of stationary processes. Eq. R.s can
also appear in single equations, in which case they implement a re-parameterization
of the dynamic model in "ECM" form.
*
Choose one of the three options for specifying the equilibrium relation(s).
A:
Select "Linear Equilibrium Relations" to specify the relation(s)
by choosing variables from the list.
B:
Select "Nonlinear AR / Closed VECM", to include the set of
dependent variables as lagged regressors automatically.
C:
Select "Coded Equilibrium Relations" to specify nonlinear
equilibrium relations using the Coded Function dialog.
*
Use the first scroll bar to select the number of Eq.R.s to be included in the
model.
*
Use the second scroll bar to chose the lag to apply to the Eq. R.s
(must be >0).
*
Restrictions on each relation are set up in the Values \ Equilibrium
Relations dialog.
77
© James Davidson 2008
Notes:
Options A and B
1.
Every Eq.R. must contain at least one fixed coefficient, otherwise the
relation will be unidentified. Set the fix in the Values / Equilibrium
Relations dialog. If no restriction is set manually, the first coefficient in
the list will automatically have its coefficient set to 1 when the
estimation is run.
Note: The Values button is highlighted if two or more coefficients are
restricted in any relation.
2.
With two or more Eq.Rs, note that this dialog specifies the variables to
appear in all of them. To create distinct relations, exclusion restrictions
(fixing coefficients at 0) must be set up in Values / Equilibrium Relations.
Note: For consistent estimation, the relations should satisfy the standard
rank conditions for identification of a linear system.
3.
When "Closed VECM" is checked, the lagged variables included in the
VECM are the dependent variables LESS the fitted combination of Type
1 intercept and/or Type 1 regressors. See main TSM document for
details of the specification.
Option C
4.
The equilibrium relations are formulated in the Model / Coded Function
dialog. Note that "Residual" format must be used (no "=" in the field).
This is the only permitted option when option C is selected in this dialog.
5.
When "Coded Equilibrium Relations" is checked, and "Equilibrium
Relations" is also checked in the Model / Dynamic Equation dialog, the
"Coded Function" checkbox is disabled - coded functions can appear
either in the main equation(s) or in equilibrium relation(s), but not both
at once.
6.
The number of relations in the model is determined by the number
specified in the Model / Coded Function dialog. This overrides the
setting in this dialog.
7.
Formulating the relations with enough restrictions to ensure identification
is entirely the responsibility of the user. Use this option only if you know
what you are doing!
8.
The specification of the relations can be different when there are two
or more of them. They nominally contain the same parameters, but these
can be automatically fixed at 0 if not included in a particular relation.
See Model / Coded Functions for details. They can also be restricted in
the The Values / Equilibrium Relations dialog, if desired.
All Options
9.
Eq.R.s are only included in the model if this feature is selected in Model /
Dynamic Equation.
78
© James Davidson 2008
10.
The radio buttons in the "Types of ECM" area allow selection of nonlinear
response mechanisms as well as the usual Linear case. See the main
document for details. Three popular variants are pre-coded. Use the
Model / Coded Function dialog to define other cases.
11.
Check the first checkbox in the "Fractional Cointegration" area to implement
a fractional cointegration (F-VECM) model. Note that this option is ignored
unless the VARFIMA / Fractional VECM box is checked in the Dynamic
Equation System dialog. In this case, setting the "Impose Unit Root" option
causes the estimated value(s) of d1 to be smaller by 1 than otherwise.
This is taken into account in the calculation of the cointegration order(s) d3,
such that the equilibrium relations appear differenced to order 1+d1-d3 in
the system.
12.
Check the second checkbox to select the generalized cointegration model.
In this case, the cointegrating variables may be fractional differences of the
measured variables. See the main document for details.
13.
Check the third checkbox to parameterize the fractional integration
parameters for Equations 2,... as the differences from the corresponding
parameters in Equation 1. This option allows the restriction of equal
fractional integration parameters across equations to be easily tested, and
imposed in the usual way, by setting the "Fixed" checkboxes in the values
dialogs.
NOTE: It is not necessary to specify a fractional VECM to set this option.
It applies also to a regularly-cointegrating or non-cointegrating VARFIMA
model, and also to the fractional lag parameters of a system FIGARCH
or HYGARCH specification.
14.
If "Impose Unit Root" is specified in Model / Dynamic Equation, the
VECM is estimated with unit roots imposed in the short-run dynamics,
while the Eq. R.s enter as lagged levels.
4.8 Model / Select Instruments...
This dialog is enabled only if IV/GMM is the selected estimator.
Highlight by clicking with the mouse those variables to be included as instruments.
Use the checkboxes to indicate whether the intercept and trend dummies, and
lagged endogenous variables, are to be used as instruments.
The Clear button unselects all variables.
Notes:
1.
Any variable appearing in the equation but not in the instrument list is treated
as endogenous.
2.
Any variable appearing in the instrument list but not in the equation is an
additional instrument. Lags of additional instruments are included to match
the lag setting for Type 2 regressors. Even if no Type 2 regressors appear,
79
© James Davidson 2008
the lag length can be set, to control the number of lags of additional
instruments.
3.
By default, lagged endogenous variables are not used as instruments. If this
option is selected with the checkbox, lags are included to match the lag setting
of the endogenous variables' Type(s).
4.
To use lagged endogenous variables as instruments but not as regressors,
suppress them in the equation by fixing their coefficients at 0 in the Values
dialog.
5.
Lags can be be created manually for use as instruments in the Setup / Data
Transformation and Editing dialog. However, be careful with the automatic
lag settings in this case. If lags are double-counted, the instrument matrix will
be singular!
80
© James Davidson 2008
5. Values
5.0 Values: General
The Values dialogs are used to operate on model parameters. They allow
*
setting starting values for the search algorithm.
*
fixing parameters at chosen values in the estimation.
*
setting bounds on parameters, for estimation subject to inequality constraints.
*
setting a range for a grid evaluation of the estimation criterion, in one or two
dimensions.
*
selecting parameters for Wald significance tests.
*
setting up linear functions of parameters for Wald restrictions tests.
Unlike the other dialogs having fixed layout, Values dialogs can be resized.
Grab the border and drag with the mouse.
BUTTONS
1.
The "Refresh" button rewrites the values field to reflect changes to the model
specification. Pressing the "Values" button in the relevant Model dialog has
the same effect.
2.
The "Clear" button refreshes the fields after setting all values to defaults.
3.
The Equation and Equilibrium Relation dialogs have buttons for cycling
through equations/relations. An alternative navigation method is to use
the choice widget on the tool bar.
4.
All dialogs except Markov Probabilities and Smooth Transition have
a "Next Regime" button that appears when switching regimes are specified.
Note that if the parameters in question have not been selected to switch, then
Regime 1 shows the common values for all regimes, and the dialogs for
Regime 2 and above are blank.
5.
All dialogs have a checkbox for selecting parameter bounds and grid plotting.
This shows/hides two columns of text fields for entering bound values see paras 10-14 below. Checking/unchecking the box in any dialog effects
the setting in all the Values dialogs
VALUES FIELDS
6.
The values attained in an estimation run are displayed in the Values fields to
double-precision machine accuracy. These provide the starting values for a
new run, and can be edited.
FIXED PARAMETERS
7.
Check 'Fixed' to fix the parameter at the value set, during estimation.
Applications of this feature include:
*
Suppressing intermediate lags in ARMA/GARCH models (fix the
values at zero).
*
Temporarily restricting a model, without changing the specifications.
*
Computing LM tests of the corresponding restriction(s) - see
81
© James Davidson 2008
*
Options / Test and Diagnostics Options.
Evaluating the optimized likelihood over a grid of points - see paras.
13-14 below and also Actions / Plot Criterion Grid for more details.
8.
If the model specification is changed, values are reset to defaults. To remove
a variable or lag from the model temporarily, "fix" its parameter at zero.
This preserves other stored values.
9.
As a reminder that one or more parameters are fixed, the Values buttons in
the corresponding dialogs are highlighted, and check-marks appear against
the Values menu items.
PARAMETER BOUNDS
10.
To constrain a parameter to lie in an interval, enter the upper and lower
bounds in Values but do not check the 'Fixed' box. The reported parameter
is then a logistic transformation of an underlying, unconstrained value.
The bounds are ignored unless the upper strictly exceeds the lower.
Cancel the setting by putting both bounds to 0.
11.
If the estimate is in the interior of the interval, the standard error is
approximated using the delta method. However, if the constraint binds in
the sample, the covariance matrix may be near singular and standard
errors unavailable or unreliable. It may be best to re-estimate with the
parameter fixed at its boundary value, in this case.
12
It is not recommended to use this technique routinely to impose, e.g.,
positivity and stability constraints on lag polynomials. The search
algorithm should usually work OK without this. The method is implemented
more as a last resort for difficult cases.
GRID PLOTS
13.
If bounds are set and the 'Fixed' box is also checked, the bounds will be
used as the limits of a Grid Plot. Either one or two parameters can enter the
grid. If the 'Fixed' box is checked and both bounds are 0, then the parameter
in question is simply held fixed when the grid is drawn. If three or more
parameter are both fixed and have bounds set, the first two encountered are
the plotted parameters. The others are just treated as fixed in the usual way.
14.
The number of grid points must be set in the Options / Optimization and Run
dialog. The number is counted from zero. Thus, if the bounds are 0 and 1
and it is desired to evaluate at intervals of width 0.1, enter 10 in this text field.
The likelihood will then be evaluated at 11 points, 0, 0.1,0.2,…,1.
WALD TESTS AND LINEAR RESTRICTIONS
15.
To compute a Wald test of joint significance, enable "Wald Tests" in the
Model / Linear Regression dialog, or "Parameter Constraints" in the Model
/ Dynamic Equation dialog. Then check the checkboxes of the variables to
be included in the test.
16.
If the option to test joint significance of the regressors is selected, these are
included automatically, and do not need to be checked her. Any additional
82
© James Davidson 2008
parameters checked here will be added to the test set.
17.
To compute a Wald test of linear restrictions Rb = c, or impose these
restrictions in estimation, the number of restrictions and the elements of c
must first be entered in the Model \ Constraints dialog. Then, refresh the
Values dialog and enter the columns of R' (i.e., the rows of R, transposed)
in the fields displayed.
18.
A restriction can involve any subset of model parameters, and hence can be
spread over two or more number of Values dialogs. It may be helpful to open
the relevant dialogs together and arrange them on the screen in a column.
Restrictions may also be applied across equations and across regimes. Since
only one equation/regime Values dialog can be displayed at a time, use the
choice widgets or "Next..." buttons to switch quickly between them.
19.
For each linear restriction, one parameter must be designated to be "solved"
as a function of the remainder. Make this choice by checking the relevant
"Constrained"/"Wald test" checkbox. There must be same number of checks
in this column as restrictions, otherwise an error message is generated.
It is also the user's responsibility to be sure that the restrictions can be
solved uniquely for the checked parameters - in other words, the square
submatrix of R' defined by the checked rows must be nonsingular. If this
property does not hold, an error message is generated.
5.1 Values / Equation...
This dialog sets the parameters specified for an equation, including specifications
set in either the Linear Equation dialog or the Dynamic Equation / Conditional
Variance / Supplied Function dialogs.
Notes:
1.
The Parameter Bounds / Grid Plotting checkbox affects all the Values
dialogs. After changing the setting press "Refresh" to display/hide the
text fields for entry of parameter bounds.
2.
In multi-equation models, use the either the "Next Equation" button to
cycle through the equations, or the "Equation" choice widget on the tool
bar to switch directly. In regime-switching models, use the "Next Regime"
or the "Regime" choice widget similarly, to see the different regimes.
3.
If a BEKK multivariate GARCH model is specified, the ith columns
of the matrices A_j and B_j are displayed in the dialog for equation i,
as Alphaj(i,k) and Betaj(i,k), for k = 1,...,[number of equations].
Be careful to note how these matrices enter the model - see the main
document for details. Although entered and reported in the same
style, these matrices are not comparable with the multivariate GARCH
specification. Be careful to interpret them correctly.
4.
DCC dynamic parameters are displayed in the Values / Distribution
dialog.
83
© James Davidson 2008
5.2 Values / Equilibrium Relations...
This dialog shows parameters of the equilibrium relation(s).
Note:
1.
If more than one relation is specified, use either the "Next Relation" button
in the dialog, or the "Equation" choice widget on the tool bar, to switch
between them.
2.
At least one of the parameters in this dialog must be fixed at a non-zero
value (the normalized variable). If none is specified manually, the first entry
is automatically fixed at 1 when the equation is run.
5.3 Values / Distribution...
This dialog shows parameters defining the distribution that are not associated
with any one equation in a multi-equation model. These are:
*
the Student t parameters (degrees of freedom and skewness)
*
parameter of the GED distribution
*
parameter of the negative binomial distributions
*
error correlations.
*
Parameters of the DCC multivariate GARCH model
Notes:
1.
In regime-switching models, use the "Next Regime" button to cycle through
the regimes, or "Regimes" choice widget on the tool bar to select a regime
directly.
2.
Covariance parameters of the BEKK multivariate GARCH model,
while not associated with any one equation, are nonetheless displayed in
the Values \ Conditional Variance dialog. See Help page 5.2 for
correct interpretation of these parameters.
5.4 Values / Switching Regimes...
This dialog displays parameters specified in the Model / Regime Switching dialog.
*
In the Markov switching case (including Hamilton's model) these are
the transition probabilities p_{ji} = P(j|i), forming a M´(M-1) matrix.
These are the probabilities of switching from regime i to regime j.
*
In the Explained Switching and Smooth Transition models, the dialog shows
the parameters of these switching models.
Notes:
1.
In the Markov case, the switching probabilities are constrained to be positive
with their sum in [0,1], such that the implicitly defined Mth probabilities are
nonnegative. These are transformed to unconstrained values t_{ji}for
84
© James Davidson 2008
estimation using a logistic map. See the main document for the mapping
formulae. These values are displayed in the output, with standard errors.
2.
To show the t_{ji}values in the dialog, with upper and lower bounds
transformed similarly when shown, check the "Display Logistic
Transformations" checkbox.
3.
By selecting the "Estimate Regime Differences" option, the Markov
switching probabilities can (for example) be constrained not to depend on the
current state. Under this hypothesis, the sample is simply a random mixture of
regimes prevailing with the unconditional switch probabilities. Note that the
null values of the "incremental probabilities" of regimes 2,...,M are 1/M,
corresponding to t_{j2} = ... = t_{jM} = 0.
4.
If regime-dependent coefficients are specified in Explained Switching, use the
"Next Regime" button to cycle through the regimes, or the "Regime" choice
widget on the toolbar to select a regime directly.
5.
Note that specifying only the intercept and regime dummies in the explained
switching model provides another way to estimate the simple Markov
switching model, in an alternative parameterization.
85
© James Davidson 2008
6. Actions
6.1 Actions / Run Estimation
Closes all dialogs, saves the current configuration in "settings.tsm", and starts
estimation of the currently specified model.
To have the dialog box configuration restored automatically after the run is finished,
select this option in General Options. Alternatively, re-open by hand with Actions
/ Restore Dialogs.
Notes:
1.
This command can also be started with the "Run" button on the toolbar, and
with the "Go" buttons in the Model / Linear Regression and Model /
Dynamic Equation dialogs.
2.
Sequential and iterative calculations can be interrupted while in progress, by
clicking the "Run" button on the toolbar. A choice box appears, possibly
after a short delay, with the option of aborting the run, or continuing.
BATCH JOBS
3.
If the checkbox "Run Next Estimation as External Process" is checked
in Options / Optimization and Run before the command is given, the run is
performed externally by starting a new instance of Ox.
4.
If the checkbox "Defer External Jobs" is checked in Options / General, the
Ox file containing the job is created, but not run. Use this option if the
job is to be run on a different machine, for example.
6.2 Actions / Evaluate at Current Values
This command is the same as Actions / Run Estimation except that the
optimization algorithm is not called. The post-estimation output is simply created
at the parameter values currently stored in the Values fields. Note that these are
the estimates, following an estimation run. This option can be used, for example,
to obtain test statistics, forecasts, listings etc. for a model that has just been
estimated, without repeating the optimization.
Notes:
1.
This command is also launched by the "Evaluate" button on the toolbar.
2.
If Linear Regression or Cointegration Analysis dialogs are open, the
command has the same effect as the 'Go' buttons and Actions / Run
Estimation.
6.3 Actions / Estimate Multiple ARMA Models
Estimates a sequence of models with increasing ARMA orders, starting with
ARMA(0,0). All other features of the model are as currently specified,
86
© James Davidson 2008
although regime switching options are disabled. The limits of the sequence are
set in the Setup/Multiple ARMA Models dialog.
Notes:
1.
Starting values are set to either the estimates from the preceding
specification, or zero, as appropriate. The ARFIMA(0,d,0) is initialized
with Robinson's (1994) nonparametric estimator of d.
2.
Other selected model features (regressors, conditional heteroscedasticity,
supplied function) are estimated as usual, with the supplied starting values,
for each case.
3.
Post-estimation options (forecasts, correlograms, graphics, impulse
responses, tests, series output and retrieval) are suspended. Re-estimate
the selected model to get these outputs.
4.
This option cannot be used in conjunction with regime switching, nor
with multiple-equation models.
5.
The model optimizing each of the selection criteria (Schwarz, Hannan-Quinn
and Akaike) is reported following the run.
6.4 Actions / Automatic Regressor Selection
Given a baseline model containing N regressors of one or more Types
(including current and lagged values of some variables, typically), this
option estimates all the 2^N possible models formed by taking subsets of
the full regressor set. It then reports the case which optimizes the chosen
selection criterion, which can be either the Akaike (AIC), the Schwarz
(SIC) or the Hannan-Quinn (HQC).
Notes:
1.
Optional settings are selected in Setup / Automatic Model Selection
(regressor Types), which also features an alternate launch button, and
Options / Tests and Diagnostics (selection criterion).
2.
The program excludes regressors from the baseline specification by
turning their "Fixed" flags on, and setting the coefficient values to 0.
In other words, the baseline specification is not actually changed during
the run. To use the selected model for further work, it must be specified
manually in the usual way. If the baseline specification includes regression
parameters that are already "Fixed", this setting is retained and the variable
in question is excluded from the search
3.
The procedure optimizes exhaustively over the model space, looking
at every case, and hence it is path independent and does not depend
on test outcomes. Thus, it is not a "general to specific" search, nor
"specific to general", but in fact both. The limitation is that it cannot
feasibly examine such large model spaces some other automatic
specification search packages that are currently available, which are
87
© James Davidson 2008
selective in the cases they examine.
4.
The procedure can be used with any model except regime switching,
including equation systems, although it only searches over regressor
choices. Any other model features will correspond to the baseline
specification, and the search is conditional on these. Note that the number
of models needing to be estimated may be very large. For example, with 4
variables and 4 lags (+ current values) N = 20 and the choice is over
2^20 = 1048576 cases. This is feasible for OLS, but probably not for
iterative estimation.
5.
There is no option to print all the estimation results. The output includes
the baseline model, and the optimal case.
6.5 Actions / Recursive/Rolling Estimation
This option estimates the same model for a succession of samples, either of
increasing size with fixed starting point (incremental estimation) or fixed size with
moving starting point (rolling estimation). We call these procedures "recursive
estimation", and while they are not recursive in the strict sense of using an updating
formula to modify the estimator with the extra observation at each step, (it is
computed afresh) the current estimates provide starting values for each new step.
See the Setup / Recursive/Rolling Estimation... dialog for details of setting up the
run.
The sequence of results for each sample period can be exported to a file, according
to the setting in Options / Output and Retrieval Options, or viewed as graphics. The
items available are the parameter estimates with 2-standard error bands, plus
(optionally) regression statistics including criterion values, residual moments,
autocorrelation tests, stability (ex-post forecast) tests, and also any tests of
parameter restrictions that have been set up.
Notes:
1.
The sequential model selection criteria are not recorded. These would differ
from the estimation criterion by the same fixed amount in each run, so the
latter contains all the relevant information.
2
If N-step-ahead ex ante forecasting is specified (see Options / Forecasting
and Simulation) the Nth forecast step and standard error (or percentiles for
Monte Carlo forecasting) are reported in the output. By default, N is fixed
so that the actual date forecast moves forward with the sample. There is an
option to keep the terminal forecast date fixed, so that N contracts as the end
of the sample advances. See Setup / Recursive/Rolling Estimation for details.
3.
This command is launched by the "Run" button on the toolbar if the Setup /
Recursive/Rolling Estimation dialog is open.
4.
On checking the "Report Convergence Status" box, a sequence of symbols
is printed in the results window to show the result of each numerical
88
© James Davidson 2008
optimization.
+
denotes strong convergence of the search algorithm
?
denotes weak convergence of the search algorithm
!
denotes failure to converge
(See the Ox documentation for the definitions of these cases.)
This option has no effect in the case of non-iterative estimation.
6.6 Actions / Plot Criterion Grid
Use this option to create a contour plot of the concentrated criterion function.
Parameter bounds must be enabled in the Values / Equation dialog. The number
of grid points selected in Options / Optimization and Run.
The choice of parameters for plotting and the bounds of the grid are set in the
appropriate Values dialog(s). The operation is carried out on the first one, or
two, parameters satisfying the following conditions:
1.
the "fixed" flag is set;
2.
the upper bound exceeds the lower bound.
The criterion function is maximized with respect to all other parameters, holding
the selected one(s) at the grid values. Normal output is suppressed. A progress
bar shows the progress of the calculations.
A choice of contour plot and surface plot is available for the 3D case, set the
option required in Options / Graphics. The "maximum maximorum" is indicated.
The criterion values can also be exported in a table.
Notes:
1.
Other parameters can be either fixed or free for this operation. If a pair
of grid bounds for a fixed parameter are both set to zero, the parameter
is treated as fixed, in the usual way.
2.
Output to the results window includes the grid location of the criterion
maximum, and also locations of the largest values of the test statistics,
including absolute t ratios, diagnostic tests and any specified tests.
This feature can be used to implement tests where parameters are
unidentified under the null hypothesis. The usual procedure is to base
a test on the supremum of the statistic over eligible values of the
unidentified parameter(s).
6.7 Actions / Multi-Stage GMM
This command allows the computation of efficient GMM estimates, where the
weights matrix is estimated to allow for heteroscedastic or autocorrelated errors.
This is a two- or multi-stage procedure, performed by issuing this command
repeatedly. Proceed as follows:
*
Select the covariance formula required ('Robust' or 'HAC' in Options \
Tests and Diagnostics.)
*
Select GMM as the estimator in Setup / Estimators and Sample.
89
© James Davidson 2008
*
Formulate the equation(s) in Model / Dynamic Equation.
*
Select the instruments in Model / Select Instruments
*
To compute the first-stage estimates (equivalent to regular IV/GMM)
give the Actions / Multi-Stage GMM command.
*
To compute the second-stage estimates, using the first-stage estimates to
construct the required residuals, give the Actions / Multi-Stage GMM
command a second time, before any other command.
*
To iterate the procedure, repeat the last command as often as required.
Notes
1.
Giving any other estimation command (for example, Actions / Run
Estimation, or the "Run" button) resets the program, so that the next
Actions / Multi-Stage GMM command yields Stage 1 again.
2.
It may be possible to iterate the procedure to "convergence", so that no
further change in the estimates occurs. However, this procedure does
not optimize the GMM criterion function.
3.
This option is not available for IV estimation from the Model / Linear
Regression dialog.
6.8 Actions / Compute Test Statistic
Opens a sub-menu listing test options
*
Score (LM) Test
*
Moment (M or CM) Test
*
Wald Test of Set Restrictions
*
Specified Diagnostic Tests
*
Bootstrap Test of I(0)
Notes
1.
By default, the statistics printed by selecting these options are
asymptotically Chi-squared with degrees of freedom indicated in
parentheses. The nominal p-values of the tests are shown, enclosed in
braces, following the statistic values.
2.
The option of printing the "F form" of the tests, with associated p-values
from the F tabulation, can be selected with the checkboxes in the relevant
dialogs.
Note: In most cases the F form is to provide an alternative
approximation to the asymptotic Chi-squared distribution. These
tests are exact only in special cases.
SCORE (LM) TEST
3.
This option opens a dialog to allow specification of a test of the significance
90
© James Davidson 2008
of additional regressors selected from the data set. Radio buttons allow
selection of location of the test variables, either the Conditional Mean model
(Equation (1), included as variables of Types 1, 2 or 3) or the Conditional
Variance model (Equations (2)/(3), included as variables of Types 1, 2 or 3).
4.
If the selected Type is assigned to include one or more lags (see Model /
Dynamic Equation or Model / Linear Regression, and Model / Conditional
Variance) then the same number of lags of the test variable(s) are included in
the test set. It is not necessary for the null (estimated) model to contain lags.
Just set the number of lags required (for the relevant Type) with the Lags
scrollbar in Model / Conditional Mean or Model / Conditional Variance.
The degrees of freedom of the test are 'number of test variables x (1+ number
of lags)'. Select the "F form" of the test with the checkbox.
5.
There are two ways to run the test. Pressing "Go" will execute it immediately
using the currently stored parameter values. Otherwise, the test will be
performed following the next estimation run. To cancel the test, press "Clear".
MOMENT (M or CM) TEST
6.
This options opens a dialog to allow specification of a moment test of the
correlation of variables selected from the data set with either
*
the model residuals, or
*
the squared model residuals.
7.
If the Conditional Moment Test option is selected, the joint covariance matrix
of scores and moments is computed using the Robust formula (see Options /
Tests and Diagnostics). If the Moment Test option is selected, the selected
HAC formula is used to compute this covariance matrix. This selection
implies that serial correlation is permitted under the null hypothesis.
Select the "F form" of the test with the checkbox.
6.
Perform the test immediately with the current values by pressing "Go".
Otherwise it will be performed following the next estimation run. Cancel it by
pressing "Clear".
WALD TEST OF SET RESTRICTIONS
7.
This option does not open a dialog, but simply computes the test of the
constraints currently specified in Model / Constraints and the Values dialogs.
The option allows new constraints to be tested on the current estimated
model without re-estimation. If no constraints are specified, it does nothing.
SPECIFIED DIAGNOSTIC TESTS
8.
This command evaluates the optional tests that have been specified in the
Options / Tests and Diagnostics dialog. These are computed automatically
following an estimation or evaluation run, but this method allows additional
tests to be computed without generating the complete estimation outputs.
TEST FOR I(0) DEPENDENT VARIABLE
9.
This option simulates the model currently stored and computes Breitung's
(2002) statistic for the partial sums. The reported Kolmogorov-Smirnov
91
© James Davidson 2008
statistic compares the bootstrap distribution of this statistic with the same
statistic computed for the corresponding i.i.d. shocks. Its object is to
check whether the model dynamics are compatible with sample averages
adequately approximating their asymptotic distributions, in the selected
sample size.
10.
The I(0) test is for single equation models only, and is properly intended for
use with univariate time series models. If the equation contains exogenous
variables, these are held conditionally fixed in the simulations. If they are
nonstationary, this will in general yield a case of the alternative hypothesis.
11.
Choose a number of replications large enough to validate the asymptotic
tables from Smirnov (1948) - say 500. Set the number of replications in
Options / Simulation and Resampling, after checking the "Inference by
Resampling" checkbox to activate the replications scrollbar.
NOTE: This checkbox does not activate the test itself. It can be
unchecked again after the setting is made.
6.9 Actions / Compute Forecasts
This command generates and displays forecasts after a model has been estimated.
Note that, if forecasts are specified prior to an estimation run, they are computed
automatically following the run. This option allows additional results to be
generated.
Note: The command Evaluate at Current Values ("Calculator" button) is another way
to compute specified forecasts, in addition to any specified tests. The complete
output for the run is printed in the results window in this case. This command
does not produce any additional output, and displays the forecast plots
automatically.
6.10 Actions / Retrieve Series
This command adds items such as residuals, fitted values, conditional variances,
switch probabilities and other generated series to the data set. To use it, first
open the Options / Output and Retrieval dialog and check the items to be
retrieved.
Notes:
1.
A fitted model must be present in memory when the command is given, or else
it has no effect. Either an estimation run has previously been performed, or a
previously stored model has been loaded using the Model Manager.
2.
When the Retrieve command is given, the checks in the Options / Output and
Retrieval dialog are removed so that the same items are not saved twice.
3.
Items can be retrieved automatically following a run by checking them in
the Options dialog before launching the run. Choose from the "Once" and
"Always" options in this case. The former removes the checks after saving.
92
© James Davidson 2008
6.11 Actions / Simulate Current Model
This selection generates and displays a stochastic simulation of the current model.
The user is prompted to choose to discard the series after viewing or write to the
data set and, in the latter case, to either add the series as new variable(s), or
over-write the existing dependent variable(s).
Notes:
1.
To select the mechanism generating the artificial shocks, see Options /
Simulation and Resampling Options. The choices are Gaussian, model
(according to likelihood function adopted) and a bootstrap of the current
model residuals.
2.
Create model for simulation in one of three ways: estimate a model, retrieve
a stored model, or type parameter values direct into the Values dialogs.
3.
A dependent variable (or variables) must be selected to act as a 'placeholder',
and provide any start-up values. This can be a dummy such as "Zeros" (see
the 'Make Zeros' option in Setup / Data Transformations and Editing). In
this case all pre-sample lags would be set to zero, but chosen presample
values could be entered using the 'Edit' command in Setup / Data
Transformations and Editing.
4.
To bypass the discard/save prompts, assign this command to one of the
two user-selectable toolbar buttons (see Options / General). When the
button is pressed most recent choices are applied automatically. Use the
menu command to change them.
5.
To simulate without a data set loaded, first use the 'Extend Sample' option in
Setup / Data Transformations and Editing to specify the sample size required
Then create a placeholder variable using 'Make Zeros'.
6.
If estimation is by least squares or GMM, the residual variance is not in the
parameter set, and is estimated extraneously from the residuals. If simulation
follows estimation, the current estimate is used. To specify a model for
simulation without prior estimation, select one of the conditional maximum
likelihood (time domain) estimators. This will allow all the model parameters,
including the error variance, to be entered in the Values dialogs.
6.12 Other Commands
SET DEFAULT VALUES
This command sets all free parameter values to defaults. Fixed values, and all fixes,
bounds and constraint settings, are retained.
CLEAR VALUES
This command has the same effect as pressing the Clear button in all the Values
dialogs. Parameter values are set to defaults, and all fixes (except defaults), bounds,
and constraints are removed.
93
© James Davidson 2008
CLEAR RESULTS WINDOW
If the results buffer becomes full and will accept no more text, use this command to
clear it. Note that its contents can first be first saved to a file, see File / Results / Save
Selected Text.
CLOSE ALL DIALOGS
This command is given automatically before estimation operations are carried out.
Current window positions are stored.
RESTORE DIALOGS
Reverses the action of Close All Dialogs. Use it after an estimation run, and also
after starting the program, to restore the previous window configuration. This action
can optionally be made automatic, see Options / General Options.
Notes:
1.
The actions of Close All Dialogs and Restore Dialogs are duplicated by the
toolbar "Windows" button, which toggles between them.
2.
Dialog positions for open dialogs are saved between runs. Restore Dialogs (or
the "Windows" button) restores your dialog configuration at shut-down.
94
© James Davidson 2008
7. Graphics
7.0 Graphics: General Information
Graphics are displayed in a window whose size is linked to screen resolution.
As many graphs as desired can be open at once. Close them by clicking the
"Close" button in the top-right hand corner, or from the Windows taskbar.
*
Clicking on the "gnuplot" icon in the top-left corner of the window opens
a context menu. Choose "Options" to open a submenu of useful commands.
These include changing the text font, line style and background colour,
sending to a printer, and copying the graph to the Windows clipboard, so
that the image can be pasted into your favorite graphics program.
*
For bitmaps, IrfanView is a highly recommended freeware package, which
can convert an imported image to a variety of bitmap formats such as .jpg.
Note that the gnuplot window can be resized by dragging the corner with
the mouse, and a saved bitmap image will have the same dimensions.
Alternatively, pasting the clipboard into a graphics program such as
CorelDraw results in a vector graphics image that can be edited further,
and saved in various formats.
*
An alternative procedure to save a graph is with the command File /
Graphics / Save Last Graphic. The type of file saved, and bitmap
dimensions, can be selected in the Options / Graphics dialog. Note that line
styles and fonts cannot be selected within the program in this case.
However, the Postscript vector graphics formats (.eps or .epc) can be
imported into graphics programs such as CorelDraw for further editing.
7.1 Graphics / Show Data Graphic
Opens a dialog for selection of graphical representations (time plot, correlogram,
spectrum, histogram and normal QQ-plot) of any variable in the data set.
SIMPLE PLOTTING
*
Select the type(s) of plot required, using the check boxes.
*
Select one or more names in the variable list.
*
Optionally select for the series to be either detrended by OLS, or
differenced, before plotting.
*
Press "Sample ..." to open the Set Sample dialog and choose the sample
required.
*
Press 'Go'. Alternatively, just double-click the name of any series (convenient
for a single plot).
Notes:
1.
Unselect a selected variable by clicking it second time. Press 'Clear' to
95
© James Davidson 2008
unselect all selected variables.
2.
Double-clicking a variable on the list just displays the plot. Selecting with a
single click and then pressing 'Go' plots the variable(s) and leaves them
selected.
3.
Up to 36 plots can be displayed on one page. However, with large
numbers of plots the quality of the display is not too good .
4.
If only time-plots are selected, multiple plots can appear in one graph
by selecting this option in Options / Graphics (see Multiple Series
Display). However, if correlograms or other types of plot are selected,
plots appear in their own graphs in a common frame.
5.
If the Scatter Plot option is selected, the first two highlighted variables in
the list are plotted together - the first on the list is assigned the vertical axis,
(Y) and the second the horizontal axis (X) Reverse the ordering if desired
in Setup / Data Transformation and Editing / Edit / Move Up-Move Down.
If only one variable is highlighted, nothing is plotted. Other options can be
selected at the same time, and will be displayed for all highlighted variables.
6.
In a scatter plot, the two regression lines (Y on X and X on Y) are
superimposed by default. Note that these both pass through, and therefore
jointly indicate, the point of sample means. The more nearly parallel these
are, the higher the correlation between the variables. Unselect this feature
in Options / Graphics.
7.
The sample selected for plotting (Sample 5) is independent of the samples
set concurrently for other program functions. See Setup / Set Sample for
details. If data are missing for part of the specified period, nothing is plotted
for these observations.
MULTI_SERIES PLOTTING
This option allows up to 8 series to be plotted on one graph, with line styles
selected by the user. This option gives the user more control over plotting styles
than is available with simple plotting.
*
Check the "Multi-Series Plot" Checkbox.
*
Choose a line style (1-8) using the radio buttons, and then a variable
from the list - at most one variable can be selected for each style.
*
Repeat for up to 8 series.
*
Press 'Go'.
Notes:
7.
Multiple series plotting only works for time plots. Other types of plot
are shown in the usual way, in separate graphs in a common frame.
Line styles only apply to time plots.
96
© James Davidson 2008
8.
This option over-rides the Multiple Series Display setting in Options /
Graphics.
9.
Line styles can be edited in Options / Graphics.
10.
The 'Scale on Right Axis' checkbox is enabled when two or more series
are selected. If checked, the series with the largest line number is plotted
against the right-hand axis. If more than two series are selected, all the
others are plotted against the left-hand axis as usual.
11.
The 'Centre' and 'Standardize' checkboxes allow the variables to be
relocated and rescaled for comparability. Centre subtracts the mean, and
Standardize also divides by the standard deviation.
12.
If the line type for Line 8 is chosen as 'Band Fill', the selected variable
is used to divide the sample into 'regimes'. If the selected variable is
positive the regime is "On", and if the selected variable is zero or
negative the regime is "Off". The observations of the "On" regime are
indicated by light gray shading in the plot. Typically, the indicator
variable would be a zero-one dummy.
NOTE: Only Line 8 can be given the Band Fill style.
7.2 Graphics / Equation Graphics
The following items can be plotted following an estimation run:
*
'Actual and fitted' series (submenu, time and scatter plots)
*
Residuals (sub-menu)
*
Variance-adjusted residuals (sub-menu)
*
Conditional variances (GARCH and regime switching models only)
*
Regime probabilities (sub-menu, regime switching models only)
*
All the time plots for the model in one frame.
*
Equilibrium relations (sub-menu, error correction models only)
*
Ex ante forecasts (sub-menu)
*
Solved moving average coefficients, impulse response and step response
(submenu)
*
A 2D or 3D plot of the criterion function if computed, see Actions / Plot
Criterion Grid.
*
Plots of the recursive or rolling estimations, if computed (dialog)
*
Kernel density plots of the bootstrap distributions of parameter estimates
and test statistics.
Notes:
1.
In the Residuals, Adjusted Residuals and Equilibrium Relations submenus,
the available options are time plot, correlogram, spectrum, correlogram
and spectrum of absolute values, histogram and kernel density, and
normal QQ-plot. There is an option to display all the representations in
the same frame.
2.
The Actual vs. Fitted scatter plot includes the "Fitted vs. Fitted" line, which
has slope 1 by construction and passes through the point of sample means.
The residuals correspond to the vertical deviations around this line, but
97
© James Davidson 2008
ordered by magnitude of the fitted values instead of the sample time ordering.
3.
Regime probabilities are summed over lags in Hamilton's switching model.
Smoothed regime probabilities are computed by Kim's algorithm, see
Kim and Nelson (1999), pp68-70. When switching probabilities are
explained by exogenous variables, both filter probabilities and the variable
transition probabilities can be plotted. For smooth transition models, the
transition function can be plotted.
4.
Forecasts and solved MA weights can be computed for the equation and
the conditional variance, where this is estimated.
5.
The interpretation of ex-ante forecast time plots depends on the
forecasting method. With analytic forecasting, the plots show the estimated
mean forecast, with optional 2-standard error bands. Standard errors are
not available for bilinear models and user-supplied dynamic models, nor
for conditional variance forecasts in GARCH models.
6.
Monte Carlo forecasting generates the distribution of stochastic simulations,
and the plots show the median forecast and the 2.5% and 97.5% percentiles.
These therefore define a true 95% confidence band, regardless of the error
distribution, and are available for all models, and for conditional variances.
Kernel density plots of the empirical forecast distributions are also available
for any point in the forecast period (selected in Options / Forecast and
Simulation Options).
7.
To change the type or number of forecasts, make the desired selection in the
Options / Forecast and Simulation dialog, then recompute the model, using
either Actions / Run Estimation, or Actions / Evaluate at Current Values to
avoid re-estimating.
8.
To view a plot of the recursive/rolling estimations, either double-click a
parameter/statistic in the list, or select it and press "Go". The rolling
parameter estimates are displayed with 2-standard error bands (the
usual regression standard errors, with covariance matrix formula
selected in Options / Tests and Diagnostics.)
9.
The 'Fill' symbol option is used for probability and variance plots. That is,
the region between the plotted line and the time axis is shaded light gray.
If for any reason a different plot style is required for these series, use the
"Retrieve Series" command to add them to the data set, then plot using the
options in Graphics / Show Data Graphic.
10.
Select the type of plot desired for confidence and standard error bands in
forecasts and recursive/rolling estimation (none, bands or bars) in Options
/ Graphics Options.
7.3 Graphics / Monte Carlo Graphics
The frequency distributions generated by Monte Carlo experiments can be
98
© James Davidson 2008
displayed as kernel densities and histograms. Cumulative frequencies can also
be displayed as an option.
*
Select plots for display by clicking on the list, or pressing 'Select All'.
Unselect an item by clicking again. Remove all selections with 'Clear'.
Plot selected items by pressing 'Plot'.
*
Double-clicking a list item displays the plot, but does not leave the
item highlighted.
1.
The graphic display dialog opens automatically at the completion of a
Monte Carlo run. Alternatively, open it from the menu with Graphics
/ Monte Carlo Distributions...
2.
The bandwidth used to compute the kernel density is user-selectable.
Initially it is set to the default value, displayed as '1' on the scrollbar.
Move the scrollbar to change the ratio of the bandwidth to the default,
then redisplay the plot to see the effect. The chosen value is stored
with the distribution data and used the next time the distribution is
plotted, as shown by the scrollbar.
3.
If the scrollbar setting is changed by the user, the new value is used
for the next plot, and replaces the stored value(s) for the distribution(s)
plotted.
Tip: to avoid changing a stored bandwidth after moving the scrollbar,
close and re-open the dialog before giving the Plot command.
4.
Monte Carlo graphics are stored in the .TSD file created with the Data
Generation Model. If the .TSD file is present, reloading this model makes
the results and plots of the last experiment performed with this model
available to view, just as when the model was run. To save these outputs,
store the DGM under a different name, before using it for a new experiment.
5.
The distributions from a simulation run can be stored in an EDF file to
supply critical values for tests. The currently stored bandwidths for each
distribution are used to compute the EDF kernel densities.
Note: EDF file creation can also be done automatically, using the default
bandwidth, by setting the requisite option in Setup / Monte Carlo
Experiment. The present option can be used to fine-tune the
bandwidths used for each distribution, if required.
6.
Monte Carlo graphics can be stored and displayed independently of the
DGM that produced them. This allows the results of different runs to be
plotted together for comparison.
*
Highlight the plots to be stored.
*
Click on "Add to Store".
*
In the text box that opens, the current name is displayed. Edit or
replace this name to identify the plot in a comparison of DGMs.
*
Click "OK", or press the Return key, to close the text box.
*
Repeat the naming procedure for each plot selected.
99
© James Davidson 2008
Note: The stored plots are saved in the settings file, not in the .TSD file
associated with a model.
7.
To display the stored plots, select Graphics / Stored MC Distributions ... from
the menu.
*
Select and display plots as usual
*
Highlight a name and click "Rename" to re-open the text box and
type a new name.
Note: Only one plot at a time can be renamed.
*
Highlight any number of names and click "Remove" to remove the
graphics from the store.
*
Highlight one name and click "Move Up" or "Move Dn" to change
the order in which plots are displayed
Note: The bandwidths for stored plots can be changed in the same way as
described in 3.
8.
To show two or more density plots in the same graph for comparison
select the Options / Graphics from the menu and then "One Graph" in Multiple
Series Display. The MoveUp/Dn buttons allow control over the colours or
line types used to display each plot, also the order in which legends appear.
Note: Histograms are not displayed for two or more densities in the same
graph, even if this option is selected.
9.
The saved plots can be exported to a spreadsheet file, for subsequent
reloading and/or merging with those stored in a different settings file. Pressing
the "Save Plot Data" button opens the file dialog for saving.
Notes:
*
Reload plots with the command File / Data / Load Tabulations /
Density Plot File.
*
The spreadsheet format is as follows:
Row 1:
Plot names.
Row 2:
Kernel bandwidth index (integer 0-32)
Row 3:
Initial bin ordinate.
Row 4.
Increment (bin width).
Rows 5,....
Histogram values.
100
© James Davidson 2008
8. Options
8.0 Options: General Information and Defaults
By default, only one Options dialog is open at a time. Opening a second dialog
causes the first to close. This behaviour is optional, see General Options.
The <<< and >>> buttons at the top of each window allow easy navigation between
the options dialogs. Pressing them opens the next/previous options dialog, so that
current program settings can be reviewed rapidly.
DEFAULTS
The default settings are as follows. These are selected if the file "settings.tsm" is not
found in the working directory at start-up, or on the command File / Settings / New.
"*" in the left-hand column indicates that this setting is stored with a model,
and hence is liable be changed when a model is loaded.
Output and Retrieval Options:
Save Data to Files of Type .
Export Listings to Files of Type
Save Listings Automatically. .
Print in Results Window
.
Retrieve Generated Series
.
.
.
.
.
.
.
.
.
.
.
XLS
None
No
Correlograms
Once
Test and Diagnostics
*
Q Test Order .
.
.
*
Q-Test Type .
.
.
*
LM Tests
.
.
.
*
Durbin Watson Test .
.
*
Diagnostic Tests
.
.
*
Covariance Matrix Formula .
*
Kernel for HAC Covariances .
*
Bandwidth for HAC Covariances
.
*
Show Residual Moments
.
*
Show Log-Likelihood & Criteria
*
Tests in R^2 Form
.
.
*
Use EDFs
.
.
.
.
.
.
.
.
.
.
.
.
.
.
.
.
.
.
.
.
.
.
.
.
.
.
.
.
.
12
Box-Pierce
No
No
None
Robust
Parzen
[n^(1/3)] for Bartlett,
[n^(1/5)] otherwise.
Yes
Yes
No
No
Forecasting Options
*
Forecast Type. .
.
*
Forecast Method
.
*
# Actuals in Forecast Plot
*
# Monte Carlo replications
*
Compute Confidence Bands
*
Impulse Responses .
.
.
.
.
.
.
.
.
.
.
.
.
.
.
.
.
.
.
Ex Ante Multi-step
Analytic
50
1000
Yes
Impulse
Simulation and Resampling Options
*
Shock Distribution .
.
.
.
Gaussian
101
© James Davidson 2008
*
*
*
*
*
*
.
.
.
.
.
.
.
.
.
.
.
.
.
.
.
.
.
.
.
.
.
.
.
.
.
.
.
0 (system clock)
1
Fixed
No
Yes
No
Once
Equal Tails
99
No
No
No
50
.
.
.
.
.
.
.
.
.
.
.
.
.
.
.
.
.
.
.PNG
No
Yes
YYYY
640x480
Bands
One Frame
Lines
Both
.
.
.
.
.
.
.
.
.
.
.
.
.
.
.
.
.
.
Yes
No
.No
Colour
No
No
Yes
1
1
ML and Dynamic Options:
Maximum ARMA/GARCH Order .
*
MA Polynomial with '+'s
.
.
*
Root of Student t d.f. .
.
.
*
Log of Skewness Parameter .
.
*
Restrict Pre-Sample Lags
.
.
*
GARCH coefficients in Standard Form
*
Type 2 GARCH intercept
.
.
*
Root of GARCH Intercept .
.
*
No. Gauss-Seidel Its in GARCH-M .
*
GARCH-M Trimming Factor .
.
*
Compute EGARCH Likelihood by G-S
*
No. G-S Its. to compute EGARCH .
.
.
.
.
.
.
.
.
.
.
.
.
10
No
2
Yes
No
No
No
2
5
10
No
50
Optimization and Run Options:
*
Report Minimand
.
.
No
*
*
*
*
*
*
Random Number Seed
Shock Variance (Gaussian)
Presample Data
type I fractional
Use Likelihood Model
Enable Bootstrap Inference
Once/Always .
.
Confidence Intervals .
Bootstrap Replications
Fast Double Bootstrap
Bias Correction
Newton-Raphson algorithm
Maximum Iterations .
.
.
.
.
.
.
Graphics Options:
Export Graphs to Files of Type
Save Graphs Automatically .
Display plots using GnuPlot .
Dates Format .
.
.
PNG Image Size
.
.
2SE Band Style for Forecasts .
Multiple Series Display
.
Time Series Plot Type .
.
Criterion 3D Plot Type
.
Density Options:
Histogram
.
.
Normal Curve .
.
CDF
.
.
Colour/Monochrome
.
Keep PLT files
.
Extended Actual-Fitted
'Fill' Probs and Var plots
.
Line Width
.
.
Symbol Size
.
.
.
.
102
© James Davidson 2008
.
.
.
.
.
.
.
.
.
.
.
.
.
.
.
.
.
.
.
.
.
.
.
.
10
3
-1 = Ox Default
0
-1 = Ox Default
-1 = Ox Default
0 (= off).
Yes
500
5
0.85
10
General Options:
Restore Dialogs Automatically
.
Enable Savings Prompts
.
.
Store Model After Each Run .
.
Delete Temporary Files on Exit
.
Automatically Close Options Dialogs
Size of Results Window Text .
.
Echo Results to Console
.
.
Show Tool Tips
.
.
.
Enable Error Recovery
.
Drag-Selection
.
.
Enable Optimization Estimators
.
.
.
.
.
.
.
.
.
.
.
No
Yes
No
No
Yes
12 points
No
Yes
Yes
Yes
Yes
*
*
*
*
*
*
*
*
*
*
No. Grid Points for Criterion Plot
Absolute bound on dynamic params.
Max No. of BFGS Iterations
Iteration Print Frequency
.
Strong Convergence Crit.
.
Weak Convergence Crit.
.
Parameter Rescaling Factor .
Simulated Annealing
.
# SA Iterations
.
Initial Temperature .
.
Temperature Reduction Factor
# Iterations before Temp. Reduction
8.1 Options / Output and Retrievals ...
SAVING DATA FILES
1.
The type of data file saved (.XLS, .CSV, .WKS, .IN7, .DAT or .MAT)
is determined by the extension added to the file name. If no extension is
added by the user, the one selected in this dialog is included automatically.
However, note that the user's choice over-rides the selection in this dialog.
For example, if the name is selected from the list of existing files in the file
dialog, with extension .XLS, the selection here is ignored, if different.
OUTPUTTING TABLES AND SERIES
2.
The following series can be either printed in the results window, or
exported to a file.
*
The actual data series, Y_t.
*
The fitted series Yhat_t, followed by the ex post 1-step forecasts,
if specified.
*
The residuals Y_t - Yhat_t (solving equation (1) for u_t at the
estimated parameters) followed by ex post 1-step forecast errors,
if specified.
If conditional heteroscedasticity options are selected, also
*
The variance-adjusted residuals , followed by ex post 1-step
adjusted forecast errors, if specified.
*
The estimated conditional variances, followed by ex post 1-step
variance forecasts, if specified.
103
© James Davidson 2008
If a smooth transition model specified, also the transition weights.
If Markov-switching regimes are specified, also
*
The filter probabilities
*
The smoothed probabilities
*
For explained switching models, the transition probabilities for
Regimes 1 to M-1.
In regime-switching models the residuals are computed as weighted
averages of the regimes, using the filter probabilities as weights.
Note: In the case of the Probit model, generalized residuals replace
variance-adjusted residuals.
EXPORTING AND PRINTING LISTINGS
3.
The Export Listings option controls the export of the items listed under 2.
Select a radio button for the type of spreadsheet file or ASCII file to
save. The files are identified by a descriptive name and the current run ID.
4.
Check the checkbox "Save Listings Automatically" to have all the series
associated with an estimation run saved to a file of the selected type. If this
box is not checked, specific outputs from the latest run can be saved
individually as required, by selecting the menu items under File / Listings /.
5.
To distinguish sample and ex-post forecast periods in the output file, an
extra column is printed with an indicator variable, 0 = sample, 1 = forecast.
6.
Check the boxes in "Print to Results Window" to have the items appear
on the screen. Large screen listings are best avoided, since the results
window buffer may fill up rapidly.
RETRIEVING GENERATED SERIES
7.
"Retrieving" series means adding them to the current data set for further
analysis in the program. The radio buttons allow you to choose whether
to retrieve the next run only, and then cancel the option, or keep it
selected. The series are allocated standard names, with numbers
appended to distinguish successive retrievals. They can be renamed
more descriptively in the Data Transformations dialog, if desired.
8.2 Options / Tests and Diagnostics ...
1.
Unless otherwise indicated, the test statistics controlled through this dialog
are by default asymptotically Chi-squared with degrees of freedom shown in
parentheses. The nominal p-values of the tests are shown, enclosed in braces,
following the statistic values. F-versions of the tests can be optionally
substituted.
Q TESTS FOR SERIAL DEPENDENCE
2.
Q tests for autocorrelation in levels and squares are printed after every
estimation run. The upper limits to the Q test order and correlogram
order are set at (number of observations)/3. In models where varianceadjusted residuals are defined (GARCH, regime switching), the Q
104
© James Davidson 2008
statistics are computed for these series.
3.
Check the 'Ljung-Box' radio button to use the Ljung-Box (1978) formula
for the Q statistic, otherwise, the Box-Pierce (1970) formula (the default).
DIAGNOSTIC TESTS
4.
Preset diagnostic tests are available in score test and conditional moment
test versions. The option of printing the "F forms" of the diagnostic tests
can be selected with the check box. This provides an alternative
approximation to the asymptotic Chi Squared distribution. Note that
these tests are not exact except in special cases.
SCORE (LM) TESTS
5.
The following pre-set score tests are available. In each case, the score of
the extended model at the null parameter values is tested. The extensions are:
*
Autocorrelation: lagged residuals in equation (1).
*
Neglected ARCH: lagged squared residuals in equation (2), or
absolute normalized residuals in equation (3), if EGARCH is
specified.
*
Nonlinear Functional Form (RESET): Integer powers of the fitted
values of the null model in equation (1).
*
Heteroscedasticity: square of the fitted values in equations (2)/(3).
*
AR common factors: p lags of Type 1 regressors in a model with
AR(p) errors specified.
The number of lags to be included, and the order of polynomial in the
fitted values, can be selected with the scroll bars. These statistics are
indicated in the output by "(LM)" after the description.
6.
If no conditional variance is specified in the null model, the LM tests for
neglected ARCH and heteroscedasticity is performed by regressing
squared residuals on lagged squared residuals or the squared fitted value,
respectively. Otherwise, the test variable(s) are added to the conditional
variance model as regressors.
7.
The test variables are designated regressors of Type 3 if a MA (GMA)
component is selected, and of Type 2 if a AR or FI (GAR or FIGARCH)
component is selected, and otherwise of Type 1.
NOTE: test variables cannot be assigned to a Type for which lags are
already selected. If lags are specified for Type 1 variables, the test
may be unavailable. A warning message is printed in this event.
8.
The AR common factor test is enabled in the following case: a model
with Type 1 regressors, current values only; no Type 2 regressors;
and an AR(p) error process is specified, but not a fractional process.
The null hypothesis is that p lags of the regressors are not independently
significant, in other words that there are common AR factors shared by
the dependent variable and regressors in the model, so that AR errors
are valid representation of the dynamics.
9.
The 'T.R^2 form' option gives a choice of small sample approximations
for diagnostic LM tests on the mean model. The default is to report the
105
© James Davidson 2008
statistic W/(1 - W/T), where W is the usual LM statistic, and T is the
sample size. If W takes the usual form of TR^2 in the artificial regression
of the residuals on the gradients under H0, the default is therefore
TR^2/(1 - R^2). (In a linear model, this is equivalent to normalizing the
statistic with the unrestricted residual variance under the alternative.)
Note that the asymptotic distributions are the same under H0. Select the
option to report W itself. When the 'F-form' of the statistic is selected,
this option is unavailable.
CONDITIONAL MOMENT (CM) TESTS
10.
Five conditional moment tests are pre-set. The hypotheses under test are
the following.
*
Autocorrelation: correlation between current and lagged normalized
residuals.
*
Neglected ARCH: correlation between current and lagged squared
residuals.
*
Nonlinear Functional Form: correlation between the normalized
residuals and integer powers of the fitted values.
*
Heteroscedasticity: correlation between the squared normalized
residuals and the squared fitted values.
*
Test for AR common factors: correlation between the normalized
residuals and lags of the Type 1 explanatory variables. (see para.
9 above).
*
Information Matrix Test: expected value of the difference between
the information matrix and outer product of the score.
11.
Note that in GARCH-type models, CM tests use the normalized (varianceadjusted) residuals as the test covariates. In tests for neglected ARCH, at
least fourth-order moments must exist, and failure of this assumption can
invalidate test results - caution is advised when interpreting the findings.
12.
CM diagnostic tests are always computed with the joint covariance matrix
of scores and moments computed by the robust method (see 12. below).
Moment tests can also be specified using one of the HAC estimators,
see Actions / Compute Test Statistics / Moment Tests.
13.
The CM and LM tests are unavailable for use with the Whittle estimator.
The information matrix test is also unavailable with the least squares and
GMM options, since the derivation of this test assumes the criterion function
is a log-likelihood.
OTHER DIAGNOSTIC TESTS
14.
The Information Matrix test is available only for estimation by Maximum
Likelihood. It compares the inverted information matrix with the robust
covariance matrix estimator, having k(k+1)/2 degrees of freedom when
k parameters are estimated. This can be used as a guide to correct model
specification, and can also indicate best choice of covariance matrix formula.
15.
The Nyblom-Hansen model stability test is available as a whole-model test
(degrees of freedom equal to the number of fitted parameters, including
residual variance) and, optionally, as one-degree-of-freedom tests for
106
© James Davidson 2008
individual the parameters. Check the "Indiv." checkbox for the latter option.
These are not printed by default since the output is potentially bulky. Note
that the tests use the table given in Hansen (1990), and the p-values are
available in inequality form.
16.
The Durbin Watson test is included only for heritage reasons. It is
asymptotically equivalent to the Box-Pierce Q statistic for 1 lag. The LM or
CM tests for residual autocorrelation are recommended in a regression
context.
17.
Use the 'Coded Test' checkbox to activate/deactivate a test statistic that
has been supplied by the user as Ox code (see Appendix C). This
checkbox has the same function as the 'Test' checkbox in the Model /
Coded Function dialog. It is disabled unless code is loaded and the
'Test Only' option is selected in Model / Coded Function. In the case
where other Ox code is being compiled, this test option should be
controlled from the same dialog.
18.
The KPSS, RS and HML tests are alternative tests that the residuals are
I(0). These are also available for data series from the Setup / Summary
Statistics dialog, and may be useful in conjunction with the ADF and PP
tests in the context of cointegrating regression. For the truncation parameter
c and bandwidth parameter L, use the default values or see Harris et. al (2006)
for guidance.
BOOTSTRAP TEST OF I(0)
19.
Check this checkbox to run the test following an estimation run. This test can
also launched from the Actions / Compute Test Statistics menu. For further
details see Section 6.8 of the Users's Manual.
NOTE: Bootstrap inference for the equation itself is disabled if this option is
selected.
COVARIANCE MATRIX FORMULAE
20.
Four methods of calculation are available for computing covariance matrices:
*
'Standard' corresponds to the information matrix in ML estimators,
and is generally appropriate for correctly specified models with iid
errors.
*
'Robust' allows for mis-specified likelihoods and heteroscedastic
but independent errors.
*
'HAC' is for models with residual autocorrelation as well as
possible heteroscedasticity.
*
'KVB' selects the inconsistent estimator proposed by Kiefer,
Vogelsang and Bunzel (2000).
21.
The method selected here is used for equation standard errors and also
Wald and LM tests. M statistics use HAC, and nonparametric tests of I(0)
(see Actions / Compute Summary Statistics) use HAC. Whittle estimates
use HAC if KVB is selected.
22.
The KVB estimates correspond to HAC using the Bartlett kernel and
bandwidth equal to sample size. Note that they are inconsistent, but yield
107
© James Davidson 2008
asymptotically pivotal tests based on a nonstandard distribution. P-value
inequalities are reported from the published tables, and are identified in the
output with the @ symbol .
23.
KVB can be implemented for nonlinear models and GMM at the user's
discretion, but take care to note that asymptotic distribution results for these
cases are not available to date. See the citations in the main document for
further details.
HAC KERNEL FORMULAE AND BANDWIDTH
24.
The kernel formula selected here is used when the HAC covariance matrix
is selected. It also determines the choice for Phillips-Perron, KPSS and RS
tests, and Fully Modified Least Squares estimation. It does not effect the
kernels used in density plotting and nonparametric regression, which are
Ox defaults and cannot be changed by the user.
25.
There are three options for selecting the HAC bandwidth
*
Manual selection using the scroll bar
*
The automatic 'plug-in' method due to Andrews (1991)
*
The automatic 'plug-in' method of Newey and West (1994).
26.
Check the 'Prewhitening' checkbox to prewhiten the data by a VAR(1)
regression, prior to computing the HAC covariance matrix, V.
V then is 'recoloured' as DVD' where D = (I - A)^(-1) and A is the
VAR coefficient matrix.
NOTE: Use prewhitening with caution! It may inappropriate, e.g., in
construction of test statistics for I(0) by overcompensating under the
alternative.
27.
The plug-in bandwidths are set as the minimum of the value returned by
the formula and (sample size)/2. Larger bandwidths can be set manually.
MODEL SELECTION CRITERIA
28.
A model selection criterion is needed for three automated model selection
features.
*
Automatic regressor selection (see the Actions menu and Setup /
Automatic Model Selection).
*
Lag selection in the augmented Dickey Fuller test.
*
Lag selection in the Stock-Watson/Saikkonen augmented least squares
estimator for cointegrating relations.
The radio buttons allow a choice of the Akaike, Schwarz and Hannan-Quinn
criteria for these purposes.
LM TESTS OF RESTRICTIONS AND "FIXED" VALUES
29.
Check the 'LM Tests of Parameter Restrictions' box to compute the score
(LM) statistic for restrictions imposed on the parameters in the "Values"
dialogs. There are two modes of operation of this option. If parameter
constraints have been activated in the Parameter Constraints dialog, these
restrictions only are tested. If parameter constraints are not set, but
parameters have been fixed in the Values dialogs, a test of the fixing
restrictions is generated. This scheme allows testing of one set of restrictions
108
© James Davidson 2008
while simultaneously including others in the maintained hypothesis.
NOTE: This option is not available for linear regressions. Use Wald tests
to test restrictions in this context.
SUPPLYING AN EDF FILE FOR P-VALUES
30.
Check the box "Use EDF from File for p-Values" if tabulations of test
distributions has been created by Monte Carlo simulation of the null
hypothesis. The currently loaded EDF file is used to supply p-values
for each test for which a tabulation exists in the file. In the case of
significance tests (t-tests) the parameter's name must match a name in
the file.
Notes:
1)
P-values taken from the EDF are marked with a '$' in the output.
2)
See Setup / Monte Carlo Experiments for details of the EDF file
format.
3)
EDF files can be read and plotted in Setup / Look Up Tail
Probability and Setup / Look Up Critical Value. To read off a
p-value, type the test statistic into the first 'Tail Probability'
dialog.
4)
EDF files are spreadsheet files, recommended format is '.xls'. They
can be loaded as data files, inspected and merged in TSM.
31.
If tabulations for several sample sizes are created, these can be merged into
a single EDF file. Use the command File / Data / Tabulations / Merge EDF
File to merge a file on disk with the one resident in memory. These
tabulations will be used to calculate p-values by interpolation.
For example, suppose tabulations for T = 50, 100, 200 and 500
observations have been created and merged. If the actual T is 150, a
weighted average of the tabulated p-values is returned, with weight
w = ((200 - 150)/(200 - 100))^2 = 0.25
on the case T = 100, and 1 - w = 0.64 on the case T = 200
(i.e., greater weight on the larger sample size than with a linear
interpolation). If T exceeds the largest tabulated sample size or is less
than the smallest, then the nearest values are used with weight 1.
8.3 Options / Forecasting ...
FORECASTS
1.
The levels forecasts include 2-standard error bands. These are asymptotic
and do not allow for parameter uncertainty. For conditional
heteroscedasticity models, they are computed dynamically using the
volatility forecasts.
2.
The scroll bar label shows the number of forecast steps selected.
The date or observation number of the final step, which depends on the
sample selection (see Setup / Set Sample) is shown above the scroll
bar.
3.
There is no limit to the number of ex-ante forecasts. To increase the
maximum, select it, then close and re-open the dialog. However, in models
containing exogenous variables (other than the trend and GARCH_M terms)
109
© James Davidson 2008
the limit is set by the available post-sample observations.
FORECAST TYPE
4.
"Ex ante" multi-step forecasts use the lagged forecast values to projected
two or more steps forward. "Ex Post" 1-step forecasts are simply the fitted
values of the model (using actual values of all lagged and explanatory
variables) for the selected forecast period. This cannot exceed the available
observations, so the estimation sample must be set appropriately.
5.
By default, the forecast period for ex-post forecasts is set to the maximum
available observations following the 'Last Observation' set in the Setup /
Set Sample dialog. If this setting is changed, the number of forecasts is
adjusted to the default. To include fewer than the maximum number of
observations in the forecast period, change this setting after setting the
estimation sample.
6.
Ex post forecasts and forecast errors are displayed in the Actual/Fitted
and Residual plots. The main purpose of this option is to check model
stability. Two test statistics are computed, appropriate to short and long
forecast periods respectively. The chi-squared (short-period) test
(Forecast Test 1) is the generalization of Chow's (1960) second test.
and depends on the additional assumption of Gaussian disturbances under
the null hypothesis.
7.
The second test reported depends on the model. In single equation linear
regression models, Chow's stability test statistic is reported (choose
between F and Chi-squared forms by checking the box in Options /
Tests and Diagnostics.) In other cases, where the need to re-estimating
the model for sub-periods precludes generalizing the Chow procedure,
a difference-of-means test applied to the squared residuals and forecast
errors. This is asymptotically N(0,1) as both periods tend to infinity.
This is called Forecast Test 2. If it is desired to compute this statistic
for the linear regression case, simply open the Dynamic Equation dialog
and select Actions / Evaluate at Current Values.
MULTI_STEP FORECAST METHOD
8.
Two methods of computing forecasts and associated standard error bands
are provided. The analytic method computes formulae for the mean and
standard error of the forecast, and the plots show two-standard error bands
corresponding to 95% confidence bands when the errors are Gaussian.
9.
Lagged dependent variables entering through the AR or fractional model
components in the Dynamic Equation dialog are replaced by forecast
values to yield a true multi-step forecast. However, please note that
lagged dependent variables included as Typed regressors (in the Linear
Regression dialog for example) are *not* substituted in this way.
True multi-step forecasts are not computed for this case.
10.
The Monte Carlo method uses the fitted model to compute stochastic
simulations of the process, and reports quantiles of the empirical distribution
for each step. In this case all models, including those containing lagged
110
© James Davidson 2008
dependent variables as regressors, are computed by dynamic simulation.
Hence, true multi-step forecasts are reported in this case.
11.
Two types of Monte Carlo plot are available. Time plots show the median
and 2.5% and 97.5% percentiles, so that the plotted bands in this case
show a true 95% confidence interval (neglecting estimation error) even
when the disturbances are non-Gaussian. Alternatively, kernel densities can
be displayed, for the complete empirical distribution of any forecast step.
12.
Analytic standard error bands for regime switching models use a recursive
algorithm, involving m^K function calls for M regimes and K steps ahead.
In Hamilton's model, the number of effective regimes is M^(number of lags).
Unless they converge rapidly, these calculations can become very time
consuming. They are therefore terminated automatically after 100 seconds
has elapsed. Unless the bands have converged sufficiently to be extrapolated
thereafter, only the point forecasts are reported for the remaining steps.
(NB: diminishing returns set in rapidly! Even raising this factor substantially
could yield at most a couple of extra steps.)
13.
The display mode for standard error/confidence bands, including omitting
them, can be selected in Graphics Options.
14.
In dated (daily/weekly) data, it is not possible to plot forecasts with date
information beyond the end of the observed sample, since the information is
missing. An error message is displayed. In this case, either change the date
type to "No Dates", or extend the data set and supply the additional dates
manually (This must be done outside TSM).
MONTE CARLO SETTINGS
15.
The default number of replications is 1000.
16.
Select either the mean or the median of the Monte Carlo distribution for
reporting. In the former case, 2-standard error bands are also shown
in the plots, and in the latter case, the 2.5% and 97.5% quantiles are
shown.
17.
To select the simulation mode and change the random number seed see
Options / Simulation and Resampling.
18.
The scroll bar allows selection of one of the forecast periods for a density
plot. Note that the maximum selection varies with the setting for number
of forecasts.
ACTUALS IN FORECAST PLOT
19.
It is usually helpful in a post-sample plot to show some, but not always all,
of the series for the estimation period. The default is to include the last 50
observations. This can be changed, and to include all available observations,
simply enter any value large enough. Note that when the forecast period
includes or overlaps the data period (as for ex-post forecasts) the actual
values are always shown.
111
© James Davidson 2008
CONFIDENCE BANDS
20.
By default, confidence bands are enabled. It may be desirable to switch
them off if, for example, a user-coded function contains lagged adjustment.
These dynamics cannot be taken account of in the analytic formulae, which
will therefore be incorrect.
PLOT DISPLAY
21.
Ex ante forecasts can be viewed by listing values in the results window (see
Options / Output and Retrieval) or graphically (Graphics / Ex Ante
Forecasts). Check the "Display Forecasts Automatically" checkbox to
have the main graphs displayed immediately a forecast is run. Use the
Graphics menu to display plots individually, and additional items such
as Monte Carlo distribution plots.
IMPULSE RESPONSES
22.
The impulse responses (coefficients of the solved moving average process)
for levels and also conditional (ARCH/GARCH) variances, will be plotted
according to the radio button setting, in either impulse form, or step
(cumulated) form, or with both plots on the same graph.
23.
In a system of N equations, the responses shown are those on a dependent
variable of an impulse to its own shock process only (N plots). If the "System"
checkbox is checked, then the responses on each dependent variable of
impulses to each shock process are calculated (N^2 plots). This checkbox has
no effect in a single equation model.
24.
There is no limit to the number of steps possible. To increase the maximum,
select it and close-open the dialog.
25.
Only the own-shock responses can be listed in the results window. For a
listing of the full set, export the data to a listing file (see File / Listings / Save
MA Coefficients).
Note: Only the impulse responses are exported. Compute the step
responses manually by cumulation, if required.
8.4 Options / Simulation and Resampling ...
SIMULATION OPTIONS
1.
There are six ways to generate artificial shocks to drive the one-off
simulations, Monte Carlo experiments and bootstrap tests. See the main
documentation for details and formulae.
*
'Model' uses the distribution specified by the likelihood function, if a
maximum likelihood estimator is specified. If the estimator specified
is not ML, then Gaussian shocks are used with variance equal to the
residual variance from the last estimation.
*
'Gaussian' uses normal random numbers with zero mean and the
variance specified in the text field provided.
*
'Bootstrap/Block Bootstrap' randomly resamples the actual residuals,
112
© James Davidson 2008
with replacement. The resampled series is centred and multiplied by a
bias correction factor of 'sample size/degrees of freedom' (i.e., n/n-k).
The block bootstrap is implemented by choosing a block length > 1.
*
'Sieve-AR Bootstrap', an alternative to the block bootstrap for
dependent data, whitens the residuals before resampling.
*
'Wild Bootstrap' preserves the heteroscedasticity of the original
sample. Instead of randomly resampling, the data are randomly
transformed by a drawing from a two-point discrete distribution.
*
The wild bootstrap and sieve-AR methods can be combined, for
dependent, heteroscedastic samples.
*
The Fourier bootstrap resamples from the discrete Fourier transform
of the residuals using the Rademacher wild bootstrap, and returns
the inverse transform of the resampled series. An alternative to the
sieve-AR, suitable for Gaussian homoscedastic residuals showing
generalized autocorrelation.
2.
Optionally (see the checkbox) the 'Model' method will always be used for
one-off simulations and Monte Carlo experiments. This setting allows the
specification of a Monte Carlo experiment where the bootstrap is used for
tests, without the need to set up different for data generation and
estimation.
3.
The wild bootstrap variants are not available for Monte Carlo forecasts. If
these options are selected, the regular bootstrap is substituted.
4.
The random number seed is an arbitrary set of decimal digits. If set to 0
(default) the actual seed will be generated by the system clock, and every run
will be different. Otherwise, the seed entered here will be used to initialize
random number generation for each Monte Carlo forecast and stochastic
simulation.
5.
The setting 'Shock Variance' is available for Gaussian shocks only. If 0
is entered in the text field , then the sample variance from the most recent
estimation is substituted. If this value is zero (as if no estimation has been run
in the current session) then 1 is substituted.
6.
The block bootstrap option is to allow valid bootstrap inference in misspecified models with autocorrelated errors, provided the autocorrelation is
not too persistent. The chosen block length value is shown as a power of the
current sample size.
7.
When 'ML Model' is selected, the parameters of the shock distribution are
those shown in the Values / Condition Variance and Values / Distribution
dialogs. In this case the setting of 'Shock Variance' is ignored.
8.
By default the sieve-AR method used an increasing function of sample size as
maximum lag order. For this case, enter "-1" in the Max Sieve-AR Lags text
113
© James Davidson 2008
field. Setting a zero or positive value over-rides the default. Setting "0" is
equivalent to the regular bootstrap method.
9.
If 'bootstrap' is selected and the random number seed is set to -1, the
shock-generation procedure returns the actual model residuals, in original
order. The generated series should then be identical to the original data
series, apart from possible rounding error. This feature provides a check
that the simulation module is inverting the fitted model correctly. (Note
that to generate Markov-switching models also requires a latent switching
process, so this check will be valid only if the Markov transition matrix is
fixed at the identity matrix.)
10.
The option "wild bootstrap skewness" sets the parameter 'a' such that the
t-th drawing is e.u_t where u_t is the sample value (fixed), and e = a and
-1/a with probabilities 1/(1+a^2) and a^2/(1+a^2) respectively. Note that
this setup preserves the first two marginal moments of the distribution.
The default is a = 1, which always yields a symmetric distribution, but
preserves kurtosis. Setting a = 1.618 preserves the original skewness
(if any) but doubles the kurtosis. The value of the Kolmogorov-Smirnov
statistic, comparing the fit of the original data points to the bootstrap
distribution, is reported to aid the best choice of this value.
SIMULATION PRESAMPLE MODE
11.
If a dynamic simulation run starts at observation 2 or later, the initial
observations can be generated in two ways, either fixed or random.
If fixed, the actual values of the selected dependent variable are used.
If random, the sequence is randomly set in each replication, using
generated or resampled shocks and the specified model. In other words,
the simulation actually initializes at date 1, whatever the nominal start
date.
*
If a partial sum process (unit root) is specified, the cumulation
begins at the start date, not at date 0.
*
The random presample option can be selected for Monte Carlo
experiments. Fixed (actual) values are always used for bootstrap
tests and Monte Carlo forecasts.
*
The setting makes no difference if the simulation start date is 1.
TYPE I FRACTIONAL PROCESSES
12.
A fractional (ARFIMA) model has long memory, and can depend
significantly on remote pre-sample influences. If these processes are
simulated by setting presample shocks to zero (the 'type II' model),
this changes the distribution of estimators and test statistics even in large
samples. The 'type I' model can in principle be simulated by selecting
the random presample option and setting a long presample period.
However, the number of lags required for a good approximation may
be excessive. The option 'Generate Fractional Series as Type I' (set
by default) simulates the effect of presample lags by adding a single vector
(or matrix) of Gaussian random variables with the correct covariance
114
© James Davidson 2008
structure. Selecting this option ensures that (e.g.) bootstrap distributions
match the type I case.
Notes:
1)
With this option the fractional process must be stationary, i.e.,
d < 0.5. To simulate a nonstationary process, replace d by
d - 1, and check the option "Impose Unit Root" in Model /
Dynamic Equation.
2)
The option is not available in conjunction with regime switching.
A type I process is always generated in this case.
3)
If the Presample data are held fixed in the simulations (required in
bootstrap and Monte Carlo forecasting) estimates or imposed
values of the presample shock components must be available.
The number of these to be included is set in the "type I Fractional"
text box in Options / General; if the setting is zero, the type II
process is generated.
INFERENCE BY RESAMPLING
13.
Two methods are implemented for generating confidence intervals and
p-values by resampling the data, rather than by asymptotic criteria.
*
The bootstrap simulates the specified model using the TSM
simulation engine with randomly drawn artificial disturbances.
These can be either drawn from a known distribution, such as
the normal or Student's t, or resampled from the empirical
distribution of the estimated residuals. Monte Carlo simulation
of the estimation procedure yields the bootstrap distribution.
*
Subsampling is the method of fitting the model to successive
contiguous subsamples of the data set, and constructing the
empirical distribution of the subsamples. It does not involve
drawing random numbers.
14.
The output is available in the form of confidence intervals, p-values and
plots of the empirical distributions generated.
15.
By default, resampling is deselected automatically after a single run
("Once"). There is an option to select it permanently as the inference
method ("Always"). Selection is indicated by a flag on the status line,
'(B)' for bootstrap and '(S)' for subsampling.
16.
The number of replications determines the accuracy with which the p-value
is measured. However, because of the small-sample error in the p-value
(due to replacing actual with estimated parameters) the accuracy attained
from a large number of replications is typically spurious. The default of 99
(implying accuracy is bounded by 1%) is probably adequate in many cases.
399 would be sufficient in nearly every case.
17.
The bias correction option subtracts an estimate of the bias from each
115
© James Davidson 2008
parameter point estimate. This is computed as the difference between
the mean of the bootstrap distribution and the point estimate (estimating,
respectively, the mean of the estimator distribution and the true value).
18.
The fast double bootstrap is a device aimed at reducing the error in
rejection probability of bootstrap tests. It is not guaranteed to improve
performance in all cases, but showing that test outcomes are invariant to
this selection offers additional robustness.
RESAMPLING CONFIDENCE INTERVALS
19.
Resampling allows true confidence intervals for parameters to be estimated.
Three schemes for 95% confidence intervals are implemented.
Equal tails:
2.5% of probability mass in each tail, but if the
distribution is skewed, the point estimate is not
the mid-point of the interval.
Equal tails percentile t:
intervals based on quantiles of the distribution of
t statistics, weighted by standard errors from the
resampling distribution.
Symmetric percentile t:
intervals based on 95% quantile of the absolute
t statistics, centred on the point estimates, but
tail probabilities are unequal if the distribution
is skewed.
NEWTON-RAPHSON ALGORITHM
20.
The model is re-estimated with simulated data in each replication. For
models estimated through the Dynamic Equation dialog, this means
numerical optimization. Since the "true" values (defining the artificial DGP)
are available for starting values, the Newton-Raphson algorithm is used
for these steps. The (numerical) Hessian of the criterion is evaluated at the
true point.
21.
Numerically precise convergence is not required to reproduce the
distribution adequately. The time taken in the replications can be controlled
by both limiting the maximum number of NR iterations, or raising the
convergence criterion, or both.
22.
NR is always used for bootstrap iterations. The algorithm can optionally
be used for Monte Carlo experiments (instead of BFGS) by checking the
checkbox.
8.5 Options / Graphics ...
GRAPHICS FILE FORMATS
1.
The graphics output formats available depends on the platform and the
program configuration.
*
PNG is a standard bitmap format, providing an exact image of the
116
© James Davidson 2008
displayed window in the dimensions specified (see below).
IrfanView is an excellent free graphics program for Windows that will
display PNGs, and also convert them to JPG, EMF, GIF and other
popular bitmap formats.
*
EPS and EPC are vector graphics formats. They can be viewed with
the free package GhostView, which will also convert them to PDF.
They can be loaded directly into Word and TeX documents, and can
also be edited in various drawing packages.
*
The GIF option works in UNIX/LINUX, but does not work currently
on the Windows platform.
2.
If the checkbox "Save Automatically" is checked, every graph is saved to disk
in the chosen format, at the same time it is displayed. Otherwise, the menu
item File / Graphics / Save Last Graphic saves the one most recently
displayed.
3.
.GWG (GiveWin format) files are created if the compiler directive
#DEFINE OXDRAW appears in the run file. This option loads the
OxDraw graphics package, and disables GnuPlot, so display within the
program is not available. The format settings in this dialog are ignored. See
the main documentation for more details.
4.
Checking the option "Monochrome Plots" yields graphics suitable for
reproduction in black and white. Coloured lines are replaced with patterns
(solid, broken, dotted etc.) In Windows, these patterns can be edited
by clicking the top left corner of the Gnuplot display window and
choosing Options / Line Styles... .
5.
Files with extension .PLT are created by GnuDraw for processing by
GnuPlot. These are text files that can be edited for further processing
if you know the GnuPlot command language. If the box "Keep PLT
Files" is checked, these files are retained in the results folder after
creating a graphics file. Otherwise they are deleted automatically.
DATES IN PLOTS
6.
By default, when observation dates are specified they are displayed on the
time axes of plots in the format YYYY (the year). Other options are to
show month and year, in the formats MM/YY or MM/YYYY, and to
display observation numbers ("No Dates").
NOTE: With daily/weekday data, the date indication is generally approximate,
since there is no allowance for missing days such as holidays.
However, in most daily data sets with large numbers of observations,
the axis labels will be an adequate approximation.
7.
If individually dated weekly/daily observations are plotted, the dates can
be shown in the additional formats DD/MM/YY or YY-MM-DD, as well as
the styles listed under 7.
8.
The default date display mode is selected automatically when a new data set
117
© James Davidson 2008
is loaded. Alternative settings must then be re-selected in the dialog.
The defaults are:
*
YYYY for annual or quarterly data.
*
MM/YYYY for monthly and higher frequencies.
*
DD/MM/YY for dated (daily or weekly) data.
*
'No Dates' for undated data.
BITMAP DIMENSIONS
9.
The dimensions of PNG bitmaps are selected by entering the numbers of
column and row pixels desired. The default is 640x480. If 0 is entered in
the column (row) field, the setting is automatically calculated as 3/4 times
the row value (4/3 times the column value).
NOTE: These settings do not affect the screen display.
'ACTUAL-FITTED-RESIDUAL' PLOTS
10.
The "Double-Chart" button on the toolbar displays, by default, time plots
of the actual and fitted values and the residuals. The button is disabled until
an estimation has been performed. If the option "Extended Actual-FittedResidual Plots" is checked, two additional plots are shown; the actualfitted scatter plot, and the histogram and kernel density of the residuals,
together with the normal density curve with matching mean and variance,
for comparison.
CONFIDENCE BANDS
11.
By default, multi-step forecast plots show 2-standard error confidence
bands, or 95% estimated confidence bands in the case of Monte Carlo
forecasts.
The following options available for confidence band plotting.
None: also effected by turning off calculations in Options / Forecasts.
Bands: additional lines are plotted to show 95% region.
Bars: the default - 95% confidence region marked by vertical bars.
Fan: coloured bands mark six different confidence regions around the
point forecast. The confidence levels are 40% (yellow), 60%
(ochre), 80% (brown), 90% (mauve) 95% (light purple), 99%
(dark purple).
Notes on fan plots:
1:
Reversing the colour bands is a setup option, see
Appendix B.
2.
Fan plots cannot be combined with other plots, or other
graphs in the same frame. (This is a Gnuplot limitation).
The pre-forecast 'actuals' series is plotted as a 'zerowidth band', coloured dark purple (no symbols).
3.:
Fans are not available for monochrome
plots, or recursive
forecasts. The default option (bands) is used in these cases.
MULTIPLE SERIES DISPLAY
12.
There are three ways to plot several series at once:
*
Individual: each plot in its own frame.
*
Separate plots in the same frame (default).
*
All series in the same plot.
118
© James Davidson 2008
The last option can also be selected in the Graphics / Show Data Graphic
dialog, in which case the style of each line is selectable. Note the option
to plot the last selected series against the right-hand axis in this case.
13.
If a system is estimated, the above three options are available for plotting
the series associated with each equation: actuals, fitteds, residuals etc. If
the "Individual" option is selected, only the series for the equation
selected in the "Equation" choice widget on the tool bar is plotted.
LINES AND SYMBOLS
14.
Series can be plotted by lines connecting the data points (default), by
symbols at the points, or by both. This is a general setting. The choice of
colours and styles for each line can be selected in the "Line Styles" area.
Note that the selection of symbols can be overridden for individual lines
by choosing "None" in the symbol choice widget.
LEGENDS
15.
Legends are used to label series when two or more appear in the same
frame; otherwise, the series name appears as the plot title. There are five
options for placing the legend in the frame:
X:
No legend.
TL:
Top left corner (default)
TR: Top right corner
BL: Bottom left corner
BR: Bottom right corner
Note that these are general settings. It is not possible to place the legend
differently in different plots in the same frame.
16.
Check the "Box" checkbox to enclose the legend in a box. By default,
no box is shown.
CRITERION PLOTS
17.
There are three options for the plot created by Actions / Plot Criterion
Grid. If "both" is selected, the resulting plot is the same as the surface
plot with contours drawn on the 'floor' (p_1, p_2 plane) of the threedimensional graph.
DENSITY PLOTS
18.
These plots are available under Resampling Distributions to display
bootstrap and subsampling distributions, Monte Carlo Distributions to
show the empirical densities of the replicates, and also under Ex Ante
Forecasts to show Monte Carlo forecasts. The basic plots show the kernel
density estimate. Optionally, the plots can also show the histogram (selected
by default) and the normal curve with matching mean and variance. A further
option is to plot the cumulative distribution function (CDF) in a companion
frame.
LINE STYLES
19.
Eight line styles for series plotting can be set by the user.
The selectable option are line colour (or pattern, for monochrome plots),
119
© James Davidson 2008
line width, symbol type, and symbol size. First select the line to be styled
with the radio buttons. Then select options with the line and symbol choice
widgets, and line width and symbol size fields.
*
Available line widths are 1 (thinnest, default) to 6 (thickest).
*
Symbol size can have any positive value, 1 is default.
*
Monochrome lines can take any width, if solid.
*
Patterned lines (dots, dashes, etc.) are always of thickness 1.
Press the 'Restore Defaults' button to set all line settings to defaults.
20.
The Colour/Pattern widget shows different options, depending on whether
the Monochrome Plots option is selected. Note that both settings (colour
and pattern) are remembered. Switching between colour and monochrome
plots does not delete the options.
21.
The eight line styles are can be selected for data series plotting in the
Multi-Series plot option in Graphics / Show Data Graphic.
22.
If a multi-series graph is plotted by selecting 'One Graph' under Multiple
Series Display in this dialog, the line styles are used in order, starting with 1.
23.
Equation graphics are drawn using line styles 1-4.
*
Style 1 is used for the main series in each plot, including the 'Actual'
series in Actual/Fitted plots.
*
Style 2 is used for 'Fitted' series.
*
Style 3 is used for forecasts
*
Style 4 is used for confidence bands.
24.
If multiple equation series are plotted in a single graph, the line styles are
incremented by two, or three, so as to cycle through the available styles.
25.
The symbol option 'Fill' does not draw a symbol, but shades the region
between the line and the zero axis using either light gray in colour plots, or
a hatching pattern in monochrome plots.
This option is used by default in the display of probability and conditional
variance series. Uncheck the checkbox to use the Line Style 1 for these
series.
26.
The "Band Fill" line style is a special option to indicate regimes or time
periods, depending on the value of the selected variable. It displays light
gray bands in those periods when the variable is positive.
NOTE: Band Fill can only be selected for Line 8. Attempting to select
it for Lines 1-7 produces a warning message.
27.
The option "Plot Zero Axis" is selected by default. The zero axis in a
plot is drawn as a light grey broken line. When the option "Scale on Right
Axis" is selected in Graphics / Show Data Graphic there may be two
zero axes marked, for the left- and right-hand scales respectively.
SCATTER_PLOT OPTIONS
28.
Scatter plots styles allow the form, colour and size of symbols to be
chosen. Scatter 1 is used for all data plots, and for actual-fitted plots.
120
© James Davidson 2008
Scatter 2 is used only for the post-sample actual-forecast scatter
when the one-step forecasting option is selected.
29.
By default, scatter plots of data include the two regression lines (X on
Y and Y on X). In the case of the actual-fitted scatter, the single line
with slope 1 is drawn (a 45 degree line when the axes match). These
lines can optionally be suppressed.
30.
The RGB Scatter option colour-codes the plotted points according to
their position in the sample. The initial points are coloured red, those in
the middle green, and the end of the sample blue, with a smooth
interpolation from one colour to the next. Try plotting the scatter of a
variable against the trend dummy to see the effect. Select a 'filled'
symbol (square, circle or triangle) for best results. If monochrome
plots are selected, the coding is a greyscale, running from black to
white. This option is not available for actual-fitted plots which
include post-sample actual-forecast points.
8.6 Options / ML and Dynamics ...
ML PARAMETERIZATION
1.
The residual variance and GARCH intercept are scale-dependent
parameters, bounded below by zero. In some models, such as highly
persistent FIGARCH models, the GARCH intercept can be very small
and estimation close to the parameter boundary poses numerical problems.
These are eased by making the square root (or other fractional power) the
parameter to be estimated. The default value, which works well in most
cases, is 2. Try raising this to 4 if there is evidence of a problem. Set to
1 to estimate the variance/intercept directly. Be careful to set the starting
value and interpret the estimate appropriately.
2.
The Student's t degrees of freedom (d.f.) parameter is bounded below by 2,
and is infinite in the Gaussian case. A square root transformation (the default)
better numerical performance in the vicinity of these can yield extreme
values. Setting the order of root to a negative value allows the estimation
of the inverse d.f., which takes the value zero in the Gaussian case.
3.
Note: the variance/GARCH intercept and Student t d.f. parameters are
constrained to be nonnegative during optimization by taking the absolute
value of the parameter element to evaluate the likelihood function.
4.
By default, the Student skewness parameter is non-negative and equal to1
in the symmetric case. Estimating the logarithm makes 0 the symmetry value,
and may yield better numerical properties. (In the default case, nonnegativity
is enforced as in 3.)
DYNAMIC MODEL SETTINGS
5.
By default, up to 10 lags can be set in the ARMA and GARCH models.
This maximum can be reset to any desired value in the text box.
121
© James Davidson 2008
6.
There is no accepted convention regarding the signs of the coefficients
of a moving average lag polynomial. The program default is to report
the MA coefficients theta_j in
theta(L) = 1 - theta_1 L - ... - theta_q L^q,
and GARCH coefficients as beta_j in
beta(L) = 1 - beta_1 L - ... - beta_r L^r .
This is consistent with the convention in equation (4) of the main
document, and also more natural. For example, in the ARMA(1,1)
model equal roots cancel each other out, and in this case the estimates
will be equal. Similarly, in the ARMA-in-squares representation of the
GARCH(1,1) model, beta_1 = delta_1 corresponds to alpha_1
= 0, and the estimates are again equal in this case. However, the
MA coefficients can be optionally reported as theta_j in
theta(L) = 1 + theta_1 L + ... + theta_q L^q,
and GARCH coefficients as beta_j in
beta(L) = 1 + beta_1 L + ... + beta_r L^r.
7.
If the first observation for estimation is greater than 1, lag distributions
will normally be computed using all available pre-sample lags.
Checking 'Restrict Pre-Sample Lags' allows the number of presample
lags to be set in the textbox provided. Thus, setting 'Lag Truncation'
to 0 means that all pre-sample values are replaced by 0. This provides
comparability with the situation when the first observation used for
estimation is 1.
8.
For details of the option "Type I Fractional" see 4.2 Model / Dynamic
Equation, and Davidson and Hashimzade (2006). Note that this feature
is experimental!
GARCH PARAMETERIZATION
9.
As the default, GARCH coefficients are reported in 'ARMA-in-squares'
form, in which delta(L) and beta(L) in equations (2) and (3) are the AR
and MA components. In this case the coefficients are named "GARCH
AR1", "GARCH MA1" etc., etc. Optionally they can be reported in
'standard' form, corresponding to the representation of Bollerslev (1986).
In this case, the coefficients named "GARCH Alpha1" etc. are the
coefficients of beta(L) - delta(L), and "GARCH Beta1" etc. denote the
coefficients of beta(L).
Note:
*
Roots of the GARCH AR polynomial are not reported when this
option is checked.
*
The EGARCH model does not strictly have an “ARMA-insquares” representation. The default corresponds the stated
form of equation (3). The 'Bollerslev' form is the one more
commonly reported.
*
It is the user's responsibility to match starting values to the
convention selected.
10.
The GARCH intercept can also be computed in two different ways. By
default, it is 'omega' in equations (2) and (3). By unchecking the box
"Specify 'Type 1' GARCH Intercept", kappa = omega*beta(1) will be
122
© James Davidson 2008
computed instead, see equation (44)ff of main document.
OPTIMIZATION SETTINGS
The following options should not normally need changing, but the defaults may not
suit all cases. Experimentation is recommended if in doubt.
11.
The GARCH-M likelihood is computed by Gauss-Seidel iteration of
equations (1) and (41), (or (1) and (42) for EGARCH). A fixed number
of iterations is used, the default is 5. Increasing the number will increase
computation time, but may not improve the estimates significantly.
12.
To stabilize the GARCH-M calculations, h_t (or h_t^{1/2}) is trimmed
before inclusion in equation (1). The upper bound is set to a multiple of
the sample variance (or standard deviation) of the data, called the trimming
factor. Try reducing this setting in case of failure of the algorithm.
13.
The EGARCH likelihood can be computed in one of two ways; direct
nonlinear recursion of equation (42) (default) and Gauss-Seidel iteration;
i.e., repeatedly solving the linear difference equation obtained by
conditioning on h_t^{1/2} in equation (42). There may be small differences
between the two estimates due to treatment of initial conditions. The
main consideration in this choice is one of speed. The nonlinear
equation cannot be solved using Ox's vector manipulation capability,
and has to be programmed as a loop. This could result in long solution
times in large samples, and the iterative method will often be quicker.
A convergence criterion is used to control the G-S iterations. The
default maximum number (50) should not need changing.
8.7 Options / Optimization and Run ...
OPTIMAND CONVENTION
1
Two of the estimators available (least squares and GMM) are
conventionally regarded as minimizing a criterion, while the ML options
are maximands. This can lead to confusion, especially when interpreting
the model selection criteria. The "optimand" for least squares and LGV
is reported for comparability as the Gaussian log-likelihood (a monotonedecreasing transformation of the sum of squares) but the GMM optimand
has no such counterpart. By default, all the estimation criteria are treated
as maximands, (so, -GMM criterion). The 'Report Minimand' option
reverses the signs (so, -Log Likelihood). The important issue is that the
selection criteria are always signed in the same way as the estimation
criterion, and so are to be minimized (maximized) if this option is checked
(unchecked).
NUMBER OF GRID POINTS
2.
Enter an integer value here to choose the density of points computed in
a grid plot. If N is set, then N+1 points are evaluated in a 1-dimensional
grid, or (N+1)^2. points in a 2-dimensional grid. Note that grid plotting
must be enabled in Values / Equation, and the run launched with Actions
/ Plot Criterion Grid. Set the grid bounds(s) in the relevant Values
dialog(s).
123
© James Davidson 2008
BOUND ON DYNAMIC PARAMETERS
3.
The absolute bound on dynamic parameters controls a penalty applied
to the criterion function, to prevent extreme values. The penalty is applied
only to dynamic parameters (ARMA and GARCH coefficients, and
ARFIMA/FIGARCH d). This is mainly to prevent (e.g.) inverted moving
average roots diverging to infinity. It will not normally need to be changed.
To remove, set it to a large value.
OPTIMIZATION SETTINGS: BFGS ALGORITHM
4.
The options Maximum Number of Iterations, Iterations Print Frequency,
Strong Convergence Criterion and Weak Convergence Criterion are set
to their Ox defaults with the value -1. They will not normally need to be
changed.
5.
Printing of the current position and gradient is performed every N iterations,
where N is the print frequency. This output is under the control of the Ox
routine, and will not appear in the TSM results window. It goes only to
'standard output', meaning either the console window or OxEdit/GiveWin
output, depending on operating mode. Set frequency to 0 for no printing.
6.
Due to rounding error, the efficiency of the search algorithm can be
sensitive to large differences in scale between parameters. This can be due
to inappropriate units of measurement, for example. Setting the Parameter
Rescaling Factor to 1 adjusts parameters to have a similar order of magnitude,
based on the starting values - hence this setting alone will not have any effect
with default starting values. However, setting to a value greater than 1 scales
all parameters up, to limit rounding error. The value of 10 appears to improve
the performance of the algorithm in at least some cases. However, no
verified guidelines can be offered. Experiment! (and report your findings,
please.) To disable rescaling (the default) set the factor to 0.
SIMULATED ANNEALING
7.
Optionally, a simulated annealing algorithm can be run for a fixed number
of iterations to provide starting values for BFGS. This option is selected
by default. By choosing a large number of iterations, SA can be effectively
made to act as the search algorithm proper. However, given good starting
values BFGS should be much faster, so a compromise is probably best.
8.
The other three settable SA parameters are the initial temperature, the
temperature reduction factor, and the number of iterations before
temperature reduction. None of the defaults are necessarily best. If the
number of iterations before temperature reduction is set <= 1 it is replaced
by the default of max(100, 5*(#parameters)). This setting appears as
.NaN in the text field.
NON-CONVERGENCE
9.
If the BFGS search algorithm reports convergence failure, then by default
the parameters are set to default values and no output is returned.
Optionally, however, the output can be printed as usual using the current
124
© James Davidson 2008
point attained by BFGS. Be cautious in interpreting these values, and
especially standard errors. A possible cause of failure is a non-unique
likelihood optimum. In that case the reported values should represent an
optimum point, but the standard errors and covariance matrix are typically
not meaningful.
RUNNING AN EXTERNAL PROCESS
10.
If the option "Run Next Estimation as External Process" is checked
before launching an estimation run, the calculations are run in a new
instance of Ox, running in a console window. A temporary executable
Ox file is created to be run in batch mode.
11.
This option allows the TSM GUI to remain under the user's control
for other tasks while a long numerical optimization is performed.
It also allows two or more jobs to run be concurrently. Since Ox is
not multi-threaded, this is the best way to make full use of a multi-core
processor.
12.
This option is always cancelled once the run is executed. Reset it in
this dialog as required
13.
The usual estimation results are written to a text file identified by the
run number. Import this text to the results window using the command
File / Load Text File.
14.
If the specifications are stored as a named model in Model Manager
before running the new process, the associated values and listings
can also be imported. A ".tsd" data file is created with the usual
outputs. Import the data by RE-loading the model in Model Manager.
Also, the estimates can be loaded for further processing by the
command Restart / Load Text Input. The name and path of the file
to load is given in the results window.
15.
If the option "Delete Temporary Files on Exit" is checked, the
temporary code and listing files created by this option are deleted
at closedown. Results files are not removed, and must be deleted by
hand, as required.
8.8 Options / General Options ...
OPERATIONAL SETTINGS
1.
Dialogs are closed when an estimation run is started. Checking the option
"Restore Dialogs Automatically" causes them to re-open in the same
positions at the end of the run. Dialog positions are stored in “settings
.tsm”, so the last configuration in the previous session will also be restored
at start-up. If this option is not selected, dialogs can be restored manually
using the Actions / Restore Dialogs command.
2.
The positions of dialogs on the screen are remembered during a session, but
by default are lost when the program is closed. They are positioned centrally
when first opened. Optionally, the program will remember the positions
125
© James Davidson 2008
between sessions. This allows the user to maintain a preferred screen layout,
but note that if the monitor resolution is changed, they could become invisible.
In this event, use the command Actions / Reset Dialog Positions to re-centre
them.
3.
By default, the user is prompted to save data/results before over-writing
them or closing the program. Deselecting "Enable Saving Prompts"
suppresses these reminders.
4.
Saving program settings in a file allows the exact state of the program to
be restored, by reloading the settings. These include the data file, sample,
model specifications and current estimates. This can always be done
manually, but the option "Save Settings After a Run" saves the settings
automatically in a file "run*.tsm" where * denotes the ID number of the last
run. Enabling this option allows an earlier estimation run to be re-created
instantly, by loading the requisite file (see 2.1 File / Settings / Open...).
5.
The currently stored results (estimation output, graphs, series, Monte Carlo
results etc.) can be saved in the settings file at closedown, along with the
settings and model specifications. This means that the last estimation results
can be redisplayed without having to be recomputed. (Click the
"Evaluation" button, then "Yes"). The program is in almost exactly the same
state as at the last closedown, but the complete contents of the results
window are not stored. Save these in the usual manner.
6.
Enabling the option "Delete Temporary Files on Exit" will cause .TSD
(model results and data) files to be deleted automatically at the end of a
session. Uncheck this if you wish to keep your model results, or check
it to avoid excessive clutter in your working directory.
7.
Data descriptions are saved as series name extensions, that may not be
compatible with other programs. Set the option "Omit Data Descriptions"
when exporting data for use in other packages.
8.
"Automatically Close Options Dialogs" is selected by default, and has the
effect of closing any options dialog currently open when another is
opened. This saves a proliferation of open dialogs on the screen, but
can be disabled if it is desired to work on two or more options dialogs
at once.
DISPLAY SETTINGS
9.
The default font size of 12 points should suit most monitors, but can be
changed. This setting also effects the help pages, whose widths are
increased to accommodate the larger text. The results window is
resizable by dragging the corner with the mouse.
10.
TSM output can be echoed to the console as well as appearing
in the results window. To enable this behaviour check the "Echo
Results to Console" box. Output from Ox not under the control of
TSM, such as error messages, will also to appear in the console
window.
126
© James Davidson 2008
11.
Tool tips appear by default when the mouse pointer is passed over the
tool buttons. These can be optionally switched off.
12.
If the Enable Error Recovery option is checked (the default) the program
restarts automatically in the event of a crash (Ox error). Note that the
Ox error message appears in the DOS console.
13.
Drag selection allows the quick highlighting of a block of adjacent variables
in any list allowing multiple selection. Select a variable as usual, then put the
mouse pointer on another variable, and "drag" briefly (hold down the mouse
button while moving the mouse). These actions select all the names in
between. Deselection works the same way. The option can be switched off
in case it fails to operate smoothly on particular systems.
LINEAR REGRESSION MODE
14.
To simplify the user interface for teaching purposes, the options for
nonlinear estimation by numerical methods can be disabled, and the toolbar
buttons hidden. For this option, uncheck "Enable Optimization Estimators".
A restart is required to implement this selection.
DEFER EXTERNAL JOBS
15.
Check this option to create batch jobs (estimations or Monte Carlo jobs)
as executable Ox files, for starting manually. Use this option to run the job
on a different Ox installation, or to defer running it until a convenient time.
When this option is unchecked (the default) the job is started immediately
the Run command is given.
ASSIGNABLE TOOLBAR BUTTONS
16.
The two toolbar buttons with the "Dialog" icon and a number can be assigned
to open any dialog that does not have a dedicated button. Simply open the
dialog you wish to assign, then click one of the two assignment buttons. This
also works for the Grid Plot and Simulate commands on the Actions menu.
Note:
o
Unassigned buttons simply re-open the last dialog opened.
o
To remove the current assignment, "assign" a dialog which has its
own toolbar button.
o
To assign an Options dialog to a button, first uncheck the
"Automatically Close Options Dialogs" checkbox. This allows you to
open another Options dialog without closing this one.
o
To assign Options / General itself to a button, press an assignment
button before opening any other dialog.
127
© James Davidson 2008
9. Help
*
"User's Manual" gives access to these pages.
*
"View Text Files" opens additional documentation in ASCII files, for
reading only.
*
"Data Descriptions" opens a list of names of the currently loaded
variables, followed by any description that has been created for
the variable. The description is preceded by the symbol @.
*
"Register this Copy..." opens a dialog to enter the user's name and
the unlocking key provided to registered users of the software.
*
"About" opens a box showing copyright information and the registered
username.
USER'S MANUAL
1.
Navigate the User's Manual by the menu (sections) and sub-menus
(subsections), and also by clicking the "Previous" and "Next buttons to
move backwards and forwards through the pages. These pages
duplicate the contents of the PDF file "tsmod4ghp.pdf", which is
accessible through the Start Menu (Windows).
VIEW TEXT FILES
2.
"File Dialog" opens the file dialog, to select any ASCII file for reading.
3.
"Most Recently Opened" repeats the last selection. By default (if
no file has yet been opened) it opens "notes.txt" if this file exists.
4.
'Imported Ox Code' refers to a source code file, with .ox extension,
which has been loaded from a distributed settings (.tsm) file. A
distributor of coded functions has this opportunity to document their
code, by including text comments in the file before the code
statements. The code itself can also be inspected.
DESCRIPTIONS
5.
Data descriptions can be created in two ways. In Setup / Data Editing
and Transformations, the choice widget item "Description" opens a text
field where the description of the selected variable(s) can be entered.
Alternatively, when the data are prepared for loading in a spreadsheet
or text editor, add the description text to the variable name, normally
preceded by a @ symbol. The delimiter symbol can be changed by
editing the tsmgui4.h file.
6.
Some entry formats, such as .DAT, limit the length of a variable name.
Overflowing text will be lost if the data are saved in this format.
REGISTRATION
7.
The username must be entered in exactly the format as given with the
128
© James Davidson 2008
unlocking key. Changes in (e.g.) spelling, capitalization, embedded
spaces, etc., will cause the registration to fail.
8.
The program saves the licence file "registration.txt" in one of the two valid
locations for this file. It first tries the TSM Home directory, i.e., [ox home]
/packages/tsmod4/. If either the user does not have permission to write in
this folder, or if a licence file already exists there, it writes to the current
Results folder. This allows several different licences to coexist on the same
workstation, if each user maintains a different Results folder.
9.
By default, the Results folder is the "start-in" folder specified in the short-cut
used to start the program. However this location can be changed (e.g. by
the command "File / Results / Locate Results Folder"), and new location is
saved in "settings.tsm". If the settings file is subsequently deleted, it will be
necessary to either restore the Results location, or move the licence file
manually to the new one
10.
TSM reads the licence file at start-up, and looks for it in the current Results
folder first. If it is not found there, the program looks in the TSM Home
directory. If a licence file exists in the current Results folder it will 'take
precedence', and any licence file stored in the TSM Home directory will be
ignored. To "see" the latter registration, change the Results folder.
129
© James Davidson 2008
10. Interpreting the Output
PARAMETER LABELLING
1.
The symbols AR1, AR2, ..., MA1, MA2,... are used to label the ARMA
coefficients in the output. The prefixes 'GARCH', 'EGARCH' or
'APARCH', as appropriate, are appended for the conditional variance
coefficients in the default case of the 'ARMA-in squares'
parameterization. For the standard (Bollerslev) parameterization, 'AR'
and 'MA' are replaced by 'Alpha' and 'Beta', respectively. These
notations are also used for the BEKK multivariate GARCH model. Be
careful to interpret the latter parameters correctly!
2.
For models specified in the Model / Dynamic Equation dialog, the 'Type'
of a regressor appears as a prefix in square brackets, for example,
"[1]Var1" denotes that Var1 is a regressor of Type 1. This prefix is
omitted if only Type 1 regressors are specified, and also in equations
specified in the Model / Linear Regression dialog.
Note: in the latter case the Type only controls the number of lags
generated, not the interpretation of the coefficients.
3.
A GARCH regressor is indicated similarly, with an additional "G" prefix.
For example, "[G1]Var1" denotes that Var1 is a GARCH regressor
of Type 1. The GARCH (or EGARCH or APARCH) intercept of
Type 2 ('kappa') is indicated with the prefix '[2]'. However, no indicator
is used for the GARCH (EGARCH, APARCH) intercept of Type 1
('omega').
4.
To indicate the regime in an explained regime-switching model, the
regressor has an additional "Rg" prefix. For example, "[Rg1]Var1"
denotes that Var1 is a regressor explaining the probability of switching
to Regime 1.
5.
In smooth transition models, the parameters of the single and double
transition factors are indicated with the prefix "Sm". For example,
"[Sm1]Intercept" denotes the location parameter of the first transition
factor.
6.
The bilinear model is described in the output as 'BilinearAR(F)IMA(p,r,d,q) where r refers to the selected bilinear order, and
p, d and q are as for the standard AR(F)IMA model.
PARAMETER ROOT TRANSFORMATIONS
7.
By default, the GARCH intercept term is estimated in square root form.
Correspondingly, in ML estimation of models without a conditional variance
component, the error standard deviation is estimated by default. This is
for reasons of numerical stability. Particularly in IGARCH models where
the parameter can be close to zero, numerical derivatives can be highly
inaccurate without a rescaling transformation. The transformation can be
selected by the user in the Options / ML and Dynamics dialog. In certain
cases, raising the order of root from 2 to 4 may be found to aid
130
© James Davidson 2008
convergence, while in others 1 will work satisfactorily
8.
Similarly, the parameter of the Student t distribution can optionally be
estimated as a root of the degrees of freedom. The square root is the
default. See the Options / ML and Dynamics dialog to set alternative
values. This is again for reasons of numerical stability. The parameter
is both bounded below, and infinite in the Gaussian case, and extreme
values are potentially difficult for numerical differentiation. By setting the
root to a negative value, the inverse transformation can be applied, such
that the parameter is zero in the Gaussian case.
STANDARD ERRORS, TEST STATISTICS AND P-VALUES
9.
Every estimated parameter is shown in the output with either its
estimated standard error , or the words "Fixed" or "Solved" when the
parameters have been so designated in the Values dialogs. Following
the standard error, most parameters show the t ratio and nominal
p-value of the significance test. The degrees of freedom are calculated
as "sample size - (total model parameters)/(number of equations)".
10.
Parameters for which there is no natural "zero hypothesis" to be tested,
such as the variance, GARCH intercept, Student's t degrees of freedom,
etc., are shown with standard error in parentheses but no p-value.
11.
Nominal p-values are also given for quoted test statistics, in many cases
asymptotic chi-squared statistics. For tests with non-standard
distributions (Dickey-Fuller, KPSS, R/S) these are computed from the
available tables. Since the coverage is incomplete, these results are shown
as inequalities. Thus, {<0.05} would denote that the p-value is less than
0.05 (leading to rejection at the 5% level) according to the table. The result
{<1} simply indicates that the statistic falls within the bounds of all the
tabulated points. The tables themselves are given as an appendix to the
main document.
12.
If standard errors and/or test statistics print as NaN, (stands for "not a
number") this means the Hessian matrix of the optimization criterion could
not be inverted at the current point. Typically, this means the local optimum
is not unique, which will also cause convergence failure. Lack of
identification is a leading cause; for example, a Markov switching model
with a zero-probability regime. When Print Covariance Matrix is selected
in Options / Output and Retrieval Options, the Hessian matrix itself is printed
in this case, as a diagnostic aid. Checking for zero rows and columns could
indicate the source of the problem.
SELECTION CRITERIA AND SUMMARY STATISTICS
13.
By default the model selection criteria (Schwarz, Hannan-Quinn and Akaike)
are defined as "maximand - penalty". Therefore, larger values are preferred.
This convention can be optionally reversed, see "Report Minimand" in
Options / Optimization and Run.
14.
"R-Squared" is the squared correlation coefficient between the dependent
variable Y, and the model predictions ( = actual Y - residuals). Therefore,
131
© James Davidson 2008
it is well-defined for any model, and must lie in [0,1]. However, whether it
is a useful measure of model performance depends on the model - it is of
no use in assessing GARCH models, for example.
15.
"R-Bar-Squared" is calculated as 1 - (1 - R-squared)*(T-1)/(T-p) where
p is the number of parameters fitted in the model.
16.
When models are estimated by Instrumental Variables from the Linear
Regression menu, the Sargan and DWH (Durbin-Wu-Hausman)
statistics are given. These are asymptotic chi-squared statistics under
H0, with degrees of freedom indicated, and nominal p-values shown in
braces. The Sargan statistic is N times the ratio of the GMM minimand
to the residual sum of squares, where N is sample size. This tests validity
of over-identifying restrictions. The DWH statistic tests for valid exogeneity
assumptions on the instruments, and is N*(RSS0 - RSS1)/RSS1 where
RSS0 is the sum of squares from the OLS regression, and RSS1 the sum
of squares from the regression including the reduced form residuals for
the included endogenous variables.
CONVERGENCE ISSUES
17.
All estimations specified in the Model / Dynamic Equation dialog are
done numerically. The optimization routine is the Ox implementation of the
Broyden-Fletcher-Goldfarb-Shanno (BFGS) quasi-Newton procedure,
with numerical derivatives. This method reports strong convergence in a
high proportion of cases. However, don't assume that the message
"Strong convergence" means that the estimation criterion has been globally
optimized. It simply means that a local optimum has been found. Restarting
the search algorithm from different points is the only way to confirm a
global optimum.
18.
The messages "Weak convergence" or "No convergence" may also be
returned by the search algorithm. A run may also terminate with the
message "Estimation failed! Algorithm returns NaN or +/- infinity". This
typically indicates overflows in the floating-point calculations, e.g.
dividing by zero or attempting to take the logarithm of a negative number,
probably due to inappropriate starting values. If this occurs, optimization
is restarted automatically at the default parameter values. This will often
clear a problem with bad starting values.
GRAPHICS FOR REGIME SWITCHING MODELS
19.
For simple Markov and Hamilton switching models, the M-1 series of
independent filter probabilities can be listed and/or plotted. These are the
probabilities of the regime being occupied conditional on information to
date t, as used to weight the likelihood terms in estimation. In the case
of Hamilton's model, these are summed over lags (p) to reduce M^(p+1)
series down to M.
20.
For the explained switching model, the M-1 series of variable switching
probabilities are also plotted. When regime dummies have been specified
there are up to M-1 different series for each regime, although differing
only by the same offset at each t. These are averaged to create the series
132
© James Davidson 2008
plotted.
21.
For the smooth transition model, the regime weights are plotted (logistic
functions of the transition indicator).
BOOTSTRAP AND SUBSAMPLING P-VALUES
22.
Resampling computing p-values for tests by tabulating the statistics for
a "pseudo-true" model, where the statistics are centred using the relevant
components from the sample counterparts. This method can be used for
t-ratios and Wald tests, and also M and CM tests. It is not so easily
implemented for LM tests, although diagnostic tests for i.i.d. residuals
are valid by construction in the bootstrap context. Other LM tests,
and other tests are given their conventional asymptotic p-values. Note
that resampling p-values are always indicated with a '*'.
23.
Resampling p-values are computed for the Jarque-Bera test only for
the bootstrap using Gaussian shocks. Otherwise the hypothesis is true by
construction, so the bootstrap p-values are uninformative.
24.
The cointegration tests (ADF and Phillips-Perron) cannot be resampled
since there is no way to set up a pseudo-true version of the null hypothesis.
Note that in single-equation regression models, the regressors (except
lagged dependent variables) are held fixed in repeated samples. In
cointegration models this is an unrealistic assumption even in large samples.
It is better to consider a multi-equation model in which the unit root
processes are generated endogenously. Monte Carlo experiments can
be used to evaluate inference procedures in this case.
11 Directories and Files
DIRECTORIES (Windows folders):
Start-in
Must be specified by the operating system when TSM4 starts.
This is usually set by the short-cut used to start the program,
Options are presented by the installation program, or it can
be set manually by editing the short cut. Otherwise, by default
it is the directory where the Ox file used to start the program
resides.
Notes:
1.
On networks or shared systems, the user must have write
permissions in the Start-in directory. Write permissions in the
TSM Home directory ([ox-home]/packages/tsmod4/) are not
required. It is NOT recommended to designate TSM-Home as
the Start-in directory.
2.
In the Windows installation of TSM, double-clicking on a .tsm
file in Windows Explorer starts the program with the settings in
question. The Start-in directory is one where the .tsm file
resides. If the file is selected from a Start Menu the Start-in is
the user's registered home directory.
Results
Selected by the user as an alternate location for program outputs.
By default, it is the same as the Start-in directory. Reset it by the
133
© James Davidson 2008
command File / Results / New Results File ... (navigate using
file dialog) or the command File / Results / Locate Results
Folder. (type path in the text field).
FILES
These files may be created by TSM4 in either the Start-in or Results directory.
(S) indicates that a file can only reside in the Start-in directory. Otherwise, it will
be created in the Results directory if that is different. (C) indicates that these file
names can optionally be changed for a particular installation, by editing the file
tsmgui4.h.
settings.tsm (S,C)
Contains all the user's settings and specifications,
including the most recent estimates, and stored model
specifications. Saved automatically before estimation
or simulation runs, and at closedown.
registration.txt
Contains the user's licence code. By default, this is written
to the TSM Home directory, subject to the user having
write permissions, and there being no pre-existing licence
file there. Otherwise, it is written to Start-in directory or, if
this also contains a licence file, to the current results
folder. This allows multiple licenced users to share the same
installation.
NOTE. The program looks for registration.txt in reverse
order, first looking in current Results directory, then in
Start-in if this is different, and finally in TSM Home. The
'registered user' for the current run is therefore the user
who starts the program.
tsmod_run.ox (S,C) User-editable Ox file, used to start the program
incorporating the user's own code. The program
can be started by running this file in OxEdit.
(See Appendix A on changing module settings.)
usercode.ox (S,C)
This is the standard container for user's Ox code,
although it is often convenient to have it contain just
#include "..." compiler directives referring to files of code
supplied by the user.
errchk (S)
Written by TSM4 at startup and deleted at closedown.
Used to signal an error termination.
FILE TYPES
*.tsm
Named settings file with .tsm extension, same format as
settings.tsm, saved by the user. Can be loaded manually
to overwrite existing settings. When created using the
File / Export... option, data and listings are bundled with
the settings. The corresponding files are recreated
automatically when the file is loaded, in this case.
*.txt
The program creates various files in standard text format,
134
© James Davidson 2008
including results files (images of the results window text)
and settings files created with the Settings / Save Text...
command. These files can be view and edited in Windows
Notepad or other word-processing programs.
*.xls, *.csv
Microsoft Excel spreadsheet format is the default format for
saving data sets, forecasts, and other listings. Other options
available in the Options / Output and Retrieval dialog. *.csv
files are text files, have the same capabilities as the Excel
2 spreadsheets created by Ox, and are widely portable.
*.tsd
Contain graphs and listings associated with the stored model
having the same name as the file. These are loaded when
the model is loaded. Their contents can typically be recreated
by re-running estimations, and hence they are treated as
temporary. They will be deleted when the model is deleted,
and also at closedown, if the general option "Delete
Temporary files on Exit" is checked.
*.ox
Text files containing Ox source code. They can be executable,
such as tsmod_run.ox, but can also be included in other .ox
files using the compiler directive ' #include "..." '. In normal
use, a user's code files should be "#include"d in the standard
code file usercode.ox. which is in turn #included in the
executable tsmod_run.ox.
*.plt
Graphics file produded by Gnudraw, formatted for input to
Gnuplot. These files are deleted by default after Gnuplot
has processed them, but are optionally saved in the Results
directory for further processing by the user. They are ordinary
text files and can be viewed and edited in Notepad, OxEdit
and similar programs.
*.png
The default bitmap graphics format. This format is read by
a wide range of commercial graphing and word processing
software, and converted to formats such as bitmap, Jpeg,
Tiff, etc.
*.eps
Default vector graphics format. Can be read by various public
domain software, and converted to .wmf, .emf and other
formats by most graphics packages. Can also be inserted
in Microsoft Word documents.
TSM saves data and graphics in a variety of other optional formats. See 2.2 File
/ Data..., 8.1 Options / Output and Retrieval and 8.5 Options / Graphics for
details.
12. Hints and Tips
Here are some non-obvious pointers for getting the best results from the program.
135
© James Davidson 2008
Suggestions from users for further tips are always welcome.
NUMERICAL OPTIMIZATION
1.
TSM's optimization algorithm uses numerical derivatives, which under
certain circumstances can give rise to problems with successful convergence.
Its success can greatly depend on the good choice of starting values.
Analytic derivatives, while more reliable, would be difficult to implement
for the wide range of nonlinear models offered by the program.
Some packages implement elaborate schemes to choose starting values
automatically for specific models, such as ARIMAs, but again, this type of
strategy is difficult to combine with a wide range of models. TSM
implements a number of basic strategies, but these cannot entirely replace the
user's initiative in exploring the parameter space to achieve successful
optimization.
2.
The program makes a maximum of two attempts to perform an optimization,
where the second attempt uses the default starting values. If both attempts fail,
there are several program settings that may assist.
*
Enable the parameter rescaling option in Options / Optimization
and Run... Set the value to unity to limit the ratio of largest to smallest
parameters (effective only if starting values are a guide to the relative
magnitudes). Setting to a higher value (e.g.10) inflates all parameter
values, to reduce the risk of rounding error in the evaluation of
numerical derivatives.
*
Tinker with the simulated annealing settings in Options / Optimization
and Run... There are not many useful guidelines for good choices here;
in most cases raising the number of iterations cannot hurt, but also try
switching it off (see Note 8 below).
*
The scaling of the variance/intercept parameter in GARCH models
can be critical, especially in the IGARCH case. See Options / ML
and GARCH... for details.
*
Experiment with the settings for EGARCH and GARCH-M models
in Options / ML and Dynamics...
*
For dynamic parameters (AR, MA etc.) experiment with the bounding
option in Options / Optimization and Run...
3.
None of these fixes is guaranteed to improve matters, but setting starting
values to good guesses of the estimates is always helpful. For example, if it
is believed that a unit root exists in ARMA (or GARCH) models, start the
AR parameter at 1, rather than 0. Using the "Impose Unit Root" option in
Model / Dynamic Equation may help similarly.
4.
Another good strategy with a complicated model is to simplify it initially,
by deleting or fixing some components. Estimate the simple model, then
add back the deleted components one at a time. The estimates of the
simpler model often provide the best starting values for those parameters
136
© James Davidson 2008
in the more general one. This 'stepwise' approach to the optimum is often
successful when an attempt to optimize the full model from the default initial
values ends in failure.
5.
As a last resort, try keeping a parameter away from illegal values by
imposing inequality constraints. Set them in Values / ... after checking
the checkbox for Parameter Bounds.
6.
The estimation output can be optionally printed in the event of nonconvergence, but note the caution given on the Options / Optimization and
Run... help page, regarding the interpretation of these reported values.
7.
Switching regime models (Markov switching and smooth transition
models) often exhibit multiple maxima of the likelihood. Good starting
values, and careful experimentation with different starting values, are
strongly recommended. As a switching probability tends to 0 or 1, the
likelihood becomes flat due to the logistic mapping employed, and the
algorithm can get stuck at these points. Restarting with "plausible"
probability values (such as 0.9, 0.1) often succeeds in this situation.
8.
The simulated annealing algorithm uses randomization to decide on
successive steps. With a multi-modal criterion function it is possible, if
rare, for successive runs of the search algorithm to converge to different
points. Running SA for a limited number of steps before starting BFGS
also has the effect of randomizing the BFGS starting value. Repeating a
run, from different starting points or with different algorithm settings, is
always a good idea. While a preliminary SA search is the default setting,
it may be preferable to have SA switched off as the default, and enable
it only when needed. This will certainly speed things up.
CHOICE OF SYSTEM ESTIMATORS
9.
Don't overlook the distinction between the Linear Regression and Dynamic
Equation options. The latter always uses numerical optimization to compute
the estimator, even when a closed-form solution exists. Large unrestricted
VARs may be computed in the Linear Regression dialog using SUR.
Exclusion restrictions can be imposed by "fixing" parameters, although
they can be tested only by Wald tests on the unrestricted model.
10.
There are two ways to estimate a Gaussian linear equation system by
maximum likelihood. Least generalized variance (LGV) optimizes the
concentrated log-likelihood function (the log-determinant of the
covariance matrix). The "Gaussian ML" option estimates the loglikelihood as a function of all parameters, including the variance matrix,
and hence is much more computationally intensive than LGV. This
method is only required for models with nonlinear features such as
ARCH/GARCH or Markov switching.
USING THE RESULTS WINDOW AS A TEXT EDITOR
11.
Text can be typed or pasted freely into the window. To paste from the
clipboard, right-click in the text area and choose Paste. To save text in a
file, first name the file with File / Results / New Results File. Then select
137
© James Davidson 2008
the desired text with the mouse and give the command File / Results /
Save Selected Text. Note that subsequent saves will be appended to the
same file. To avoid this behaviour, give the New Results File command
again to create or reinstate a results file.
ENTERING DATA BY HAND
12.
Use one of the following methods to type data directly into the program,.
The second method is recommended for entering several variables at once.
Don't forget to save the data set afterwards, before doing anything else.
13.
Use the Setup / Data Transformation and Editing dialog to create a new
variable. If no data are currently loaded, give the command Re-Size Sample
and enter the desired sample size, in which case a new variable Zeros is
created automatically. Otherwise, give the command Make Zeros. Use
Rename to change Zeros to the name of the new variable. Then choose
Edit/List /Compare, select the first observation, and press Edit Observation.
To enter successive observations, type the values into the edit field and press
"OK", repeatedly.
14.
Alternatively, type the data by observation, either into a text editor or into
the results window as described in 11 above. The first line should contain
two integers: the number of observations (= lines to follow the first) and
the number of variables (= values on each line). Separate entries on a line
with a space, and terminate each line with [Enter]. Save the file with
extension .mat or .txt. Next, select either File / Data / Open or File / Data
/ Merge, as appropriate. The new variable(s) are named Var# by default,
where # denotes the column number(s). Give new names using 'Rename',
and optionally enter descriptions using 'Description' in the Setup / Data
Transformation and Editing dialog. Before doing anything else, save the
data in text or a spreadsheet format.
MAINTAINING AND EXPORTING PROGRAM SETTINGS
15.
To save a model specification, including data file name, estimator, sample
size, parameter values, test options, etc., open the Model Manager
('double-M' button) select 'Store Current Model' and supply a name
(the current run number is the default). This facility allows you to work
on different projects in parallel during a session. You may have a
complex multi-equation model set up, and need to do some exploratory
regressions or swap data sets. Saving the model allows you to reload the
settings later with Actions / Load Model, and pick up where you left off.
Your stored models are saved with the other settings in the settings.tsm file.
16.
To keep a permanent copy of your favourite operational settings, save
them in a backup file with a name such as "mydefaults.tsm". If you then
need to change the settings for a particular run, they are easily restored by
the command File / Settings / Open, and selecting the backup file. (Note
that restoring settings does not reset the run ID counter.)
17.
Named settings files are also useful in a teaching context. Students can be
supplied with a ".tsm" file containing a desired set of defaults and also
stored models for estimation or simulation exercises. The students can
138
© James Davidson 2008
easily undo any changes they have made by reloading the defaults file.
18.
By default, settings files are saved with local path information to locate
data and listings files, which may make them unsuitable for transfer from
one installation to another. Use the "Export" option in File / Settings /
Save As... to omit this local information. The search path for all files
will then be set to the "Start-in" directory when the settings file is loaded.
For example, a class exercise with preset model specifications and data
could be distributed by bundling all the relevant files for distribution
(e.g. in a zip file) and arranging for them to be extracted to the Start-in
directory of each target TSM installation.
19.
To over-ride the default behaviour of setting the run ID number to zero in a
new settings file, add the line
RUN_ID = ***;
to your text file of settings, before reloading them as described in Appendix
E, where *** is your current ID value.
DOING SIMULATIONS
20.
A star feature of the program is the ability to stochastically simulate any
model that it can estimate, using either randomly resampled residuals or
computer-generated shocks. The simulation module is the basis for
nonlinear forecasting, bootstrap testing, and Monte Carlo experiments.
To gain insight into the properties of an estimator, it is always a helpful
exercise to apply it to artificial data from a known model.
21.
To create an artificial sample, do the following
1)
Clear the data (File / Data / Clear).
2)
Set a sample size. In Setup / Data Transformation and Editing,
choose Edit, scroll down to 'Re-Size Sample', enter a value, and
press 'Go'. A variable called Zeros with the specified number of
observations is automatically created.
3)
Open Options / Simulation and Resampling, and choose a shock
distribution, either Gaussian or Model. In the first case, also set
the shock variance. In the second case, a likelihood function
must be specified in Model / Dynamic Equation.
4)
Set the model specifications in the usual way, selecting Zeros as the
dependent variable. Pre-sample values are used to start a dynamic
simulation and, if desired, these can be inserted in Zeros in Setup /
Data Transformation and Editing.
5)
Enter parameter values in the relevant Values dialogs. (Don't forget
variance parameters in the case of 'Model' shocks.)
6)
Open the Model Manager and save your specifications under a
suitable name.
7)
Select Actions / Simulate Current Model, and add the artificial data
to the data set if desired.
8)
Alternatively, use your model to set up a Monte Carlo experiment.
Note how a different model can be used to estimate from the
simulated data, to permit misspecification analysis.
22.
Whilst the simulation code has been carefully checked, there are so many
139
© James Davidson 2008
combinations of model features available that it is not possible to guarantee
that they will all work together as intended. To ensure the integrity of
simulation results, it is a good idea to run a check on the selected model.
Users may also wish to check out their own supplied code.
To verify that a model is being correctly simulated, follow these steps:
1)
Evaluate the model with a data set and chosen or estimated
parameters, to generate a set of residuals.
2)
Open Options / Simulation and Resampling, and select 'Bootstrap'
for the Shock Distribution. In the box Random Number Seed, enter
the value -1. This setting causes the simulation to be done with the
actual residuals, without random resampling.
3)
Run Actions / Simulate Current Model and save the simulation. This
should match the original series exactly apart, conceivably, from small
rounding errors. Compare the series in Setup / Data Transformation
and Editing. Choose 'Mark' for one series, then 'List/Edit/Compare' for
the other to see them side by side.
4)
In a Markov switching model, the simulation involves random regime
switches. To disable these, put the switching probabilities to 0 or 1 in
the simulation. In the case of explained switching models, choose
parameter values large enough to ensure that the switching
probabilities are either 0 or 1 for nearly all values of the explaining
variables.
Don't forget to reset the random number seed afterwards! Should a flaw in the
simulation code be suspected, please notify the author.
STARTING TSM FROM WINDOWS EXPLORER
23.
Double-clicking on a TSM settings file, with extension ".tsm" and red
TSM icon has the same effect as starting the program from the Start
menu and then loading the settings with the command "File / Settings /
Open...". The "Start-in" directory is in this case the directory where the
target TSM file resides.
24.
Any data file having a supported format can be selected in Explorer and
loaded into TSM. In this case, right-click the file with the mouse and
select the option "Open with ..." from the context menu. Select the
"Choose Program..." option, and choose "start_tsm" (with the Windows
batch file icon) from the list.
If this option does not appear in the list, choose "Browse...", navigate to
the TSM_HOME directory and select the file "start_tsm.bat" from the file
list. It should only be necessary to do this once.
Notes:
1)
If the option "Always use the selected program to open this kind
of file" is checked, simply double-clicking on the file icon will in
future load the file into TSM. Only choose this option if you
don't edit this type of file in your spreadsheet program by default..
2)
The directory containing the data file is used as the Start-in
directory. If it contains a "settings.tsm" file, the settings are
loaded from there. Otherwise, the defaults are set and a new
"settings.tsm" is created.
140
© James Davidson 2008
RUNNING SEVERAL INSTANCES OF TSM
25.
To run lengthy optimizations or Monte Carlo runs, without tying up the
program interface, try the option for exporting batch jobs to be run from
the command line. For details, see BATCH JOBS under 6.1 Actions /
Run Estimation and RUNNING AN EXTERNAL PROCESS under
3.10 Setup / Monte Carlo Experiments. When these jobs terminate, their
outputs are written to text files with the run number. Give the command
File / Load Text File to write the contents to the results window in the
usual way.
26
By default, a batch job is launched automatically to run concurrently
with the GUI. This is the efficient way to make use of a dual core processor,
since TSM is not multi-threaded even under Ox 5. Alternatively the run
(or runs) can be postponed to a time when the machine is otherwise idle.
In this case they must be launched manually, as regular Ox programs.
27.
It is also possible to run two or more instances of the GUI concurrently.
The only major problem to be avoided in this case is the different sessions
interfering with each other, by attempting to access and write to the same
files. The trick is to create a different working directory for each instance.
In Windows, do as follows:
*
Use the ' File / Settings / Export ' command to bundle your data
and models into a portable '.tsm' file.
*
Create a new directory for each instance, and copy the .tsm file to
each.
*
Start each instance by double-clicking on the .tsm file (see 23
above).
The directory containing the .tsm file becomes the Start-up directory for
each instance, with data, graphics, '.tsd' (model) and results files all
written there by default.
28.
For a more permanent multi-tasking setup, create multiple Windows shortcuts
on the Start Menu, each edited to point to a different 'Start-In' directory.
Give these shortcuts suitable names to distinguish them.
29.
Another use for multiple instances is where TSM is running the user's Ox
code. The supplied Windows shortcut "TSM4 with User Code" provides
an example. See Appendix C for further details.
TROUBLESHOOTING
30.
If the program appears to behave unpredictably, this may be because a
setting has been changed inadvertently. For example:
*
The values of certain estimated parameters (e.g. MA parameters,
GARCH parameters can depend on program settings.
*
If a parameter is "fixed" at zero in the Values dialog, no value is
reported for it in the output. It might appear that the estimated
specification is different from the chosen one. (Note that when
variable(s) are fixed, the relevant Values button is highlighted and
menu item(s) checked, as a reminder.
*
Corruption of the settings file (which is reloaded at start-up unless
renewed) can occasionally occur.
141
© James Davidson 2008
If you cannot figure out what the problem is, reset the program to
defaults with File / Settings / New. Alternatively, close the program,
delete the "settings.tsm" file, and restart.
31.
Another option is to write the current settings to a text file (File / Settings
/ Save Text...) and inspect this output. Note that only non-default settings
are listed. The usage of variable names can be checked in the programming
manual.
32.
If the program attempts to execute an illegal Ox instruction and crashes,
a message is displayed, and then it automatically restarts. The Ox error
message appears in the console window (second TSM icon on the taskbar)
and can be copied to the clipboard and saved (follow the onscreen
instructions). This message can guide users in debugging supplied code.
If the error is due to a TSM bug, please send in the error message as
requested!
33.
The error recovery screen displays options for quitting, continuing, and
exporting the current settings to a file. This file contains valuable diagnostic
information, preserving the last recorded state of the program before the
crash. If possible, please send in this file along with the error message.
142
© James Davidson 2008