1
Data Collection Software User Guide
Coating Thickness Meter
Requirements:
• Windows 2000/XP/Vista compatible PC
• One free RS232 port or USB adapter
Coating Thickness Meter Package includes RS232 cable, USB adaptor and
data‐collection software CD.
1. Installing the software
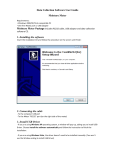
Insert the installation CD and follow the procedure on the screen until finish:
fo
2. Connecting the cable
- To the computer USB port
- To the Meter “RS232” port
3. Install USB Driver
- If you are using Windows XP operating system, a window will pop up, asking you to install
USB Driver. Choose Install the software automatically and follow the instruction to finish the
installation.
- If you are using Windows Vista, the driver doesn’t need to be installed manually. (You won’t see
the Window asking to install USB Driver)
4. Configuration
Run the program. On the main screen click System settings.
Select your COM* and “Coating Thickness Meter” from the Product drop-down list.
Click Save then Exit.
Digital Measurement
Metrology, Inc
*How to know which port to choose?
1)
If
you
are
using
Windows
XP,
go
to
“Start”“Control
Panel”-“System”-“Hardware”-“Device Manager”-“Ports(COM & LPT)”, click on it, it will
show which port is used to connect the Meter. For example, “USB serial (COM 1)” means
“USB1” should be chosen on the drop down manual in System settings.
2) If you are using Windows Vista, go to “Start”- “Control Panel”-“Device
Manager”-“Ports(COM & LPT)”, click on it, it will show which port is used to connect the
Meter. For example, it shows “USB serial (COM 1)” which means “USB1” should be chosen on
the drop down manual in System settings.
5. Collecting Data
When you go back on the main screen, click Data Collection button.
Click Begin/Continue button to start collecting the data. You can now take measurements with
your gage – the values will show on the Data Collection screen.
When you’re done click Pause/Stop. You can then save the report and/or export the data into an
Excel file.
Click Chart diagram, it will show the chart of the readings.