1
Troubleshooting on the QFX Series
Release
12.1
Published: 2012-03-21
Copyright © 2012, Juniper Networks, Inc.
Juniper Networks, Inc.
1194 North Mathilda Avenue
Sunnyvale, California 94089
USA
408-745-2000
www.juniper.net
This product includes the Envoy SNMP Engine, developed by Epilogue Technology, an Integrated Systems Company. Copyright © 1986-1997,
Epilogue Technology Corporation. All rights reserved. This program and its documentation were developed at private expense, and no part
of them is in the public domain.
This product includes memory allocation software developed by Mark Moraes, copyright © 1988, 1989, 1993, University of Toronto.
This product includes FreeBSD software developed by the University of California, Berkeley, and its contributors. All of the documentation
and software included in the 4.4BSD and 4.4BSD-Lite Releases is copyrighted by the Regents of the University of California. Copyright ©
1979, 1980, 1983, 1986, 1988, 1989, 1991, 1992, 1993, 1994. The Regents of the University of California. All rights reserved.
GateD software copyright © 1995, the Regents of the University. All rights reserved. Gate Daemon was originated and developed through
release 3.0 by Cornell University and its collaborators. Gated is based on Kirton’s EGP, UC Berkeley’s routing daemon (routed), and DCN’s
HELLO routing protocol. Development of Gated has been supported in part by the National Science Foundation. Portions of the GateD
software copyright © 1988, Regents of the University of California. All rights reserved. Portions of the GateD software copyright © 1991, D.
L. S. Associates.
This product includes software developed by Maker Communications, Inc., copyright © 1996, 1997, Maker Communications, Inc.
Juniper Networks, Junos, Steel-Belted Radius, NetScreen, and ScreenOS are registered trademarks of Juniper Networks, Inc. in the United
States and other countries. The Juniper Networks Logo, the Junos logo, and JunosE are trademarks of Juniper Networks, Inc. All other
trademarks, service marks, registered trademarks, or registered service marks are the property of their respective owners.
Juniper Networks assumes no responsibility for any inaccuracies in this document. Juniper Networks reserves the right to change, modify,
transfer, or otherwise revise this publication without notice.
Products made or sold by Juniper Networks or components thereof might be covered by one or more of the following patents that are
owned by or licensed to Juniper Networks: U.S. Patent Nos. 5,473,599, 5,905,725, 5,909,440, 6,192,051, 6,333,650, 6,359,479, 6,406,312,
6,429,706, 6,459,579, 6,493,347, 6,538,518, 6,538,899, 6,552,918, 6,567,902, 6,578,186, and 6,590,785.
Troubleshooting on the QFX Series
12.1
Copyright © 2012, Juniper Networks, Inc.
All rights reserved.
The information in this document is current as of the date on the title page.
YEAR 2000 NOTICE
Juniper Networks hardware and software products are Year 2000 compliant. Junos OS has no known time-related limitations through the
year 2038. However, the NTP application is known to have some difficulty in the year 2036.
END USER LICENSE AGREEMENT
The Juniper Networks product that is the subject of this technical documentation consists of (or is intended for use with) Juniper Networks
software. Use of such software is subject to the terms and conditions of the End User License Agreement (“EULA”) posted at
http://www.juniper.net/support/eula.html. By downloading, installing or using such software, you agree to the terms and conditions
of that EULA.
ii
Copyright © 2012, Juniper Networks, Inc.
Table of Contents
About the Documentation . . . . . . . . . . . . . . . . . . . . . . . . . . . . . . . . . . . . . . . . . . . . xi
Documentation and Release Notes . . . . . . . . . . . . . . . . . . . . . . . . . . . . . . . . . . xi
Supported Platforms . . . . . . . . . . . . . . . . . . . . . . . . . . . . . . . . . . . . . . . . . . . . . xi
Using the Examples in This Manual . . . . . . . . . . . . . . . . . . . . . . . . . . . . . . . . . . xi
Merging a Full Example . . . . . . . . . . . . . . . . . . . . . . . . . . . . . . . . . . . . . . . . . . . xii
Merging a Snippet . . . . . . . . . . . . . . . . . . . . . . . . . . . . . . . . . . . . . . . . . . . . . . . xii
Documentation Conventions . . . . . . . . . . . . . . . . . . . . . . . . . . . . . . . . . . . . . . xiii
Documentation Feedback . . . . . . . . . . . . . . . . . . . . . . . . . . . . . . . . . . . . . . . . . xv
Requesting Technical Support . . . . . . . . . . . . . . . . . . . . . . . . . . . . . . . . . . . . . xv
Self-Help Online Tools and Resources . . . . . . . . . . . . . . . . . . . . . . . . . . . . . . . xv
Opening a Case with JTAC . . . . . . . . . . . . . . . . . . . . . . . . . . . . . . . . . . . . . . . . xvi
Part 1
Overview
Chapter 1
General Troubleshooting . . . . . . . . . . . . . . . . . . . . . . . . . . . . . . . . . . . . . . . . . . . . 3
Understanding Troubleshooting Resources . . . . . . . . . . . . . . . . . . . . . . . . . . . . . . . 3
Troubleshooting Overview . . . . . . . . . . . . . . . . . . . . . . . . . . . . . . . . . . . . . . . . . . . . . 5
Chapter 2
Alarms . . . . . . . . . . . . . . . . . . . . . . . . . . . . . . . . . . . . . . . . . . . . . . . . . . . . . . . . . . . . 9
Understanding Alarms . . . . . . . . . . . . . . . . . . . . . . . . . . . . . . . . . . . . . . . . . . . . . . . . 9
Chassis Alarm Messages on a QFX3500 Device . . . . . . . . . . . . . . . . . . . . . . . . . . . 10
Interface Alarm Messages . . . . . . . . . . . . . . . . . . . . . . . . . . . . . . . . . . . . . . . . . . . . 12
Part 2
Administration
Chapter 3
Routine Monitoring Using the CLI . . . . . . . . . . . . . . . . . . . . . . . . . . . . . . . . . . . . 15
Monitoring SNMP . . . . . . . . . . . . . . . . . . . . . . . . . . . . . . . . . . . . . . . . . . . . . . . . . . . 15
Tracing SNMP Activity on a Device Running Junos OS . . . . . . . . . . . . . . . . . . . . . . 17
Configuring the Number and Size of SNMP Log Files . . . . . . . . . . . . . . . . . . . 18
Configuring Access to the Log File . . . . . . . . . . . . . . . . . . . . . . . . . . . . . . . . . . 18
Configuring a Regular Expression for Lines to Be Logged . . . . . . . . . . . . . . . . 18
Configuring the Trace Operations . . . . . . . . . . . . . . . . . . . . . . . . . . . . . . . . . . . 18
Monitoring RMON MIB Tables . . . . . . . . . . . . . . . . . . . . . . . . . . . . . . . . . . . . . . . . . 20
Displaying a Log File from a Single-Chassis System . . . . . . . . . . . . . . . . . . . . . . . . 21
Monitoring System Log Messages . . . . . . . . . . . . . . . . . . . . . . . . . . . . . . . . . . . . . . 22
Monitoring Traffic Through the Router or Switch . . . . . . . . . . . . . . . . . . . . . . . . . . 23
Displaying Real-Time Statistics About All Interfaces on the Router or
Switch . . . . . . . . . . . . . . . . . . . . . . . . . . . . . . . . . . . . . . . . . . . . . . . . . . . . . 23
Displaying Real-Time Statistics About an Interface on the Router or
Switch . . . . . . . . . . . . . . . . . . . . . . . . . . . . . . . . . . . . . . . . . . . . . . . . . . . . 24
Pinging Hosts . . . . . . . . . . . . . . . . . . . . . . . . . . . . . . . . . . . . . . . . . . . . . . . . . . . . . . 25
Copyright © 2012, Juniper Networks, Inc.
iii
Troubleshooting on the QFX Series
Chapter 4
Routine Monitoring in Junos Space . . . . . . . . . . . . . . . . . . . . . . . . . . . . . . . . . . 27
Viewing Managed Devices . . . . . . . . . . . . . . . . . . . . . . . . . . . . . . . . . . . . . . . . . . . . 27
Viewing Devices as Graphics . . . . . . . . . . . . . . . . . . . . . . . . . . . . . . . . . . . . . . . 27
Viewing Devices in a Table . . . . . . . . . . . . . . . . . . . . . . . . . . . . . . . . . . . . . . . . 29
Viewing Hardware Inventory for Devices . . . . . . . . . . . . . . . . . . . . . . . . . . . . . . . . . 31
Viewing Physical Interfaces for Devices . . . . . . . . . . . . . . . . . . . . . . . . . . . . . . . . . 34
Viewing Device Snapshot Details . . . . . . . . . . . . . . . . . . . . . . . . . . . . . . . . . . . . . . 35
Scanning a Message for Impact . . . . . . . . . . . . . . . . . . . . . . . . . . . . . . . . . . . . . . . 36
Part 3
Troubleshooting
Chapter 5
Junos OS Basics . . . . . . . . . . . . . . . . . . . . . . . . . . . . . . . . . . . . . . . . . . . . . . . . . . 39
Rebooting and Halting a QFX Series Product . . . . . . . . . . . . . . . . . . . . . . . . . . . . . 39
Recovering from a Failed Software Installation . . . . . . . . . . . . . . . . . . . . . . . . . . . 40
Recovering the Root Password . . . . . . . . . . . . . . . . . . . . . . . . . . . . . . . . . . . . . . . . . 41
Creating an Emergency Boot Device for a QFX Series Device . . . . . . . . . . . . . . . . 43
Performing a Recovery Installation on a QFX3500 Device and QFX3008-I
Interconnect Device . . . . . . . . . . . . . . . . . . . . . . . . . . . . . . . . . . . . . . . . . . . . . 44
Performing a Recovery Installation of the Director Group . . . . . . . . . . . . . . . . . . . 45
Chapter 6
Configuration and File Management . . . . . . . . . . . . . . . . . . . . . . . . . . . . . . . . . 47
Loading a Previous Configuration File . . . . . . . . . . . . . . . . . . . . . . . . . . . . . . . . . . . 47
Reverting to the Default Factory Configuration . . . . . . . . . . . . . . . . . . . . . . . . . . . 48
Reverting to the Rescue Configuration . . . . . . . . . . . . . . . . . . . . . . . . . . . . . . . . . . 48
Cleaning Up the System File Storage Space . . . . . . . . . . . . . . . . . . . . . . . . . . . . . . 49
Chapter 7
Ethernet Switching . . . . . . . . . . . . . . . . . . . . . . . . . . . . . . . . . . . . . . . . . . . . . . . . 51
Troubleshooting Ethernet Switching . . . . . . . . . . . . . . . . . . . . . . . . . . . . . . . . . . . . 51
Troubleshooting Layer 2 Protocol Tunneling . . . . . . . . . . . . . . . . . . . . . . . . . . . . . . 52
Drop Threshold Statistics Might Be Incorrect . . . . . . . . . . . . . . . . . . . . . . . . . 52
Egress Filtering of L2PT Traffic Not Supported . . . . . . . . . . . . . . . . . . . . . . . . 52
Troubleshooting Private VLANs . . . . . . . . . . . . . . . . . . . . . . . . . . . . . . . . . . . . . . . . 53
Limitations of Private VLANs . . . . . . . . . . . . . . . . . . . . . . . . . . . . . . . . . . . . . . 53
Forwarding with Private VLANs . . . . . . . . . . . . . . . . . . . . . . . . . . . . . . . . . . . . 53
Egress Firewall Filters with Private VLANs . . . . . . . . . . . . . . . . . . . . . . . . . . . . 53
Troubleshooting Q-in-Q and VLAN Translation Configuration . . . . . . . . . . . . . . . 54
Firewall Filter Match Condition Not Working with Q-in-Q Tunneling . . . . . . . 54
Egress Port Mirroring with VLAN Translation . . . . . . . . . . . . . . . . . . . . . . . . . . 54
Chapter 8
High Availability . . . . . . . . . . . . . . . . . . . . . . . . . . . . . . . . . . . . . . . . . . . . . . . . . . . 57
Troubleshooting VRRP . . . . . . . . . . . . . . . . . . . . . . . . . . . . . . . . . . . . . . . . . . . . . . . 57
Chapter 9
Interfaces . . . . . . . . . . . . . . . . . . . . . . . . . . . . . . . . . . . . . . . . . . . . . . . . . . . . . . . . 59
Troubleshooting an Aggregated Ethernet Interface . . . . . . . . . . . . . . . . . . . . . . . . 59
Troubleshooting Network Interfaces . . . . . . . . . . . . . . . . . . . . . . . . . . . . . . . . . . . . 59
The interface on the port in which an SFP or SFP+ transceiver is installed
in an SFP or SFP+ module is down . . . . . . . . . . . . . . . . . . . . . . . . . . . . . . 59
Chapter 10
Layer 3 Protocols . . . . . . . . . . . . . . . . . . . . . . . . . . . . . . . . . . . . . . . . . . . . . . . . . . 61
Troubleshooting Virtual Routing Instances . . . . . . . . . . . . . . . . . . . . . . . . . . . . . . . 61
Direct Routes Not Leaked Between Routing Instances . . . . . . . . . . . . . . . . . . 61
iv
Copyright © 2012, Juniper Networks, Inc.
Table of Contents
Chapter 11
Security . . . . . . . . . . . . . . . . . . . . . . . . . . . . . . . . . . . . . . . . . . . . . . . . . . . . . . . . . . 63
Troubleshooting Firewall Filter Configuration . . . . . . . . . . . . . . . . . . . . . . . . . . . . . 63
Firewall Filter Configuration Returns a No Space Available in TCAM
Message . . . . . . . . . . . . . . . . . . . . . . . . . . . . . . . . . . . . . . . . . . . . . . . . . . . 63
Filter Counts Previously Dropped Packet . . . . . . . . . . . . . . . . . . . . . . . . . . . . . 65
Matching Packets Not Counted . . . . . . . . . . . . . . . . . . . . . . . . . . . . . . . . . . . . 65
Cannot Include loss-priority and policer Actions in Same Term . . . . . . . . . . . 66
Cannot Egress Filter Certain Traffic Originating on QFX Switch . . . . . . . . . . . 66
Firewall Filter Match Condition Not Working with Q-in-Q Tunneling . . . . . . . 66
Egress Firewall Filters with Private VLANs . . . . . . . . . . . . . . . . . . . . . . . . . . . . 66
Egress Filtering of L2PT Traffic Not Supported . . . . . . . . . . . . . . . . . . . . . . . . 67
Troubleshooting Policer Configuration . . . . . . . . . . . . . . . . . . . . . . . . . . . . . . . . . . 67
Incomplete Count of Packet Drops . . . . . . . . . . . . . . . . . . . . . . . . . . . . . . . . . 67
Egress Policers on QFX3500 Might Allow More Throughput Than is
Configured . . . . . . . . . . . . . . . . . . . . . . . . . . . . . . . . . . . . . . . . . . . . . . . . . 68
Chapter 12
Services . . . . . . . . . . . . . . . . . . . . . . . . . . . . . . . . . . . . . . . . . . . . . . . . . . . . . . . . . 69
Troubleshooting Port Mirroring . . . . . . . . . . . . . . . . . . . . . . . . . . . . . . . . . . . . . . . . 69
Port Mirroring Constraints and Limitations . . . . . . . . . . . . . . . . . . . . . . . . . . . 69
Local and Remote Port Mirroring . . . . . . . . . . . . . . . . . . . . . . . . . . . . . . . 69
Remote Port Mirroring Only . . . . . . . . . . . . . . . . . . . . . . . . . . . . . . . . . . . . 70
Egress Port Mirroring with VLAN Translation . . . . . . . . . . . . . . . . . . . . . . . . . . 70
Chapter 13
Storage . . . . . . . . . . . . . . . . . . . . . . . . . . . . . . . . . . . . . . . . . . . . . . . . . . . . . . . . . . . 71
Troubleshooting Dropped FCoE Traffic . . . . . . . . . . . . . . . . . . . . . . . . . . . . . . . . . . 71
Troubleshooting Fibre Channel Interface Deletion . . . . . . . . . . . . . . . . . . . . . . . . . 72
Troubleshooting Dropped FIP Traffic . . . . . . . . . . . . . . . . . . . . . . . . . . . . . . . . . . . . 73
Chapter 14
Traffic Management . . . . . . . . . . . . . . . . . . . . . . . . . . . . . . . . . . . . . . . . . . . . . . . 75
Troubleshooting Egress Bandwidth That Exceeds the Configured Maximum
Bandwidth . . . . . . . . . . . . . . . . . . . . . . . . . . . . . . . . . . . . . . . . . . . . . . . . . . . . . 75
Troubleshooting Egress Bandwidth That Exceeds the Configured Minimum
Bandwidth . . . . . . . . . . . . . . . . . . . . . . . . . . . . . . . . . . . . . . . . . . . . . . . . . . . . . 76
Troubleshooting Egress Queue Bandwidth Impacted by Congestion . . . . . . . . . . 77
Troubleshooting an Unexpected Rewrite Value . . . . . . . . . . . . . . . . . . . . . . . . . . . 77
Troubleshooting a Port Reset on QFabric Systems When a Queue Stops
Transmitting Traffic . . . . . . . . . . . . . . . . . . . . . . . . . . . . . . . . . . . . . . . . . . . . . . 79
Copyright © 2012, Juniper Networks, Inc.
v
Troubleshooting on the QFX Series
vi
Copyright © 2012, Juniper Networks, Inc.
List of Figures
Part 2
Administration
Chapter 4
Routine Monitoring in Junos Space . . . . . . . . . . . . . . . . . . . . . . . . . . . . . . . . . . 27
Figure 1: Inventory Page: SRX Chassis Cluster . . . . . . . . . . . . . . . . . . . . . . . . . . . . . 28
Figure 2: Table Icon . . . . . . . . . . . . . . . . . . . . . . . . . . . . . . . . . . . . . . . . . . . . . . . . . . 29
Figure 3: Device Table . . . . . . . . . . . . . . . . . . . . . . . . . . . . . . . . . . . . . . . . . . . . . . . 29
Figure 4: Selecting Columns . . . . . . . . . . . . . . . . . . . . . . . . . . . . . . . . . . . . . . . . . . 30
Figure 5: Device Inventory: Single Chassis . . . . . . . . . . . . . . . . . . . . . . . . . . . . . . . . 32
Figure 6: Device Inventory: Chassis Cluster . . . . . . . . . . . . . . . . . . . . . . . . . . . . . . . 32
Figure 7: Device Inventory: Service Information . . . . . . . . . . . . . . . . . . . . . . . . . . . . 32
Figure 8: Device Inventory: Physical Interfaces . . . . . . . . . . . . . . . . . . . . . . . . . . . . 34
Figure 9: View JMB Dialog Box . . . . . . . . . . . . . . . . . . . . . . . . . . . . . . . . . . . . . . . . . 36
Copyright © 2012, Juniper Networks, Inc.
vii
Troubleshooting on the QFX Series
viii
Copyright © 2012, Juniper Networks, Inc.
List of Tables
About the Documentation . . . . . . . . . . . . . . . . . . . . . . . . . . . . . . . . . . . . . . . . . . xi
Table 1: Notice Icons . . . . . . . . . . . . . . . . . . . . . . . . . . . . . . . . . . . . . . . . . . . . . . . . . xiii
Table 2: Text and Syntax Conventions . . . . . . . . . . . . . . . . . . . . . . . . . . . . . . . . . . . xiii
Part 1
Overview
Chapter 1
General Troubleshooting . . . . . . . . . . . . . . . . . . . . . . . . . . . . . . . . . . . . . . . . . . . . 3
Table 3: Troubleshooting Resources on the QFX Series . . . . . . . . . . . . . . . . . . . . . . 3
Table 4: Troubleshooting on the QFX Series . . . . . . . . . . . . . . . . . . . . . . . . . . . . . . . 5
Chapter 2
Alarms . . . . . . . . . . . . . . . . . . . . . . . . . . . . . . . . . . . . . . . . . . . . . . . . . . . . . . . . . . . . 9
Table 5: Alarm Terms and Definitions . . . . . . . . . . . . . . . . . . . . . . . . . . . . . . . . . . . . 9
Table 6: QFX3500 Chassis Alarm Messages . . . . . . . . . . . . . . . . . . . . . . . . . . . . . . 10
Part 2
Administration
Chapter 3
Routine Monitoring Using the CLI . . . . . . . . . . . . . . . . . . . . . . . . . . . . . . . . . . . . 15
Table 7: SNMP Tracing Flags . . . . . . . . . . . . . . . . . . . . . . . . . . . . . . . . . . . . . . . . . . 19
Table 8: Output Control Keys for the monitor interface Command . . . . . . . . . . . . 25
Chapter 4
Routine Monitoring in Junos Space . . . . . . . . . . . . . . . . . . . . . . . . . . . . . . . . . . 27
Table 9: Device Connection Status Icon . . . . . . . . . . . . . . . . . . . . . . . . . . . . . . . . . 28
Table 10: Fields in the Manage Devices Table . . . . . . . . . . . . . . . . . . . . . . . . . . . . . 29
Table 11: Device Inventory Fields . . . . . . . . . . . . . . . . . . . . . . . . . . . . . . . . . . . . . . . 33
Table 12: Physical Interfaces Columns . . . . . . . . . . . . . . . . . . . . . . . . . . . . . . . . . . . 34
Part 3
Troubleshooting
Chapter 14
Traffic Management . . . . . . . . . . . . . . . . . . . . . . . . . . . . . . . . . . . . . . . . . . . . . . . 75
Table 13: Components of the Rate Shaping Troubleshooting Example . . . . . . . . 80
Copyright © 2012, Juniper Networks, Inc.
ix
Troubleshooting on the QFX Series
x
Copyright © 2012, Juniper Networks, Inc.
About the Documentation
•
Documentation and Release Notes on page xi
•
Supported Platforms on page xi
•
Using the Examples in This Manual on page xi
•
Documentation Conventions on page xiii
•
Documentation Feedback on page xv
•
Requesting Technical Support on page xv
Documentation and Release Notes
®
To obtain the most current version of all Juniper Networks technical documentation,
see the product documentation page on the Juniper Networks website at
http://www.juniper.net/techpubs/.
If the information in the latest release notes differs from the information in the
documentation, follow the product Release Notes.
Juniper Networks Books publishes books by Juniper Networks engineers and subject
matter experts. These books go beyond the technical documentation to explore the
nuances of network architecture, deployment, and administration. The current list can
be viewed at http://www.juniper.net/books.
Supported Platforms
For the features described in this document, the following platforms are supported:
•
QFX Series
Using the Examples in This Manual
If you want to use the examples in this manual, you can use the load merge or the load
merge relative command. These commands cause the software to merge the incoming
configuration into the current candidate configuration. The example does not become
active until you commit the candidate configuration.
If the example configuration contains the top level of the hierarchy (or multiple
hierarchies), the example is a full example. In this case, use the load merge command.
Copyright © 2012, Juniper Networks, Inc.
xi
Troubleshooting on the QFX Series
If the example configuration does not start at the top level of the hierarchy, the example
is a snippet. In this case, use the load merge relative command. These procedures are
described in the following sections.
Merging a Full Example
To merge a full example, follow these steps:
1.
From the HTML or PDF version of the manual, copy a configuration example into a
text file, save the file with a name, and copy the file to a directory on your routing
platform.
For example, copy the following configuration to a file and name the file ex-script.conf.
Copy the ex-script.conf file to the /var/tmp directory on your routing platform.
system {
scripts {
commit {
file ex-script.xsl;
}
}
}
interfaces {
fxp0 {
disable;
unit 0 {
family inet {
address 10.0.0.1/24;
}
}
}
}
2. Merge the contents of the file into your routing platform configuration by issuing the
load merge configuration mode command:
[edit]
user@host# load merge /var/tmp/ex-script.conf
load complete
Merging a Snippet
To merge a snippet, follow these steps:
1.
From the HTML or PDF version of the manual, copy a configuration snippet into a text
file, save the file with a name, and copy the file to a directory on your routing platform.
For example, copy the following snippet to a file and name the file
ex-script-snippet.conf. Copy the ex-script-snippet.conf file to the /var/tmp directory
on your routing platform.
commit {
file ex-script-snippet.xsl; }
2. Move to the hierarchy level that is relevant for this snippet by issuing the following
configuration mode command:
xii
Copyright © 2012, Juniper Networks, Inc.
About the Documentation
[edit]
user@host# edit system scripts
[edit system scripts]
3. Merge the contents of the file into your routing platform configuration by issuing the
load merge relative configuration mode command:
[edit system scripts]
user@host# load merge relative /var/tmp/ex-script-snippet.conf
load complete
For more information about the load command, see the Junos OS CLI User Guide.
Documentation Conventions
Table 1 on page xiii defines notice icons used in this guide.
Table 1: Notice Icons
Icon
Meaning
Description
Informational note
Indicates important features or instructions.
Caution
Indicates a situation that might result in loss of data or hardware damage.
Warning
Alerts you to the risk of personal injury or death.
Laser warning
Alerts you to the risk of personal injury from a laser.
Table 2 on page xiii defines the text and syntax conventions used in this guide.
Table 2: Text and Syntax Conventions
Convention
Description
Examples
Bold text like this
Represents text that you type.
To enter configuration mode, type the
configure command:
user@host> configure
Fixed-width text like this
Copyright © 2012, Juniper Networks, Inc.
Represents output that appears on the
terminal screen.
user@host> show chassis alarms
No alarms currently active
xiii
Troubleshooting on the QFX Series
Table 2: Text and Syntax Conventions (continued)
Convention
Description
Examples
Italic text like this
•
Introduces important new terms.
•
•
Identifies book names.
•
Identifies RFC and Internet draft titles.
A policy term is a named structure
that defines match conditions and
actions.
•
Junos OS System Basics Configuration
Guide
•
RFC 1997, BGP Communities Attribute
Represents variables (options for which
you substitute a value) in commands or
configuration statements.
Configure the machine’s domain name:
Represents names of configuration
statements, commands, files, and
directories; interface names;
configuration hierarchy levels; or labels
on routing platform components.
•
To configure a stub area, include the
stub statement at the [edit protocols
ospf area area-id] hierarchy level.
•
The console port is labeled CONSOLE.
< > (angle brackets)
Enclose optional keywords or variables.
stub <default-metric metric>;
| (pipe symbol)
Indicates a choice between the mutually
exclusive keywords or variables on either
side of the symbol. The set of choices is
often enclosed in parentheses for clarity.
broadcast | multicast
# (pound sign)
Indicates a comment specified on the
same line as the configuration statement
to which it applies.
rsvp { # Required for dynamic MPLS only
[ ] (square brackets)
Enclose a variable for which you can
substitute one or more values.
community name members [
community-ids ]
Indention and braces ( { } )
Identify a level in the configuration
hierarchy.
; (semicolon)
Identifies a leaf statement at a
configuration hierarchy level.
Italic text like this
Text like this
[edit]
root@# set system domain-name
domain-name
(string1 | string2 | string3)
[edit]
routing-options {
static {
route default {
nexthop address;
retain;
}
}
}
J-Web GUI Conventions
Bold text like this
> (bold right angle bracket)
xiv
Represents J-Web graphical user
interface (GUI) items you click or select.
Separates levels in a hierarchy of J-Web
selections.
•
In the Logical Interfaces box, select
All Interfaces.
•
To cancel the configuration, click
Cancel.
In the configuration editor hierarchy,
select Protocols>Ospf.
Copyright © 2012, Juniper Networks, Inc.
About the Documentation
Documentation Feedback
We encourage you to provide feedback, comments, and suggestions so that we can
improve the documentation. You can send your comments to
[email protected], or fill out the documentation feedback form at
https://www.juniper.net/cgi-bin/docbugreport/ . If you are using e-mail, be sure to include
the following information with your comments:
•
Document or topic name
•
URL or page number
•
Software release version (if applicable)
Requesting Technical Support
Technical product support is available through the Juniper Networks Technical Assistance
Center (JTAC). If you are a customer with an active J-Care or JNASC support contract,
or are covered under warranty, and need post-sales technical support, you can access
our tools and resources online or open a case with JTAC.
•
JTAC policies—For a complete understanding of our JTAC procedures and policies,
review the JTAC User Guide located at
http://www.juniper.net/us/en/local/pdf/resource-guides/7100059-en.pdf .
•
Product warranties—For product warranty information, visit
http://www.juniper.net/support/warranty/ .
•
JTAC hours of operation—The JTAC centers have resources available 24 hours a day,
7 days a week, 365 days a year.
Self-Help Online Tools and Resources
For quick and easy problem resolution, Juniper Networks has designed an online
self-service portal called the Customer Support Center (CSC) that provides you with the
following features:
•
Find CSC offerings: http://www.juniper.net/customers/support/
•
Search for known bugs: http://www2.juniper.net/kb/
•
Find product documentation: http://www.juniper.net/techpubs/
•
Find solutions and answer questions using our Knowledge Base: http://kb.juniper.net/
•
Download the latest versions of software and review release notes:
http://www.juniper.net/customers/csc/software/
•
Search technical bulletins for relevant hardware and software notifications:
https://www.juniper.net/alerts/
Copyright © 2012, Juniper Networks, Inc.
xv
Troubleshooting on the QFX Series
•
Join and participate in the Juniper Networks Community Forum:
http://www.juniper.net/company/communities/
•
Open a case online in the CSC Case Management tool: http://www.juniper.net/cm/
To verify service entitlement by product serial number, use our Serial Number Entitlement
(SNE) Tool: https://tools.juniper.net/SerialNumberEntitlementSearch/
Opening a Case with JTAC
You can open a case with JTAC on the Web or by telephone.
•
Use the Case Management tool in the CSC at http://www.juniper.net/cm/ .
•
Call 1-888-314-JTAC (1-888-314-5822 toll-free in the USA, Canada, and Mexico).
For international or direct-dial options in countries without toll-free numbers, see
http://www.juniper.net/support/requesting-support.html .
xvi
Copyright © 2012, Juniper Networks, Inc.
PART 1
Overview
•
General Troubleshooting on page 3
•
Alarms on page 9
Copyright © 2012, Juniper Networks, Inc.
1
Troubleshooting on the QFX Series
2
Copyright © 2012, Juniper Networks, Inc.
CHAPTER 1
General Troubleshooting
•
Understanding Troubleshooting Resources on page 3
•
Troubleshooting Overview on page 5
Understanding Troubleshooting Resources
This topic describes some of the troubleshooting resources available for the QFX Series.
These resources include tools such as the Junos OS CLI, Junos Space applications, and
the Advanced Insight Scripts (AI-Scripts).
Table 3 on page 3 provides a list of some of the troubleshooting resources.
Table 3: Troubleshooting Resources on the QFX Series
Troubleshooting Resource
Description
Documentation
Chassis alarms
Chassis alarms indicate a failure on the
switch or one of its components. A chassis
alarm count is displayed on the LCD panel
on the front of the switch.
“Chassis Alarm Messages on a QFX3500
Device” on page 10
Chassis Status LEDs and Fan Tray
LEDs
A blinking amber Power, Fan, or Fan Tray
LED indicates a hardware component error.
A blinking amber Status LED indicates a
software error.
Chassis Status LEDs on a QFX3500 Device
Interface alarms
A predefined alarm (red or yellow) for an
interface type is triggered when an interface
of that type goes down.
“Interface Alarm Messages” on page 12
System alarms
A predefined alarm is triggered by a missing
rescue configuration or problem with the
software license.
“Understanding Alarms” on page 9
System log messages
The system log includes details of system
and user events, including errors. Specify
the severity and type of system log
messages you wish to view or save, and
configure the output to be sent to local or
remote hosts.
•
Overview of Single-Chassis System
Logging Configuration
•
Junos OS System Log Configuration
Statements
Copyright © 2012, Juniper Networks, Inc.
3
Troubleshooting on the QFX Series
Table 3: Troubleshooting Resources on the QFX Series (continued)
4
Troubleshooting Resource
Description
Documentation
Junos OS operational mode
commands
Operational mode commands can be used
to monitor switch performance and current
activity on the network. For example, use
the traceroute monitor command to locate
points of failure in a network.
•
Monitoring System Process Information
•
Monitoring System Properties
•
traceroute monitor
Junos OS automation scripts
(event scripts)
Event scripts can be used to automate
network troubleshooting and management
tasks.
Junos OS Configuration and Operations
Automation Guide
Junos OS XML operational tags
XML operational tags are equivalent in
function to operational mode commands
in the CLI, which you can use to retrieve
status information for a device.
Junos XML API Operational Reference
NETCONF XML management
protocol
The NETCONF XML management protocol
defines basic operations that are equivalent
to Junos OS CLI configuration mode
commands. Client applications use the
protocol operations to display, edit, and
commit configuration statements (among
other operations), just as administrators
use CLI configuration mode commands
such as show, set, and commit to perform
those operations.
NETCONF XML Management Protocol
Guide
SNMP MIBs and traps
MIBs enable the monitoring of network
devices from a central location. For
example, use the Traceroute MIB to monitor
devices remotely.
•
Juniper Networks Enterprise-Specific
MIBs
•
Juniper Networks Enterprise-Specific
SNMP Version 1 Traps
•
Juniper Networks Enterprise-Specific
SNMP Version 2 Traps
•
Using the Traceroute MIB for Remote
Monitoring Devices Running Junos OS
AI-Scripts and Advanced Insight
Manager (AIM)
AI-Scripts installed on the switch can
automatically detect and monitor faults on
the switch, and depending on the
configuration on the AIM application, send
notifications of potential problems and
submit problem reports to Juniper Support
Systems.
Advanced Insight Scripts (AI-Scripts)
Release Notes
Junos Space Service Now
This application enables you to display and
manage information about problem events.
When problems are detected on the switch
by Advanced Insight Scripts (AI-Scripts)
that are installed on the switch, the data is
collected and sent to Service Now for your
review and action.
Junos Space Service Now User Guide
Copyright © 2012, Juniper Networks, Inc.
Chapter 1: General Troubleshooting
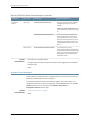
Table 3: Troubleshooting Resources on the QFX Series (continued)
Troubleshooting Resource
Description
Documentation
Junos Space Service Insight
This application helps in accelerating
operational analysis and managing the
exposure to known issues. You can identify
devices that are nearing their End Of Life
(EOL) and also discover and prevent issues
that could occur in your network. The
functionality of Service Insight is dependent
on the information sent from Service Now.
Junos Space Service Insight User Guide
Juniper Networks Knowledge Base
You can search in this database for Juniper
Networks product information, including
alerts and troubleshooting tips.
http://kb.juniper.net
Troubleshooting Overview
This topic provides a general guide to troubleshooting some typical problems you may
encounter on your QFX Series product.
Table 4 on page 5 provides a list of problem categories, summary of the symptom or
problem, and recommended actions with links to the troubleshooting documentation.
Table 4: Troubleshooting on the QFX Series
Problem Category
Symptom or Problem
Recommended Action
Switch hardware
components
LCD panel shows a chassis alarm count.
See “Chassis Alarm Messages on a QFX3500 Device”
on page 10.
Fan tray LED is blinking amber.
See Fan Tray LED on a QFX3500 Device.
Chassis status LED for the power is blinking
amber.
See Chassis Status LEDs on a QFX3500 Device.
Chassis status LED for the fan (on the
management board) is blinking amber.
Replace the management board as soon as possible.
See Chassis Status LEDs on a QFX3500 Device.
Copyright © 2012, Juniper Networks, Inc.
5
Troubleshooting on the QFX Series
Table 4: Troubleshooting on the QFX Series (continued)
Problem Category
Symptom or Problem
Recommended Action
Port configuration
Cannot configure a port as a Gigabit Ethernet
port.
Check whether the port is a valid Gigabit Ethernet
port (6 through 41).
See QFX3500 Device Overview.
Cannot configure a port as a Fibre Channel port.
Check whether the port is a valid Fibre Channel port
(0 through 5 and 42 through 47).
See QFX3500 Device Overview.
Cannot configure a port as a 10-Gigabit Ethernet
port.
If the port is not a 40-Gbps QSFP+ interface, check
whether the port is in the range of 0 through 5 or 42
through 47. If one of the ports in that block (0 through
5 or 42 through 47) is configured as a Fibre Channel
port, then all ports in that block must also be
configured as Fibre Channel ports.
If the port is a 40-Gbps QSFP+ interface. make sure
the configuration does not exceed the interface limit.
Each 40-Gbps QSFP+ interface can be split into four
10-Gigabit Ethernet interfaces, but because port 0
is reserved, so you can only configure an additional
fifteen 10-Gigabit Ethernet interfaces.
See QFX3500 Device Overview.
Cannot configure a 40-Gbps QSFP+ interface.
The 40-Gbps QSFP+ interfaces can only be used as
10-Gigabit Ethernet interfaces. Each 40-Gbps QSFP+
interface can be split into four 10-Gigabit Ethernet
interfaces using a breakout cable. However, port 0
is reserved, so you can only configure an additional
fifteen 10-Gigabit Ethernet interfaces.
See QFX3500 Device Overview.
External devices (USB
devices)
Upgrading software from a USB device results
in an upgrade failure, and the system enters an
invalid state.
Unplug the USB device and reboot the switch.
Initial device
configuration
Cannot configure management Ethernet ports.
Configure the management ports from the console
port. You cannot configure the management ports
by directly connecting to them.
NOTE: The management ports are on the front panel
of the QFX3500 switch. They are labeled C0 and C1
on the front panel. In the CLI they are referred to as
me0 and me1.
See Configuring a QFX3500 Device.
6
Copyright © 2012, Juniper Networks, Inc.
Chapter 1: General Troubleshooting
Table 4: Troubleshooting on the QFX Series (continued)
Problem Category
Symptom or Problem
Recommended Action
Software upgrade
and configuration
Failed software upgrade.
See “Recovering from a Failed Software Installation”
on page 40.
Active partition becomes inactive after upgrade.
Problem with the active configuration file.
Network interfaces
See the following topics:
•
Loading a Previous Configuration File on page 47
•
Reverting to the Default Factory Configuration on
page 48
•
Reverting to the Rescue Configuration on page 48
•
Performing a Recovery Installation on a QFX3500
Device and QFX3008-I Interconnect Device on
page 44
Root password is lost or forgotten.
Recover the root password. See “Recovering the Root
Password” on page 41.
An aggregated Ethernet interface is down.
See “Troubleshooting an Aggregated Ethernet
Interface” on page 59.
Interface on built-in network port is down.
See “Troubleshooting Network Interfaces” on
page 59.
Interface on port in which SFP or SFP+
transceiver is installed in an SFP+ uplink module
is down.
Ethernet switching
A MAC address entry in the Ethernet switching
table is not updated after the device with that
MAC address has been moved from one
interface to another on the switch.
See “Troubleshooting Ethernet Switching” on
page 51.
Firewall filter
Firewall configuration exceeded available
Ternary Content Addressable Memory (TCAM)
space.
See “Troubleshooting Firewall Filter Configuration”
on page 63.
Copyright © 2012, Juniper Networks, Inc.
7
Troubleshooting on the QFX Series
8
Copyright © 2012, Juniper Networks, Inc.
CHAPTER 2
Alarms
•
Understanding Alarms on page 9
•
Chassis Alarm Messages on a QFX3500 Device on page 10
•
Interface Alarm Messages on page 12
Understanding Alarms
QFX Series devices support different alarm types and severity levels. Table 5 on page 9
provides a list of alarm terms and definitions that may help you in monitoring the switch.
Table 5: Alarm Terms and Definitions
Term
Definition
Alarm
Signal alerting you to conditions that might prevent normal operation. On the switch, alarm indicators
include the LCD panel and LEDs on the front. The LCD panel displays the chassis alarm message count.
Blinking amber LEDs indicate yellow alarm conditions for chassis components.
Alarm condition
Failure event that triggers an alarm.
Alarm severity
levels
Seriousness of the alarm. The level of severity can be either major (red) or minor (yellow).
•
•
Alarm types
Major (red)—Indicates a critical situation on the switch that has resulted from one of the following
conditions. A red alarm condition requires immediate action.
•
One or more hardware components have failed.
•
One or more hardware components have exceeded temperature thresholds.
•
An alarm condition configured on an interface has triggered a critical warning.
Minor (yellow or amber)—Indicates a noncritical condition on the switch that, if left unchecked, might
cause an interruption in service or degradation in performance. A yellow alarm condition requires
monitoring or maintenance. For example, a missing rescue configuration generates a yellow system
alarm.
Alarms include the following types:
•
Chassis alarm—Predefined alarm triggered by a physical condition on the switch such as a power supply
failure or excessive component temperature.
•
Interface alarm—Alarm you configure to alert you when an interface link is down. Applies to ethernet,
fibre-channel, and management-ethernet interfaces. You can configure a red (major) or yellow (minor)
alarm for the link-down condition, or have the condition ignored.
•
System alarm—Predefined alarm triggered by a missing rescue configuration or failure to install a license
for a licensed software feature.
Copyright © 2012, Juniper Networks, Inc.
9
Troubleshooting on the QFX Series
Related
Documentation
•
Chassis Alarm Messages on a QFX3008-I Interconnect Device
•
Chassis Alarm Messages on a QFX3500 Device on page 10
•
Interface Alarm Messages on page 12
Chassis Alarm Messages on a QFX3500 Device
Chassis alarms indicate a failure on the device or one of its components. Chassis alarms
are preset and cannot be modified.
The chassis alarm message count is displayed on the LCD panel on the front of the device.
To view the chassis alarm message text remotely, use the show chassis lcd CLI command.
Chassis alarms on QFX3500 devices have two severity levels:
•
Major (red)—Indicates a critical situation on the device that has resulted from one of
the conditions described in Table 6 on page 10. A red alarm condition requires
immediate action.
•
Minor (yellow or amber)—Indicates a noncritical condition on the device that, if left
unchecked, might cause an interruption in service or degradation in performance. A
yellow alarm condition requires monitoring or maintenance.
Table 6 on page 10 describes the chassis alarm messages on QFX3500 devices.
Table 6: QFX3500 Chassis Alarm Messages
Component
Alarm Type
CLI Message
Recommended Action
Fans
Major (red)
Fan/Blower Absent
The fan is missing. Install a fan.
Fan Failure
Replace the fan and report the failure to
customer support.
Fan I2C Failure
Check the system log for one of the
following messages and report the error
message to customer support:
•
CM ENV Monitor: Get fan speed failed.
•
Fan-number is NOT spinning @ correct
speed, where fan-number may be 1, 2,
or 3.
Fan fan-number Not Spinning
10
Remove and check the fan for
obstructions, and then reinsert the fan. If
the problem persists, replace the fan.
Copyright © 2012, Juniper Networks, Inc.
Chapter 2: Alarms
Table 6: QFX3500 Chassis Alarm Messages (continued)
Component
Alarm Type
CLI Message
Recommended Action
Power supplies
Major (red)
PEM pem-number Airflow not matching
Chassis Airflow
The power supply airflow direction is the
opposite of the chassis airflow direction.
Replace the power supply with a power
supply that supports the same airflow
direction as the chassis.
PEM pem-number I2C Failure
Check the system log for one of the
following messages and report the error
message to customer support:
Minor (yellow)
Copyright © 2012, Juniper Networks, Inc.
•
I2C Read failed for device number,
where number may be from 123 to 125.
•
PS number: Transitioning from online to
offline, where power supply (PS)
number may be 1 or 2.
PEM pem-number is not powered
For information only. Check the power
cord connection and reconnect it if
necessary.
PEM pem-number is not supported
Indicates a power supply problem, or the
power supply is not supported on the
device. Report the problem to customer
support.
PEM pem-number Not OK
Indicates a problem with the incoming
AC or outgoing DC power. Replace the
power supply.
PEM pem-number Absent
For information only. Indicates the device
was powered on with two power supplies
installed, but now one is missing. The
device can continue to operate with a
single power supply. If you wish to
remove this alarm message, reboot the
device with one power supply.
PEM pem-number Power Supply Type
Mismatch
For information only. Indicates that an
AC power supply and DC power supply
have been installed in the same chassis.
If you wish to remove this alarm message,
reboot the device with two AC power
supplies or two DC power supplies.
PEM pem-number Removed
For information only. Indicates the device
was powered on with two power supplies
installed, but one has been removed. The
device can continue to operate with a
single power supply. If you wish to
remove this alarm message, reboot the
device with one power supply.
11
Troubleshooting on the QFX Series
Table 6: QFX3500 Chassis Alarm Messages (continued)
Component
Alarm Type
CLI Message
Recommended Action
Temperature
sensors
Major (red)
sensor-location Temp Sensor Fail
Check the system log for the following
message and report it to customer
support:
Temp sensor sensor-number failed, where
sensor-number may range from 1 through
10.
Minor (yellow)
Related
Documentation
sensor-location Temp Sensor Too Hot
Check environmental conditions and
alarms on other devices. Ensure that
environmental factors (such as hot air
blowing around the equipment) are not
affecting the temperature sensor. If the
condition persists, the device may shut
down.
sensor-location Temp Sensor Too Warm
For information only. Check
environmental conditions and alarms on
other devices. Ensure that environmental
factors (such as hot air blowing around
the equipment) are not affecting the
temperature sensor.
•
Front Panel of a QFX3500 Device
•
Configuring the Junos OS to Determine Conditions That Trigger Alarms on Different
Interface Types
•
alarm
Interface Alarm Messages
Interface alarms are alarms that you configure to alert you when an interface is down.
By default, interface alarms are not configured.
To configure an interface link-down condition to trigger a red or yellow alarm, or to
configure the link-down condition to be ignored, use the alarm statement at the [edit
chassis] hierarchy level. You can specify the ethernet, fibre-channel, or
management-ethernet interface type.
Related
Documentation
12
•
Understanding Alarms on page 9
•
alarm
Copyright © 2012, Juniper Networks, Inc.
PART 2
Administration
•
Routine Monitoring Using the CLI on page 15
•
Routine Monitoring in Junos Space on page 27
Copyright © 2012, Juniper Networks, Inc.
13
Troubleshooting on the QFX Series
14
Copyright © 2012, Juniper Networks, Inc.
CHAPTER 3
Routine Monitoring Using the CLI
•
Monitoring SNMP on page 15
•
Tracing SNMP Activity on a Device Running Junos OS on page 17
•
Monitoring RMON MIB Tables on page 20
•
Displaying a Log File from a Single-Chassis System on page 21
•
Monitoring System Log Messages on page 22
•
Monitoring Traffic Through the Router or Switch on page 23
•
Pinging Hosts on page 25
Monitoring SNMP
There are several commands that you can access in Junos OS operational mode to
monitor SNMP information. Some of the commands are:
•
show snmp health-monitor, which displays the health monitor log and alarm information.
•
show snmp mib, which displays information from the MIBs, such as device and system
information.
•
show snmp statistics, which displays SNMP statistics such as the number of packets,
silent drops, and invalid output values.
•
show snmp rmon, which displays the RMON alarm, event, history, and log information
The following example provides sample output from the show snmp health-monitor
command:
user@switch> show snmp health-monitor
Alarm
Index Variable description
32768 Health Monitor: root file system utilization
jnxHrStoragePercentUsed.1
Value State
58 active
32769 Health Monitor: /config file system utilization
jnxHrStoragePercentUsed.2
0 active
32770 Health Monitor: RE 0 CPU utilization
jnxOperatingCPU.9.1.0.0
0 active
32773 Health Monitor: RE 0 Memory utilization
Copyright © 2012, Juniper Networks, Inc.
15
Troubleshooting on the QFX Series
jnxOperatingBuffer.9.1.0.0
35 active
32775 Health Monitor: jkernel daemon CPU utilization
Init daemon
Chassis daemon
Firewall daemon
Interface daemon
SNMP daemon
MIB2 daemon
...
0
50
0
5
11
42
active
active
active
active
active
active
The following example provides sample output from the show snmp mib command:
user@switch> show snmp mib walk system
sysDescr.0
= Juniper Networks, Inc. qfx3500s internet router, kernel
JUNOS 11.1-20100926.0 #0: 2010-09-26 06:17:38 UTC [email protected]:
/volume/build/junos/11.1/production/20100926.0/obj-xlr/bsd/sys/compile/JUNIPER-xxxxx
Build date: 2010-09-26 06:00:10 U
sysObjectID.0 = jnxProductQFX3500
sysUpTime.0
= 24444184
sysContact.0 = J Smith
sysName.0
= Lab QFX3500
sysLocation.0 = Lab
sysServices.0 = 4
The following example provides sample output from the show snmp statistics command:
user@switch> show snmp statistics
SNMP statistics:
Input:
Packets: 0, Bad versions: 0, Bad community names: 0,
Bad community uses: 0, ASN parse errors: 0,
Too bigs: 0, No such names: 0, Bad values: 0,
Read onlys: 0, General errors: 0,
Total request varbinds: 0, Total set varbinds: 0,
Get requests: 0, Get nexts: 0, Set requests: 0,
Get responses: 0, Traps: 0,
Silent drops: 0, Proxy drops: 0, Commit pending drops: 0,
Throttle drops: 0, Duplicate request drops: 0
Output:
Packets: 0, Too bigs: 0, No such names: 0,
Bad values: 0, General errors: 0,
Get requests: 0, Get nexts: 0, Set requests: 0,
Get responses: 0, Traps: 0
Related
Documentation
16
•
health-monitor
•
show snmp mib
•
show snmp statistics
Copyright © 2012, Juniper Networks, Inc.
Chapter 3: Routine Monitoring Using the CLI
Tracing SNMP Activity on a Device Running Junos OS
SNMP tracing operations track activity for SNMP agents and record the information in
log files. The logged error descriptions provide detailed information to help you solve
problems faster.
By default, Junos OS does not trace any SNMP activity. If you include the traceoptions
statement at the [edit snmp] hierarchy level, the default tracing behavior is:
•
Important activities are logged in files located in the /var/log directory. Each log is
named after the SNMP agent that generates it. Currently, the following log files are
created in the /var/log directory when the traceoptions statement is used:
•
chassisd
•
craftd
•
ilmid
•
mib2d
•
rmopd
•
serviced
•
snmpd
•
When a trace file named filename reaches its maximum size, it is renamed filename.0,
then filename.1, and so on, until the maximum number of trace files is reached. Then
the oldest trace file is overwritten. (For more information about how log files are created,
see the Junos OS System Log Messages Reference.)
•
Log files can be accessed only by the user who configured the tracing operation.
You cannot change the directory (/var/log) in which trace files are located. However,
you can customize the other trace file settings by including the following statements at
the [edit snmp] hierarchy level:
[edit snmp]
traceoptions {
file <files number> <match regular-expression> <size size> <world-readable |
no-world-readable>;
flag flag;
no-remote-trace;
}
These statements are described in the following sections:
•
Configuring the Number and Size of SNMP Log Files on page 18
•
Configuring Access to the Log File on page 18
•
Configuring a Regular Expression for Lines to Be Logged on page 18
•
Configuring the Trace Operations on page 18
Copyright © 2012, Juniper Networks, Inc.
17
Troubleshooting on the QFX Series
Configuring the Number and Size of SNMP Log Files
By default, when the trace file reaches 128 kilobytes (KB) in size, it is renamed filename.0,
then filename.1, and so on, until there are three trace files. Then the oldest trace file
(filename.2) is overwritten.
You can configure the limits on the number and size of trace files by including the following
statements at the [edit snmp traceoptions] hierarchy level:
[edit snmp traceoptions]
file files number size size;
For example, set the maximum file size to 2 MB, and the maximum number of files to 20.
When the file that receives the output of the tracing operation (filename) reaches 2 MB,
filename is renamed filename.0, and a new file called filename is created. When the new
filename reaches 2 MB, filename.0 is renamed filename.1 and filename is renamed
filename.0. This process repeats until there are 20 trace files. Then the oldest file
(filename.19) is overwritten by the newest file (filename.0).
The number of files can be from 2 through 1000 files. The file size of each file can be from
10 KB through 1 gigabyte (GB).
Configuring Access to the Log File
By default, log files can be accessed only by the user who configured the tracing operation.
To specify that any user can read all log files, include the file world-readable statement
at the [edit snmp traceoptions] hierarchy level:
[edit snmp traceoptions]
file world-readable;
To explicitly set the default behavior, include the file no-world-readable statement at the
[edit snmp traceoptions] hierarchy level:
[edit snmp traceoptions]
file no-world-readable;
Configuring a Regular Expression for Lines to Be Logged
By default, the trace operation output includes all lines relevant to the logged activities.
You can refine the output by including the match statement at the [edit snmp traceoptions
file filename] hierarchy level and specifying a regular expression (regex) to be matched:
[edit snmp traceoptions]
file filename match regular-expression;
Configuring the Trace Operations
By default, only important activities are logged. You can specify which trace operations
are to be logged by including the following flag statement (with one or more tracing
flags) at the [edit snmp traceoptions] hierarchy level:
[edit snmp traceoptions]
flag {
18
Copyright © 2012, Juniper Networks, Inc.
Chapter 3: Routine Monitoring Using the CLI
all;
configuration;
database;
events;
general;
interface-stats;
nonvolatile-sets;
pdu;
policy;
protocol-timeouts;
routing-socket;
server;
subagent;
timer;
varbind-error;
}
Table 7 on page 19 describes the meaning of the SNMP tracing flags.
Table 7: SNMP Tracing Flags
Flag
Description
Default Setting
all
Log all operations.
Off
configuration
Log reading of the configuration at the
[edit snmp] hierarchy level.
Off
database
Log events involving storage and retrieval in the
events database.
Off
events
Log important events.
Off
general
Log general events.
Off
interface-stats
Log physical and logical interface statistics.
Off
nonvolatile-set
Log nonvolatile SNMP set request handling.
Off
pdu
Log SNMP request and response packets.
Off
policy
Log policy processing.
Off
protocol-timeouts
Log SNMP response timeouts.
Off
routing-socket
Log routing socket calls.
Off
server
Log communication with processes that are
generating events.
Off
subagent
Log subagent restarts.
Off
timer
Log internal timer events.
Off
Copyright © 2012, Juniper Networks, Inc.
19
Troubleshooting on the QFX Series
Table 7: SNMP Tracing Flags (continued)
Flag
Description
Default Setting
varbind-error
Log variable binding errors.
Off
To display the end of the log for an agent, issue the show log agentd | last operational
mode command:
[edit]
user@host# run show log agentd | last
where agent is the name of an SNMP agent.
Related
Documentation
•
Configuring SNMP on a Device Running Junos OS
•
Configuration Statements at the [edit snmp] Hierarchy Level
•
Example: Tracing SNMP Activity
•
Configuring SNMP
Monitoring RMON MIB Tables
Purpose
Action
Monitor remote monitoring (RMON) alarm, event, and log tables.
To display the RMON tables:
user@switch> show snmp rmon
Alarm
Index Variable description
5 monitor
jnxOperatingCPU.9.1.0.0
Value State
5 falling threshold
Event
Index Type
Last Event
1 log and trap
2010-07-10 11:34:17 PDT
Event Index: 1
Description: Event 1 triggered by Alarm 5, rising threshold (90) crossed,
(variable: jnxOperatingCPU.9.1.0.0, value: 100)
Time: 2010-07-10 11:34:07 PDT
Description: Event 1 triggered by Alarm 5, falling threshold (75) crossed,
(variable: jnxOperatingCPU.9.1.0.0, value: 5)
Time: 2010-07-10 11:34:17 PDT
Meaning
Related
Documentation
20
The display shows that an alarm has been defined to monitor jnxRmon MIB object
jnxOperatingCPU, which represents the CPU utilization of the Routing Engine. The alarm
is configured to generate an event that sends an SNMP trap and adds an entry to the
logTable in the RMON MIB. The log table shows that two occurrences of the event have
been generated—one for rising above a threshold of 90 percent, and one for falling below
a threshold of 75 percent.
•
Configuring RMON Alarms and Events
•
show snmp rmon
Copyright © 2012, Juniper Networks, Inc.
Chapter 3: Routine Monitoring Using the CLI
•
show snmp rmon history
•
clear snmp statistics
•
clear snmp history
Displaying a Log File from a Single-Chassis System
To display a log file stored on a single-chassis system such as the QFX3500 switch, enter
Junos OS CLI operational mode and issue the following commands:
user@switch> show log log-filename
user@switch> file show log-file-pathname
By default, the commands display the file stored on the local Routing Engine.
The following example shows the output from the show log messages command:
user@switch1> show log messages
Nov 4 11:30:01 switch1 newsyslog[2283]: logfile turned over due to size>128K
Nov 4 11:30:01 switch1 newsyslog[2283]: logfile turned over due to size>128K
Nov 4 11:30:06 switch1 chassism[952]: CM ENV Monitor: set fan speed is 65 percent
for Fan 1
Nov 4 11:30:06 switch1 chassism[952]: CM ENV Monitor: set fan speed is 65 percent
for Fan 2
Nov 4 11:30:06 switch1 chassism[952]: CM ENV Monitor: set fan speed is 65 percent
for Fan 3
...
Nov 4 11:52:53 switch1 snmpd[944]: SNMPD_HEALTH_MON_INSTANCE: Health Monitor:
jroute daemon memory usage (Management
process): new instance detected (variable: sysApplElmtRunMemory.5.6.2293)
Nov 4 11:52:53 switch1 snmpd[944]: SNMPD_HEALTH_MON_INSTANCE: Health Monitor:
jroute daemon memory usage (Command-line
interface): new instance detected (variable: sysApplElmtRunMemory.5.8.2292)
...
Nov 4 12:08:30 switch1 rpdf[957]: task_connect: task BGP_100.10.10.1.6+179 addr
10.10.1.6+179: Can't assign requested
address
Nov 4 12:08:30 switch1 rpdf[957]: bgp_connect_start: connect 10.10.1.6 (Internal
AS 100): Can't assign requested address
Nov 4 12:10:24 switch1 mgd[2293]: UI_CMDLINE_READ_LINE: User 'jsmith', command
'exit '
Nov 4 12:10:27 switch1 mgd[2293]: UI_DBASE_LOGOUT_EVENT: User 'jsmith' exiting
configuration mode
Nov 4 12:10:31 switch1 mgd[2293]: UI_CMDLINE_READ_LINE: User 'jsmith', command
'show log messages
The following example shows the output from the file show command. The file in the
pathname /var/log/processes has been previously configured to include messages from
the daemon facility.
user@switch1> file show /var/log/processes
Feb 22 08:58:24 switch1 snmpd[359]: SNMPD_TRAP_WARM_START: trap_generate_warm:
SNMP trap: warm start
Feb 22 20:35:07 switch1 snmpd[359]: SNMPD_THROTTLE_QUEUE_DRAINED:
trap_throttle_timer_handler: cleared all throttled traps
Feb 23 07:34:56 switch1 snmpd[359]: SNMPD_TRAP_WARM_START: trap_generate_warm:
SNMP trap: warm start
Feb 23 07:38:19 switch1 snmpd[359]: SNMPD_TRAP_COLD_START: trap_generate_cold:
Copyright © 2012, Juniper Networks, Inc.
21
Troubleshooting on the QFX Series
SNMP trap: cold start
...
Related
Documentation
•
Interpreting Messages Generated in Standard Format
•
Interpreting Messages Generated in Structured-Data Format
Monitoring System Log Messages
Purpose
Action
Display system log messages about the QFX Series. By looking through a system log file
for any entries pertaining to the interface that you are interested in, you can further
investigate a problem with an interface on the switch.
To view system log messages:
user@switch1> show log messages
Sample Output
Nov 4 11:30:01 switch1 newsyslog[2283]: logfile turned over due to size>128K
Nov 4 11:30:01 switch1 newsyslog[2283]: logfile turned over due to size>128K
Nov 4 11:30:06 switch1 chassism[952]: CM ENV Monitor: set fan speed is 65 percent
for Fan 1
Nov 4 11:30:06 switch1 chassism[952]: CM ENV Monitor: set fan speed is 65 percent
for Fan 2
Nov 4 11:30:06 switch1 chassism[952]: CM ENV Monitor: set fan speed is 65 percent
for Fan 3
...
Nov 4 11:52:53 switch1 snmpd[944]: SNMPD_HEALTH_MON_INSTANCE: Health Monitor:
jroute daemon
memory usage (Management process): new instance detected (variable:
sysApplElmtRunMemory.5.6.2293)
Nov 4 11:52:53 switch1 snmpd[944]: SNMPD_HEALTH_MON_INSTANCE: Health Monitor:
jroute daemon
memory usage (Command-line interface): new instance detected (variable:
sysApplElmtRunMemory.5.8.2292)
...
Nov 4 12:10:24 switch1 mgd[2293]: UI_CMDLINE_READ_LINE: User 'jsmith', command
'exit '
Nov 4 12:10:27 switch1 mgd[2293]: UI_DBASE_LOGOUT_EVENT: User 'jsmith' exiting
configuration mode
Nov 4 12:10:31 switch1 mgd[2293]: UI_CMDLINE_READ_LINE: User 'jsmith', command
'show log messages
Meaning
22
The sample output shows the following entries in the messages file:
•
A new log file was created when the previous file reached the maximum size of
128 kilobytes (KB).
•
The fan speed for Fan 1, 2, and 3 is set at 65 percent.
•
Health monitoring activity is detected.
•
CLI commands were entered by the user jsmith.
Copyright © 2012, Juniper Networks, Inc.
Chapter 3: Routine Monitoring Using the CLI
Monitoring Traffic Through the Router or Switch
To help with the diagnosis of a problem, display real-time statistics about the traffic
passing through physical interfaces on the router or switch.
To display real-time statistics about physical interfaces, perform these tasks:
1.
Displaying Real-Time Statistics About All Interfaces on the Router or Switch on page 23
2. Displaying Real-Time Statistics About an Interface on the Router or Switch on page 24
Displaying Real-Time Statistics About All Interfaces on the Router or Switch
Purpose
Display real-time statistics about traffic passing through all interfaces on the router or
switch.
Action
To display real-time statistics about traffic passing through all interfaces on the router
or switch:
user@host> monitor interface traffic
Sample Output
user@host> monitor interface traffic
host name
Seconds: 15
Time: 12:31:09
Interface
Link Input packets
(pps)
Output packets
(pps)
so-1/0/0
Down
0
(0)
0
(0)
so-1/1/0
Down
0
(0)
0
(0)
so-1/1/1
Down
0
(0)
0
(0)
so-1/1/2
Down
0
(0)
0
(0)
so-1/1/3
Down
0
(0)
0
(0)
t3-1/2/0
Down
0
(0)
0
(0)
t3-1/2/1
Down
0
(0)
0
(0)
t3-1/2/2
Down
0
(0)
0
(0)
t3-1/2/3
Down
0
(0)
0
(0)
so-2/0/0
Up
211035
(1)
36778
(0)
so-2/0/1
Up
192753
(1)
36782
(0)
so-2/0/2
Up
211020
(1)
36779
(0)
so-2/0/3
Up
211029
(1)
36776
(0)
so-2/1/0
Up
189378
(1)
36349
(0)
so-2/1/1
Down
0
(0)
18747
(0)
so-2/1/2
Down
0
(0)
16078
(0)
so-2/1/3
Up
0
(0)
80338
(0)
at-2/3/0
Up
0
(0)
0
(0)
at-2/3/1
Down
0
(0)
0
(0)
Bytes=b, Clear=c, Delta=d, Packets=p, Quit=q or ESC, Rate=r, Up=^U, Down=^D
Meaning
The sample output displays traffic data for active interfaces and the amount that each
field has changed since the command started or since the counters were cleared by using
the C key. In this example, the monitor interface command has been running for 15 seconds
since the command was issued or since the counters last returned to zero.
Copyright © 2012, Juniper Networks, Inc.
23
Troubleshooting on the QFX Series
Displaying Real-Time Statistics About an Interface on the Router or Switch
Purpose
Action
Display real-time statistics about traffic passing through an interface on the router or
switch.
To display traffic passing through an interface on the router or switch, use the following
Junos OS CLI operational mode command:
user@host> monitor interface interface-name
Sample Output
user@host> monitor interface so-0/0/1
Next='n', Quit='q' or ESC, Freeze='f', Thaw='t', Clear='c', Interface='i'
R1
Interface: so-0/0/1, Enabled, Link is Up
Encapsulation: PPP, Keepalives, Speed: OC3 Traffic statistics:
Input bytes:
5856541 (88 bps)
Output bytes:
6271468 (96 bps)
Input packets:
157629 (0 pps)
Output packets:
157024 (0 pps)
Encapsulation statistics:
Input keepalives:
42353
Output keepalives:
42320
LCP state: Opened
Error statistics:
Input errors:
0
Input drops:
0
Input framing errors:
0
Input runts:
0
Input giants:
0
Policed discards:
0
L3 incompletes:
0
L2 channel errors:
0
L2 mismatch timeouts:
0
Carrier transitions:
1
Output errors:
0
Output drops:
0
Aged packets:
0
Active alarms : None
Active defects: None
SONET error counts/seconds:
LOS count
1
LOF count
1
SEF count
1
ES-S
77
SES-S
77
SONET statistics:
BIP-B1
0
BIP-B2
0
REI-L
0
BIP-B3
0
REI-P
0
Received SONET overhead: F1
: 0x00 J0
: 0xZ
Meaning
24
The sample output shows the input and output packets for a particular SONET interface
(so-0/0/1). The information can include common interface failures, such as SONET/SDH
Copyright © 2012, Juniper Networks, Inc.
Chapter 3: Routine Monitoring Using the CLI
and T3 alarms, loopbacks detected, and increases in framing errors. For more information,
see Checklist for Tracking Error Conditions.
To control the output of the command while it is running, use the keys shown in Table 8
on page 25.
Table 8: Output Control Keys for the monitor interface Command
Action
Key
Display information about the next interface. The monitor interface command
scrolls through the physical or logical interfaces in the same order that they
are displayed by the show interfaces terse command.
N
Display information about a different interface. The command prompts you
for the name of a specific interface.
I
Freeze the display, halting the display of updated statistics.
F
Thaw the display, resuming the display of updated statistics.
T
Clear (zero) the current delta counters since monitor interface was started. It
does not clear the accumulative counter.
C
Stop the monitor interface command.
Q
See the Junos OS System Basics and Services Command Reference for details on using match
conditions with the monitor traffic command.
Pinging Hosts
Purpose
Action
Use the CLI ping command to verify that a host can be reached over the network. This
command is useful for diagnosing host and network connectivity problems. The switch
sends a series of Internet Control Message Protocol (ICMP) echo (ping) requests to a
specified host and receives ICMP echo responses.
To use the ping command to send four requests (ping count) to host3:
ping host count number
Sample Output
ping host3 count 4
user@switch> ping host3 count 4
PING host3.site.net (176.26.232.111): 56
64 bytes from 176.26.232.111: icmp_seq=0
64 bytes from 176.26.232.111: icmp_seq=1
64 bytes from 176.26.232.111: icmp_seq=2
64 bytes from 176.26.232.111: icmp_seq=3
data bytes
ttl=122 time=0.661
ttl=122 time=0.619
ttl=122 time=0.621
ttl=122 time=0.634
ms
ms
ms
ms
--- host3.site.net ping statistics --4 packets transmitted, 4 packets received, 0% packet loss
round-trip min/avg/max/stddev = 0.619/0.634/0.661/0.017 ms
Copyright © 2012, Juniper Networks, Inc.
25
Troubleshooting on the QFX Series
Meaning
26
•
The ping results show the following information:
•
Size of the ping response packet (in bytes).
•
IP address of the host from which the response was sent.
•
Sequence number of the ping response packet. You can use this value to match the
ping response to the corresponding ping request.
•
Time-to-live (ttl) hop-count value of the ping response packet.
•
Total time between the sending of the ping request packet and the receiving of the
ping response packet, in milliseconds. This value is also called round-trip time.
•
Number of ping requests (probes) sent to the host.
•
Number of ping responses received from the host.
•
Packet loss percentage.
•
Round-trip time statistics: minimum, average, maximum, and standard deviation of
the round-trip time.
Copyright © 2012, Juniper Networks, Inc.
CHAPTER 4
Routine Monitoring in Junos Space
•
Viewing Managed Devices on page 27
•
Viewing Hardware Inventory for Devices on page 31
•
Viewing Physical Interfaces for Devices on page 34
•
Viewing Device Snapshot Details on page 35
•
Scanning a Message for Impact on page 36
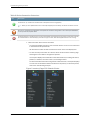
Viewing Managed Devices
You can view operating system, platform, IP-address, license, and connection status
information for all the managed devices in your network. Device information can be
viewed graphically or in a table. By default, Junos Space displays thumbnail
representations of devices.
You can also view managed devices from the Network Monitoring workspace, via the
Node List (see Viewing the Node List). The Network Monitoring workspace also enables
you to resync your managed devices (see Resyncing Nodes).
•
Viewing Devices as Graphics on page 27
•
Viewing Devices in a Table on page 29
Viewing Devices as Graphics
You can view thumbnails, summary information, and detailed information about the
devices managed by Junos Space.
To view the managed devices:
1.
From the navigation ribbon, select the Devices workspace.
2. From the navigation ribbon, select the Manage Devices icon.
The inventory page displays thumbnails of managed devices by name and IP address.
Above each thumbnail, an icon indicates whether the device is connected (up) or
down. Table 9 on page 28 describes the connection status icons.
Copyright © 2012, Juniper Networks, Inc.
27
Troubleshooting on the QFX Series
Table 9: Device Connection Status Icon
Icon
Description
Connection is up—The device is connected to Junos Space and is running properly.
NOTE: Before you can update a device from Junos Space (deploy service orders), the device connection must be
up.
Out of sync—The device is connected to Junos Space but the device configuration in the Junos Space database is
out of sync with the physical device.
Connection is down—The device is not currently connected to Junos Space or an event has occurred, either manually
by an administrator or automatically by the flow of a type of traffic, that has stopped the device from running.
3. View information about devices as follows:
•
To restrict the display of devices, enter a search criterion of one or more characters
in the Search bar and press Enter.
All devices that match the search criterion are shown in the main display area.
•
To view summary information for a device, select the device in the inventory page
and drag the zoom slider to the rightmost position.
Junos Space displays information about the selected device, including OS version,
platform, IP address, connection status, and managed status.
For SRX Series devices that are configured as a chassis cluster, Junos Space displays
a cluster icon and indicates whether the device is the primary or secondary device,
as shown in the following example.
Figure 1: Inventory Page: SRX Chassis Cluster
28
Copyright © 2012, Juniper Networks, Inc.
Chapter 4: Routine Monitoring in Junos Space
•
To view hardware inventory information for a device, double-click the thumbnail or
select the device, and click View Physical Inventory from the Actions drawer.
Viewing Devices in a Table
To view configuration and run-time information for devices in a table:
1.
From the navigation ribbon, select the Devices workspace.
2. Click the Table icon in the filter bar, as shown in the following example.
Figure 2: Table Icon
Junos Space displays a table of devices in the inventory page.
Figure 3: Device Table
Table 10 on page 29 describes the fields displayed in the inventory window.
Table 10: Fields in the Manage Devices Table
Field
Description
Name
The device configuration name.
Interfaces
Link to the view of physical interfaces for the device.
OS Version
Operating system firmware version running on the device.
Platform
Model number of the device.
IP Address
IP address of the device.
Connection Status
Connection status of the device in Junos Space.
•
up—Device is connected to Junos Space.
When connection status is up, the managed status is Out of Sync, Synchronizing, In Sync, or
Sync Failed.
•
down—Device is not connected to Junos Space.
When Connection status is down, the managed status is None or Connecting.
Copyright © 2012, Juniper Networks, Inc.
29
Troubleshooting on the QFX Series
Table 10: Fields in the Manage Devices Table (continued)
Field
Description
Managed Status
Current status of the managed device in Junos Space:
•
Connecting— Junos Space has sent connection RPC and is waiting for first connection from
device.
•
In Sync—Sync operation has completed successfully, and Junos Space and the device are
synchronized.
•
None—Device is discovered, but Junos Space has not yet sent connection RPC.
•
Out of Sync—Device has connected to Junos Space, but the sync operation has not been
initiated, or an out-of-band configuration change on the device was detected and auto-resync
is disabled or has not yet started.
•
Synchronizing—Sync operation has started because of device discovery, a manual re-sync
operation, or an automatic re-sync operation.
•
Sync Failed—Sync operation failed.
Device Family (not displayed
by default)
Device family of the selected device.
Serial Number (not displayed
by default)
Serial number of the device chassis.
3. Sort the table by mousing over the column header for the data you want to sort by
and clicking the down arrow. Select Sort Ascending or Sort Descending.
4. Show columns not in the default table view or hide columns as follows:
a. Mouse over any column header and click the down arrow.
b. Select Columns from the menu, as shown in the following example.
Figure 4: Selecting Columns
c. Select the check boxes for columns that you want to view. Clear the check boxes
for columns that you want to hide.
5. View information about devices as follows:
•
30
To restrict the display of devices, enter a search criterion of one or more characters
in the Search bar and press Enter.
Copyright © 2012, Juniper Networks, Inc.
Chapter 4: Routine Monitoring in Junos Space
All devices that match the search criterion are shown in the main display area.
Related
Documentation
•
To view hardware inventory information for a device, double-click the table row for
the device or select the row for the device, and click View Physical Inventory from
the Actions drawer.
•
To view the physical interfaces for a device, select the row for the device, and click
View Interfaces from the Actions drawer.
•
Viewing Device Statistics
•
Viewing Hardware Inventory for Devices on page 31
•
Viewing and Exporting Device License Inventory
•
Viewing Physical Interfaces for Devices on page 34
•
Discovering Devices
•
Viewing the Node List
•
Resyncing Nodes
Viewing Hardware Inventory for Devices
Hardware inventory information shows the slots that are available for a device and
provides information about power supplies, chassis cards, fans, part numbers, and so
forth. Junos Space displays hardware inventory by device name, based on data that Junos
Space retrieves both from the device during discovery and resync operations, and from
the data stored in the hardware catalog. For each managed device, the Junos Space
hardware catalog provides descriptions for field replaceable units (FRUs), part numbers,
model numbers, and the pluggable locations from which empty slots are determined.
Sorting is disabled for the hardware inventory page to preserve the natural slot order of
the devices.
To view hardware inventory for devices that Junos Space manages:
1.
From the navigation ribbon, select the Devices workspace.
2. From the navigation ribbon, select the Manage Devices icon.
The Manage Devices inventory page displays the devices managed in Junos Space.
3. Double-click a device to display its inventory.
Figure 5 on page 32 shows the device inventory page for a single device.
Copyright © 2012, Juniper Networks, Inc.
31
Troubleshooting on the QFX Series
Figure 5: Device Inventory: Single Chassis
Figure 6 on page 32 shows the device inventory for SRX Series chassis cluster devices.
This inventory record shows information for both the primary and secondary device.
Figure 6: Device Inventory: Chassis Cluster
Figure 7 on page 32 shows the device inventory for a Junos Space Network Application
Platform installation that includes Service Now and Service Insight. This inventory
record includes columns related to service contracts and end-of-life status.
Figure 7: Device Inventory: Service Information
Table 11 on page 33 describes the information displayed in the device inventory page.
32
Copyright © 2012, Juniper Networks, Inc.
Chapter 4: Routine Monitoring in Junos Space
Table 11: Device Inventory Fields
Field
Description
Item
Chassis component. Depending on the device type, can include the midplane, backplane,
power supplies, fan trays, Routing Engine, front panel module board, PDM, CIP, PEM,
SCG, CB, FPCs, and PICs.
Model Number
Model number for the chassis component.
Part Number
Part number and revision level of the component (FRU).
“BUILTIN” indicates the component is not a FRU.
Serial Number
Serial number of the component (FRU).
“BUILTIN” indicates the component is not a FRU.
Service SKU
Stock-keeping unit (SKU) identifier for the service contract associated with the part.
This data is populated by the Service Now Devices table. If Service Now is not installed,
or if the table contains no data, this column is not displayed.
Contract End
End date for the service contract associated with the part.
This data is populated by the Service Now Devices table. If Service Now is not installed,
or if the table contains no data, this column is not displayed.
EOL Status
Indicates whether end-of-life (EOL) data is available for the part.
This data is populated by the Service Insight Exposure Analyzer table. If Service Insight
is not installed, or if the table contains no data, this column is not displayed.
EOL Replacement Part
Part number for the replacement part identified by the Juniper Networks support
organization. This is the same information that would be published in an EOL
announcement bulletin. For an example, see PSN-2011-07-315.
This data is populated by the Service Insight Exposure Analyzer table. If Service Insight
is not installed, or if the table contains no data, this column is not displayed.
EOL Date
End-of-sale date reported in the EOL announcement bulletin. For an example, see
PSN-2011-07-315.
This data is populated by the Service Insight Exposure Analyzer table. If Service Insight
is not installed, or if the table contains no data, this column is not displayed.
Description
Description of the component or FRU.
4. Click Return to Inventory View to return to the device inventory page.
5. Click Export at the top of the inventory page to export the table in CSV format.
The Export Inventory Job Status dialog box appears, displaying the progress of the
job and the job ID.
6. Go to the Job Manager and click the download link to access the file.
Copyright © 2012, Juniper Networks, Inc.
33
Troubleshooting on the QFX Series
Related
Documentation
•
Displaying Service Contract and EOL Data in the Physical Inventory Table
•
Viewing Managed Devices on page 27
•
Viewing Physical Interfaces for Devices on page 34
•
Resynchronizing Managed Devices
•
Viewing and Exporting Device License Inventory
•
Understanding How Junos Space Automatically Resynchronizes Managed Devices
Viewing Physical Interfaces for Devices
Junos Space displays physical interfaces by device name, based on the device information
in its database. You can view the operational status and admin status of physical
interfaces for one or more devices to troubleshoot problems.
Sorting is disabled for the physical interfaces view to preserve the natural slot order of
the devices.
If the interface status changes on the managed device, the data is not updated in Junos
Space until the device is resynchronized with the Junos Space database.
To view the physical interfaces for devices:
1.
From the navigation ribbon, select the Devices workspace.
2. From the navigation ribbon, select the Manage Devices icon.
3. In the Manage Device inventory page, select the device for which you want to view
the physical interfaces.
4. In the Actions drawer, click View Interfaces.
Junos Space displays the status of the physical interfaces for a device.
Figure 8: Device Inventory: Physical Interfaces
Table 12 on page 34 describes the information displayed for the physical Interfaces.
Table 12: Physical Interfaces Columns
Field
Description
Device Name
Device configuration name.
34
Copyright © 2012, Juniper Networks, Inc.
Chapter 4: Routine Monitoring in Junos Space
Table 12: Physical Interfaces Columns (continued)
Field
Description
Interface Name
Standard information about the interface, in the format type-/fpc/pic/port, where
type is the media type that identifies the network device; for example, ge-0/0/6.
IP Address
IP address for the interface.
Operational Status
Operational status of the interface: up or down.
Admin Status
Admin status of the interface: up or down.
Encapsulation
Encapsulation used on the physical interface.
Link Type
Physical interface link type: full duplex or half duplex.
Speed (Mbps)
Speed at which the interface is running.
MTU
Maximum transmission unit size on the physical interface.
5. Click Return to Inventory View at the top of the inventory page.
Related
Documentation
•
Viewing Managed Devices on page 27
•
Viewing Hardware Inventory for Devices on page 31
•
Viewing and Exporting Device License Inventory
Viewing Device Snapshot Details
When Service Now receives iJMBs, only selected information appears on the Manage
Device Snapshots page. You can display the entire content of the iJMB using the View
JMB action in Service Now.
To view the details of an iJMB:
1.
From the Service Now task ribbon, select Service Central > Information > Device
Snapshots.
The Manage Device Snapshots page appears.
2. Select the organization whose iJMB contents you want to view, and select View JMB
from either the Actions panel or the right-click menu.
The View JMB dialog box displays links to the original and the filtered iJMBs as shown
in Figure 9 on page 36. The information in the filtered JMB is classified by the settings
on your Global Settings page.
Copyright © 2012, Juniper Networks, Inc.
35
Troubleshooting on the QFX Series
Figure 9: View JMB Dialog Box
3. Click a link to view the iJMB details.
Related
Documentation
•
Device Snapshots Overview
•
Exporting Device Data into HTML
•
Deleting Device Snapshots
•
Messages Overview
Scanning a Message for Impact
You can use Service Now to view the devices impacted by the vulnerabilities described
in the information message.
To scan iJMBs and view the impacted devices:
1.
From the Service Now task ribbon, select Service Central > Information > Messages.
The Manage Messages page appears.
2. Select the message that you want to scan for impact, and select Scan for Impact
from either the Actions panel or the right-click menu.
The Scan for Impact Results page displays the list of devices that are impacted by
the selected message. If no devices are impacted by the selected message, the
following message appears:
No impacted devices found.
Related
Documentation
36
•
Device Snapshots Overview
•
Assigning Ownership
•
Flagging a Message to Users
•
Deleting a Message
•
Assigning a Message to a Connected Member
•
Viewing Messages Assigned to a Connected Member
•
Messages Overview
Copyright © 2012, Juniper Networks, Inc.
PART 3
Troubleshooting
•
Junos OS Basics on page 39
•
Configuration and File Management on page 47
•
Ethernet Switching on page 51
•
High Availability on page 57
•
Interfaces on page 59
•
Layer 3 Protocols on page 61
•
Security on page 63
•
Services on page 69
•
Storage on page 71
•
Traffic Management on page 75
Copyright © 2012, Juniper Networks, Inc.
37
Troubleshooting on the QFX Series
38
Copyright © 2012, Juniper Networks, Inc.
CHAPTER 5
Junos OS Basics
•
Rebooting and Halting a QFX Series Product on page 39
•
Recovering from a Failed Software Installation on page 40
•
Recovering the Root Password on page 41
•
Creating an Emergency Boot Device for a QFX Series Device on page 43
•
Performing a Recovery Installation on a QFX3500 Device and QFX3008-I Interconnect
Device on page 44
•
Performing a Recovery Installation of the Director Group on page 45
Rebooting and Halting a QFX Series Product
To reboot the switch, issue the request system reboot command.
user@switch> request system reboot ?
Possible completions:
<[Enter]>
Execute this command
at
Time at which to perform the operation
in
Number of minutes to delay before operation
media
Boot media for next boot
message
Message to display to all users
|
Pipe through a command
user@switch> request system reboot
Reboot the system ? [yes,no] (no) yes
Rebooting switch
Similarly, to halt the switch, issue the request system halt command.
CAUTION: Before entering this command, you must have access to the
switch’s console port in order to bring up the Routing Engine.
user@switch> request system halt ?
Possible completions:
<[Enter]>
Execute this command
at
Time at which to perform the operation
in
Number of minutes to delay before operation
media
Boot media for next boot
message
Message to display to all users
|
Pipe through a command
Copyright © 2012, Juniper Networks, Inc.
39
Troubleshooting on the QFX Series
NOTE: When you issue this command on an individual component in a QFabric
system, you will receive a warning that says “Hardware-based members will
halt, Virtual Junos Routing Engines will reboot.” If you want to halt only one
member, use the member option. You cannot issue this command from the
QFabric CLI.
Issuing the request system halt command on the switch halts the Routing Engine. To
reboot a Routing Engine that has been halted, you must connect through the console.
Related
Documentation
•
clear system reboot
•
request system reboot
•
request system halt
•
request system power-off
•
Connecting a QFX Series Device to a Management Console
Recovering from a Failed Software Installation
Problem
If the Junos OS appears to have been installed but the CLI does not work, or if the switch
has no software installed, you can use this recovery installation procedure to install the
Junos OS.
Solution
If a Junos OS image already exists on the switch, you can either install the new Junos OS
package in a separate partition, in which case both Junos OS images remain on the switch,
or you can remove the existing Junos OS image before you start the new installation
process.
To perform a recovery installation:
1.
Power on the switch. The loader script starts.
2. After the message Loading /boot/defaults/loader.conf appears, you are prompted
with the following message:
Hit [Enter] to boot immediately, or space bar for command prompt.
Press the Spacebar to enter the manual loader. The loader> prompt appears.
3. Enter the following command:
loader> install [– –format] [– –external] source
where:
•
format—Enables you to erase the installation media before installing the installation
package. If you do not include this option, the system installs the new Junos OS in
a different partition from that of the most recently installed Junos OS.
•
external—Installs the installation package onto external media (a USB stick, for
example).
40
Copyright © 2012, Juniper Networks, Inc.
Chapter 5: Junos OS Basics
•
source—Represents the name and location of the Junos OS package, either on a
server on the network or as a file on an external media, as shown in the following
two examples:
•
Network address of the server and the path on the server; for example,
tftp://192.17.1.28/junos/jinstall-qfx-11.1R1.5-domestic-signed.tgz
•
Junos OS package on a USB device (commonly stored in the root drive as the
only file), for example, file:///jinstall-qfx-11.1R1.5-domestic-signed.tgz).
The installation now proceeds normally and ends with a login prompt.
Recovering the Root Password
If you forget the root password for the QFX3500 switch, you can use the password
recovery procedure to reset the root password.
NOTE: The root password cannot be recovered on a QFabric switch.
NOTE: You need console access to the switch to recover the root password.
To recover the root password:
1.
Power off the switch by switching off the AC power outlet of the device or, if necessary,
by pulling the power cords out of the QFX3500 switch power supplies.
2. Turn off the power to the management device, such as a PC or laptop computer, that
you want to use to access the CLI.
3. Plug one end of the Ethernet rollover cable supplied with the switch into the
RJ-45–to–DB-9 serial port adapter supplied with the switch.
4. Plug the RJ-45–to–DB-9 serial port adapter into the serial port on the management
device.
5. Connect the other end of the Ethernet rollover cable to the console port on the switch.
6. Turn on the power to the management device.
7. On the management device, start your asynchronous terminal emulation application
(such as Microsoft Windows Hyperterminal) and select the appropriate COM port to
use (for example, COM1).
8. Configure the port settings as follows:
•
Bits per second: 9600
•
Data bits: 8
•
Parity: None
Copyright © 2012, Juniper Networks, Inc.
41
Troubleshooting on the QFX Series
•
Stop bits: 1
•
Flow control: None
9. Power on the switch by (if necessary) plugging the power cords into the QFX3500
switch power supply, or turning on the power to the device or switch by switching on
the AC power outlet the device is plugged into
The terminal emulation screen on your management device displays the switch’s boot
sequence.
10. When the following prompt appears, press the Spacebar to access the switch’s
bootstrap loader command prompt:
Hit [Enter] to boot immediately, or space bar for command prompt.
Booting [kernel] in 9 seconds...
11. At the following prompt, enter boot -s to start up the system in single-user mode.
ok boot -s
12. At the following prompt, enter recovery to start the root password recovery procedure.
Enter full pathname of shell or 'recovery' for root password recovery or
RETURN for /bin/sh: recovery
13. Enter configuration mode in the CLI.
14. Set the root password. For example:
user@switch# set system root-authentication plain-text-password
15. At the following prompt, enter the new root password. For example:
New password: juniper1
Retype new password:
16. At the second prompt, reenter the new root password.
17. After you have finished configuring the password, commit the configuration.
root@host# commit
commit complete
18. Exit configuration mode in the CLI.
19. Exit operational mode in the CLI.
20. At the prompt, enter y to reboot the switch.
Reboot the system? [y/n] y
Related
Documentation
42
•
Configuring the Root Password
Copyright © 2012, Juniper Networks, Inc.
Chapter 5: Junos OS Basics
Creating an Emergency Boot Device for a QFX Series Device
If Junos OS on your QFX Series device is damaged in some way that prevents the software
from loading properly, you can use an emergency boot device to repartition the primary
disk and load a fresh installation of Junos OS. Use the following procedure to create an
emergency boot device.
Before you begin, you need to download the installation media image for your device
and Junos OS release from http://www.juniper.net/customers/support/ .
NOTE: The following procedure assumes that you are creating the device on
a QFX3500 switch. You can create the emergency boot device on another
Juniper Networks switch or router, or any PC or laptop that supports Linux.
The steps you take to create the emergency boot device vary, depending on
the device.
To create an emergency boot device from a QFX3500 switch:
1.
Use FTP to copy the installation media image into the /var/tmp directory on the switch.
2. Insert a USB device into the USB port.
3. From the Junos OS command-line interface (CLI), start the shell:
user@switch> start shell
%
4. Switch to the root account using the su command:
% su
Password: password
NOTE: The password is the root password for the switch. If you logged in
to the switch as root, you do not need to perform this step.
5. Enter the following command:
root@switch% dd if=/var/tmp/filename of=/dev/da1 bs=16k
The switch writes the installation media image to the USB device:
root@switch% dd
bs=16k
11006+1 records
11006+1 records
180332544 bytes
if=/var/tmp/install-media-qfx3500.junos_11.1 of=/dev/da1
in
out
transferred in 71.764266 secs (2512846 bytes/sec)
6. Log out of the shell:
root@switch% exit
Copyright © 2012, Juniper Networks, Inc.
43
Troubleshooting on the QFX Series
% exit
user@switch>
Related
Documentation
•
USB Port Specifications for the QFX Series
•
Performing a Recovery Installation on a QFX3500 Device and QFX3008-I Interconnect
Device on page 44
•
Performing a QFabric Switch Recovery Installation on the Director Group
•
Performing a Recovery Installation of the Director Group on page 45
Performing a Recovery Installation on a QFX3500 Device and QFX3008-I Interconnect
Device
If Junos OS on your device is damaged in some way that prevents the software from
loading correctly, you may need to perform a recovery installation using an emergency
boot device (for example, a USB flash drive) to restore the default factory installation.
Once you have recovered the software, you need to restore the device configuration. You
can either create a new configuration as you did when the device was shipped from the
factory, or if you saved the previous configuration, you can simply restore that file to the
device.
If at all possible, you should try to perform the following steps before you perform the
recovery installation:
1.
Ensure that you have an emergency boot device to use during the installation.
2. Copy the existing configuration in the file /config/juniper.conf.gz from the device to a
remote system, such as a server, or to an emergency boot device. For extra safety,
you can also copy the backup configurations (the files named /config/juniper.conf.n,
where n is a number from 0 through 9) to a remote system or to an emergency boot
device.
WARNING: The recovery installation process completely overwrites the
entire contents of the internal flash storage.
3. Copy any other stored files to a remote system as desired.
To reinstall Junos OS:
1.
Insert the emergency boot device into the device.
2. Reboot the switch.
NOTE: Do not power off the device if it is already on.
[edit system]
user@switch> request system reboot
44
Copyright © 2012, Juniper Networks, Inc.
Chapter 5: Junos OS Basics
3. When the software prompts you with the following question, type y:
WARNING: The installation will erase the contents of your disk. Do you
wish to continue (y/n)? y
4. The device copies the software from the emergency boot device, occasionally
displaying status messages. Copying the software can take up to 10 minutes.
When the device is finished copying the software, you are presented with the following
prompt:
*** Mon Mar 21 21:08:41 UTC 2011 ***
Installation successful..
Please select one of the following options:
Reboot to installed Junos after removing install media (default) ...
Reboot to installed Junos by disabling install media ...............
Exit to installer debug shell ......................................
Install Junos to alternate slice ...................................
Your choice: 4
NOTE: System installer will now install Junos to alternate slice
Do not power off or remove the external installer media or
interrupt the installation mechanism.
1
2
3
4
5. Select 4 to install Junos OS to the alternate slice of the partition, and then press Enter.
6. Remove the emergency boot device when prompted and then press Enter. The device
then reboots from the internal flash storage on which the software was just installed.
When the reboot is complete, the device displays the login prompt.
7. Create a new configuration as you did when the device was shipped from the factory,
or restore the previously saved configuration file to the device.
Related
Documentation
•
Creating an Emergency Boot Device for a QFX Series Device on page 43
Performing a Recovery Installation of the Director Group
If Junos OS on your Director group is damaged in some way that prevents the software
from loading correctly, you may need to perform a recovery installation using an
emergency boot device (external USB flash drive) to restore the default factory
installation. Once you have recovered the software, you need to restore the Director
group configuration. You can either create a new configuration as you did when the
Director group was shipped from the factory, or if you saved the previous configuration,
you can simply restore that file to the Director group.
You can reinstall Junos OS with or without access to the QFabric system default partition.
•
1.
This procedure describes how to boot and reinstall Junos OS on a Director group with
no access to the QFabric system default partition.
Ensure that you have an emergency boot device (external USB device) with Junos OS
installed to use during the installation.
2. Insert the external USB device in the USB port.
A menu like the following appears once you are connected to the Director group:
Copyright © 2012, Juniper Networks, Inc.
45
Troubleshooting on the QFX Series
Juniper Networks QFabric Director Install/Recovery Media
-
To boot from the USB device, wait 10 seconds or press the <ENTER> key.
-
To reinstall the QFabric software on this Director device, type: install
and then press the <ENTER> key.
-
To perform a network installation on this Director device, type: network
<ENTER>
3. To reinstall the software on the Director group, type install and then press Enter.
The Director group copies the software from the external USB device, occasionally
displaying status messages. Copying the software can take up to 10 minutes.
4. Remove the external USB device when prompted, and then press Enter.
The Director group then reboots from the internal flash storage on which the software
was just installed. When the reboot is complete, the Director group displays the login
prompt.
5. Create a new configuration as you did when the Director group was shipped from the
factory, or restore the previously saved configuration file to the Director group.
•
This procedure describes how to boot and reinstall Junos OS on a Director group with
access to the QFabric system default partition:
1.
Ensure that you have an emergency boot device (external USB device) to use during
the installation.
2. Log in to the QFabric system default partition.
3. To download the software from the external USB device, issue the request system
software download command and specify the path and the package name on the
external USB device:
request system software download /media/usbdisk/jinstall-qfabric-11.3R1.4.rpm
4. To install the software, issue the request system software add package-name component
director-group reboot command and specify the name of the software package:
request system software add jinstall-qfabric-11.3R1.4.rpm component director-group
reboot
The Director group copies the software from the external USB device, occasionally
displaying status messages. Copying the software can take up to 10 minutes.
5. Remove the external USB device when prompted, and then press Enter.
The Director group then reboots from the internal flash storage on which the software
was just installed. When the reboot is complete, the Director group displays the login
prompt.
6. Create a new configuration as you did when the Director group was shipped from the
factory, or restore the previously saved configuration file to the Director group.
46
Copyright © 2012, Juniper Networks, Inc.
CHAPTER 6
Configuration and File Management
•
Loading a Previous Configuration File on page 47
•
Reverting to the Default Factory Configuration on page 48
•
Reverting to the Rescue Configuration on page 48
•
Cleaning Up the System File Storage Space on page 49
Loading a Previous Configuration File
You can use the rollback <number command to return to a previously committed
configuration file. A switch saves the last 50 committed configurations, including the
rollback number, date, time, and name of the user who issued the commit configuration
command.
Syntax
rollback <number>
Options
•
none— Return to the most recently saved configuration.
•
number—Configuration to return to.
•
Range: 0 through 49. The most recently saved configuration is number 0, and the
oldest saved configuration is number 49.
•
Default: 0
To return to a configuration prior to the most recently committed one:
1.
Specify the rollback number (here, 1 is entered and the configuration returns to the
previously committed configuration):
[edit]
user@switch# rollback 1
load complete
2. Activate the configuration you have loaded:
[edit]
user@switch# commit
Copyright © 2012, Juniper Networks, Inc.
47
Troubleshooting on the QFX Series
Related
Documentation
•
Configuration File Terms
Reverting to the Default Factory Configuration
If for any reason the current active configuration fails, you can revert to the default factory
configuration. The default factory configuration contains the basic configuration settings.
This is the first configuration of the switch, and it is loaded when the switch is first installed
and powered on.
The load factory default command is a standard Junos OS configuration command. This
configuration command replaces the current active configuration with the default factory
configuration.
To revert the switch to the rescue configuration:
1.
Related
Documentation
[edit]
user@switch# load factory-default
[edit]
user@switch# delete system commit factory-settings
[edit]
user@switch# commit
•
Understanding Configuration Files
•
Loading a Previous Configuration File on page 47
•
Reverting to the Rescue Configuration on page 48
Reverting to the Rescue Configuration
If someone inadvertently commits a configuration that denies management access to
a QFX Series product and the console port is not accessible, you can overwrite the invalid
configuration and replace it with the rescue configuration. The rescue configuration is a
previously committed, valid configuration.
To revert the switch to the rescue configuration:
1.
Enter the load override command.
[edit]
user@switch# load override filename
2. Commit your changes.
[edit]
user@switch# commit filename
Related
Documentation
48
•
Setting or Deleting the Rescue Configuration
•
Reverting to the Default Factory Configuration on page 48
•
Configuration File Terms
Copyright © 2012, Juniper Networks, Inc.
Chapter 6: Configuration and File Management
Cleaning Up the System File Storage Space
Problem
The system file storage space on the switch is full. Rebooting the switch does not solve
the problem.
The following error message is displayed during a typical operation on the switch after
the file storage space is full.
user@switch% cli
user@switch> configure
/var: write failed, filesystem is full
Solution
Clean up the file storage on the switch by deleting system files.
1.
Request to delete system files on the switch.
user@switch> request system storage cleanup
The list of files to be deleted is displayed.
List of files to delete:
Size Date
Name
11B Jul 26 20:55 /var/jail/tmp/alarmd.ts
124B Aug 4 18:05 /var/log/default-log-messages.0.gz
1301B Jul 26 20:42 /var/log/install.0.gz
387B Jun 3 14:37 /var/log/install.1.gz
4920B Aug 4 18:05 /var/log/messages.0.gz
20.0K Jul 26 21:00 /var/log/messages.1.gz
16.3K Jun 25 13:45 /var/log/messages.2.gz
804B Aug 4 18:05 /var/log/security.0.gz
16.8K Aug 3 11:15 /var/log/security.1.gz
487B Aug 4 18:04 /var/log/wtmp.0.gz
855B Jul 29 22:54 /var/log/wtmp.1.gz
920B Jun 30 16:32 /var/log/wtmp.2.gz
94B Jun 3 14:36 /var/log/wtmp.3.gz
353.2K Jun 3 14:37
/var/sw/pkg/jloader-qfx-11.2I20110303_1117_dc-builder.tgz
124.0K Jun 3 14:30 /var/tmp/gres-tp/env.dat
0B Apr 14 16:20 /var/tmp/gres-tp/lock
0B Apr 14 17:37 /var/tmp/if-rtsdb/env.lck
12.0K Jul 26 20:55 /var/tmp/if-rtsdb/env.mem
2688.0K Jul 26 20:55 /var/tmp/if-rtsdb/shm_usr1.mem
132.0K Jul 26 20:55 /var/tmp/if-rtsdb/shm_usr2.mem
2048.0K Jul 26 20:55 /var/tmp/if-rtsdb/trace.mem
155B Jul 26 20:55 /var/tmp/krt_gencfg_filter.txt
0B Jul 26 20:55 /var/tmp/rtsdb/if-rtsdb
1400.6K Aug 3 10:13 /var/tmp/sfid.core.0.gz
1398.9K Aug 3 17:01 /var/tmp/sfid.core.1.gz
Delete these files ? [yes,no] (no)
2. Enter yes to delete the files.
3. Reboot the switch.
BEST PRACTICE: We recommend that you regularly request a system file
storage cleanup to optimize the performance of the switch.
Copyright © 2012, Juniper Networks, Inc.
49
Troubleshooting on the QFX Series
Related
Documentation
50
•
request system storage cleanup
Copyright © 2012, Juniper Networks, Inc.
CHAPTER 7
Ethernet Switching
•
Troubleshooting Ethernet Switching on page 51
•
Troubleshooting Layer 2 Protocol Tunneling on page 52
•
Troubleshooting Private VLANs on page 53
•
Troubleshooting Q-in-Q and VLAN Translation Configuration on page 54
Troubleshooting Ethernet Switching
Problem
Sometimes a MAC address entry in the switch’s Ethernet switching table is not updated
after the device with that MAC address has been moved from one interface to another
on the switch. Typically, the switch does not wait for a MAC address expiration when a
MAC move operation occurs. As soon as the switch detects the MAC address on the new
interface, it immediately updates the table. Many network devices send a gratuitous ARP
packet when switching an IP address from one device to another. The switch updates
its ARP cache table after receipt of such gratuitous ARP messages, and then it also
updates its Ethernet switching table.
Sometimes silent devices, such as syslog servers or SNMP trap receivers that receive
UDP traffic but do not return acknowledgment (ACK) messages to the traffic source,
fail to send gratuitous ARP packets when a device moves. If such a move occurs when
the system administrator is not available to explicitly clear the affected interfaces by
issuing the clear ethernet-switching table command, the entry for the moved device in
the Ethernet switching table is not updated.
Solution
Set up the switch to handle unattended MAC address switchovers.
1.
Reduce the system-wide ARP aging timer. (By default, the ARP aging timer is set at
20 minutes. The range of the ARP aging timer is from 1 through 240 minutes.)
[edit system arp]
user@switch# set aging-timer 3
2. Set the MAC aging timer to the same value as the ARP timer. (By default, the MAC
aging timer is set to 300 seconds. The range is 15 to 1,000,000 seconds.)
[edit vlans]
user@switch# set vlans sales mac-table-aging-time 180
The ARP entry and the MAC address entry for the moved device expire within the times
specified by the aging timer values. After the entries expire, the switch sends a new ARP
Copyright © 2012, Juniper Networks, Inc.
51
Troubleshooting on the QFX Series
message to the IP address of the device. The device responds to the ARP message,
thereby refreshing the entries in the switch’s ARP cache table and Ethernet switching
table.
Related
Documentation
•
arp
•
mac-table-aging-time
Troubleshooting Layer 2 Protocol Tunneling
•
Drop Threshold Statistics Might Be Incorrect on page 52
•
Egress Filtering of L2PT Traffic Not Supported on page 52
Drop Threshold Statistics Might Be Incorrect
Problem
L2PT processing is done by the CPU, and L2PT traffic to the CPU is rate limited to a
maximum of 1000 pps. If traffic is received at a rate faster than this limit, the rate limit
will cause the traffic to be dropped before it hits the threshold and the dropped packets
will not be reported in L2PT statistics. This can also occur if you configure a drop threshold
that is less than 1000 pps but traffic is received at a faster rate. For example, if you
configure a drop threshold of 900 pps and the VLAN receives traffic at rate of 1100 pps,
L2PT statistics will show that 100 packets were dropped. The 100 packets dropped
because of the rate limit will not be reported. Similarly, if you do not configure a drop
threshold and the VLAN receives traffic at rate of 1100 pps, the 100 packets dropped
because of the rate limit will not be reported.
Solution
This is expected behavior.
Egress Filtering of L2PT Traffic Not Supported
Problem
Egress filtering of L2PT traffic is not supported on the QFX3500 switch. That is, if you
configure L2PT to tunnel a protocol on an interface, you cannot also use a firewall filter
to filter traffic for that protocol on that interface in the output direction. If you commit a
configuration for this purpose, the firewall filter is not applied to the L2PT-tunneled traffic.
Solution
This is expected behavior.
Related
Documentation
52
•
Understanding Layer 2 Protocol Tunneling
•
Configuring Layer 2 Protocol Tunneling
Copyright © 2012, Juniper Networks, Inc.
Chapter 7: Ethernet Switching
Troubleshooting Private VLANs
Use the following information to troubleshoot a private VLAN configuration.
•
Limitations of Private VLANs on page 53
•
Forwarding with Private VLANs on page 53
•
Egress Firewall Filters with Private VLANs on page 53
Limitations of Private VLANs
The following constraints apply to private VLAN configurations:
•
IGMP snooping is not supported with private VLANs.
•
Routed VLAN interfaces are not supported on private VLANs
•
Routing between secondary VLANs in the same primary VLAN is not supported.
Forwarding with Private VLANs
Problem
•
When isolated VLAN or community VLAN tagged traffic is received on a PVLAN trunk
port, MAC addresses are learned from the primary VLAN. This means that show
ethernet-switching table output will show that MAC addresses are learned from the
primary VLAN and replicated to secondary VLAN’s. This behavior has no affect on
forwarding decisions.
•
If a packet with a secondary VLAN tag is received on a promiscuous port, it is accepted
and forwarded.
•
If a packet is received on a PVLAN trunk port and meets both of the conditions listed
below, it is dropped.
•
Solution
•
The packet has a community VLAN tag.
•
The packet is destined to a unicast MAC address or multicast group MAC address
that was learned on an isolated VLAN.
If a packet is received on a PVLAN trunk port and meets both of the conditions listed
below, it is dropped.
•
The packet has an isolated VLAN tag.
•
The packet is destined to a unicast MAC address or multicast group MAC address
that was learned on a community VLAN.
These are expected behaviors.
Egress Firewall Filters with Private VLANs
Problem
The following behaviors occur if you apply a firewall filter to a private VLAN in the output
direction:
Copyright © 2012, Juniper Networks, Inc.
53
Troubleshooting on the QFX Series
Solution
Related
Documentation
•
If you apply an egress filter to a primary VLAN, the filter is also applied to traffic egressing
from downstream community and isolated ports.
•
If you apply an egress filter to a community VLAN and traffic arrives from an upstream
promiscuous port and later egresses from the community VLAN, the filter is not applied
to this traffic because forwarding is based on primary VLAN, not the community VLAN.
•
If you apply an egress filter to a community VLAN, the filter also applies to packets
with the community VLAN tag when they egress an upstream promiscuous port. (The
filter does not apply to packets with the primary VLAN tag when they egress the
promiscuous port.)
These are expected behaviors. They occur only if you apply a firewall filter to a private
VLAN in the output direction and do not occur if you apply a firewall filter to a private
VLAN in the input direction.
•
Understanding Private VLANs
•
Creating a Private VLAN on a Single Switch
•
Creating a Private VLAN Spanning Multiple Switches
Troubleshooting Q-in-Q and VLAN Translation Configuration
•
Firewall Filter Match Condition Not Working with Q-in-Q Tunneling on page 54
•
Egress Port Mirroring with VLAN Translation on page 54
Firewall Filter Match Condition Not Working with Q-in-Q Tunneling
Problem
If you create a firewall filter that includes a match condition of dot1q-tag or
dot1q-user-priority and apply the filter on input to a trunk port that participates in a service
VLAN, the match condition does not work if the Q-in-Q Ethertype is not 0x8100. (When
Q-in-Q tunneling is enabled, trunk interfaces are assumed to be part of the service provider
or data center network and therefore participate in service VLANs.)
Solution
This is expected behavior. To set the Q-in-Q Ethertype to 0x8100 enter the statement
set dot1q-tunneling ethertype 0x8100 at the [edit ethernet-switching-options] hierarchy
level. You must also configure the other end of the link to use the same Ethertype.
Egress Port Mirroring with VLAN Translation
54
Problem
If you create a port mirroring configuration that mirrors customer VLAN (CVLAN) traffic
on egress and the traffic undergoes VLAN translation before being mirrored, the VLAN
translation does not apply to the mirrored packets. That is, the mirrored packets retain
the service VLAN (SVLAN) tag that should be replaced by the CVLAN tag on egress. The
original packets are unaffected—on these packets VLAN translation works properly and
the SVLAN tag is replaced with the CVLAN tag on egress.
Solution
This is expected behavior.
Copyright © 2012, Juniper Networks, Inc.
Chapter 7: Ethernet Switching
Related
Documentation
•
Understanding Q-in-Q Tunneling and VLAN Translation
•
Example: Setting Up Q-in-Q Tunneling
Copyright © 2012, Juniper Networks, Inc.
55
Troubleshooting on the QFX Series
56
Copyright © 2012, Juniper Networks, Inc.
CHAPTER 8
High Availability
•
Troubleshooting VRRP on page 57
Troubleshooting VRRP
Problem
If you configure multiple VRRP groups on an interface (using multiple VLANs), traffic for
some of the groups might be briefly dropped if a failover occurs. This can happen because
the new master must send gratuitous ARP replies for each VRRP group to update the
ARP tables in the connected devices, and there is a short delay between each gratuitous
ARP reply. Traffic sent by devices that have not yet received the gratuitous ARP reply is
dropped (until the device receives the reply and learns the MAC address of the new
master).
Solution
Configure a failover delay so that the new master delays sending gratuitous ARP replies
for the period that you set. This allows the new master to send the ARP replies for all of
the VRRP groups simultaneously.
Related
Documentation
•
failover-delay
Copyright © 2012, Juniper Networks, Inc.
57
Troubleshooting on the QFX Series
58
Copyright © 2012, Juniper Networks, Inc.
CHAPTER 9
Interfaces
•
Troubleshooting an Aggregated Ethernet Interface on page 59
•
Troubleshooting Network Interfaces on page 59
Troubleshooting an Aggregated Ethernet Interface
Problem
The show interfaces terse command shows that the LAG is down.
Solution
Check the following:
Related
Documentation
•
Verify that there is no configuration mismatch.
•
Verify that all member ports are up.
•
Verify that a LAG is part of family ethernet-switching (Layer 2 LAG) or family inet (Layer
3 LAG).
•
Verify that the LAG member is connected to the correct LAG at the other end.
•
Verify that the LAG members belong to the same switch.
•
Verifying the Status of a LAG Interface
•
Example: Configuring Link Aggregation Between a QFX Series Product and an
Aggregation Switch
Troubleshooting Network Interfaces
The interface on the port in which an SFP or SFP+ transceiver is installed in an SFP or SFP+
module is down
Problem
The QFX Series has an SFP or SFP+ module installed. The interface on the port in which
an SFP or SFP+ transceiver is installed is down.
When you check the status with the CLI command show interfaces interface-name , the
disabled port is not listed.
Cause
By default, the SFP or SFP+ module operates in the 10-Gigabit Ethernet mode and
supports only SFP or SFP+ transceivers. The operating mode for the module is incorrectly
set.
Copyright © 2012, Juniper Networks, Inc.
59
Troubleshooting on the QFX Series
Solution
60
Only SFP or SFP+ transceivers can be installed in SFP or SFP+ modules. You must
configure the operating mode of the SFP or SFP+ module to match the type of transceiver
you want to use. For SFP+ transceivers, configure 10-Gigabit Ethernet operating mode.
Copyright © 2012, Juniper Networks, Inc.
CHAPTER 10
Layer 3 Protocols
•
Troubleshooting Virtual Routing Instances on page 61
Troubleshooting Virtual Routing Instances
•
Direct Routes Not Leaked Between Routing Instances on page 61
Direct Routes Not Leaked Between Routing Instances
Problem
Direct routes are not exported (leaked) between virtual routing instances. For example,
consider the following scenario:
•
QFX switch with two virtual routing instances:
•
Routing instance 1 connects to downstream device through interface xe-0/0/1.
•
Routing instance 2 connects to upstream device through interface xe-0/0/2.
If you enable route leaking between the routing instances (by using the rib-group
statement, for example), the downstream device cannot connect to the upstream device
because the QFX switch connects to the upstream device over a direct route and these
routes are not leaked between instances. However, indirect routes are leaked between
routing instances, so the downstream device can connect to any upstream devices that
are connected to the QFX switch over indirect routes.
Solution
Related
Documentation
This is expected behavior.
•
Understanding Virtual Router Routing Instances
•
Configuring Virtual Router Routing Instances
•
rib-group
Copyright © 2012, Juniper Networks, Inc.
61
Troubleshooting on the QFX Series
62
Copyright © 2012, Juniper Networks, Inc.
CHAPTER 11
Security
•
Troubleshooting Firewall Filter Configuration on page 63
•
Troubleshooting Policer Configuration on page 67
Troubleshooting Firewall Filter Configuration
Use the following information to troubleshoot a firewall filter configuration.
•
Firewall Filter Configuration Returns a No Space Available in TCAM Message on page 63
•
Filter Counts Previously Dropped Packet on page 65
•
Matching Packets Not Counted on page 65
•
Cannot Include loss-priority and policer Actions in Same Term on page 66
•
Cannot Egress Filter Certain Traffic Originating on QFX Switch on page 66
•
Firewall Filter Match Condition Not Working with Q-in-Q Tunneling on page 66
•
Egress Firewall Filters with Private VLANs on page 66
•
Egress Filtering of L2PT Traffic Not Supported on page 67
Firewall Filter Configuration Returns a No Space Available in TCAM Message
Problem
When a firewall filter configuration exceeds the amount of available Ternary Content
Addressable Memory (TCAM) space, the system returns the following syslogd message:
No space available in tcam.
Rules for filter filter-name will not be installed.
A switch returns this message during the commit operation if the firewall filter that has
been applied to a port, VLAN, or Layer 3 interface exceeds the amount of space available
in the TCAM table. The filter is not applied, but the commit operation for the firewall filter
configuration is completed in the CLI module.
Solution
When a firewall filter configuration exceeds the amount of available TCAM table space,
you must configure a new firewall filter with fewer filter terms so that the space
requirements for the filter do not exceed the available space in the TCAM table.
You can perform either of the following procedures to correct the problem:
Copyright © 2012, Juniper Networks, Inc.
63
Troubleshooting on the QFX Series
To delete the filter and its binding and apply the new smaller firewall filter to the same
binding:
1.
Delete the filter and its binding to ports, VLANs, or Layer 3 interfaces. For example:
[edit]
user@switch# delete firewall family ethernet-switching filter ingress-vlan-rogue-block
user@switch# delete vlans employee-vlan description "filter to block rogue devices on
employee-vlan"
user@switch# delete vlans employee-vlan filter input ingress-vlan-rogue-block
2. Commit the changes:
[edit]
user@switch# commit
3. Configure a smaller filter with fewer terms that does not exceed the amount of
available TCAM space. For example:
[edit]
user@switch# set firewall family ethernet-switching filter new-ingress-vlan-rogue-block
...
4. Apply (bind) the new firewall filter to a port, VLAN , or Layer 3 interface. For example:
[edit]
user@switch# set vlans employee-vlan description "filter to block rogue devices on
employee-vlan"
user@switch# set vlans employee-vlan filter input new-ingress-vlan-rogue-block
5. Commit the changes:
[edit]
user@switch# commit
To apply a new firewall filter and overwrite the existing binding but not delete the original
filter:
1.
Configure a firewall filter with fewer terms than the original filter:
[edit]
user@switch# set firewall family ethernet-switching filter
new-ingress-vlan-rogue-block...
2. Apply the firewall filter to the port, VLAN, or Layer 3 interfaces to overwrite the binding
of the original filter—for example:
[edit]
user@switch# set vlans employee-vlan description "smaller filter to block rogue devices
on employee-vlan"
user@switch# set vlans employee-vlan filter input new-ingress-vlan-rogue-block
Because you can apply no more than one firewall filter per VLAN per direction, the
binding of the original firewall filter to the VLAN is overwritten with the new firewall
filter new-ingress-vlan-rogue-block.
3. Commit the changes:
[edit]
user@switch# commit
64
Copyright © 2012, Juniper Networks, Inc.
Chapter 11: Security
NOTE: The original filter is not deleted and is still available in the
configuration.
Filter Counts Previously Dropped Packet
Problem
If you configure two or more filters in the same direction for a physical interface and one
of the filters includes a counter, the counter will be incorrect if the following circumstances
apply:
•
You configure the filter that is applied to packets first to discard certain packets. For
example, imagine that you have a VLAN filter that accepts packets sent to 10.10.1.0/24
addresses and implicitly discards packets sent to any other addresses. You apply the
filter to the admin VLAN in the output direction, and interface xe-0/0/1 is a member
of that VLAN.
•
You configure a subsequent filter to accept and count packets that are dropped by
the first filter. In this example, you have a port filter that accepts and counts packets
sent to 192.168.1.0/24 addresses that is also applied to xe-0/0/1 in the output direction.
The egress VLAN filter is applied first and correctly discards packets sent to 192.168.1.0/24
addresses. The egress port filter is applied next and counts the discarded packets as
matched packets. The packets are not forwarded, but the counter displayed by the egress
port filter is incorrect.
Remember that the order in which filters are applied depends on the direction in which
they are applied, as indicated here:
Ingress filters:
1.
Port (Layer 2) filter
2. VLAN filter
3. Router (Layer 3) filter
Egress filters:
1.
Router (Layer 3) filter
2. VLAN filter
3. Port (Layer 2) filter
Solution
This is expected behavior.
Matching Packets Not Counted
Problem
If you configure two egress filters with counters for a physical interface and a packet
matches both of the filters, only one of the counters includes that packet.
For example:
Copyright © 2012, Juniper Networks, Inc.
65
Troubleshooting on the QFX Series
•
You configure an egress port filter with a counter for interface xe-0/0/1.
•
You configure an egress VLAN filter with a counter for the adminVLAN, and interface
xe-0/0/1 is a member of that VLAN.
•
A packet matches both filters.
In this case, the packet is counted by only one of the counters even though it matched
both filters.
Solution
This is expected behavior.
Cannot Include loss-priority and policer Actions in Same Term
Problem
You cannot include both of the following actions in the same firewall filter term in a QFX
Series switch:
•
loss-priority
•
policer
If you do so, you see the following error message when you attempt to commit the
configuration: “cannot support policer action if loss-priority is configured.”
Solution
This is expected behavior.
Cannot Egress Filter Certain Traffic Originating on QFX Switch
Problem
On a QFX Series switch, you cannot filter certain traffic with a firewall filter applied in the
output direction if the traffic originates on the QFX switch. This limitation applies to
control traffic for protocols such as ICMP (ping), STP, LACP, and so on.
Solution
This is expected behavior.
Firewall Filter Match Condition Not Working with Q-in-Q Tunneling
Problem
If you create a firewall filter that includes a match condition of dot1q-tag or
dot1q-user-priority and apply the filter on input to a trunk port that participates in a service
VLAN, the match condition does not work if the Q-in-Q Ethertype is not 0x8100. (When
Q-in-Q tunneling is enabled, trunk interfaces are assumed to be part of the service provider
or data center network and therefore participate in service VLANs.)
Solution
This is expected behavior. To set the Q-in-Q Ethertype to 0x8100 enter the statement
set dot1q-tunneling ethertype 0x8100 at the [edit ethernet-switching-options] hierarchy
level. You must also configure the other end of the link to use the same Ethertype.
Egress Firewall Filters with Private VLANs
Problem
66
The following behaviors occur if you apply a firewall filter to a private VLAN in the output
direction:
Copyright © 2012, Juniper Networks, Inc.
Chapter 11: Security
Solution
•
If you apply an egress filter to a primary VLAN, the filter is also applied to traffic egressing
from downstream community and isolated ports.
•
If you apply an egress filter to a community VLAN and traffic arrives from an upstream
promiscuous port and later egresses from the community VLAN, the filter is not applied
to this traffic because forwarding is based on primary VLAN, not the community VLAN.
•
If you apply an egress filter to a community VLAN, the filter also applies to packets
with the community VLAN tag when they egress an upstream promiscuous port. (The
filter does not apply to packets with the primary VLAN tag when they egress the
promiscuous port.)
These are expected behaviors. They occur only if you apply a firewall filter to a private
VLAN in the output direction and do not occur if you apply a firewall filter to a private
VLAN in the input direction.
Egress Filtering of L2PT Traffic Not Supported
Problem
Egress filtering of L2PT traffic is not supported on the QFX3500 switch. That is, if you
configure L2PT to tunnel a protocol on an interface, you cannot also use a firewall filter
to filter traffic for that protocol on that interface in the output direction. If you commit a
configuration for this purpose, the firewall filter is not applied to the L2PT-tunneled traffic.
Solution
This is expected behavior.
Related
Documentation
•
Configuring Firewall Filters
•
Verifying That Firewall Filters Are Operational
Troubleshooting Policer Configuration
•
Incomplete Count of Packet Drops on page 67
•
Egress Policers on QFX3500 Might Allow More Throughput Than is
Configured on page 68
Incomplete Count of Packet Drops
Problem
Under certain circumstances, Junos OS might display a misleading number of packets
dropped by an ingress policer.
If packets are dropped because of ingress admission control, policer statistics might not
show the number of packet drops you would expect by calculating the difference between
ingress and egress packet counts. This might happen if you apply an ingress policer to
multiple interfaces, and the aggregate ingress rate of those interfaces exceeds the line
rate of a common egress interface. In this case, packets might be dropped from the
ingress buffer. These drops are not included in the count of packets dropped by the
policer, which causes policer statistics to underreport the total number of drops.
Solution
This is expected behavior.
Copyright © 2012, Juniper Networks, Inc.
67
Troubleshooting on the QFX Series
Egress Policers on QFX3500 Might Allow More Throughput Than is Configured
Problem
If you configure a policer to rate-limit throughput and apply it on egress to multiple
interfaces on a QFX3500 switch or node, the measured aggregate policed rate might be
twice the configured rate, depending on which interfaces you apply the policer to. This
occurs if you apply a policer to multiple interfaces and both of the following are true:
•
There is at least one policed interface in the range xe-0/0/0 to xe-0/0/23 or the range
xe-0/1/1 to xe-0/1/7
•
There is at least one policed interface in the range xe-0/0/24 to xe-0/0/47 or the range
xe-0/1/8 to xe-0/1/15
For example, if you configure a policer to rate-limit at 1 Gbps and apply the policer (by
using a firewall filter) to xe-0/0/0 and xe-0/0/24 in the output direction, each interface
is rate-limited at 1 Gbps, for a total allowed throughput of 2 Gbps. The same behavior
occurs if you apply the policer to xe-0/1/1 and xe-0/0/24—each interface is rate-limited
at 1 Gbps.
If you apply the same policer on egress to multiple interfaces in these groups, each group
is rate-limited at 1 Gbps. For example, if you apply the policer to xe-0/0/0 through
xe-0/0/4 (five interfaces) and xe-0/0/24 through xe-0/0/33 (ten interfaces), each
group is rate-limited at 1 Gbps, for a total allowed throughput of 2 Gbps.
Here is another example: If you apply the policer to xe-0/0/0 through xe-0/0/4 and
xe-0/1/1 through xe-0/1/5 (a total of ten interfaces), that group is rate-limited at 1 Gbps
in aggregate. If you also apply the policer to xe-0/0/24, that one interface is rate-limited
at 1 Gbps while the other ten are still rate-limited at 1 Gbps in aggregate.
Interfaces xe-0/1/1 through xe-0/1/15 are physically located on the QSFP+ uplink ports,
according to the following scheme:
•
xe-0/1/1 through xe-0/1/3 are on Q0.
•
xe-0/1/4 through xe-0/1/7 are on Q1.
•
xe-0/1/8 through xe-0/1/11 are on Q2.
•
xe-0/1/2 through xe-0/1/15 are on Q3.
This behavior occurs only if the policer is applied in the output direction. If you configure
a policer as described above but apply it in the input direction, the total allowed
throughput for all interfaces is 1 Gbps.
Solution
68
This is expected behavior.
Copyright © 2012, Juniper Networks, Inc.
CHAPTER 12
Services
•
Troubleshooting Port Mirroring on page 69
Troubleshooting Port Mirroring
•
Port Mirroring Constraints and Limitations on page 69
•
Egress Port Mirroring with VLAN Translation on page 70
Port Mirroring Constraints and Limitations
•
Local and Remote Port Mirroring on page 69
•
Remote Port Mirroring Only on page 70
Local and Remote Port Mirroring
The following constraints and limitations apply to local and remote port mirroring with
the QFX Series:
•
You can create a total of four port mirroring configurations on QFX Series switches,
subject to the following limits:
•
There can be no more than two configurations that mirror ingress traffic.
•
There can be no more than two configurations that mirror egress traffic.
•
You cannot configure local and remote port mirroring with the same port mirroring
configuration. That is, you cannot use the interface and vlan options in one set analyzer
nameoutput statement.
•
If you configure Junos OS to mirror egress packets, do not configure more than 2000
VLANs on a QFX3500 or QFabric switch. If you do so, some VLAN packets might contain
incorrect VLAN IDs. This applies to any VLAN packets—not only the mirror copies.
•
The ratio and loss-priority options are not supported.
•
Packets with physical layer errors are filtered out and are not sent to the output port
or VLAN.
•
If you use sFlow monitoring to sample traffic, it does not sample the mirror copies
when they egress from the output interface.
Copyright © 2012, Juniper Networks, Inc.
69
Troubleshooting on the QFX Series
•
You cannot mirror packets exiting or entering the following ports:
•
Dedicated Virtual Chassis interfaces
•
Management interfaces (me0 or vme0)
•
Fibre Channel interfaces
•
Routed VLAN interfaces
•
When packet copies are sent out the output interface, they are not modified for any
changes that are normally applied on egress, such as CoS rewriting.
•
(QFX3000 QFabric switch only) If you configure a QFabric analyzer to mirror egress
traffic and the input and output interfaces are on different Node devices, the mirror
copies will have incorrect VLAN IDs. This limitation does not apply if you configure a
QFabric analyzer to mirror egress traffic and the input and output interfaces are on the
same Node device. In this case the mirror copies will have the correct VLAN IDs (as
long as you do not configure more than 2000 VLANs on the QFabric switch).
Remote Port Mirroring Only
The following constraints and limitations apply to remote port mirroring with the QFX
Series:
•
The output VLAN cannot be a private VLAN or VLAN range.
•
An output VLAN cannot be shared by multiple analyzer statements.
•
An output VLAN interface cannot be a member of any other VLAN.
•
An output VLAN interface cannot be an aggregated Ethernet interface (LAG).
•
On the source (monitored) switch, only one interface can be a member of the analyzer
VLAN.
Egress Port Mirroring with VLAN Translation
Problem
If you create a port mirroring configuration that mirrors customer VLAN (CVLAN) traffic
on egress and the traffic undergoes VLAN translation before being mirrored, the VLAN
translation does not apply to the mirrored packets. That is, the mirrored packets retain
the service VLAN (SVLAN) tag that should be replaced by the CVLAN tag on egress. The
original packets are unaffected—on these packets VLAN translation works properly and
the SVLAN tag is replaced with the CVLAN tag on egress.
Solution
This is expected behavior.
Related
Documentation
70
•
Understanding Port Mirroring
•
Example: Configuring Port Mirroring for Local Analysis
•
Example: Configuring Port Mirroring for Remote Analysis
Copyright © 2012, Juniper Networks, Inc.
CHAPTER 13
Storage
•
Troubleshooting Dropped FCoE Traffic on page 71
•
Troubleshooting Fibre Channel Interface Deletion on page 72
•
Troubleshooting Dropped FIP Traffic on page 73
Troubleshooting Dropped FCoE Traffic
Problem
Cause
Fibre Channel over Ethernet (FCoE) traffic for which you want guaranteed delivery is
dropped.
There are several possible causes of dropped FCoE traffic:
1.
Priority-based flow control (PFC) is not enabled on the FCoE priority (IEEE 802.1p
code point).
2. The FCoE traffic is not classified correctly at the ingress interface. FCoE traffic should
be mapped to the lossless fcoe forwarding class and to the correct IEEE 802.1p code
point.
3. The congestion notification profile that enables PFC for the FCoE priority is not
attached to the interface.
4. The forwarding class set (priority group) used for guaranteed delivery traffic does not
include the fcoe forwarding class.
5. Insufficient bandwidth has been allocated for the FCoE queue or for the forwarding
class set to which the FCoE queue belongs.
The listed numbers of the possible causes correspond to the listed numbers of the
solutions in the Solutions section.
Copyright © 2012, Juniper Networks, Inc.
71
Troubleshooting on the QFX Series
Solution
1.
Check the congestion notification profile to see if PFC is enabled on the FCoE priority
(the correct IEEE 802.1p code point). Use the show class-of-service
congestion-notification operational command to show the code points that are enabled
for PFC in each congestion notification profile.
2. Check the classifier to see if the incoming FCoE traffic is assigned to the correct code
point. Use the show class-of-service classifiers ieee-802.1p operational command to
verify that the FCoE forwarding class is mapped to the correct IEEE 802.1p code point.
3. Ensure that the congestion notification profile and classifier are attached to the correct
ingress interface. Use the operational command show configuration class-of-service
interfaces interface-name.
4. Check that the forwarding class set includes the fcoe forwarding class. Use the
operational command show configuration class-of-service forwarding-class-sets to
show the configured priority groups and their forwarding classes.
5. Verify the amount of bandwidth allocated to the fcoe queue and to the forwarding
class set to which the fcoe queue belongs. Use the show configuration class-of-service
schedulers scheduler-name operational command (specify the scheduler for FCoE
traffic as the scheduler-name) to see the minimum guaranteed bandwidth
(transmit-rate) and maximum bandwidth (shaping-rate) for the queue.
Use the show configuration class-of-service traffic-control-profiles traffic-control-profile
operational command (specify the traffic control profile used for FCoE traffic as the
traffic-control-profile) to see the minimum guaranteed bandwidth (guaranteed-rate)
and maximum bandwidth (shaping-rate) for the forwarding class set.
See Example: Configuring CoS PFC for FCoE Traffic for step-by-step instructions on how
to configure PFC for FCoE traffic, including classifier, interface, congestion notification
profile, PFC, and bandwidth scheduling configuration.
Related
Documentation
•
show class-of-service classifier
•
show class-of-service congestion-notification
•
show class-of-service forwarding-class-set
•
show class-of-service traffic-control-profile
•
Example: Configuring CoS PFC for FCoE Traffic
Troubleshooting Fibre Channel Interface Deletion
72
Problem
You deleted a Fibre Channel (FC) interface at the [edit interfaces] hierarchy level, but
the commit check fails so the interface is not deleted.
Cause
You must first delete the FC interface from the FC fabric on the QFX Series before you
can delete the FC interface at the [edit interfaces] hierarchy level. You must perform
both operations to delete a FC interface.
Copyright © 2012, Juniper Networks, Inc.
Chapter 13: Storage
Solution
First delete the interface from the FC fabric and then delete the interface from the QFX
Series:
1.
Delete the FC interface from the FC fabric to which it belongs:
[edit]
user@switch# delete fc-fabrics fabric-name interface interface-name
For example, to delete the FC interface fc-0/0/3.0 from an FC fabric named sanfab1:
[edit]
user@switch# delete fc-fabrics sanfab1 interface fc-0/0/3.0
2. Delete the FC interface at the [edit interfaces] hierarchy level:
[edit]
user@switch: delete interfaces interface-name
For example, to delete the interface fc-0/0/3.0 from the switch:
[edit]
user@switch: delete interfaces fc-0/0/3.0
Related
Documentation
•
fc-fabrics
•
interface
•
interfaces
•
Understanding Interfaces on an FCoE-FC Gateway
Troubleshooting Dropped FIP Traffic
Problem
Fibre Channel over Ethernet (FCoE) Initialization Protocol (FIP) traffic such as FIP VLAN
discovery and notification frames is dropped on the QFX Series.
Cause
The interface on which the FIP traffic is dropped does not have a native VLAN configured.
FIP VLAN discovery and notification messages are exchanged as untagged packets on
the native VLAN. (After the FCoE session with the Fibre Channel switch is established,
FCoE traffic uses the FCoE VLAN.)
Solution
Check to ensure that every 10-Gigabit Ethernet interface that connects to an FCoE device
includes a native VLAN. Configure a native VLAN on all 10-Gigabit Ethernet interfaces
that connect to FCoE devices.
NOTE: Make sure that the native VLAN you are using on the QFX Series is
the same native VLAN that the FCoE devices use for Ethernet traffic.
To configure a native VLAN on an interface:
1.
Set the interface port mode to tagged-access if you have not already done so:
Copyright © 2012, Juniper Networks, Inc.
73
Troubleshooting on the QFX Series
[edit]
user@switch# set interfaces interface unit unit family ethernet-switching port-mode
tagged-access
For example, to set the port mode to tagged-access for interface xe-0/0/6.0:
[edit]
user@switch# set interfaces xe-0/0/6 unit 0 family ethernet-switching port-mode
tagged-access
2. Configure a native VLAN on the interface:
[edit]
user@switch# set interfaces interface unit unit family ethernet-switching native-vlan-id
vlan-id
For example, to set the native VLAN ID to 1 for interface xe-0/0/6.0:
[edit]
user@switch# set interfaces xe-0/0/6 unit 0 family ethernet-switching native-vlan-id
1
3. Configure the native VLAN if it does not already exist:
[edit]
user@switch# set vlans vlan-name vlan-id vlan-id
For example, to name the native VLAN native and use the VLAN ID 1:
[edit]
user@switch# set vlans native vlan-id 1
Related
Documentation
74
•
interfaces
•
vlans
•
Understanding FIP Functions
Copyright © 2012, Juniper Networks, Inc.
CHAPTER 14
Traffic Management
•
Troubleshooting Egress Bandwidth That Exceeds the Configured Maximum
Bandwidth on page 75
•
Troubleshooting Egress Bandwidth That Exceeds the Configured Minimum
Bandwidth on page 76
•
Troubleshooting Egress Queue Bandwidth Impacted by Congestion on page 77
•
Troubleshooting an Unexpected Rewrite Value on page 77
•
Troubleshooting a Port Reset on QFabric Systems When a Queue Stops Transmitting
Traffic on page 79
Troubleshooting Egress Bandwidth That Exceeds the Configured Maximum Bandwidth
Problem
Cause
The maximum bandwidth of a queue when measured at the egress port exceeds the
maximum bandwidth (shaping rate) configured for the queue.
When you configure bandwidth for a queue or a priority group, the switch accounts for
the configured bandwidth as data only. The switch does not rate-shape the preamble
and the interframe gap (IFG) associated with frames, so the switch does not account
for the bandwidth consumed by the preamble and the IFG in its maximum bandwidth
calculations.
The measured egress bandwidth can exceed the configured maximum bandwidth when
small packet sizes (64 or 128 bytes) are transmitted because the preamble and the IFG
are a larger percentage of the total traffic. For larger packet sizes, the preamble and IFG
overhead are a small portion of the total traffic, and the effect on egress bandwidth is
minor.
Solution
When you calculate the bandwidth requirements for queues on which you expect a
significant amount of traffic with small packet sizes, consider the shaping rate as the
maximum bandwidth for the data only. Add sufficient bandwidth to your calculations to
account for the preamble and IFG so that the port bandwidth is sufficient to handle the
combined maximum data rate (shaping rate) and the preamble and IFG.
If the maximum bandwidth measured at the egress port exceeds the amount of bandwidth
that you want to allocate to the queue, reduce the shaping rate for that queue.
Copyright © 2012, Juniper Networks, Inc.
75
Troubleshooting on the QFX Series
Related
Documentation
•
shaping-rate
•
Example: Configuring Maximum Output Bandwidth
•
Example: Configuring Queue Schedulers
•
Understanding CoS Output Queue Schedulers
Troubleshooting Egress Bandwidth That Exceeds the Configured Minimum Bandwidth
Problem
Cause
The minimum bandwidth of a queue or a priority group when measured at the egress
port exceeds the minimum bandwidth configured for the queue (transmit-rate) or for
the priority group (guaranteed-rate).
When you configure bandwidth for a queue or a priority group, the switch accounts for
the configured bandwidth as data only. The switch does not include the preamble and
the interframe gap (IFG) associated with frames, so the switch does not account for the
bandwidth consumed by the preamble and the IFG in its minimum bandwidth calculations.
The measured egress bandwidth can exceed the configured minimum bandwidth when
small packet sizes (64 or 128 bytes) are transmitted because the preamble and the IFG
are a larger percentage of the total traffic. For larger packet sizes, the preamble and IFG
overhead are a small portion of the total traffic, and the effect on egress bandwidth is
minor.
NOTE: The sum of the queue transmit rates in a priority group should not
exceed the guaranteed rate for the priority group. (You cannot guarantee a
minimum bandwidth for the queues that is greater than the minimum
bandwidth guaranteed for the entire set of queues.)
Solution
When you calculate the bandwidth requirements for queues and priority groups on which
you expect a significant amount of traffic with small packet sizes, consider the transmit
rate and the guaranteed rate as the minimum bandwidth for the data only. Add sufficient
bandwidth to your calculations to account for the preamble and IFG so that the port
bandwidth is sufficient to handle the combined minimum data rate and the preamble
and IFG.
If the minimum bandwidth measured at the egress port exceeds the amount of bandwidth
that you want to allocate to a queue or to a priority group, reduce the transmit rate for
that queue and reduce the guaranteed rate of the priority group that contains the queue.
Related
Documentation
76
•
guaranteed-rate
•
transmit-rate
•
Example: Configuring Minimum Guaranteed Output Bandwidth
•
Example: Configuring Queue Schedulers
Copyright © 2012, Juniper Networks, Inc.
Chapter 14: Traffic Management
•
Understanding CoS Output Queue Schedulers
Troubleshooting Egress Queue Bandwidth Impacted by Congestion
Problem
Cause
Solution
Congestion on an egress port causes egress queues to receive less bandwidth than
expected. Egress port congestion can impact the amount of bandwidth allocated to
queues on the congested port and, in some cases, on ports that are not congested.
Egress queue congestion can cause the ingress port buffer to fill above a certain threshold
and affect the flow to the queues on the egress port. One queue receives its configured
bandwidth, but the other queues on the egress port are affected and do not receive their
configured share of bandwidth.
The solution is to configure a drop profile to apply weighted random early detection
(WRED) to the queue or queues on the congested ports.
Configure a drop profile on the queue that is receiving its configured bandwidth. This
queue is preventing the other queues from receiving their expected bandwidth. The drop
profile prevents the queue from affecting the other queues on the port.
To configure a tail-drop profile using the CLI:
•
Name the drop profile and set the drop start point, drop end point, minimum drop rate,
and maximum drop rate for the drop profile:
[edit class-of-service]
user@switch# set drop-profile drop-profile-name interpolate fill-level percentage fill-level
percentage drop-probability 0 drop-probability percentage
Related
Documentation
•
drop-profile
•
Example: Configuring Tail-Drop Profiles
•
Example: Configuring CoS Hierarchical Port Scheduling (ETS)
•
Understanding CoS Tail-Drop Profiles
Troubleshooting an Unexpected Rewrite Value
Problem
Traffic from one or more forwarding classes on an egress port is assigned an unexpected
rewrite value.
Cause
If you configure a rewrite rule for a forwarding class on an egress port but you do not
configure a rewrite rule for every forwarding class on that egress port, then the forwarding
classes that do not have a configured rewrite rule are assigned random rewrite values.
For example:
1.
Configure forwarding classes fc1, fc2, and fc3.
Copyright © 2012, Juniper Networks, Inc.
77
Troubleshooting on the QFX Series
2. Configure rewrite rules for forwarding classes fc1 and fc2, but not for forwarding class
fc3.
3. Assign forwarding classes fc1, fc2, and fc3 to a port.
When traffic for these forwarding classes flows through the port, traffic for forwarding
classes fc1 and fc2 is rewritten correctly. However, traffic for forwarding class fc3 is
assigned a random rewrite value.
Solution
If any forwarding class on an egress port has a configured rewrite rule, then all forwarding
classes on that egress port must have a configured rewrite rule. Configuring a rewrite rule
for any forwarding class that is assigned a random rewrite value solves the problem.
TIP: If you want the forwarding class to use the same code point value
assigned to it by the ingress classifier, specify that value as the rewrite rule
value. For example, if a forwarding class has the IEEE 802.1 ingress classifier
code point value 011, configure a rewrite rule for that forwarding class that
uses the IEEE 802.1p code point value 011.
NOTE: There are no default rewrite rules. You can bind one rewrite rule for
each type (DSCP and IEEE 802.1) to a given interface. A rewrite rule can
contain multiple forwarding-class-to-rewrite-value associations.
1.
Assign a rewrite value to a forwarding class. Add the new rewrite value to the same
rewrite rule as the other forwarding classes on the port:
[edit class-of-service rewrite-rules]
user@switch# set (dscp | ieee-802.1) rewrite-name forwarding-class class-name
loss-priority priority code-point (alias | bits)
For example, if the other forwarding classes on the port use rewrite values defined in
the rewrite rule custom-rw, the forwarding class fcoe is being randomly rewritten, and
you want to use IEEE 802.1 code point 011 for the fcoe forwarding class:
[edit class-of-service rewrite-rules]
user@switch# set ieee-802.1 custom-rw forwarding-class fcoe loss-priority high
code-point 011
2. Enable the rewrite rule on an interface if it is not already enabled on the desired
interface:
[edit]
user@switch# set class-of-service interfaces interface-name unit unit rewrite-rules
(dscp | ieee-802.1) rewrite-rule-name
For example, to enable the rewrite rule custom-rw on interface xe-0/0/24.0:
[edit]
user@switch# set class-of-service interfaces xe-0/0/24 unit 0 rewrite-rules ieee-802.1
custom-rw
78
Copyright © 2012, Juniper Networks, Inc.
Chapter 14: Traffic Management
Related
Documentation
•
interfaces
•
rewrite-rules
•
Defining CoS Rewrite Rules
•
Monitoring CoS Rewrite Rules
Troubleshooting a Port Reset on QFabric Systems When a Queue Stops Transmitting
Traffic
Problem
Cause
Solution
In QFabric systems, if any queue that contains outgoing packets does not transmit packets
for 12 consecutive seconds, the port automatically resets.
Failure of a queue to transmit packets for 12 consecutive seconds may be due to:
•
A strict-high priority queue consuming all of the port bandwidth
•
Several queues consuming all of the port bandwidth
•
Any queue or port receiving continuous priority-based flow control (PFC) or 802.3x
Ethernet PAUSE messages (received PFC and PAUSE messages prevent a queue or
a port, respectively, from transmitting packets because of network congestion)
•
Other conditions that prevent a queue from obtaining port bandwidth for 12 consecutive
seconds
If the cause is a strict-high priority queue or other queues consuming all of the port
bandwidth, you can use rate shaping to configure a maximum rate for the queues that
are using all of the port bandwidth and preventing other queues from obtaining bandwidth
on the port. You configure a maximum rate by creating a scheduler, using a scheduler
map to apply it to a forwarding class (which maps to an output queue), and applying
the scheduler map to the port using a forwarding class set and a traffic control profile.
To configure rate shaping using the CLI:
1.
Name the existing scheduler or create a scheduler and define the maximum bandwidth
as a rate or as a percentage:
[edit class-of-service]
user@switch# set schedulers scheduler-name shaping-rate (rate | percent percentage)
2. Configure a scheduler map to associate the scheduler with the forwarding class
(queue) that is consuming all of the port bandwidth:
[edit class-of-service]
user@switch# set scheduler-maps scheduler-map-name forwarding-class
forwarding-class-name scheduler scheduler-name
3. Associate the scheduler map with a traffic control profile:
[edit class-of-service]
Copyright © 2012, Juniper Networks, Inc.
79
Troubleshooting on the QFX Series
user@switch# set traffic-control-profiles traffic-control-profile-name scheduler-map
scheduler-map-name
4. Associate the traffic control profile (and thus the scheduler map that contains the
rate shaping queue scheduler) with a forwarding class set and apply them to the
interface that is being reset:
[edit class-of-service]
user@switch# set interfaces interface-name forwarding-class-set fc-set-name
output-traffic-control-profile traffic-control-profile-name
For example, a strict-high priority queue is using all of the bandwidth on interface
shpnode:xe-0/0/10 and preventing other queues from transmitting for 12 consecutive
seconds. You decide to set a maximum rate of 7 Gbps on the strict-high priority queue
to ensure that at least 3 Gbps of the port bandwidth is available to service other queues.
Table 13 on page 80 shows the topology for this example:
Table 13: Components of the Rate Shaping Troubleshooting Example
Component
Settings
Affected interface
shpnode:xe-0/0/10
Scheduler (strict-high priority
scheduler)
Name: shp-sched
Shaping rate: 7g
Priority: strict-high
NOTE: This example assumes that the scheduler already exists and has been configured
as strict-high priority, but that rate shaping to prevent the strict-high priority traffic from
using all of the port bandwidth has not been applied.
Scheduler map
Name: shp-map
Forwarding class to associate with the shp-sched scheduler: strict-high
NOTE: This example assumes that a strict-high priority forwarding class has been
configured and assigned the name strict-high.
Traffic control profile
Name: shp-tcp
NOTE: This example does not describe how to define a complete traffic control profile.
Forwarding class set
Name: shp-pg
To configure the scheduler, map it to the strict-high priority forwarding class, and apply
it to interface shpnode:xe-0/0/10 using the CLI:
1.
Specify the scheduler for the strict-high priority queue (shp-sched) with a maximum
bandwidth of 7 Gbps:
[edit class-of-service schedulers]
user@switch# set shp-sched shaping-rate 7g
2. Configure a scheduler map (shp-map) that associates the scheduler (shp-sched) with
the forwarding class (strict-high):
[edit class-of-service scheduler-maps]
80
Copyright © 2012, Juniper Networks, Inc.
Chapter 14: Traffic Management
user@switch# set shp-map forwarding-class strict-high scheduler shp-sched
3. Associate the scheduler map shp-map with a traffic control profile (shp-tcp):
[edit class-of-service traffic-control-profiles]
user@switch# set shp-tcp scheduler-map shp-map
4. Associate the traffic control profile shp-tcp with a forwarding class set (shp-pg) and
the affected interface (shpnode:xe-0/0/10):
[edit class-of-service]
user@switch# set interfaces shpnode:xe-0/0/10 forwarding-class-set shp-pg
output-traffic-control-profile shp-tcp
Related
Documentation
•
Understanding CoS Output Queue Schedulers
•
Defining CoS Queue Scheduling Priority
•
Example: Configuring Queue Schedulers
•
Example: Configuring Traffic Control Profiles (Priority Group Scheduling)
•
Example: Configuring Forwarding Class Sets
•
Example: Configuring CoS Hierarchical Port Scheduling (ETS)
Copyright © 2012, Juniper Networks, Inc.
81
Troubleshooting on the QFX Series
82
Copyright © 2012, Juniper Networks, Inc.