1
User manual
Table of contents
1. Introduction
System requirements
Overview of the application
Access to the application
User interface
Sample projects (Template)
User profile
User manual
4
4
5
6
6
7
8
8
Managing the job folders
Details
Managing the areas
Creating a project from Dialux
Managing proposals for aggregate solutions (Proposals)
Energy and economic evaluations of the aggregate proposals
Reporting the proposals
9
9
10
11
12
12
14
14
City and intended use of the ststem
Surface area of the room, maintenance factor and period of operation
Area occupancy
Contribution of natural light
15
16
16
18
18
Power consumption
Costs of the solution
Lighting fixtures
Control systems
Room plan
19
20
20
21
23
24
EN15193 Benchmark
24
25
2. Job folders (projects)
3. AREAS section
4. SOLUTION section
5. ENERGY section
6. TCO section
26
7. REPORT section
27
8. Annex
European Standard UNI EN 15193
Calculation of the LENI (Lighting Energy Numeric Indicator)
Calculation of the TCO and Payback Time
Compatibility with Dialux projects
28
28
29
30
31
1
Introduction
System requirements
The application is used to calculate the consumption of lighting
systems using the LENI (Lighting Energy Numeric Indicator) in
accordance with European standard EN 15193. In just a few
simple steps the energy efficiency of the system can be estimated,
taking both the fixtures and the lighting control systems into consideration. This indicator makes it possible to estimate the TCO,
or the Total Cost of Ownership, of the system.
Design choices can be suggested to customers by comparing
various lighting solutions and the related procedures to control
the fixtures. The application can be used to calculate all the
information on the initial energy and maintenance costs of the
systems and allows a fast and accurate evaluation as to whether
one design solution is better than other options. It is therefore
possible to evaluate any product that is available on the market,
such as the new LED fixtures and the Building Automation control
solutions.
4
Il computer utilizzato dall’utente per accedere all’applicazione
deve avere le seguente caratteristiche:
• Windows, Linux or OSX operating system
• At least 512MB RAM
• Minimum video resolution of 1024x768 pixel
• Web browser: Internet Explorer 9, Firefox 16, Chrome 25, Safari
5.1.7 (or subsequent versions)
• Acrobat Reader 10 or subsequent version
• Internet/intranet connection with the server hosting the application.
1
Overview of the application
The web-based architecture allows the application to be accessed
from any browser that can connect via intranet/internet to the
server hosting the software and the projects/products database.
The workspace is organised into project folders which contain the
areas:
After entering the data, the application will automatically carry
out the energy and economic evaluations, the results of which
will be displayed in the relevant sections and can be exported into
a PDF document. The information produced by the application
regard the following:
• Project folder: set of documents dedicated to the same
business, for example a building.
• Area: always represents a single room inside a building.
• Energy consumption
• Amount of CO2 produced
• LENI
• Energy comparison of solutions
• Initial investment costs
• Energy consumption costs
• System maintenance costs
• TCO
• Investment payback time.
One or more Solutions, that is, design variations made up of
different fixtures, possibly managed with different control systems
and/or procedures, can be specified for each area.
Thus the type of fixtures used (of which there may of course be
more than one) can be specified for each solution. The mode of
management must be specified for each type of fixture, selecting
from options that may be manual (traditional) or automatic control (via control systems).
Data relating to the energy and economic parameters of fixtures
and systems can be entered in various ways:
• all the parameters are entered by the user, for example for
third-party fixtures.
• the products in the company database are entered by the user;
in this case the user only has to select the type of product and
all the parameters will be filled in automatically.
Even in the second case, the user can still edit and therefore
personalise the parameters, since these have just been copied
into the area from the database. Thus, if the data of a fixture are
modified in the database, for example a price in a price list or an
energy parameter, this will not modify any of the areas in which
this fixture may have been used.
The maintenance costs include bulb replacement, the labour
needed for replacement activities and any extra costs that may be
required, such as the hiring of machinery to change bulbs at great
heights or the costs of cleaning fixtures in critical applications.
Besides evaluating a single room (area) it is also possible to perform an overall evaluation of the building (project folder). One or
more Proposals can therefore be carried out, in which a solution
is selected for each area contained in the project folder. After the
Proposal data have all been entered, the application will automatically carry out the overall energy and economic evaluations,
the results of which will be displayed in the relevant sections and
can be exported into a summary PDF document. It is important to
remember that all the data relating to projects and products are
saved on the server whereas the PDF documents that are generated
must be filed by the user in his/her PC.
5
1
Access to the application
User interface
The application can be accessed from the Artemide intranet and is
only available to users who are authorised for the service. To access
ArtemideTCO, follow Home > Applications and select TCO as
shown in figure 1.1.
The home page (Home), shown in figure 1.2, provides access to the
main sections of the application:
• My projects: management of project folders.
• Sample projects: management of samples (Templates) that can
be used to generate new areas.
• User profile: management of the data of the user’s account.
• User manual: displays this manual in electronic format.
To exit the application (Logout), just click on the button in the top
right-hand corner, next to the username.
Figure 1.1 – Access to ArtemideTCO from the Artemide intranet
6
Figure 1.2 – Home page of the application
1
Sample projects (Template)
In this section (figure 1.3) projects relating to the areas prepared by
the administrator can be displayed; these can be taken as examples
in order to understand how the application works, the potential of
certain fixtures and the advantages that can be obtained from using
control systems. These areas are organised into subject folders, for
example by type of building. The summary, shown as a pop-up on
pressing the Print Report command, can be displayed for each area.
Figure 1.3 – Sample projects (Templates)
After identifying the required project, the Duplicate command can
be used to create a new job from the selected sample. The name of
the new area and the project folder in which it is to be filed can be
entered in the window shown in figure 1.4. Thus, if a new folder
is to be created, the procedure described in the following chapter
must be followed before duplicating a project.
Figure 1.4 – Duplicating a Template project
7
1
User profile
User manual
The data relating to the user can be displayed and modified in
the section shown in figure 1.5. This information may be used, if
required, in the project PDF reports. In addition to the user’s general
information, the language used for the display of the application’s
user interface is required, as well as the language and the price list
used for the description and the economic evaluation of the products in the projects that are carried out:
Using the User manual command on the home page of the application (figure 1.2), a new window can be opened to display the
electronic version of this manual.
Figure 1.5 – Modifying personal data
8
Job folders (projects)
2
Managing the job folders
The workspace is arranged in project folders containing the Areas.
A project folder is a set of documents dedicated to the same
business, for example a building, while an Area always represents a
single room inside a building.
The window shown in figure 2.1 can be used to manage the various project folders. Each project folder is given a name and description. Click on the name of the folder to access the areas. To add
a new folder, use the New folder command located in the menu,
which can be accessed by clicking on the icon in the top right-hand
corner (next to the username). The menu also has the Home command, which is used to return to the main page of the application,
and the Logout command, to exit from the application.
To delete a project folder, use the Delete command located on the
right-hand side of each row; the user will be asked to confirm
before proceeding, since all the data in the folder will be deleted.
Figure 2.1 – Project folders
9
2
Details
Figure 2.2 shows the workspace inside a project folder. The
left-hand column is used to manage the folder and contains the
following sections:
• Details: to set the general data of the folder (figure 2.3).
• Areas: to display and manage all the areas contained in the folder.
• Proposals: to display and manage all the aggregations of the
various solutions of each area.
• Energy: to display the energy evaluations of the Proposals.
• TCO: to display the economic evaluations of the Proposals.
• Report: to display the settings to print the summary PDF
document.
In this section you can set the general data of the project folder,
such as the name, the date of creation, the customer or other
fields. For some of these, the setting of the parameter can be
extended to all the areas contained in the current project.
The values relating to energy and labour costs are used to evaluate the energy costs and to calculate the costs required for the
replacement of bulbs throughout the period of use of the system.
The costs refer to the geographical area in which the system has
been set up.
The parameter Kg CO2 equivalent for kWh is used to calculate the
amount of CO2 produced, corresponding to the energy consumption of the system.
The application automatically performs the energy and economic
evaluations considering an evaluation period which may, for
example, be the same as the expected lifetime of the system. This
parameter must be specified by the user and is expressed in years.
Figure 2.2 – Contents of a project folder
10
Figure 2.3 – Details: setting the general data of the project folder
2
Managing the areas
In the Areas section you can create, manage or delete an area
(room). There are two ways of creating a new area, which can be
found in the menu by clicking on the icon in the top right-hand
corner (figure 2.4):
• New empty area: creates an empty area to be completed in all
its parts.
• New template area: creates an area by duplicating all the information from a sample area (Template) selected by the user, who
in this case can only modify the data in question.
• New area from Dialux: imports a file (with the extension .stf)
from Dialux and creates an area from the information contained
in this.
It should be noted that when a new project is created from a
template with the above-mentioned command, the user will not be
asked for the destination folder as the one currently in use will be
used.
Besides those described above, the following operations can also be
performed:
To work on the various Areas, just select one from the dropdown
menu on the top bar, next to the name of the project folder (figure
2.5).
Figure 2.5 – Dropdown menu to select an area
Figure 2.6 shows the project management bar. The five sections will
be dealt with in detail in the following chapters. Click on the name
of the section to go into the project and the bar will show the
current work position.
• Duplicate current area: creates an area that is identical to the
current one in the same project folder, and assigns it the same
name with the addition of the suffix “(copy)”.
• Delete current area: deletes the current area and all the corresponding solutions.
Figure 2.6 – Project management bar
Figura 2.4 – Menu Areas
11
2
Creating a project from Dialux
A file in .stf format generated by Dialux can be imported in order
to create a new project. For more information on preparing a project in Dialux, please see the paragraph Compatibility with Dialux
projects in the annex.
Managing proposals for aggregate solutions
(Proposals)
While a single room is analysed in the Areas section, an overall evaluation of the building can be performed in Proposals, by taking one
or more of the proposals and selecting a solution in each of them
for each area contained in the folder. Figure 2.8 shows the window
used to add, modify or delete a proposal.
After selecting the New area from Dialux command (menu in
figure 2.4), the user is asked to select the.stf file to be imported
(figure 2.7). Press Upload and follow the progress of the import
shown in the window.
Figure 2.7 – Selecting the .stf file exported from Dialux
When the file has been imported into the application, the information it contains will be verified. The user is notified of any inconsistencies or possible errors, such as when the fixtures used in the
Dialux project are not also stored in the products database of the
application.
Figure 2.7 – Selecting the .stf file exported from Dialux
When the file has been imported into the application, the
information it contains will be verified. The user is notified of any
inconsistencies or possible errors, such as when the fixtures used
in the Dialux project are not also stored in the products database
of the application.
12
Figure 2.8 – Managing proposals
2
Click on the New proposal item in the menu shown in figure 2.9 to
enter a new proposal. An existing proposal can also be duplicated
or deleted, by clicking on the items Duplicate current proposal or
Delete current proposal respectively.
For each Proposal a name can be specified and a solution selected
for each area contained in the folder. In the event that an area is
not to be included in a particular proposal, the option None can be
selected from the dropdown menu, as shown in figure 2.10.
Figure 2.9 – Creating a new proposal
Figure 2.10 – Excluding a project from a proposal
In the energy and economic evaluations, the energy saving and investment payback time values are always calculated by considering
one of the proposals as reference and comparing the other proposals one by one. To select which of the proposals is to be considered
as reference, use the option Use this proposal as reference for the
energy and economic comparisons (figure 2.8). Obviously, only one
of the proposals can be selected as the reference.
13
2
Energy and economic evaluations of the
aggregate proposals
In the Energy and TCO sections, the energy and economic evaluations can be displayed for each Proposal, with the related energy
comparison and investment payback time indicators (figures 2.11
and 2.12).
Reporting the proposals
In the Report section (figure 2.13), all the options can be set to
generate the summary PDF document of the aggregation of the
various rooms.
Figure 2.11 – Energy section for the energy evaluation of proposals
Figure 2.12 – TCO section for the economic evaluation of proposals
14
Figure 2.13 –Report section for the generation of the PDF document
AREAS section
3
After selecting the required area via the dropdown menu in the
Areas section (fig. 2.5), you can move around in the workspace by
means of the management bar located at the top of the middle
section of the window (fig. 2.6). The first section is PROJECT,
where the window shown in figure 3.1 can be displayed, and
where all the general information of the area can be entered.
For some types of parameters the user can decide whether to use
the settings suggested by the application, generally relating to
standard EN 15193.
The checkbox Display advanced settings, which can be used to
configure all the parameters of the area, such as those specific to
calculation of the LENI, is located at the bottom of the window.
To modify the name and the other references of the area, click on
the icon next to the name field to display the window shown in
figure 3.2. if required, these references can be reported in the PDF
document generated as a report on the project (see the REPORT
chapter).
Figure 3.1 – PROJECT section
Figure 3.2 – Name and other references of the area
15
3
City and intended use of the system
In order to estimate the contribution of any natural light that there
may be in the area, the geographical position of the system needs
to be specified by setting the City parameter as the nearest main
city to the locality.
The parameters Type of building and Type of room refer to the
classification of the areas described in standard EN 15193. Various
room types are suggested for each type of building. Each choice
determines the setting of reference values for the parameter Operating hours (To) of the system.
Besides the operating hours, the standard also specifies reference
values for the Required lighting level and for the Absence factor (Fa),
which indicates for how long the room is occupied by the end users
during the operating hours.
Surface area of the room, maintenance factor and
period of operation
The PROJECT section can be used to specify the surface area of the
room expressed in m2 and the maintenance factor (MF). It should
be noted that the Evaluation period in the energy and economic
evaluations is the one specified by the user for each project folder
in the Details section seen earlier.
The choice of type of area determines the setting of the reference
values defined in standard EN 15193 for the parameter Operating
hours (To) of the system. This value is given by the sum of the hours
in which there is natural light (Td) and those in which there is none
(Tn), always with reference to one year. It is nevertheless possible to
specify the period of operation using the window shown in figure
3.3, by clicking on the icon to the right of the values To, Td and Tn.
Figure 3.3 – Setting the annual operating hours of the system
16
3
The checkbox The power is switched off in the hours in which the
system is not in use allows an evaluation of the consumption of
energy during the hours in which the system is “off” (lighting
level nil) but is nevertheless powered. This situation would involve
consumption of energy, for example when DALI fixtures are used
and/or when the system has control systems which remain active
even when the area is not being used. By selecting the checkbox,
the number of hours of stand-by Tp are considered as nil; otherwise
Tp is obtained by considering the number of hours in one year less
total operating hours To.
Place the mouse cursor over the name of a month to also display
the tooltip showing the number of weeks selected (figure 3.4).
The number of hours Td, Tn, To and Tp is calculated automatically
by considering the Hours of daily use and the sunrise and sunset
times for the selected locality. The graph displayed in the lower part
of the window provides a graphical interpretation of the calculation, showing the progress of the various parameters during the
year.
The checkbox Specify the time parameters of use of the system
can be used to calculate Td and Tn automatically by setting simple
parameters for the operation of the system. Besides the number
of days in a week and the number of weeks in a year, the weeks
of use can be specified for each month of use. To select, click on
the name of a month and then select (green) or deselect (grey) the
required week of the month (see figure 3.3).
Figure 3.4 – Setting the weeks of operation for a specific month
17
3
18
Area occupancy
Contribution of natural light
The choice of the type of area determines the setting of the reference value defined in standard EN 15193 for the parameter Fa (Absence), in addition to the percentage indicator of room occupancy
(Presence). This parameter can also be personalised by the user as
shown in figure 3.5.
The evaluation of the contribution of natural light is the most
critical stage in the calculation of the LENI, as the user does not
typically know all the construction parameters needed to determine
it exactly. These parameters may, for example, refer to the reflectance indices of the walls and the floor, the construction features
of the windows and so on. Thus the application allows qualitative
operation, where you can select the index of the contribution of
natural light from the hypothetical situations illustrated by the
image (Nil, Poor, Good, Excellent). If the user wishes, operation can
also be detailed, with all the technical parameters specified (Dc, Em,
Fds – see Annex), as shown in figure 3.6.
Figure 3.5 – Personalising the room occupancy indicator
Figure 3.6 – Personalising the contribution of natural light indicator
SOLUTION section
The SOLUTION section shown in figure 4.1 is used to manage all
the various design hypotheses that need to be considered in the
energy and economic evaluations. Each solution consists of one or
more groups of fixtures managed by traditional means (for example manual turning on and off by means of a switch) or by control
systems (for example automatic turning on and off and regulation
according to occupancy and the contribution of natural light).
A new solution can be added by using the New solution command
in the top right-hand corner of the solution selection bar. To delete
a solution use the command located next to the Name field. The
user is required to confirm before it is deleted.
Figure 4.1 – SOLUTION section
4
In the energy and economic evaluations, the energy saving and
investment payback time values are always calculated by considering
one of the solutions as reference and comparing the other solutions
one by one. Up to five solutions per area can be created.
To select which of the solutions is to be considered as reference,
use the option Set as reference in the solution menu that is displayed by clicking on the icon next to the name of the solution
(figure 4.2). Obviously, only one of the solutions can be selected as
the reference.
Figure 4.2 – Solution menu
19
4
Power consumption
Costs of the solution
The total power consumed by the components of the solution, that
is, by the lighting fixtures and control systems, is calculated automatically by considering the choices made in the sections for entering the
data described in the paragraphs below.
The costs of the solution can be calculated automatically by considering the price list costs of the components, to which a discount
can be applied, or they can be entered directly by the user. The
latter option is useful when the retail prices of the individual components are not known, such as for third-party products.
The labour costs for the replacement of sources are calculated automatically by considering their useful life, the evaluation period of
the system and the ensuing number of relamping cycles.
The installation costs, any extra management costs incurred during
the life of the system (for example for hiring platforms for the
maintenance of fixtures installed at critical heights) and any extra
discount on the total amount can also be specified.
20
4
Lighting fixtures
The various commands shown in figure 4.3 are used to add, modify
or delete a group of fixtures. A group of fixtures can be added with
the New group command. To modify an existing group, use the
command icon next to the description. Both operations will display
the window shown in figure 4.4.
The data can be entered in the following ways:
• Manual entry of all the values.
• Selection of a fixture from the products database using the Search
in the database command next to the Description field. Using the
window shown in figure 4.6, you can search for the required
product by entering the first letters of the description (or product
code) and selecting it from the table, or you can navigate manually
in the table to select the required product.
• When a product has been selected, its data are shown (figure
4.7). At this point you can confirm the choice of the product
(Copy), return to the table and select another product (Cancel), or
return to the initial table (New search).
• If necessary, data copied from the Products database can also be
modified. Such modifications will be stored exclusively in the project and will not have any effect on the data saved in the Database.
The following are some comments on the parameters shown in the
windows of figures 4.5 and 4.7:
• Regulation technology: if a fixture is dimmable, this indicates the
control technology with which it is compatible (Leading/Trailing
Edge dimmer (THE/TE), 1/10V, DSI, DALI, DMX).
• Power consumption in standby: indicates the power consumed
by the fixture when its light level is nil but the power supply is
connected. This parameter is important for DSI, DALI and DMX
dimmable fixtures. Other types of fixtures cannot be powered if
they are off.
• Standard installed power: laboratory-calculated parameter to estimate qualitatively the number of fixtures needed to light a room
of a given surface area when a particular lighting level is required.
This value is expressed in W/m2/100Lux.
• Some fixtures may have two separate types of light sources and
the parameters can be defined for each type.
• Time needed for bulb replacement: this is the time, expressed in
minutes, needed to replace all the bulbs of that type in the
fixture. This parameter is used to calculate the number of relamping
cycles during the whole evaluation period of the system.
The Quantity field, that is, the number of fixtures of the group to
be considered in the solution, can be set as required by the user or
calculated automatically by the application. In this case the parameters of the project and the Standard installed power field (expressed
in W/m2/100Lux) are considered as shown in the window in figure
4.5, and can be displayed by selecting the option Display advanced
specifications. To enable automatic evaluation, select the option
Calculate automatically according to the standard installed power
(W/m²/100lx), select the option Calculation plan and complete the
field Required lighting level (see figure 4.5).
Figure 4.3 – Managing groups of fixtures in a Solution
Figure 4.4 – Managing data relating to a group of fixtures in a Solution
21
4
Figure 4.5 – Advanced specifications of a group of fixtures in a Solution
Figure 4.6 – View of the products database
Figure 4.7 – Selecting a fixture in the products database
22
4
Control systems
After adding a group of fixtures to the Solution, the control mode
must be specified using the command icon next to the description,
which will provide access to the window shown in figure 4.8. Select
the mode with which the fixtures are managed from the dropdown
menu System description. Various options are possible:
The total power consumed by the system and the total price list
cost are calculated automatically by considering any components of
the system that may be entered with the System modification command. If required, the user can personalise these values by deselecting the relevant checkboxes next to the insertion fields.
• Manual control: switching on and off, and possibly also regulation
via local command, that is a control located inside the room and
therefore managed by the end users, or via centralised command.
• Automatic control: switching on and off, and possibly also regulation via automation systems based on presence and light sensors.
• Control via a particular family of control systems: these modes are
the same as the previous ones, except that the family of products
used is stored in the products database and therefore all the related
evaluation parameters are available.
• User defined: the user can enter manually all the parameters of
the window shown in figure 4.8.
In the window shown in figure 4.9, which is accessed via the
System modification command, you can set the control solution for
the group of fixtures selected. Click on a record in the table to enter
the component in the list below, the number of units of which
must be specified in the Qty column.
Figure 4.8 – Managing data relating to the control of a group of fixtures in a Solution
Figure 4.9 – Managing the components of the control system
The parameters for Presence control and Light intensity control (see
figure 4.8) are based on standard EN 15193. For more information
please see the Annex.
23
4
5
ENERGY section
Room plan
If the project was created by importing a .stf file generated by
Dialux, the menu shown in figure 4.2 will contain the item Display
room plan. Select this command to display the window shown in
figure 4.10 in which the room plan will be displayed with the layout
of the lighting fixtures used, including a key.
The ENERGY section shown in figure 5.1 is used to display the
results of the energy evaluations of the solutions. The LENI (Lighting
Energy Numeric Indicator) is calculated in accordance with the procedures described in standard EN 15193 and is expressed in kWh/
(year x m2). The energy consumed and the amount of CO2 produced
refer to the entire duration of the evaluation period of the system.
The energy comparison is calculated using the solution indicated
with the “flag” icon as reference.
Figure 5.1 – ENERGY section: Energy comparison
Figure 4.10 – Plan of the Solution (available only for projects created by Dialux)
24
5
EN15193 Benchmark
If a solution has a greater consumption than the reference solution,
the percentage value reported in the Energy comparison column will
be positive, if not it will be negative.
Click on the Consumption graph tab to display the window that
shows the energy comparison between the solutions as a graph.
The red bars show the solutions with the highest energy consumption, while the green bars indicate the solutions that provide energy
savings, always in comparison with the reference solution, which is
shown in grey (figure 5.2).
Click on the EN15193 Benchmark tab to compare all the solutions
with the maximum LENI values specified in standard EN 15193
(figure 5.3). These values depend on the following parameters (set
by the user):
Figure 5.2 – ENERGY section: Consumption graph
Figure 5.3 – ENERGY section: EN15193 Benchmark
• Criteria adopted for the lighting project.
• Presence of a control system to keep the lighting constant.
• Type of occupancy and daylight control system.
25
6
26
TCO section
The TCO section shown in figure 6.1 is used to display the results
of the economic evaluations of the solutions. The TCO (Total Cost
of Ownership) indicator is the sum of the initial investment, the
energy costs and the maintenance costs for the entire duration of
the evaluation period. The Payback Time indicator, which shows
the time needed to pay back the investment, is expressed in years
and is calculated using as reference the solution indicated with the
“flag” icon.
If the Payback Time is not significant, for example when the reference solution has a higher initial cost or when the management
costs are lower, the text Not defined is displayed in the table
(figure 6.1).
Click on the TCO Graph tab to compare in graphic form the progress over time of the costs of the various solutions throughout the
entire duration of the evaluation period (figure 6.2).
Figure 6.1 – TCO section: Economic comparison
Figure 6.2 – TCO section: TCO graph
REPORT section
7
The REPORT section shown in figure 7.1 is used to display in
advance the information of the summary PDF document of the
entire project. Print options can be selected for each category of
information. Use the Generate document command to create the
PDF document and wait a few seconds (figure 7.2).
A new window will then open in which the PDF document that
has been generated will be displayed (figure 7.3). To file the document, it must be saved on the user’s PC as only the data relating
to the project are saved on the server.
Figure 7.1 – REPORT section
Figure 7.2 – Wait message during
generation of the PDF document
Figure 7.3 – PDF document with project report
27
8
Annex
European Standard UNI EN 15193
This section of the user manual covers some technical subjects
related to standard EN 15193, the calculation methods contained
in the standard for the evaluation of the LENI and the methods for
calculating the economic indicators used by the application.
28
Since the technologies available in the field of Home & Building
Automation have made it possible to get significant benefits in the
energy consumption, comfort and safety of buildings, in 2002 the
European Union issued the directive known as “EPBD – Energy
Performance of Buildings Directive”. The matter of energy consumption relating to buildings was then taken up by the CEN
(European Committee for Standardisation) for the purpose of drawing up precise calculation standards which would allow evaluation
of the effect of automation and technical management on the
energy consumption of buildings.
Thus standard EN 15232 ““Energy performance of buildings –
Impact of building automation, controls and building management
on the energy consumption of buildings” was issued in 2007. This
regulatory process is set to continue, since the EPBD directive must
be transposed into national and regional legislation by the responsible bodies: it will be compulsory in the future to adopt automation
and control systems, especially with regard to the management of
lighting.
Standard EN 15232 evaluates the effects of BACS (Building Automation and Control Systems) and TBM (Technical Building Management)
technologies on consumption and provides two methods to calculate
their impact on energy performance. While the “BAC factors method” is statistical, the second method is detailed and allows exact
results to be calculated, using reference regulations specific to each
type of system (e.g. lighting, heating, ventilation, etc.).
Specific European legislation UNI EN 15193 was then defined
for lighting systems, including the LENI (Lighting Energy Numeric
Indicator) to express the energy consumed in a building based on a
given m2 in one year.
8
Calculation of the LENI (Lighting Energy Numeric
Indicator)
The UNI EN 15193 standard specifies the methods to calculate the
energy consumption of lighting systems inside buildings. By using a
numeric indicator, which can also be used for energy certification,
the consumption can be estimated both for existing buildings and
for new constructions or buildings under renovation. The standard
also provides the maximum energy values envisaged for the lighting
of various types of buildings and enables the calculation of instantaneous energy consumed, which can be used to estimate the overall
energy efficiency of the building.
The indicator in question is the LENI (Lighting Energy Numeric
Indicator) which expresses the energy consumed for lighting in a
building, based on a given m2 in one year and is expressed in kWh/
(m2 x year).
LENI =
{(Pn x Fc) x [(Td x Fo x Fd) + (Tn x Fo)]}
[ kWh / (m2 x year) ]
Area
The variables that determine the value of the LENI in turn depend
on various factors:
• Pn – expresses the nominal power of the lighting system
• Fc – depends on the overrating of the power of the system
• Fo – depends on the degree of the occupancy of the lit area
• Fd – depends on how the control system takes advantage of the
natural light
• Td – expresses the number of hours per year in which the system
works when there is natural light
• Tn – expresses the number of hours per year in which the system
works when there is no natural light
• Area – expresses the surface area of the lit area.
The parameter Fc (Constant illuminance factor) is used to evaluate
the energy savings resulting from the introduction of fixtures that
can be regulated in combination with systems to control the luminous flux. The overrating of the system, expressed by the parameter
MF (Maintenance Factor), means that the light level required from
the fixtures can be lowered in order to maintain the required brightness. Though this contribution to energy saving drops as the light
sources diminish, it is still present even when there is no natural
light.
When the area is occupied irregularly and there is an automatic
presence control system, Fo (Occupancy dependency factor) values
are obtained; these are better the lower than 1 they are. This
parameter determines the time in which the lighting fixtures are
off, with the ensuing reduction in consumption and increase in the
lifetime of the sources, which therefore also leads to a saving in
maintenance and relamping costs.
The parameter Fo depends in turn on the following parameters:
• Fa (Absence Factor) – indicates the degree of occupancy of the
area during the period of operation of the system.
• Foc (Occupancy dependent lighting control system factor) –
indicates the effectiveness of the control system in managing the
system according to the presence/absence of people in the area.
If the lighting system has fixtures that can be regulated and a
system that allows the automatic management of the brightness
in relation to the contribution of natural light, the parameter Fd
(Daylight dependency factor) is less than 1. The reduction in consumption due to the ability to use the natural light clearly depends
on the location of the building (latitude) and its construction characteristics, such as the geometric indices of the windows and the
reflection coefficients of the walls and floor.
The parameter Fd depends in turn on the following parameters:
• Dc (Daylight factor for façade opening) – factor depending on the
construction parameters of the building which determine the
index of penetration of natural light inside the room (for vertical
façades).
• Fds (Daylight supply factor) – factor of the availability of daylight
which depends on the geographical location of the building, the
maintenance light level and the index of penetration of natural
light inside the room;
• Fdc (Daylight dependent artificial lighting control factor) –
effectiveness of the control system in managing the contribution
of artificial light in relation to that of natural light.
29
8
Calculation of the TCO and Payback Time
The Total Cost of Ownership (TCO) of a lighting system includes all
the costs of various kinds incurred during the entire lifecycle of the
system relating to materials, energy consumption and installation
and maintenance activities. The following are the main factors to be
considered:
• Initial investment
- Costs relating to the light fixtures, control system and accessories
- Costs relating to the installation and commissioning of the system
• Maintenance costs
- Costs for consumables
- Costs for maintenance activities
• Costs relating to the consumption of energy.
30
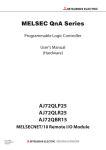
Figure 8.1 – Graphical representation of TCO and Payback Time
Energy consumption can be estimated by following the instructions
provided by European Standard EN 15193, which describes a very
detailed calculation method using the LENI (Lighting Energy Numeric Indicator) to evaluate the efficiency of a lighting system that may
also have an automatic control system for presence and natural
light detection.
Thus, to evaluate an investment, two or more design solutions
are compared, each of which will involve different initial costs and
management costs. The investment payback time can be calculated
using the Payback Time indicator, a parameter that indicates how
many years it will take to pay back a solution with a higher initial
cost but which is more efficient in terms of management costs. The
Payback Time is obtained by dividing the difference of the initial
investment by the annual saving in energy and maintenance costs
and is expressed in years.
Figure 8.1 shows the comparative analysis of two solutions in graph
form by considering the TCO (on the right) and the annual cumulative costs of the system (on the left). The intersection between the
two lines shows the Payback Time.
8
Compatibility with Dialux projects
The application can be used to create new projects from files
generated by Dialux. Figure 8.2 shows the command of the menu
File>Export>Save STF file… in Dialux which is used to export the STF
file which will then be imported into the application.
Figure 8.2 – Exporting the project in STF format from Dialux
However, it is essential to follow the guidelines set out below when
creating projects in Dialux:
• The name of the project in the application will be the same as
the one used in Dialux. For example in the figure 8.2 the name is
“OFFICES – cellular office 1 person”.
• Each room in the project will correspond to a solution in the
application (Solution) and must therefore have identical geometric
properties. To this end, it is recommended to use the Duplicate
room command as shown in figure 8.3. The name of the Solution
will be the same as the name of the room, for example “LUCERI
LED”.
• If a room project uses Artemide fixtures whose data are stored
in the Database, the application will automatically copy all the
information into the Solution. Alternatively, for example when
using third-party products, all the energy and economic data of
the fixtures used will have to be entered manually.
Figure 8.3 – Use of the Duplicate room command to create different Solutions
31
artemide.com