1
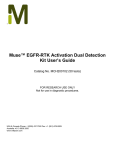
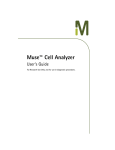
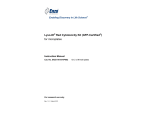
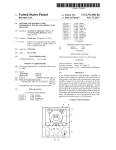
Muse™ Autophagy LC3-antibody based Kit
User’s Guide
Catalog No. MCH200109
FOR RESEARCH USE ONLY
Not for use in diagnostic procedures.
USA & Canada Phone: +1(800) 645-5476
In Europe, please contact Customer Service:
France: 0825.045.645;
Spain: 901.516.645 Option 1
Germany: 01805.045.645
Italy: 848.845.645
United Kingdom: 0870.900.46.45
For other locations across the world please visit www.millipore.com/offices
Introduction
Autophagy is an intracellular catabolic pathway that causes cellular protein and organelle turnover,
and it is associated in diverse diseases including Alzheimer's disease, aging, cancers, and Crohn's
disease. It is a tightly regulated process that plays a normal part in cell growth, development, and
cellular homeostasis. Autophagy functions as a housekeeping mechanism by disposing of aging
and/or dysfunctional proteins and organelles through sequestering and priming proteins for lysosomal
degradation. Increasing evidence suggests that not just apoptosis, but also autophagy, can
contribute to cell death and greatly influence general cell health. Malfunctions of the autophagy
process are proposed to influence cell health longevity and the capability of cells to function at full
capacity.
EMD Millipore’s Muse™ Autophagy LC3-antibody based kit provides a quantitative solution for the
study of autophagy. This kit contains two key detection reagents to help facilitate the monitoring of
lipidated LC3-II in a given cell system:
The use of selective permeabilization solution discriminates between cytosolic LC3 from
autophagic LC3 by extracting the soluble cytosolic proteins, while protecting LC3 which has
been sequestered into the autophagosome;
Since autophagy is a constitutive cellular degradation process, the use of an autophagy
detection reagent (Autophagy Reagent A) will prevent the lysosomal degradation of LC3,
allowing its quantification by flow cytometry.
Data generated using the Muse™ Cell Analyzer along with the corresponding Muse™ software
module provides statistical values measuring:
•
•
•
Mean Autophagy Value (for both control and test samples)
Autophagy Induction Ratio (Test sample fluorescence relative to control)
Percentage of cells with increased autophagy (Test sample versus control)
By having the ability to measure and quantify autophagy, one can screen autophagy inducers or
inhibitors, monitor cell culture health and protein turnover rate, study the mechanisms of protein
degradation, and identity new autophagy targets and pathways leading to aging and
neurodegenerative diseases.
The Muse™ Autophagy LC3-antibody based kit is optimized on the Muse™ Cell Analyzer. The antiLC3 Alexa Fluor®555 conjugated antibody and autophagy enabling reagents have been carefully
evaluated to ensure optimal performance, alleviating the need for any additional validation of the kit
reagents. This kit contains reagents A and B, along with an assay buffer to provide researchers a
complete solution for autophagy analysis.
1
Figure 1. Autophagy: Four Stages of Autophagy Autophagy can be induced by nutrient depletion or
inhibition of mTOR pathway. During autophagy, cytosolic proteins and aging organelles are sequestered
by a double membrane vesicle to form autophagosomes. One of the hallmarks of autophagy is
translocation of LC3 from the cytoplasm to the autophagosome. Autophagosome then fuses with the
lysosome to cause the breakdown of autophagosome vesicle and its contents, including LC3. This process
can be visualized using a RFP-LC3 fusion protein.
2
Product Overview
Discrimination between cytosolic and autophagosome associated LC3 is achieved by monitoring the
translocation of LC3 using flow cytometry. This kit provides the reagent for the disruption of the cell
plasma membrane using a proprietary selective permeabilization solution (figure 2). The selective
permeabilization solution will extract cytosolic LC3 by flushing away during washing steps. LC3
translocated into the autophagosome is protected from the extraction and remains intact inside
autophagosome, thereby allowing its fluorescence to be measured by flow cytometry or imaging.
Since autophagy is a constitutive cellular degradation process, the use of an autophagy detection
reagent (Autophagy Reagent A) will prevent the lysosomal degradation of LC3, allowing for
quantification of its fluorescence.
.
Figure 2. Selective Permeabilization helps discriminate
cytosolic from autophagic LC3 Discrimination between
cytosolic LC3-I from autophagosome associated LC3-II is
achieved by disruption of cell PM by using an autophagy
enabling solution (Autophagy Reagent B).
This selective permeabilization will “release” cytosolic LC3
by flushing away during washing steps. LC3-II trapped in
the autophagosome remains intact and fluorescence can
be measured.
EMD Millipore’s Muse™ Autophagy LC3-antibody based kit includes an anti-LC3 mouse monoclonal
antibody conjugated to Alexa Fluor®555, used to measure and track the levels of LC3 within the cell.
The autophagy detection reagents and antibody have been optimized together to ensure the ability to
measure and discriminate between cytosolic and lipidated LC3 to accurately measure the autophagic
process. Sufficient enabling reagents are provided to perform 100 tests. Detailed assay instructions
are included to assist in analysis.
For Research Use Only; Not for use in diagnostic procedures
3
Summary of Protocol
Cell Culture and Treatment
Culture cells at 40,000 cells per
well in the 96 well plate overnight.
The next day, treat with autophagy
reagent A for 2~6 hours
(Untreated and Treated)
Add 100 µL 1X
autophagy reagent
B per tube. Incubate
for 5 min.
Resuspend in 200 µL
1X Assay Buffer and
acquire samples on
Muse Cell Analyzer
↓
Detach cells and transfer to a Muse
compatible centrifuge tube and spin
at 2500 rpm for 5 min remove
supernatant.
→
Centrifuge cells at
2500 rpm for 5 min
and wash with 1X
Assay Buffer
Materials Provided
•
20X Anti-LC3 Alexa Fluor®555,, clone 4E12
4E12: (Part No. CS208164).
). One vial containing 250 µL
CF200097: Autophagy Detection Reagent Pack (stored at 2°C - 8°C) :
•
Autophagy reagent A: (Part No. CS208212) One vial (lyophilized)
•
Autophagy reagent B: (Part No. CS208215) One vial containing 1 mL
•
5X Assay Buffer:: (Part No. CS202124) One bottle containing 55 mL
Materials Required But Not Supplied
Reagents/Consumables
• Test tubes for sample preparation and
storage
• Tissue culture reagents, i.e. HBSS, PBS
w/o Ca2+ or Mg2+, cell dislodging buffers,
etc.
•
Deionized Water (for buffer dilution)
•
Microcentrifuge tubes with screw caps, 1.5
mL (VWR, Catalog No. 16466-030,
030, or
equivalent)
•
Muse™ System Check Kit (Catalog No.
MCH100101)
•
Guava® ICF Instrument Cleaning Fluid
(Catalog No. 4200-0140),
0140), optional
Equipment
• Pipettes with corresponding tips capable of
accurately measuring 10 – 1000 µL
• Tabletop centrifuge
rifuge capable of achieving 300 x
g
• Mechanical vortex
• Muse™ Cell Analyzer
4
Warnings and Precautions
•
The instructions provided have been designed to optimize the kit’s performance. Deviation from
the kit’s instructions may result in suboptimal performance and may produce inaccurate data.
•
Some assay components included in the kit may be harmful. Please refer to the MSDS sheet for
specific information on hazardous materials (MSDS forms can be found on the web page or by
contacting Millipore technical services).
•
During storage and shipment, the anti-LC3 monoclonal antibody may condense within the vial.
For maximum recovery of the product, centrifuge original vial prior to removing cap.
•
Autophagy reagents A and B must be stored in at 2 - 8°C upon receipt. Keep autophagy reagent
A lyophilized until ready for use. Any leftover reconstituted material can be stored at -20°C for up
to 6 months (avoid repeated freeze/thaw).
•
Do not use reagents beyond the expiration date of the kit.
Storage and Stability
All reagents must be stored at 2 - 8ºC.
All kit components are stable up to six (6) months from date of receipt if stored and handled correctly.
Please avoid repeated changes in temperature as this will affect the integrity of the product.
Before You Begin
It is highly recommended that you run the cell samples shortly after completing the sample
preparation.
Time considerations: Cell treatment with Autophagy reagent A and selective permeabilization will
take approximately 2 hours. Cellular staining will take approximately 30 minutes. Acquiring data on
your Muse™ Cell Analyzer takes less than 3 minutes per sample, depending on the cell concentration
and desired number of events to acquire.
Always perform a System Check prior to performing the assay. For details refer to the Muse™ Cell
Analyzer User’s Guide.
5
Preparation of Reagents
1. Autophagy Reagent A
This material is supplied in a lyophilized vial. Prior to use, reconstitute the contents of the vial in
250 µL deionized water.
Note: It is recommended to aliquot multiple vials and maintain them stored at -20°C. Avoid
exposure of the reagent to repeated freeze and thaw cycles.
2. Autophagy Reagent B
Autophagy reagent B is supplied at 10X concentration and should be diluted to 1X with deionized
water prior to use. Prepared 1X Autophagy Reagent B is stable up to one year. Store at 2 - 8ºC.
3. Assay Buffer
Assay Buffer is supplied at 5X concentration and should be diluted to 1X with deionized water
prior to use. Prepared 1X Assay Buffer is stable up to one year. Store at 2 - 8ºC
Assay Instructions
General Assay Protocol (To monitor autophagosomes)
1. Culture cells to approximately 40,000 cells per well in 200 µL growth media in the 96 well plate.
Incubate overnight in a 37°C incubator with 5% CO 2.
2. The next day, for treated cells, remove growth media from cells and wash cells once with 1X
HBSS. Replace media with 200 µL of EBSS + 0.2 µL Autophagy Reagent A (1:1000 dilution)
at 37°C incubator for 2~6 hours to induce autophagy under starvation conditions; for untreated
cells, continue culture with growth media supplemented with FBS in the 96 well plate.
3. After 2~6 hours treatment, aspirate wells to remove culture supernatants and wash the cells
once with 1X HBSS. Detach cells with 100 µL Accutase (or any other mild enzyme) for 5
minutes at 37°C. Transfer cells to a Muse compatib le sample tube(s) and add 100 µL 1X
HBSS to each well.
4. Spin the sample tubes at 300 x g for 5 minutes at 4oC and remove supernatant.
5. Add 5 µL of Anti-LC3 Alexa Fluor®555 and 95µL of 1X Autophagy Reagent B to each sample
tube. Stain on ice for 30 minutes in the dark.
6. Spin the sample tubes at 300 x g for 5 minutes at 4oC and remove supernatant, then wash
cells once with 1X Assay Buffer.
7. Resuspend each sample tube in 200 µL 1X Assay Buffer and acquire by Muse immediately.
8. During cellular acquisition, event counts per µL should not exceed 800. Check for counts per
µL when adjusting settings. Dilute your sample to target 500 events per µL.
Note: LC3 expression can vary depending on the cell line being evaluated. The kit is designed to
measure endogenous levels of LC3, so be aware that some cell types may have very low
endogenous levels of LC3 not measureable by immunodetection methods.
6
Setup and Acquisition on the Muse™ Cell Analyzer
Run a System Check prior to performing the assay. For information on Muse™ System Check, refer
to the Muse™ Cell Analyzer User’s Guide.
1. Select Autophagy (LC3 detection) from the main menu.
2. Select Run Assay.
7
3. Adjust the instrument settings:
•
Load the sample for adjusting the settings
and select Run.
Note: Perform the adjust settings step using a
negative control (e.g. no treatment / no
starvation), then verify the settings using a
positive control (e.g. treated / starvation).
•
Or, to retrieve previously saved instrument
settings, select Retrieve Settings. For more
information on retrieving settings, see the
Muse™ Cell Analyzer User’s Guide.
4. Fine tune the settings for the AUTOPHAGY INTENSITY and CELL SIZE INDEX plot, if necessary.
• Adjust the CELL SIZE INDEX slider accordingly to capture the cell population of interest (see
on screen instruction for example).
•
Drag the threshold up or down to exclude cell debris. Drag the bar to make large changes.
Touch the arrow buttons located below the plot to make small changes. The arrow buttons
appear after you touch the threshold function.
NOTE: If the acquisition times out (after four minutes), you can select Abort to restart the adjust
settings step or Next to accept the settings and continue to the next step.
Capture cell population of
interest by adjusting the
CELL SIZE INDEX slider
bar on the Y-axis.
Touch threshold to
activate and adjust
up/down to exclude
cell debris.
8
Fine tune threshold
adjustments by
using the arrows
below.
5. Select Next when you have completed the adjustments.
6. Fine tune the settings for the LC3 INTENSITY histogram plot, if necessary.
•
SETTING THE HISTOGRAM MARKER: To set the histogram marker properly, prepare a
control cell sample (e.g. no treatment and fed / no autophagy) and place the histogram marker
immediately to the left edge of the peak as shown in A. This will represent your negative cells.
•
Adjust and extend the other end of the histogram marker to the right to cover the region to the
right of this control sample histogram peak as shown in B. This marker will isolate the cells of
interest and provide a range of detection to record the mean autophagy intensity for both your
control and testing samples.
•
As soon as the histogram marker covers a wide range for capture and detection within the
histogram plot, this will serve as the measure for statistical information as shown in C. The
marker should be able to enclose all histogram plots, both the control and the target samples.
If this is not feasible, it is possible to perform post acquisition adjustments of the histogram
marker to capture all required data points.
A. Moving the quadrant marker
B. Adjusting the histogram marker
7. Select Next when the marker adjustments are complete.
9
C. Completion
8. Verify the settings. If the settings are correct, select Next. Otherwise, select Back and repeat
steps 4 through 7, as necessary.
9. Enter the sample ID by touching the field, then using the keypad to input the ID. Touch Done
when you’re finished entering the ID. If necessary, change the Events to Acquire by touching the
field, then selecting the value from the pop-up menu. Select Next.
*Note: It is very important to first run a control sample prior to acquisition of the experimental/target
samples. Data analysis and result values are based on the autophagy induction ratio where the
mean autophagy intensity of the target sample is compared relative to the control sample (negative).
ii. Subsequent Sample(s): Target
i. First Sample: Control
When first running
the first sample,
make sure that the
sample type is
“control” in the field
below
Subsequent samples
will be experimental
samples. Make sure
that sample type is
identified as “target”.
10
10. Follow the onscreen instructions and mix the first sample. Load the sample on the instrument
loading arm. Select Run to acquire the sample.
During acquisition, live statistical
values are generated and
represented on a histogram graph.
11. When acquisition is complete, the results are displayed. If desired, select Plots to display a dot
plot and a bar graph for the sample.
Select to hide
plots.
Select to
display plots.
You can view or change the sample ID, as well as add annotations for the current sample by
selecting the “Sample Info.” Tab. To print the results for the current sample select the printer tab.
11
12. (Optional) If changes are needed to the gates assigned, touch the histogram plot to enlarge it,
then adjust the histogram marker according, as described in steps 4 and 6, respectively. You cannot
adjust the cell size threshold after the sample has been acquired.
If you adjust the gate on subsequent samples and wish
to apply the changes to other samples that you already
acquired, select the Apply Changes button in the title
bar. Select the samples you want to apply the changes
to or choose Select All, then select Apply. The
sample you originally made changes to must be
selected.
Select to apply
changes to
other samples.
Also, if you would like to overlay the control and target
histograms, click the “Show Overlay” box for a direct
visual comparison.
Lastly, the histogram marker can either be visible on
the histogram plot or removed. To show the histogram
marker, activate the “Show Marker” box.
13. If no adjustments are needed, select Next Run and repeat steps 9 through 11 for the remaining
samples.
NOTE: During the run, a message may appear
prompting you to load a tube of DI water for a Quick
Clean. Load the water then select Clean to perform the
Quick Clean. Select Next to continue with the run. The
frequency of Quick Cleans was set by your system
administrator. Your administrator may also have chosen
to allow you to skip the Quick Clean when the prompt
appears. You can choose to perform additional Quick
Cleans at any time during a run by selecting Clean in
the title bar, then Quick Clean from the menu.
14. When you have acquired the last sample, select
Finish.
15. (Optional) Select Options in the title bar to rename
the data set, export the data set, save the current
instrument settings, or view the event log. Refer to the
Muse™ Cell Analyzer User’s Guide for more
information.
12
Results
The software performs calculations and displays the data in two plots:
•
A dot plot displaying cells which are chosen for data acquisition and analysis (exclusion of
cellular debris), all performed during adjustment of settings.
•
A histogram profile illustrating the fluorescence intensity of the sample acquired. All testing
sample histogram profiles can be overlaid with the control sample (e.g. “no autophagy”) and
compared to monitor the changes in autophagy intensity.
Results from each run are stored in a data file, as well as its corresponding spreadsheet (CSV) file.
The data file and spreadsheet file contain the following statistics:
•
•
•
•
•
Sample Number
Sample ID
Mean Autophagy Intensity
Autophagy Induction Ratio (Test sample fluorescence versus control sample fluorescence)
Total number of Cells
A.
B.
Figures A and B. HeLa cells were either starved for 4 hours to induce autophagy or kept under fed
conditions, and then stained with the anti-LC3/Alexa Fluor®555 conjugated antibody. Samples were
acquired using the Muse™ Cell Analyzer and statistical results are shown above. Figure A shows the
results summary for the test sample, as well as the corresponding histogram plot comparing the
control versus the target sample.
The statistics captured in this assay can also be illustrated by a data results summary table as shown
in B. Here, the mean autophagy intensity for each sample is determined and the autophagy induction
ratio is then calculated based on the ratio between the target sample fluorescence versus the control
sample. In this cell population, there is a 6.4-fold change between the control sample (e.g. no
autophagy in blue) when compared to the starved sample (e.g. induced autophagy in red), indicating
the presence of autophagy.
13
Technical Tips
1. Confirm that testing cells are greater than 80% viability prior to assay.
2. For drug treatments and/or starvation times, all incubation times and sample concentrations must
be optimized at the researcher’s own discretion to suit the researcher’s individual experimental
needs.
3. Do not mix or interchange reagents from various kit lots.
4. Mix each cell sample thoroughly on a mixer before acquiring samples for consistent and accurate
results. However, avoid vigorous mixing, which can cause cellular breakdown and splashing,
resulting in volume loss and erroneous results.
5. The default number of events to acquire is 1000 events. You may select a different number,
however, your statistical error will increase as you decrease the number of acquisition events.
6. Periodically run Quick Clean using a tube of DI water (after every 20 sample acquisitions) to
prevent a buildup from cellular debris in the system. If your samples contain significant amounts
of cellular debris, run the Quick Clean cycle more often to prevent clogs or blockage.
7. If you are acquiring data from a sample but the progress bar is not moving, there is probably either
insufficient volume to continue to acquire the sample or a blockage of the flow system. First check
to ensure that there is at least 100 µL of sample in the tube. If not, add additional buffer to bring
the volume up to 100 µL or proceed to the next sample. If the sample volume is greater than 100
µL, then the lack of events is probably due to a clog. A clog or blockage can be caused by cell
aggregates, cell debris, bleach crystals, or other particulates. Perform a backflush to flush out the
clog into a tube containing 20% bleach. Then run Quick Clean to remove bleach residue. If this
procedure does not alleviate the problem, refer to the Muse™ Cell Analyzer User’s Guide for
additional troubleshooting tips, or contact Millipore Technical Support for help.
8. The Muse™ Autophagy LC3-antibody based Kit works best with samples in single cell
suspension. Cell aggregates may clog or be excluded from the flow cell, affecting the accuracy of
the results. If cell cultures continue to be “clumpy”, it is recommended to order Muse™ Cell
Dispersal Reagent (Catalog No. MCH100107) to disaggregate the cells. Contact customer service
or visit our website at www.millipore.com/muse for detailed information on the Muse™ Cell
Dispersal Reagent and assay method. For more troubleshooting tips refer to the Muse™ Cell
Analyzer User’s Guide.
For more information, contact the Millipore office nearest you. In the USA, call 1-800-MILLIPORE (1800-645-5476). Outside the USA, visit our website at www.millipore.com/offices for up-to-date
worldwide contact information. You can also view the tech service page on our website at
www.millipore.com/techservice.
14
Troubleshooting
Potential Problems
Acquisition taking longer than
expected or progress bar stops
during acquisition
Instrument clogging
No detectable levels of autophagy
in testing samples
Low cell concentration warning
during acquisition
High cell concentration warning
during acquisition
High %CVs (wide peaks) or false
peak
Low level of sample fluorescence
Experimental Suggestions
Ensure that the System Check procedure was run and
passed. If the progress bar stops during acquisition, the
fluid system may be clogged. Run a Quick Clean
procedure to clean the capillary. It can be performed
during or after an assay.
If the instrument is clogged, run a Quick Clean
procedure to clean the capillary. It can be performed at
anytime during an assay between samples.
Since autophagy is a constitutive degradation process,
make sure that Autophagy Reagent A is added 2 hours
prior to cell acquisition. This reagent functions as a
lysosomal degradation inhibitor to prolong the antibody
fluorescence detected in autophagosome bound LC3.
Ensure that cells are counted properly prior to
beginning the experiment. The assay instructions are
optimized to give you a range of cells between 300–
700 cells/µL in the final sample volume so accurate
population count results are obtained. A substantial
decrease in cell numbers can lead to difficulty in
adjusting settings.
If the concentration of the cell sample is high (>1200
cells/µL), dilute the sample further with Assay Buffer to
adjust the cell concentration between 300 and 700
cells/µL.
Although the assay procedure has been optimized to
function on the Muse Cell Analyzer, at times cell
preparation and/or health can affect assay
performance. The wide peaks or false peak may
indicate that:
• The sample is poorly permeabilized as a result of
cell aggregates. Ensure your sample is a single-cell
suspension before fixing and staining.
• Cell concentration is too high. Decrease the number
of cells by diluting the sample to 300–700 cells/µL.
The Muse™ Cell Analyzer gives the most accurate
data when the flow rate is between 300 and 700
cells/µL.
• Cell viability is poor prior to assay setup, resulting in
sub-optimal results.
• Verify that the System Check procedure was
performed and the results passed.
15
Related Products
1. Muse™ H2A.X Activation Dual Detection Kit (Catalog No. MCH200101)
2. Muse™ EGFR-RTK Activation Dual Detection Kit (Catalog No. MCH200102)
3. Muse™ PI3K Activation Dual Detection Kit (Catalog No. MCH200103)
4. Muse™ MAPK Activation Dual Detection Kit (Catalog No. MCH200104)
5. Muse™ Bcl-2 Activation Dual Detection Kit (Catalog No. MCH200105)
6. Muse™ Multi-Color DNA Damage Kit (Catalog No. MCH200107)
7. Muse™ PI3K/MAPK Dual Pathway Activation Kit (Catalog No. MCH200108)
8. Muse™ RFP-LC3 Reporter Autophagy Assay Kit (Catalog No. MCH200110)
9. Muse™ System Check Kit (Catalog No. MCH100101)
10. Muse™ Count & Viability Kit (100T) (Catalog No. MCH100102)
11. Muse™ Annexin V & Dead Cell Kit (Catalog No. MCH100105)
12. Muse™ Cell Dispersal Reagent (Catalog No. MCH100107)
References
1. Shvets, E., et al. (2008). Utilizing flow cytometry to monitor autophagy in living mammalian
cells. Autophagy; 4(5): 621-8.
2. Zhang, L., et al. (2007). Small molecule regulators of autophagy identified by an image-based
high-throughput screen. Proc Natl Acad Sci U S A;104(48):19023-8.
3. Degtyarev, M., et al. (2008). Akt inhibition promotes autophagy and sensitizes PTEN-null
tumors to lysosomotropic agents. J Cell Biol.;183(1):101-16.
4. Mizushima, N., et al. (2004). Methods for monitoring autophagy. Int J Biochem Cell
Biol.;36(12):2491-502.
5. Fleming, A., et al. (2010). Chemical modulators of autophagy as biological probes and
potential therapeutics. Nat Chem Biol.;7(1):9-17.
6. Tian, Y., et al. (2011). A small-molecule enhancer of autophagy decreases levels of Aβ and
APP-CTF via Atg5-dependent autophagy pathway. FASEB J.;25(6):1934-42.
7. Turcotte, T., et al. (2008). A molecule targeting VHL-deficient Renal Cell Carcinoma that
induces autophagy. Cancer Cell; 14(1):90-102.
16
Warranty
EMD Millipore Corporation (“EMD Millipore”) warrants its products will meet their applicable
published specifications when used in accordance with their applicable instructions for a period of one
year from shipment of the products. EMD MILLIPORE MAKES NO OTHER WARRANTY,
EXPRESSED OR IMPLIED. THERE IS NO WARRANTY OF MERCHANTABILITY OR FITNESS
FOR A PARTICULAR PURPOSE. The warranty provided herein and the data, specifications and
descriptions of EMD Millipore products appearing in EMD Millipore’s published catalogues and
product literature may not be altered except by express written agreement signed by an officer of
EMD Millipore. Representations, oral or written, which are inconsistent with this warranty or such
publications are not authorized and if given, should not be relied upon.
In the event of a breach of the foregoing warranty, EMD Millipore Corporation’s sole obligation shall
be to repair or replace, at its option, the applicable product or part thereof, provided the customer
notifies EMD Millipore Corporation promptly of any such breach. If after exercising reasonable
efforts, EMD Millipore Corporation is unable to repair or replace the product or part, then EMD
Millipore shall refund to the Company all monies paid for such applicable Product. EMD MILLIPORE
CORPORATION SHALL NOT BE LIABLE FOR CONSEQUENTIAL, INCIDENTAL, SPECIAL OR
ANY OTHER DAMAGES RESULTING FROM ECONOMIC LOSS OR PROPERTY DAMAGE
SUSTAINED BY ANY COMPANY CUSTOMER FROM THE USE OF ITS PRODUCTS.
Unless otherwise stated in our catalog or other company documentation accompanying the product(s), our products are
intended for research use only and are not to be used for any other purpose, which includes but is not limited to,
unauthorized commercial uses, in vitro diagnostic uses, ex vivo or in vivo therapeutic uses or any type of consumption or
application to humans or animals.
(c) 2009 - 2013: Merck KGaA, Darmstadt. All rights reserved. No part of these works may be reproduced in any form
without permission in writing.
17
Catalog No. MCH200109
May 2013
Revision A: MCH200109MAN