1
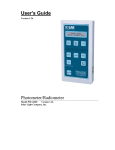
User's Guide Version 1.19 Photometer/Radiometer Model PMA2100 Version 1.19 Solar Light Company, Inc. 2 Solar Light Co., Inc. © 2005 Solar Light Company. All rights reserved. 100 East Glenside Ave. Glenside, PA 19038 USA Tel: 215/ 517-8700 Fax: 215/ 517-8747 US Patent 5,790,432 Procomm is a registered trademark of Datastorm Technologies. Excel and Windows are registered trademarks of Microsoft Corporation. Document No. PMA2902C October 2005 Printed in the United States of America. Solar Light Co., Inc. 3 Contents USER'S GUIDE 1 VERSION 1.19 1 MODEL PMA2100 VERSION 1.19 1 CONTENTS 3 INTRODUCTION 5 PMA2100 DESIGN CONCEPT MAJOR FEATURES CURRENTLY SUPPORTED DETECTORS QUICK START 5 6 6 8 SELECTION OF THE DETECTOR MEASURING WITH PMA2100 8 8 CONTROLS AND INDICATORS 10 DISPLAY KEYPAD AUDIBLE SIGNALS ERROR MESSAGES SETUP METER SETUP LCD CONTRAST LINE FREQUENCY REJECTION REAL TIME CLOCK AND CALENDAR DETECTOR SETUP LOW PASS DIGITAL FILTER 10 12 13 13 14 14 14 14 14 15 15 Solar Light Co., Inc. 4 AUTOMATIC DATA LOGGING SCALE OFFSET ALARMS MODE OF OPERATION DATA MANAGEMENT DATA LOGGING DOWNLOADING THE DATA DATA PROCESSING INTERFACES 15 16 16 17 19 20 20 21 22 24 DETECTOR INTERFACE SERIAL AND EXTENSION PORT DIGITAL CONTROL LINES 24 26 27 TECHNICAL SPECIFICATIONS 30 MAINTENANCE AND TROUBLESHOOTING 31 METER CALIBRATION BATTERY CHARGING 31 31 TABLE OF FIGURES 32 INDEX 33 Solar Light Co., Inc. 5 Introduction The Personal Measurement Assistant model PMA2100 is a sophisticated, multipurpose measuring instrument combining the user-friendliness of simple meters with the capabilities of an advanced data logger. PMA2100 design concept The combination of simplicity of use and enhanced features was possible thanks to the implementation of microprocessor technology and an innovative architecture. The meter itself is programmed to perform the tasks common to most detectors. The information specific for a particular detector is stored in a nonvolatile memory built into the detector itself. It PMA2100 DISPLAY CONNECTOR AND CABLE CENTRAL PROCESSOR AND MEMORY SYSTEM DETECTOR AMPPLIFIERS SENSOR DETECTOR MEMORY KEYPAD Figure 1 Architecture of the PMA2100 includes identification information, signal processing algorithms, a description of the data presentation and the current setup of the detector. Solar Light Co., Inc. 6 Upon connection of the detector the PMA2100 identifies it, downloads the contents of the detector’s memory into operating memory, updates its setup and executes the downloaded code, if appropriate. This approach allows for an unlimited number of detectors to be handled by the PMA2100. It configures itself to the specific features of each detector and the custom setup of the measurement process. Major features Measuring with the PMA2100 is as simple as with the usual single detector and meter. Plug in the detector to either of the two input sockets, turn ON the power and read the display. The many additional capabilities of the PMA2100 are added through menu driven setup. These capabilities of the PMA2100 Version 1.19 include: • • • • • • • • • • • User selectable system of units Integration of the accumulated dose Tracking of the extremes of the signal (min., max., avg.) Automatic and on-demand data storage and printout Digital low pass filter Programmable alarms triggered by the signal level or the dose level Line interference rejection for both 50 and 60Hz Two, simultaneously serviced, detector inputs Serial interface Digital inputs and outputs to control external devices Dose Control System (DCS) capability Currently supported detectors The PMA2100 family currently includes a variety of detectors for such parameters as: (For a complete list of detectors see www.solarlight.com/products/detectors.html) • • • • • • • • • • UVA radiation UVB biologically effective UV radiation UVC germicidal radiation Visible light (photopic and scotopic) Full spectrum pyranometer UV safety Biliruben phototherapy PAR photosynthetically active radiation Laser power Temperature/Humidity Solar Light Co., Inc. 7 The PMA2100 can be used in any application where an accurate measurement is required, especially if multiple quantities are measured or the enhanced functionality of the meter is desired. Potential applications include: • • • • • • • • Laboratory measurements Environmental monitoring Industrial safety UV-curing, printing and photolithography Photodermatology and photobiology Cosmetic industry, SPF testing Materials testing, light degradation studies Agriculture Any sensor producing up to 4 analog signals can be quickly and inexpensively accommodated by the PMA2100, making it attractive to sensor manufacturers who would like to offer a state of the art meter with their product. Solar Light Co., Inc. 8 Quick start While sophisticated and powerful, the PMA2100 is a user-friendly instrument allowing for simple “plug-and-play” operation. Selection of the detector A critical part of every measurement process is the sensor selection. The criteria that need to be addressed when making that decision are: • • Anticipated signal characteristics Environmental factors such as temperature range and humidity The PMA2100 family includes detectors for both indoor and permanent outdoor operation, satisfying virtually any operating environment. Measuring with PMA2100 To perform measurements with a PMA2100 the following steps should be followed: 1. Remove the PMA2100 from its carrying case 2. Power it ON by pressing the ON/OFF button. If the meter does not respond Figure 2 The PMA2100 attach the battery charger to operate from external power or charge the batteries. Refer to page 31 for battery maintenance instructions. The unit will be powered ON whenever connected to the external power supply. The PMA2100 will turn itself OFF after 3 minutes of inactivity if no detector is attached. 3. Plug the selected detector into one of the two detector inputs located on the side of the meter. The meter will indicate the connection by a beep and the display will show the measurement result. Squeeze the locking arms of the detector plug while connecting or disconnecting it. 4. If only one detector is attached the meter's display will automatically switch to the only occupied channel. If two detectors are simultaneously operating use the _ ` keys to switch between the channels. While displaying the measurement result the PMA is in a "data mode", Solar Light Co., Inc. 9 as opposed to a "setup mode" when the meter or detector setup is shown or edited. Upon power-up the PMA2100 automatically enters the "data mode". 5. In order to turn the PMA2100 OFF, return to the "display mode" and press the On/Off key. If the LCD is in a mode other than "display mode", the On/Off key is inactive. To return to the "data mode", press the Start/Stop/Escape key repeatedly. If unit is connected to external power, it will remain powered up and an On/Off will have no effect. Refer to "Controls and indicators" on page 10 for detailed description of the PMA2100 "data mode" display. Solar Light Co., Inc. 10 Controls and indicators Solar Light Co., Inc. Display PMA2100 The graphical Liquid Crystal Display (LCD) of the PMA2100 offers great flexibility of the data presentation. It shows the measurement results and allows easy setup of the meter via a series of menus. S/N:07587 When the meter is turned ON, it displays a start-up screen (Figure 3) while performing the hardware test. The model number, version number and the serial number of the meter are briefly displayed. Ver:1.19 Figure 3 Start-up screen of the PMA2100 meter. Then, the display goes into the "data mode". If at least one Dose and value alarm indicators Hold indicator Low, high and average values Instantaneous reading Integrated dose Data storage interval in minutes Low pass digital filter indicator W H S015 F UVA L0.123 D H1.245 1.234 Σ2.354 J/cm2 UNITS Battery charging indicator Detector name ! V! C X A0.948 mW/cm2 41 m 23 s PRINT Function key indicators Figure 4 Display in the "data mode" with a detector connected. SETUP Selected units Time of integration Solar Light Co., Inc. 11 detector is attached, the measurement results are shown (Figure 4). Otherwise the screen indicates that there is no detector connected (Figure 5). The complete contents of the LCD are described in Figure 4 (referred to several times in the following pages). The two arrows in the top left and right corners indicate the currently selected detector. Pressing the _ ` keys changes the selection. The HOLD indicator is activated by pressing the HOLD key. When highlighted, the contents of the display are frozen; however, the measurements and data logging, dose integration or min/max/avg (if enabled) will continue in the background. Pressing the HOLD key again reactivates the continuous data display. W NODET Figure 5 Display in the "data mode" with no detector connected. Data storage interval indicator displays the interval, in minutes for automatic data logging for the currently selected detector. If not displayed, then data logging is not enabled for the currently selected sensor. The data-logging interval can be set independently for each detector. See "Automatic data logging" on page 15 for further details about setting the interval. The interval is stored in the detector, and will be restored the next time it is connected to the PMA2100. The low pass digital filter can be turned on to reduce the fluctuations of a noisy signal. This feature can be activated independently for each detector and is preserved in the internal detector's memory. Refer to "Low pass digital filter" on page 15 for further details. Dose and high value alarm indicators show whether the alarms are activated. The alarm thresholds are set independently for each detector and stored in the detector's memory. They are restored the next time the detector is connected. When the instantaneous signal level exceeds the value alarm setting then an audible and visual signal is generated. The dose alarm is triggered by the integrated dose value. See "Alarms" on page 17 for further information. The battery charging indicator displays “C” when the battery is charged and “B” when the battery is low. Refer to "Battery charging" on page 31 for further details about battery maintenance. The Low, High and Average tracking can be initiated by pressing the Min/Max key. The same key clears the setting. The tracking of extremes starts from the moment the feature is activated. To re-start the tracking, turn the feature OFF and then back ON by pressing the Min/Max key twice. The instantaneous reading is displayed in a large font for improved readability. The MED/Hr F1 uW/cm2 F1 Time/MED F1 Figure 6 Pressing the F1 function key converts the measurement result into one of the available unit systems. UVB detector display units shown. Solar Light Co., Inc. 12 currently selected units are displayed to the right of the measurement result. If alternative units are available, then the UNITS indicator appears above the F1 function key indicator. By pressing the F1 key the measurement result will be converted to alternative units. There can be more than two unit systems. They can be selected by pressing the F1 repeatedly. After the last unit selection is reached, pressing the F1 key will bring the display back to the initial unit selection. If the measured quantity can be integrated over time, then integration can be initiated by pressing the Start/Stop key. The integrated value and a corresponding time of the integration are displayed in the space below the instantaneous measurement value (Figure 4). During integration the clock icon, shown next to the time integration, will indicate integration in process. The integration is stopped by pressing the Start/Stop key again. The integration timer and the dose display freeze but the information is displayed on the LCD until the Start/Stop key is pressed again. When restarted, the integrated value and the time will be reset to zero. If data logging has been enabled, pressing the Start/Stop key will affect the value stored for the next logged data point. The average value is logged when the dose integration is activated. Instantaneous values are stored otherwise. The assignment of the function keys, F1-F3, can change dynamically depending on the mode of operation. The indicators displayed along the bottom of the LCD describe the function of the keys. If the key indicator is blank, then the key has no assigned function. Keypad The keys of the PMA2100 (Figure 7) have a tactile feel and an audible signal is generated when the key is pressed. The On/Off key toggles the power to the meter. It is only active in the display mode. F1 Hold The Start/Stop button enables the dose integration. The integrated dose and a corresponding time of the integration are displayed in the space shown below the instantaneous measurement result (Figure 4). The Start/Stop key works also as an Escape key in menu and setup mode. In general, it reverts to the previous menu level or leaves the "menu mode" and enters the "display mode". The Menu/Enter key transfers control to the "menu mode" allowing for the meter setup. Settings for LCD contrast, line frequency rejection, or real time clock can be altered in that mode. Refer to "Meter setup" on page 14 for further details. F2 F3 Min/Max INCR DECR Start/Stop Menu Escape Enter On/Off Figure 7 Keypad configuration of the PMA2100 Solar Light Co., Inc. 13 The _ ` keys allow for the selection of the displayed channel while in the "display mode". In "edit mode" (when a numerical value is changed), these keys select the digit to be changed. When a menu is shown the _ ` keys allow navigation through menu list. The bc keys allow navigation through a list of menu items and decrement/increment the selected digit allowing a numerical value to be edited. They are inactive in the "display mode". Pressing the HOLD key freezes the information on the LCD without affecting the measurement and data collection process. An “H” will be displayed in the upper left-hand corner. While in the “hold mode” pressing HOLD reactivates display updating. The Min/Max key initiates the Low, High and Average tracking. The same key clears the setting. The tracking of extremes starts from the moment the feature is activated. To re-start the tracking turn the feature OFF and then back ON by pressing the Min/Max key twice (See "Display" on page 10). High, low and average values will be reset to zero on restart of the Min/Max function. Audible signals Certain conditions cause the generation of an audible signal to attract the attention of the user. The conditions generating an audible signal are listed in Table 1. Table 1 Conditions causing a generation of an audible signal. Power on Activation of any key Acceptance of an newly connected detector Detector disconnected Activation of a value or dose alarm 1 long beep 1 short beep 1 short beep 3 short beeps 5 short beeps Error messages When an erroneous condition is detected by the PMA2100 an error number and a brief message are displayed to indicate the nature of the problem. Table 2 Error codes and messages Code 01 Message on LCD Detector conflict 02 Upgrade software 03 Out of calibration Description of the problem Some detectors use all 4 analog inputs available in the PMA2100 and cannot be used simultaneously with other detectors. This message will appear when 2 incompatible detectors are connected to the PMA2100. The detector requires higher version of the software controlling the PMA2100. This message is displayed immediately after the new detector is connected. Contact the manufacturer for upgrade. The detector is due for calibration. The detector should be returned to manufacturer for re-calibration. Various detectors have different calibration intervals, depending on their inherent long-term stability. Solar Light Co., Inc. 14 Setup Meter setup The "meter setup mode" is accessed from the "display mode" by pressing the MENU key. To return back to the "display mode", the Escape key should be pressed. Meter setup allows for adjustments specific to the meter; the contrast of the LCD, the line rejection frequency and the real time clock. The settings of measurement parameters are available through the Detector Setup menu (see page 15), since they are specific for a particular detector. LCD contrast The contrast of the LCD changes with the ambient temperature. To assure a legible display the contrast can be adjusted for best visibility. To change the LCD contrast, follow these steps: 1. 2. 3. 4. Press the Menu/Enter key to enter the "menu mode" Select the Contr: X item on the menu pressing b or c keys. Keep pressing the Menu/Enter key until optimal contrast of the LCD is selected. Press the Escape key to return to the "display mode" Line frequency rejection The PMA2100 has an ability to discriminate against the 50 or 60 Hz interference from power lines. To achieve the best performance, the local line frequency must be set manually. To set the line frequency, follow these steps: 1. 2. 3. 4. Press the Menu/Enter key to enter the "menu mode" Select the Line: XXHz item on the menu pressing b or c keys. Press the Menu/Enter key until appropriate frequency is selected. Press the Escape key to return to the "display mode" Real time clock and calendar The real time clock and calendar provides the information for time-stamping of the recorded data. To set the real time clock, follow these steps: 1. 2. 3. Press the Menu/Enter key to enter the "menu mode" Select the Clock... item on the menu pressing b or c keys. Press the Menu/Enter key to start the time setting procedure. The LCD will show the current date and time. The item selected for modification is listed by the bc icon, such as in this example: bc change month. Press the b or c key to decrement or increment the selected Solar Light Co., Inc. 4. 5. 15 item. When this item is properly set use the _ ` to select next item for editing. The items available are: year, month, day, hour, minutes, seconds. When the date and time is properly set, press either Enter or Escape key to leave the time setting menu. Press the Escape key to return to the "display mode" Detector Setup The detectors are equipped with a non-volatile memory to store configuration information specific to a particular detector. When the detector is connected, these configuration parameters are read from the detector and used to set up the PMA. Among the parameters stored are userconfigurable settings such as: low pass filter ON/OFF, data logging parameters, scale and offset values, alarm settings and operating mode. Low pass digital filter The low pass digital filter is used to reduce the fluctuations of a noisy signal. Due to its averaging nature it will smooth the signal and allow the measurement of the average. To change the setting of the low pass filtering follow these steps: 1. 2. 3. 4. 5. Select the detector to be set up with _ ` keys if two detectors are attached. Press the SETUP key to enter the "detector setup mode". The SETUP key is one of the function keys annotated by the word SETUP on the LCD. A menu of available settings will be presented on the LCD. The SETUP annotation only appears when the detector is attached. Use the bc keys to select the Fltr:XXX item. The XXX will indicate either ON or OFF. Press the Menu/Enter key to set the status of the digital filter to a desired state. Press the Escape key to return to the display mode. At this time the current setup of the detector is written to the detector's memory. Skipping this step or disconnecting the detector beforehand is equivalent to ignoring the changes made. Automatic data logging The PMA2100 is capable of storing the measurement data either in manual or automatic mode. Refer to "Data logging" on page 20 for more information about data logging. In the automatic mode one record of data is logged in memory per user-selected interval, ranging from 1 minute to 2 hours. If two sensors are attached at the same time, the data-logging interval can be set independently for each. To initiate the automatic data logging, follow these steps: 1. 2. Select the detector to be set up with _ ` keys if two are attached. Press the SETUP key to enter the "detector setup mode". The SETUP key is one of the function keys annotated by the word SETUP on the LCD. A menu of available settings will be presented on the LCD. Solar Light Co., Inc. 16 3. 4. 5. 6. 7. Use the bc keys to select the Sav:XXm item. The XX represents the currently selected interval in minutes. If automatic data logging is not activated then Sav:0m (zero) will be shown. Press the Menu/Enter key to enter the logging interval selection menu. The currently set interval is shown on the header of the menu. Use the b c _ ` keys to navigate through the list of valid intervals and to select the desired one. Select NONE to disable data logging. Press Menu/Enter to accept the selected interval. The LCD will revert back to the "detector setup menu". Press the Escape key to return to the display mode. At this time the updated logging configuration parameters are written to the detector's memory. Skipping this step or disconnecting the detector beforehand is equivalent to ignoring the changes made. Scale An additional user-preset scale factor can be applied to the measurement. Normally the scale factor is set to 1.00 to accept the factory calibrated scale factor of the detector. To change the scale factor follow these steps: 1. 2. 3. 4. 5. 6. 7. Select the detector to be set up with _ ` keys if two are attached. Press the SETUP key to enter the "detector setup mode". The SETUP key is one of the function keys annotated by the word SETUP on the LCD. A menu of available settings will be presented on the LCD. Use the bc keys to select the Scal:X.XX item. The X.XX represents the currently set scale factor, typically 1.00. Press the Menu/Enter key to enter the scale editing mode. The name of the currently selected detector is shown on the LCD. Use the _ ` keys to move the cursor between the digits of the scale value. Use bc keys to increment or decrement the selected digit. If the cursor is placed underneath the sign of the number then pressing the bc keys will toggle the sign between + and -. Press Menu/Enter to accept the new scale value. The LCD will revert back to the "detector setup menu". Press the Escape key to return to the display mode. At this time the updated scale factor for the detector is written to the detector's memory. Skipping this step or disconnecting the detector beforehand is equivalent to ignoring the changes made. Offset The measurement made by the PMA2100 can be offset by a user-entered value in order to compensate for the drifts in the detector or to compensate for a background signal. The offset setting is unit-sensitive, i.e. it takes the unit conversions into account and converts the offset values accordingly. To modify the offset follow these steps: 1. Select the detector to be set up with _ ` keys if two are attached. Solar Light Co., Inc. 2. 3. 4. 5. 6. 7. 17 Press the SETUP key to enter the "detector setup mode". The SETUP key is one of the function keys annotated by the word SETUP on the LCD. A menu of available settings will be presented on the LCD. The SETUP annotation only appears when the detector is attached. Use the bc keys to select the Ofs:X.XXX item. The X.XXX represents the currently set offset, typically 0.000. Press the Menu/Enter key to enter the offset editing mode. The name of the currently selected detector is shown on the LCD. Use the _ ` keys to move the cursor between the digits of the offset value. Use bc keys to increment or decrement the selected digit. If the cursor is placed underneath the sign of the number then pressing the bc keys will toggle the sign between + and -. Press Menu/Enter to accept the new offset value. The LCD will revert back to the "detector setup menu". Press the Escape key to return to the display mode. At this time the updated offset of the detector is written to the detector's memory. Skipping this step or disconnecting the detector beforehand is equivalent to ignoring the changes made. Alarms The PMA2100 can generate an acoustic and visual alarm whenever the value of the measured quantity or the accumulated dose exceeds the preset threshold. The thresholds for "value alarm" and the "dose alarm" are set independently. The two alarms can also be independently enabled or disabled. 10 200 Measured value 8 160 Value alarm threshold 6 120 4 Dose alarm threshold Dose alarm generated 2 0 40 0 Time Value Figure 8 Generation of value and dose alarms. 80 Dose Accumulated dose Value alarm generated Value alarm generated Solar Light Co., Inc. 18 Figure 8 illustrates the conditions in which the alarms are generated. Each time the measured value crosses over the value alarm threshold the value alarm is generated. Since the accumulated dose cannot decrease, the dose alarm is generated only once in each integration cycle, unless the dose threshold was increased during that cycle. The alarm is indicated by a series of 5 short beeps and an alarm message appears on the screen with an arrow pointing to the detector port that triggered the alarm. In addition, the alarm system generates a pulse on the digital output (See " Digital control lines" on page 27). The status (ON or OFF) and threshold of both value and dose alarm are preserved in the detector's memory and automatically applied when the detector is connected to the PMA2100. To view or modify the alarm settings, follow these steps: 1. 2. 3. 4. 5. 6. 7. 8. 9. Select the detector to be set up with _ ` keys if two are attached. Press the SETUP key to enter the "detector setup mode". The SETUP key is one of the function keys annotated by the word SETUP on the LCD. A menu of available settings will be presented on the LCD. The SETUP annotation only appears when the detector is attached. Use the bc_ ` keys to select the Alrm... item. Press the Menu/Enter key to enter the alarmediting mode. The name of the currently selected UVBIO ALARMS detector is shown on the top of the LCD and the Value alarm: ON settings of the alarms are displayed as shown in 2 @ 5.500 uW/cm Figure 9. One item is marked as currently selected by a frame Dose alarm: OFF 2 around it. If change in settings is needed, then use @ 20.000 mJ/cm the bc keys to select the item to modify. If the ON/OFF status of the alarm needs to be changed, simply press the Menu/Enter key. It Figure 9 Example of alarm settings displayed on the PMS2100's LCD for a toggles the ON/OFF setting. detector identified as "UVBIO". If a threshold value must be changed, then press the Menu/Enter key in order to enter the number editing mode. Use the _ ` keys to move the cursor between the digits of the threshold value. Use bc keys to increment or decrement the selected digit. If the cursor is placed underneath the sign of the number, then pressing the bc keys will toggle the sign between + and -. Press Menu/Enter to accept the new threshold value. The LCD will revert back to the alarm settings. Press the Escape key twice to return to the display mode. At this time, the updated alarm settings of the detector are written to the detector's memory. Skipping this step or disconnecting the detector beforehand is equivalent to ignoring the changes made. Solar Light Co., Inc. 19 Mode of operation Starting with Version 1.13 of the PMA2100 the Mode setting was introduced that toggles between 2 possible values: Meter and DCS (Dose Control System). The Meter mode is the primary mode of operation and all information in this manual is related to this mode. In the DCS mode the PMA2100 is configured to control the Solar Simulators manufactured by Solar Light Company. Solar Light Co., Inc. 20 Data management Data logging The data measurement results can be logged (stored) in the PMA2100's non-volatile memory either in automatic or manual mode. In automatic mode, the data record is logged in user-selectable intervals. The storage interval for each detector can be set independently. Refer to "Automatic data logging " on page 15 for information about setting the data storage interval. When data logging is enabled the symbol “SXXX” will be displayed in the upper left hand corner of the LCD display, with XXX indicating the number of minutes between samples. In the manual mode, one record of data is logged each time the PRINT key is pressed. Only the data record for the currently selected detector is stored and printed. The detector selection can be changed using the _ and ` keys while in the display mode. The data record is then simultaneously Table 3 Data buffer capacity of 1024 records saved in memory and transmitted via the serial translated into recording duration for a single port. A printer or a computer attached to the serial detector. port can print or capture the data on-line. The manual data logging can also be used at the same Data storage Max data time automatic mode is activated. interval [minutes] record length 1 17 hours 5 3.5 days 10 7.1 days 15 10.7 days 30 21.3 days 60 42.7 days 120 85.4 days The PMA2100 is capable of logging up to 1,024 data records. Table 3 illustrates how the logging interval translates to the maximum recording time for a single detector. After the data buffer is filled, the new records will start overwriting the oldest records in memory. Logged data is preserved when the PMA is powered down or if the battery runs down since the memory is non-volatile. If data from two sensors are being logged, maximum recording length will be 1/2 that shown in Table 3. If the INTEGRATION mode is active, the PMA will store the average value of the data over the period since the last data point was logged. The average is based on 1-second samples of the signals. Pressing the PRINT key will store the average value calculated up to the point the key was pressed. In both cases the data value averaging will begin again after the point is logged and will represent the period between logged samples only. If INTEGRATION is not activated then instantaneous values are stored. Solar Light Co., Inc. 21 Along with the measurement result the following information is stored: • • • • • • • Date and time Type of detector Serial number of detector Units used during the measurement User pre-set scale factor Detector setup flags Detector calibration due-date NOTE: If the integration mode is active, the PMA stores the average value over the period since the last data point was logged. Otherwise the instantaneous value is logged. Downloading the data The data stored in the non-volatile memory can be downloaded to a computer via a serial communication port (RS232). To download the data from the PMA2100 follow these steps: 1. 2. 3. 4. 5. 6. Connect the PMA2100 to an available serial port on the computer using the cable provided with the meter. Turn the PMA2100 ON. Start the communication software on your computer, such as Procomm or Windows Terminal. Set the communication parameters of the appropriate serial port to: 2400,N,8,1. Set the communications program to the ANSI Terminal Emulation mode. To start the download of the data, press the P key on the computer's keyboard. The data will be transmitted in a standard text format. To stop the transmission, press the C key. The first line of data will contain the serial number of the PMA and the number of logged data points. The end of data will be indicated by a line containing END. If the data is to be stored on your PC’s hard drive, activate the data capture feature of your communication software before starting the data transfer. For example, in Procomm press the Alt-F1 combination and enter the filename in the pop-up window. Refer to the manual of your communication program for detailed instructions about capturing the incoming data. After the data are stored on the disk, the data buffer may be cleared. Otherwise, the new data will be appended to the end of the previously recorded data, which will also be included in the next downloading. To clear the data buffer follow these steps: 1. While connected to the PMA2100 via a serial port, press the Ctrl-C key combination (hold the Ctrl key and press C). Solar Light Co., Inc. 22 2. The PMA2100 responds with the following message: Clear data? (Y/N): Pressing Y in response clears the contents of the entire data buffer. Any other response preserves the data. Clearing the data buffer will ensure that only new data points will be downloaded the next time data is retrieved from the PMA. The data are downloaded in a text format following the template shown in Table 4. Table 4 Format of the data downloaded from PMA2100 Detector type Serial number Record date Record time Recorded value Units Scale factor Flags Calibration due-date Table 5 Example of data file downloaded from the PMA2100 SN:07587 Rec#0002 31,"02245"," 2.06.2005","14:00:00", 48.5,"lux ", 1.000,000,"23.04.2006" 31,"02245"," 2.06.2005","14:20:00", 56.5,"lux ", 1.000,000,"23.04.2006" END. The fields are separated by commas. The non-numerical values, such as serial number, date, time, and units are enclosed in quotes to comply with the commonly used Comma and quote Separated Format. Table 6 contains detailed description of the individual fields of the data record. Refer to "Data processing" chapter below for additional information about importing and processing the data. Data processing The data downloaded from the PMA2100 can be imported into any commercial spreadsheet or data processing package supporting the import of data in Comma and " Separated Format. As an example the steps necessary to import a PMA2100 file into a Microsoft Excel 2003 worksheet are listed: 1. 2. 3. 4. 5. 6. Download the data from the PMA2100 and save in a file called PMA.TXT In Excel, place the cursor on an empty page in a cell where you want the data block to begin From the menu select Data then Import External Data then Import Data… In the file selection box, select the file with the data, in this example PMA.TXT In the Text Import Wizard Step #1 select Delimited then click Next In Step #2 select Comma as the delimiter and “ as the Text qualifier then click Finish Solar Light Co., Inc. 23 The data is imported into the spreadsheet and can be manipulated with the various tools built into the software. A macro can be created in most spreadsheet programs to automate the import of downloaded data. Table 6 Description of the data record format Field Contents Type Detector type The last two digits of the detector type. For example the detector PMA2131 has the type code 31. Numerical Serial number The string containing the serial number of the detector Enclosed in "" Record date The date stamp of the measurement. The date is formatted as follows: dd.mm.yyyy where: dd = day, mm = month, yyyy = year Enclosed in "" Record time The time stamp of the measurement. The time is formatted as follows: hh:mm:ss where: hh = hours, mm = minutes, ss = seconds Enclosed in "" Recorded value The measurement result Numerical Units Units used for measurement result Enclosed in "" Scale factor The scale factor effective during measurement. See "Scale" on page 16 for additional information. Numerical Flags Decimal representation of the detector setup flags: 1 - low pass filter active (see page 15) 2 - dose integration active (average is stored) 4 - value alarm active (see p. 17) 8 - dose alarm active (see p. 17) 16- DCS on/off 32 – DCS fixed time on/off The flag codes are additive, so if low pass filter is active together with dose integration the value of flags is (1 + 2) = 3 . Numerical Calibration due-date The date the detector is/was due for calibration. The date is formatted as follows: dd.mm.yyyy where: dd = day, mm = month, yyyy = year Enclosed in "" 24 Solar Light Co., Inc. Interfaces Detector interface The PMA2100 detector interface provides connections for the detector's analog signals, the power for the detector and the digital interface for the detector's memory. Each of the two PMA2100 detector interfaces (ports) provides 2 independent analog inputs, designated Input0 and Input1. Moreover, the two inputs are available directly as well as through a 1:10 resistive divider to accommodate larger signals. The direct inputs accept signals in a range of -0.4V to +0.4V. The dividers extend that View from the back of the plug (the cable end) range 10-fold. Table 7 provides detailed 2 4 6 8 10 12 14 functional description of the individual pins. The inputs of the other port are also available on the pins of each detector interface in order to handle detectors 1 3 5 7 9 11 13 generating more than 2 voltages. Both the Figure 10 Detector input pin assignment. direct and divided inputs of the other channel are available. If a detector uses more than two analog inputs, then only one detector at a time can be connected to the PMA2100. The detector's memory has an indication of the inputs used by the detector so the PMA2100 can generate a warning, should a conflict occur. See "Error messages" on page 13 for further details. Solar Light Co., Inc. 25 Table 7 PMA2100 detector interface configuration (both ports have the same configuration) Pin Number 1 2 3 4 5 6 7 Signal description Specifications Analog input 2 - high level (1:10 divider) Analog input 1 - low level Analog input 2 - low level Analog input 1 - high level (1:10 divider) Analog ground ±4V full scale, 300kΩ impedance, ESD protected ±0.4V full scale, 29.1 kΩ impedance, ESD protected ±0.4V full scale, 29.1 kΩ impedance, ESD protected ±4V full scale, 300kΩ impedance, ESD protected Internally connected to power/digital ground - do not connect to power GND inside the detector --- As above --±4V full scale, 300kΩ impedance, ESD protected 11 Analog ground Other detector’s analog input 2 - high level (1:10 divider) Other detector’s analog input 1 - low level Other detector’s analog input 2 - low level Other detector’s analog input 1 - high level (1:10 divider) -5V power 12 +5V power 13 Power and digital ground (connected to shield inside the PMA2100 meter) Digital I/O (connected to memory capsule) Power and digital ground (connected to pin 13 inside the PMA2100 meter) 8 9 10 14 SHIELD ±0.4V full scale, 29.1 kΩ impedance, ESD protected ±0.4V full scale, 29.1 kΩ impedance, ESD protected ±4V full scale, 300kΩ impedance, ESD protected 5mA max., 80Ω internal resistance, short circuit protected 20mA max., 22Ω internal resistance, short circuit protected ESD protected Solar Light Co., Inc. 26 Serial and extension port The PMA2100 is equipped with a RS232C serial port allowing communication with a computer or a serial printer. The serial communication lines, along with other analog and digital signals, available on the 25 pin female D-connector located on the bottom of the meter. To connect the PMA2100 to the IBM-PC compatible computer, a standard AT modem cable can be used in place of the one that is provided with the meter. The baud rate of the serial port is preset at 2400bps, allowing for cable lengths up to 20ft. Due to the power-saving features built into the PMA2100, the serial port's transmitter operates properly only if there is no incoming transmission, i.e. the receiving line must be in a negative (marking) state. The PMA2100's receiver works properly all the time. Table 8 Serial communication and extension port connector Pin Number 2 Signal description Specifications RxD - Data input 3 TxD - Data output 4 DCD - Data Carrier Detect Input GROUND ANA2 AGND ANA1 Switching threshold approx. 1.5V, with 0.5V hysteresis; accepts standard RS232C levels High state: +5V Low state: equal to the RxD's low level RS232C levels 7 12 24 25 Digital ground Analog signal from right detector input Analog ground Analog signal from left detector input The PMA2100 can be controlled from a remote computer via an external modem. The modem connected to the PMA2100 should be set to auto-answer in order to pick-up the incoming calls automatically. The modem's result codes should be disabled also. For modems supporting the Hayes AT commands the following programming sequence is adequate: AT&D0Q1E0S0=2&C1&W0&Y0 This sequence should be transmitted to the modem from a PC before this modem is connected to the PMA2100. Only the remote modem picking up the calls to the PMA2100 has to be set up in this way. The PMA2100 is not able to dial the telephone number so the calls cannot originate from the PMA2100. Table 9 shows the cable connections between the PMA2100 and the modem. Solar Light Co., Inc. 27 Table 9 PMA2100 to modem connection PMA DB25 connector Pin number Signal 2 RxD 3 TxD 7 GND Modem DB25 connector Pin number Signal 3 TxD 2 RxD 7 GND Digital control lines The digital control lines of the PMA2100 can be used to control an external device, such as a relay or valve, acting as a closed loop feedback system or as a dose controller. An example application is the monitoring and control of greenhouse temperature and the amount of light. The PMA2100's digital control lines provide 2 optically coupled inputs and 2 optically coupled outputs designed to connect with control equipment. The pins of the digital control lines are available on the 25-pin connector, which also accommodates the pins of the serial port. The outputs DIGO1 and DIGO2 are controlled by the alarm system of detector port 1 and 2 respectively. The optically isolated output is normally open (high impedance) indicated as high state in Figure 11. The output goes low (impedance of about 3kΩ) when the value alarm is ON and the preset threshold is exceeded. The output is set high when the signal goes back below this threshold. A short pulse (10µs<t<100µs) is generated when the dose integration is started, either by pressing a) threshold value exceeded high (open) low (closed) b) Start pulse Dose reached high (open) low (closed) 10us<t<100us 50ms<t<200ms Figure 11 Digital output control: a) from the value alarm system b) from the dose alarm system Solar Light Co., Inc. 28 Figure 12 Digital, optically coupled outputs Figure 13 Digital, optically coupled inputs the START/STOP button or by a pulse on the digital input. A longer pulse (50ms<t<200ms) is generated if the dose alarm is ON and the preset dose limit is reached or the integration is terminated by either pressing the START/STOP key or applying a pulse (>200ms) to a corresponding digital input. If both the value and dose alarms are activated, then the value alarm takes precedence over the a) Digital input high (+4V min) dose integration started dose integration stopped low (0) b) Digital output Start pulse generated at the output Stop pulse generated high (open) low (closed) 10us<t<100us Figure 14 Starting dose collection from the digital input. 50ms<t<200ms Solar Light Co., Inc. 29 dose alarm, i.e. the digital output will be held low as long as the value threshold is exceeded. The optically insulated inputs DIGI1 and DIGI2 control the dose collection on detector port 1 and 2 respectively. A positive pulse at least 200ms long toggles the dose integration. The minimum pulse amplitude is 4V. Similarly, the start and stop of dose integration are flagged at the corresponding digital output (Figure 14). Solar Light Co., Inc. 30 Technical specifications Detector inputs 2 detector inputs with up to 2 analog signals each or 1 detector with up to 4 signals Input ranges ±0.4V, ±4V, auto ranging Resolution 15uV (±0.4V range) Dynamic range >2x10⁵ Accuracy 0.2% FS all ranges Non-linearity Max. 0.02%FS within each range Temperature coefficient Max. 50 ppm/°C Sampling rate 1sec (each input is measured once per second) Data storage interval 1 minute to 2 hours (either instantaneous values or averages over the storage interval) Operating temperature 0 to 50 °C (non condensing) Power consumption Approx. 80 mW Batteries 4xAA rechargeable NiCd or Alkaline batteries Battery life >24 hours for NiCd External power 9-12V AC or DC adapter, 300mA min Weight 18 oz (510 grams) Size 4"W x 7.6"H x 1.75"D (10 x 19.5 x 4.5 cm) Solar Light Co., Inc. 31 Maintenance and troubleshooting Meter calibration Both the PMA2100 meter and the detectors must be calibrated to assure accurate measurements. The analog inputs of the PMA2100 are initially calibrated with an accuracy of 0.2% and the calibration factors are stored in its internal memory. The internal real time clock is accurate to within 1minute/month. Since there are no mechanically adjustable components in the meter, its calibration is extremely stable. Nonetheless, the calibration should be periodically checked. The recommended calibration interval is one year. The calibration is done in a computerized tester and must be performed by the manufacturer or by an authorized laboratory. Please contact Solar Light Company for further information. The calibration of the detectors is independent from the meter's calibration. The detector calibration accuracy depends on the type of detector. It should be performed at least on a yearly basis. The calibration can be performed by the manufacturer or by an authorized laboratory. Battery charging The PMA2100 meter can operate directly from the AC line or from either rechargeable NiCd or non-rechargeable alkaline batteries. The battery compartment holds four AA size cells each with a nominal voltage of 1.2 or 1.5 volts. The polarity of the batteries inserted into the battery holder should be observed. Battery charging indicator NOTE: The NiCd batteries should be fully charged before first use. Never attempt to charge alkaline batteries. To charge the NiCd batteries, an external 9V DC power adapter must be connected with a current capacity of at least 300mA. The charge controller built into the PMA2100 assures that the batteries are not overcharged. During the charging cycle, a letter C is shown in the battery indicator position. It disappears when the battery reaches full charge. It takes approximately 6 hours to fully charge the NiCd batteries. When the battery charge is low, a letter B appears. Only a few minutes of operation are available after the B indicator is activated. W H S015 F UVA L0.123 H1.245 1.234 Σ 2.354 J/cm UNITS D ! V! C X A0.948 2 mW/cm 2 PRINT 41 m 23 s SETUP Figure 15 Battery charging indicator. Typically, fully charged NiCd batteries will support operation of the PMA2100 for more than 24 hours. 32 Solar Light Co., Inc. Table of figures Figure 1 Architecture of the PMA2100 ________________________________________________ 5 Figure 2 The PMA2100 ____________________________________________________________ 8 Figure 3 Start-up screen of the PMA2100 meter.________________________________________ 10 Figure 4 Display in the "data mode" with a detector connected. ____________________________ 10 Figure 5 Display in the "data mode" with no detector connected. ___________________________ 11 Figure 6 Pressing the F1 function key converts the measurement result into one of the available unit systems. UVB detector display units shown. ________________________________________ 11 Figure 7 Keypad configuration of the PMA2100 ________________________________________ 12 Figure 8 Generation of value and dose alarms. _________________________________________ 17 Figure 9 Example of alarm settings displayed on the PMS2100's LCD for a detector identified as "UVBIO". __________________________________________________________________ 18 Figure 10 Detector input pin assignment. _____________________________________________ 24 Figure 11 Digital output control: a) from the value alarm system b) from the dose alarm system _ 27 Figure 12 Digital, optically coupled outputs ___________________________________________ 28 Figure 13 Digital, optically coupled inputs ____________________________________________ 28 Figure 14 Starting dose collection from the digital input. _________________________________ 28 Figure 15 Battery charging indicator. ________________________________________________ 31 Solar Light Co., Inc. 33 Index Alarms, 17 digital output, 27 Applications, 7 Audible signals, 13 Averaging, 11 Battery charging, 11, 31 Calendar, 14 Calibration, 31 Clearing the data, 21 Clock, 14 Communication, 21 Computer interface, 21 Contrast, 14 Controls, 9, 10 Data buffer, 20 buffer capacity, 20 clearing, 21 downloading, 21 format, 22 importing, 22 logging, 11, 15, 20 management, 20 processing, 22 storage, 15 Data mode, 8, 10 Decrementing numbers, 13 Detector interface, 24 detectors, 8 inputs, 8 selection, 8 switching, 8 Detectors, 6 connecting, 8 setup, 5, 11, 14, 15 Diagnostic, 10 Digital control lines, 27 Digital filter, 15 Display, 10 structure, 11 Dose, 6, 11 Downloading, 21 Edit mode, 13 Filter, 11, 15 Function keys, 12 HOLD, 11, 13 Importing data, 22 Incrementing numbers, 13 Indicators, 10 Integration, 6, 11, 12, 20 Interfaces, 24 Keypad, 12 LCD contrast, 14 Line rejection, 14 Logging data, 15 Low pass filter, 11, 15 Maintenance, 31 Menu/Enter, 12 Min/Max tracking, 11 Model number, 10 Modem connection, 26 Offset, 16 On/Off, 9 PMA2100 Applications, 7 Solar Light Co., Inc. 34 design concept, 5 detectors, 6 features, 6 measuring with, 8 setup, 12, 14 PRINT, 20 Real time clock, 14 Scale factor, 16 Serial number, 10 Serial port, 21, 26 cable, 26 setup, 21 Setup, 12 Setup mode, 9 Start/Stop, 12 Technical specifications, 30 Time, 14 Tracking min. and max., 6, 13 Tracking min/max, 11 Troubleshooting, 31 Units, 6, 12 conversion, 12