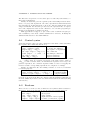
1
MIMOSA user’s manual
(Draft version 1.4.0)
Jean-Pierre Müller1
CIRAD-ES-GREEN
[email protected]
November 11, 2012
1
Associated researcher to LIRMM
Contents
1 Introduction
1.1 News . . . . . . . . . . . . . . . . . . . . . . . . . . . . . . . . . .
6
7
2 Running Mimosa
2.1 Downloading Mimosa
2.2 Launching Mimosa . .
2.3 The menus . . . . . .
2.4 The editor windows .
2.5 The scheduler window
2.6 The project window .
2.7 The files . . . . . . . .
.
.
.
.
.
.
.
.
.
.
.
.
.
.
.
.
.
.
.
.
.
.
.
.
.
.
.
.
.
.
.
.
.
.
.
.
.
.
.
.
.
.
.
.
.
.
.
.
.
.
.
.
.
.
.
.
.
.
.
.
.
.
.
.
.
.
.
.
.
.
.
.
.
.
.
.
.
.
.
.
.
.
.
.
.
.
.
.
.
.
.
.
.
.
.
.
.
.
.
.
.
.
.
.
.
.
.
.
.
.
.
.
.
.
.
.
.
.
.
.
.
.
.
.
.
.
.
.
.
.
.
.
.
.
.
.
.
.
.
.
.
.
.
.
.
.
.
.
.
.
.
.
.
.
.
.
.
.
.
.
.
.
.
.
.
.
.
.
9
9
9
10
12
14
15
16
3 The
3.1
3.2
3.3
3.4
3.5
.
.
.
.
.
.
.
.
.
.
.
.
.
.
.
.
.
.
.
.
.
.
.
.
.
.
.
.
.
.
.
.
.
.
.
.
.
.
.
.
.
.
.
.
.
.
.
.
.
.
.
.
.
.
.
.
.
.
.
.
.
.
.
.
.
.
.
.
.
.
.
.
.
.
.
.
.
.
.
.
.
.
.
.
.
.
.
.
.
.
.
.
.
.
.
.
.
.
.
.
.
.
.
.
.
.
.
.
.
.
.
.
.
.
.
.
.
.
.
.
18
18
19
19
20
21
4 The conceptual model editor
4.1 The editor . . . . . . . . . .
4.2 Category edition . . . . . .
4.2.1 Drawing a category .
4.2.2 Editing a category .
4.2.3 Deleting a category .
4.3 Relation edition . . . . . . .
4.3.1 Drawing a relation .
4.3.2 Editing a relation . .
4.3.3 Deleting a relation .
.
.
.
.
.
.
.
.
.
.
.
.
.
.
.
.
.
.
.
.
.
.
.
.
.
.
.
.
.
.
.
.
.
.
.
.
.
.
.
.
.
.
.
.
.
.
.
.
.
.
.
.
.
.
.
.
.
.
.
.
.
.
.
.
.
.
.
.
.
.
.
.
.
.
.
.
.
.
.
.
.
.
.
.
.
.
.
.
.
.
.
.
.
.
.
.
.
.
.
.
.
.
.
.
.
.
.
.
.
.
.
.
.
.
.
.
.
.
.
.
.
.
.
.
.
.
.
.
.
.
.
.
.
.
.
.
.
.
.
.
.
.
.
.
.
.
.
.
.
.
.
.
.
.
.
.
.
.
.
.
.
.
.
.
.
.
.
.
.
.
.
.
.
.
.
.
.
.
.
.
.
.
.
.
.
.
.
.
.
23
23
24
24
25
25
26
26
27
28
5 The behavior
5.1 Introduction . . . . . . . .
5.2 The operational semantics
5.2.1 The model . . . .
5.2.2 The ports . . . . .
5.2.3 The influences . .
5.2.4 The probes . . . .
5.2.5 The time . . . . .
.
.
.
.
.
.
.
.
.
.
.
.
.
.
.
.
.
.
.
.
.
.
.
.
.
.
.
.
.
.
.
.
.
.
.
.
.
.
.
.
.
.
.
.
.
.
.
.
.
.
.
.
.
.
.
.
.
.
.
.
.
.
.
.
.
.
.
.
.
.
.
.
.
.
.
.
.
.
.
.
.
.
.
.
.
.
.
.
.
.
.
.
.
.
.
.
.
.
.
.
.
.
.
.
.
.
.
.
.
.
.
.
.
.
.
.
.
.
.
.
.
.
.
.
.
.
.
.
.
.
.
.
.
.
.
.
.
.
.
.
.
.
.
.
.
.
.
29
29
30
31
33
33
34
34
ontologies
Individuals
Links . . . .
Attributes .
Categories .
Relations .
.
.
.
.
.
.
.
.
.
.
.
.
.
.
.
.
.
.
.
.
.
.
.
.
.
.
.
.
.
.
.
.
.
.
.
.
.
1
2
CONTENTS
5.3
The behavior specification . . . . .
5.3.1 Programmatic specification
5.3.2 Scripted specification . . . .
5.3.3 State charts . . . . . . . . .
5.3.4 Further extensions . . . . .
.
.
.
.
.
.
.
.
.
.
.
.
.
.
.
.
.
.
.
.
.
.
.
.
.
.
.
.
.
.
.
.
.
.
.
.
.
.
.
.
.
.
.
.
.
.
.
.
.
.
.
.
.
.
.
.
.
.
.
.
.
.
.
.
.
.
.
.
.
.
.
.
.
.
.
.
.
.
.
.
.
.
.
.
.
35
36
43
45
45
6 The concrete model editor
6.1 Individual edition . . . . . . . . . .
6.1.1 Drawing an individual . . .
6.1.2 Editing an individual . . . .
6.1.3 Deleting an individual . . .
6.2 Link edition . . . . . . . . . . . . .
6.2.1 Drawing a link . . . . . . .
6.2.2 Deleting a link . . . . . . .
6.3 Output specification . . . . . . . .
6.3.1 Drawing an output . . . . .
6.3.2 Editing an output . . . . .
6.3.3 Deleting an output . . . . .
6.3.4 Drawing an output edge . .
6.3.5 Deleting an output edge . .
6.4 Control panel definition . . . . . .
6.4.1 Drawing an output view . .
6.4.2 Deleting an output view . .
6.4.3 Drawing a parameter editor
6.4.4 Deleting a parameter editor
.
.
.
.
.
.
.
.
.
.
.
.
.
.
.
.
.
.
.
.
.
.
.
.
.
.
.
.
.
.
.
.
.
.
.
.
.
.
.
.
.
.
.
.
.
.
.
.
.
.
.
.
.
.
.
.
.
.
.
.
.
.
.
.
.
.
.
.
.
.
.
.
.
.
.
.
.
.
.
.
.
.
.
.
.
.
.
.
.
.
.
.
.
.
.
.
.
.
.
.
.
.
.
.
.
.
.
.
.
.
.
.
.
.
.
.
.
.
.
.
.
.
.
.
.
.
.
.
.
.
.
.
.
.
.
.
.
.
.
.
.
.
.
.
.
.
.
.
.
.
.
.
.
.
.
.
.
.
.
.
.
.
.
.
.
.
.
.
.
.
.
.
.
.
.
.
.
.
.
.
.
.
.
.
.
.
.
.
.
.
.
.
.
.
.
.
.
.
.
.
.
.
.
.
.
.
.
.
.
.
.
.
.
.
.
.
.
.
.
.
.
.
.
.
.
.
.
.
.
.
.
.
.
.
.
.
.
.
.
.
.
.
.
.
.
.
.
.
.
.
.
.
.
.
.
.
.
.
.
.
.
.
.
.
.
.
.
.
.
.
.
.
.
.
.
.
.
.
.
.
.
.
.
.
.
.
.
.
.
.
.
.
.
.
.
.
.
.
.
.
.
.
.
.
.
.
48
49
49
50
51
51
51
52
52
52
54
57
57
57
58
58
58
60
60
7 Some examples
7.1 Introduction . . . . . . . . . . . . . . .
7.2 The rolling ball example . . . . . . . .
7.2.1 Defining the conceptual model
7.2.2 Defining the dynamics . . . . .
7.2.3 Defining the concrete model . .
7.3 The stupid model . . . . . . . . . . . .
7.3.1 Stupid model 1 . . . . . . . . .
7.3.2 Stupid model 2 . . . . . . . . .
7.3.3 Stupid model 3 . . . . . . . . .
7.3.4 Stupid model 4 . . . . . . . . .
7.3.5 Stupid model 5 . . . . . . . . .
7.3.6 Stupid model 6 . . . . . . . . .
7.3.7 Stupid model 7 . . . . . . . . .
7.3.8 Stupid model 8 . . . . . . . . .
.
.
.
.
.
.
.
.
.
.
.
.
.
.
.
.
.
.
.
.
.
.
.
.
.
.
.
.
.
.
.
.
.
.
.
.
.
.
.
.
.
.
.
.
.
.
.
.
.
.
.
.
.
.
.
.
.
.
.
.
.
.
.
.
.
.
.
.
.
.
.
.
.
.
.
.
.
.
.
.
.
.
.
.
.
.
.
.
.
.
.
.
.
.
.
.
.
.
.
.
.
.
.
.
.
.
.
.
.
.
.
.
.
.
.
.
.
.
.
.
.
.
.
.
.
.
.
.
.
.
.
.
.
.
.
.
.
.
.
.
.
.
.
.
.
.
.
.
.
.
.
.
.
.
.
.
.
.
.
.
.
.
.
.
.
.
.
.
.
.
.
.
.
.
.
.
.
.
.
.
.
.
.
.
.
.
.
.
.
.
.
.
.
.
.
.
.
.
.
.
.
.
.
.
.
.
.
.
.
.
61
61
61
62
62
65
67
68
71
75
79
82
85
88
89
8 The scheduler
A Introduction to Scheme
A.1 Control syntax . . . .
A.2 Booleans . . . . . . . .
A.3 Numbers . . . . . . . .
A.4 Dotted pairs and lists
A.5 Mimosa primitives . .
92
.
.
.
.
.
.
.
.
.
.
.
.
.
.
.
.
.
.
.
.
.
.
.
.
.
.
.
.
.
.
.
.
.
.
.
.
.
.
.
.
.
.
.
.
.
.
.
.
.
.
.
.
.
.
.
.
.
.
.
.
.
.
.
.
.
.
.
.
.
.
.
.
.
.
.
.
.
.
.
.
.
.
.
.
.
.
.
.
.
.
.
.
.
.
.
.
.
.
.
.
.
.
.
.
.
.
.
.
.
.
.
.
.
.
.
.
.
.
.
.
96
97
97
98
98
99
3
CONTENTS
B Introduction to Smalltalk
101
B.1 Mimosa primitives . . . . . . . . . . . . . . . . . . . . . . . . . . 101
C The structure package
C.1 The meta-data box . .
C.1.1 The types . . .
C.1.2 The dimensions
C.1.3 The tests . . .
C.1.4 The values . .
C.2 The data box . . . . .
C.2.1 The boolean . .
C.2.2 The names . .
C.2.3 The quantities
C.2.4 The units . . .
.
.
.
.
.
.
.
.
.
.
.
.
.
.
.
.
.
.
.
.
.
.
.
.
.
.
.
.
.
.
.
.
.
.
.
.
.
.
.
.
.
.
.
.
.
.
.
.
.
.
.
.
.
.
.
.
.
.
.
.
.
.
.
.
.
.
.
.
.
.
.
.
.
.
.
.
.
.
.
.
.
.
.
.
.
.
.
.
.
.
.
.
.
.
.
.
.
.
.
.
.
.
.
.
.
.
.
.
.
.
.
.
.
.
.
.
.
.
.
.
.
.
.
.
.
.
.
.
.
.
.
.
.
.
.
.
.
.
.
.
.
.
.
.
.
.
.
.
.
.
.
.
.
.
.
.
.
.
.
.
.
.
.
.
.
.
.
.
.
.
.
.
.
.
.
.
.
.
.
.
.
.
.
.
.
.
.
.
.
.
.
.
.
.
.
.
.
.
.
.
.
.
.
.
.
.
.
.
.
.
.
.
.
.
.
.
.
.
.
.
.
.
.
.
.
.
.
.
.
.
.
.
.
.
.
.
.
.
.
.
103
103
104
104
107
107
107
108
108
108
108
List of Figures
2.1
2.2
2.3
2.4
2.5
2.6
2.7
2.8
The
The
The
The
The
The
The
The
welcome window . . . . . . . . . . . . . . . . . . . . . . . . .
conceptual model editor as an example of an editor window
category list editor of ontologies . . . . . . . . . . . . . . . .
graphical editor buttons . . . . . . . . . . . . . . . . . . . .
scheduler window . . . . . . . . . . . . . . . . . . . . . . . .
project window with a selected conceptual model . . . . . .
project window with a selected simulation model . . . . . .
project window with a selected category . . . . . . . . . . .
3.1
3.2
3.3
3.4
3.5
Farmer and plot individuals. . . .
Farmers owning plots. . . . . . .
The description of the plot p2. .
A category hierarchy of plots and
A category hierarchy of plots and
4.1
4.2
4.3
4.4
4.5
4.6
4.7
4.8
4.9
The buttons of the ontology editor. . . . . . . . .
An annotated category. . . . . . . . . . . . . . .
The creation dialog for a category. . . . . . . . .
The category graphical form. . . . . . . . . . . .
The category editor with the attribute panel. . .
The category editor with the inherited attributes.
The creation dialog for a relation. . . . . . . . . .
The example of a relation. . . . . . . . . . . . . .
The relations of a category. . . . . . . . . . . . .
.
.
.
.
.
.
.
.
.
.
.
.
.
.
.
19
19
20
20
21
.
.
.
.
.
.
.
.
.
.
.
.
.
.
.
.
.
.
.
.
.
.
.
.
.
.
.
23
24
24
25
26
26
26
27
27
5.1
5.2
5.3
The behavior panel of the category. . . . . . . . . . . . . . . . . .
The structure of an M-DEVS entity. . . . . . . . . . . . . . . . .
The behavior panel of a simple object. . . . . . . . . . . . . . . .
30
31
47
6.1
6.2
6.3
6.4
The buttons of the model editor. . . . . . . . . . . . . . . . . . .
The creation dialog for an individual. . . . . . . . . . . . . . . . .
The individual graphical form. . . . . . . . . . . . . . . . . . . .
The individual editor with the attribute and the initialization
panels. . . . . . . . . . . . . . . . . . . . . . . . . . . . . . . . . .
The creation dialog for a link. . . . . . . . . . . . . . . . . . . . .
The example of links. . . . . . . . . . . . . . . . . . . . . . . . . .
A concrete model with an output specification. . . . . . . . . . .
The creation dialog for an output. . . . . . . . . . . . . . . . . .
49
50
50
6.5
6.6
6.7
6.8
4
. . . .
. . . .
. . . .
people
people
. . .
. . .
. . .
. . .
with
.
.
.
.
a
. . . . . . .
. . . . . . .
. . . . . . .
. . . . . . .
relationship
10
12
13
13
14
16
17
17
.
.
.
.
.
.
.
.
.
.
.
.
.
.
.
.
.
.
.
.
.
.
.
.
.
.
.
.
.
.
.
.
.
.
.
.
.
.
.
.
.
.
.
.
.
.
.
.
.
.
.
.
.
.
51
51
52
53
53
5
LIST OF FIGURES
6.9
6.10
6.11
6.12
6.13
6.14
6.15
The
The
The
The
The
The
The
output graphical form. . . . . . . . . .
output editor with an attribute panel. .
creation dialog for an output edge. . .
control panel toolbar. . . . . . . . . . .
control panel view. . . . . . . . . . . .
creation dialog for an output view. . .
creation dialog for a parameter editor.
.
.
.
.
.
.
.
53
54
57
58
59
59
60
7.1
7.2
7.3
7.4
7.5
7.6
7.7
7.8
7.9
7.10
7.11
7.12
7.13
7.14
7.15
7.16
7.17
7.18
7.19
7.20
7.21
7.22
7.23
7.24
7.25
7.26
7.27
7.28
7.29
7.30
7.31
7.32
7.33
7.34
The conceptual model for a kicked and observed rolling ball. . . .
The conceptual model for a rolling ball with the attribute panel.
The rolling ball category with the relations panel. . . . . . . . . .
Definition of an arc from an existing relation definition . . . . . .
The rolling ball category with the probes panel . . . . . . . . . .
The rolling ball category with the initialize panel . . . . . . . . .
The rolling ball category with the external transition panel . . .
The concrete model as an instance of the conceptual model. . . .
The edition dialog for an individual. . . . . . . . . . . . . . . . .
The view on the rolling ball state . . . . . . . . . . . . . . . . . .
The stupid conceptual model 1 . . . . . . . . . . . . . . . . . . .
The concrete model 1 . . . . . . . . . . . . . . . . . . . . . . . .
The concrete model 1 control panel . . . . . . . . . . . . . . . . .
The simulation model 1 control panel . . . . . . . . . . . . . . . .
The conceptual model 2 . . . . . . . . . . . . . . . . . . . . . . .
The concrete model 2 . . . . . . . . . . . . . . . . . . . . . . . .
Defining the visualization of the bug size . . . . . . . . . . . . . .
The simulation model 2 control panel . . . . . . . . . . . . . . . .
The stupid conceptual model 3 . . . . . . . . . . . . . . . . . . .
The concrete model 3 . . . . . . . . . . . . . . . . . . . . . . . .
Defining the visualization of the food availability . . . . . . . . .
The simulation model 3 control panel . . . . . . . . . . . . . . . .
Choosing a probe observer for cells and bugs . . . . . . . . . . .
The stupid conceptual model 5 . . . . . . . . . . . . . . . . . . .
The concrete model 5 . . . . . . . . . . . . . . . . . . . . . . . .
The control panel 5 with the attribute editors . . . . . . . . . . .
The control panel . . . . . . . . . . . . . . . . . . . . . . . . . . .
The concrete model 6 . . . . . . . . . . . . . . . . . . . . . . . .
The parameters for a histogram visualizer . . . . . . . . . . . . .
The control panel 6 specification with the new histogram . . . .
The control panel with the histogram . . . . . . . . . . . . . . .
The concrete model 8 . . . . . . . . . . . . . . . . . . . . . . . .
The file output parametrization . . . . . . . . . . . . . . . . . . .
The result of the simulating the stupid model 8 . . . . . . . . . .
62
63
63
63
64
65
66
66
67
67
69
71
72
72
73
74
75
76
76
79
80
80
82
83
84
84
85
87
87
88
89
90
91
91
8.1
8.2
8.3
8.4
The
The
The
The
92
93
94
95
scheduler window. . . . . . . .
main inspector window. . . . .
entity inspector window. . . .
graph of the simulated model.
.
.
.
.
.
.
.
.
.
.
.
.
.
.
.
.
.
.
.
.
.
.
.
.
.
.
.
.
.
.
.
.
.
.
.
.
.
.
.
.
.
.
.
.
.
.
.
.
.
.
.
.
.
.
.
.
.
.
.
.
.
.
.
.
.
.
.
.
.
.
.
.
.
.
.
.
.
.
.
.
.
.
.
.
.
.
.
.
.
.
.
.
.
.
.
.
.
.
.
.
.
.
.
.
.
.
.
.
.
.
.
.
.
.
.
.
.
.
.
.
.
.
.
.
.
.
.
.
.
.
.
.
.
.
.
.
.
.
.
.
.
.
.
.
.
Chapter 1
Introduction
Mimosa1 is an extensible modeling and simulation platform ([9]). It is aiming
at supporting the whole modeling and simulation process from the conceptual
model up to the running simulations.
The modeling process is assumed to be constituted iteratively of the following
stages:
The conceptual modeling stage: it consists in elaborating the ontology of
the domain as a set of categories, their attributes and their relationships,
either taxonomic or semantical. In short, this stage is about defining the
vocabulary used to describe concrete situations (the words to say it).
The dynamical modeling stage: in order to describe the dynamics of the
categories defined in the first phase, one must decide on the choice of
paradigm (differential equations, straight scripting, agent-based, etc.) for
each category. The paradigm is described using a built-in meta-ontology.
Given the choice of dynamical paradigm, one must specify the possible
states and state changes according to the chosen paradigm. Additionaly,
one can define how to initialize the states and how to observe it.
the concrete modeling stage: the previously described stages define the vocabulary in which the concrete model(s) can be described as a set of individuals linked to each other and with given attribute values.
the simulation specification stage: apart from the structure of the model
to simulate as described in the previous stage, an important work consists
in deciding which attributes can be considered as fixed parameters, which
ones can be manipulated by the user, how to output the observables of
the model (plots, grids, databases, statistical tools, etc.)
the simulation stage: it consists in running the simulations themselves by
creating the simulation model to run as a set of entities linked through
ports by connections, by associating the means to specify the input parameters and to handle the outputs of the simulations and by actually
simulating it.
1 It is the french acronym for “Méthodes Informatiques de MOdélisation et Simulation
Agents”: computer science methods for agent-based modeling and simulation
6
CHAPTER 1. INTRODUCTION
7
In the following, we shall describe these stages in turn with the associated
concepts. But before, we shall shortly introduce how to run the system.
Mimosa is also implemented to be multi-lingual. For the time being only
english, french and spanish are provided. The user’s manual is only in english.
Most of the explanations still apply even if the menus and titles are not the
same.
1.1
News
The changes from version 1.3.0 are the following:
1. a fair number of bug fixes;
2. the project editor is now easier to use;
3. the full debug of the scripting languages including Smalltalk;
4. a first introduction of the prolog scripting language;
5. a new option (-eclipse) which allows the developpement of plugins within
eclipse in separate projects;
6. the spanish language has been added (but still to be improved).
The changes from version 1.2.3 are the following:
1. various options for running Mimosa (see 2.2);
2. a new button in the scheduler window (see 2.5);
3. a new menu item for generating HTML documentation (see 4.1);
4. a new function to stop the simulation programmatically (see 5.3.1);
5. a number of probe observers are now described (but not all of them, see
6.3.2).
6. the stupid model example [13] is in the course of being described (see 7.3).
The changes from version 1.2.4 are the following:
1. the smalltalk scripting language is now working (see 5.3.2).
2. for space and time efficiency, the influences and probes content has been
coded as arrays instead of vectors. The sections 5.2.3 and 5.3.1 have been
slightly changed accordingly.
3. the stupid model examples 4 to 8 [13] have been added (see 7.3). To be
read carefully to learn about using Mimosa.
4. the implementation packages have been extensively re-organized for a
clearer understanding of the code. This change does not concern this
user’s manual but only the generated javadoc for the programmers.
The changes from version 1.2.5 are the following:
CHAPTER 1. INTRODUCTION
8
1. most importantly, the initialization process has been factored out from
the dynamics. It is now possible to specify how to initialize the simulation model independetnly of the dynamics. For the time being it can
be specified at the category level and at the individual level. A further
improvement concerns the possibility to also vary how to generate the
simulation model beforehand.
2. the possibility to group a number of models (conceptual, concrete and
simulation) into projects as well as browsing these projects in an easier
way.
3. the mereology browser, never completely implemented, has been removed
definitely.
4. the implementation packages have been again extensively re-organized for
a clearer understanding of the code. This change does not concern this
user’s manual but only the generated javadoc for the programmers.
5. the so-called plugins are now distributed separatly.
6. installers for Windows, MacOSX and linux are now provided.
Chapter 2
Running Mimosa
2.1
Downloading Mimosa
Mimosa is a free software under LGPL license and CIRAD copyright. The
source and code is available on SourceForge.
If you are only interested in the program itself, you can go to the Mimosa
site on SourceForge: http://sourceforge.net/projects/mimosa. You just
have to follow the link “dowload” to go to the page where you can download the
software. How to run it is explained in the next section.
If you are interested by the software itself (or even want to contribute), feel
free to access it via the CVS server at:
pserver:[email protected]/cvsroot/mimosa.
The latest version is available at the head of the project. The tagged versions
version1.0beta to version1.2.5b can be dowloaded but, of course, are not
fully up to date. If you want to be a developer, just create an account on
SourceForge and send a message to:
[email protected]
to give the name of your account and to explain what you want to do.
2.2
Launching Mimosa
Mimosa is written in Java 1.5 and can be run on any platform (both hardware
and operating system) as long as at least Java JRE 1.5 is installed.
For the time being, Mimosa is provided as a folder containing:
• mimosa.jar which is the main program to be launched by typing: java
-jar mimosa.jar or by double-clicking on it if your OS has Java integrated in it.
• a libs folder containing the libraries necessary for running Mimosa.
• an example folder containing some examples to load within Mimosa for
exploring its functionalities.
• a documentation folder for the documentation (it should be soon or later
a user’s manual (this one), a programmer’s manual and the full javadoc
hierarchy).
9
CHAPTER 2. RUNNING MIMOSA
10
Figure 2.1: The welcome window
• a plugins folder contains so-called plugins which are either hard-coded
examples or additional dynamical specification paradigms. Nowadays all
the extensions of Mimosa are distributed in this form.
When launching Mimosa, a first window is opened to choose your language
(see figure 2.1). The window shall appear in your operating system language as
well as the choice by default. However, depending with whom you are working,
any other available language can be selected. Thereafter, a number of windows
appear (see 3). In the top the windows for editing the conceptual respectively
the concrete models. In the bottom left, the window to control the scheduler
and in the bottom right, an output window where a number of information are
displayed. The next section describes the menus in detail.
If the latter is the standard and most common use of Mimosa, a number of
options are now available for running it and available from the command line:
• java -jar mimosa.jar launches Mimosa as described before;
• java -jar mimosa.jar xxx.sml launches Mimosa with only the scheduler and output windows open and the given simulation model already
loaded. This option is used for delivering turn key models.
• java -jar mimosa.jar -nw xxx.sml launches Mimosa without the user
interface and can be used for running simulations in batch mode.
One can type java -jar mimosa.jar -h to know about further options.
2.3
The menus
Four menus are provided:
File: this menu provides access to all the functionalities related to the window
which is active or to open new windows:
New: is used to open any of the following new windows:
Project browser: opens a window for managing and editing the
projects as a set of conceptual, concrete and simulation models;
Conceptual model browser: opens a window for editing conceptual models;
Concrete model browser: opens a window for editing concrete
models (as instances of conceptual models);
CHAPTER 2. RUNNING MIMOSA
11
Scheduler: opens a scheduler control window for running the simulation models.
Open...: loads the content of a file depending of the selected window or
item if in the project browser. The file must contain an appropriate
XML representation. The kind of content which can be loaded depends on the active window. If it is a conceptual model editor, only
a saved conceptual model can be loaded. If it is a concrete model
editor, only a saved concrete model can be loaded. In the last case,
be sure that the conceptual models used by the concrete model have
been loaded beforehand. Finally, if it is a scheduler window, only
the XML files especially generated from the concrete model editor
for this purpose can be loaded1 .
Save: saves the model currently edited in the active window in the associated file (the last file it was saved to). If it was never saved before,
a file chooser dialog opens.
Save as...: saves the model currently edited in the active window in a file
to specify regardless of the last save (or open).
Save as image...: saves the displayed graph (if any) as a picture in a
number of proposed formats.
Print...: prints the content of the current window if applicable (it is applicable when a graph is displayed).
Refresh...: this item is only used if you defined a new meta-ontology in
a so-called plugin and you want to dynamically reload the plugins
definitions for further use without relaunching Mimosa.
Edit: this menu provides the contextual editing functionalities provided for
the selected window or object. This menu does not appear when browsing
projects (yet). Any editor provides at least the following functionalities
in addition to the usual cut, copy and paste:
Export documentation...: to generate an html file describing the content of the selected window or item in a human readable form;
Add...: to add a new object (categories, individuals, states, etc.);
Change...: to change the name of an object when there is an associated
name;
Edit..: to edit the structure of an object (the structure depends on the
object and, sometimes, includes the associated behavior description);
Remove: to remove the selected object(s);
Clear...: to remove all the defined objects.
Window: this menu provides quick access to the opened windows. One of these
is always accessible even if not shown by default:
Output: to display the output window which is a console containing: a
panel for user specific output, a panel where error are displayed and
a panel where the traces are displayed.
1 This possibility is provided to create stand-alone models without the associated conceptual
models.
CHAPTER 2. RUNNING MIMOSA
12
Figure 2.2: The conceptual model editor as an example of an editor window
Help: this menu gives access to a number of tools for debugging:
Statistics: displays in the output window some statistics about the data
structures used by the scheduler: number of created entities and
usage of the influences;
Predefinitions: displays in the output window the predefinitions as defined in the scripting mechanism;
Show content: displays in the output window the content of the tables
created by the various editors which are the data structures behind
the scenes;
Script interpreter: displays a window in which the user can enter expressions in any of the provided scripting languages in order to test
the code. The results are displayed in the output window when pushing the eval button.
2.4
The editor windows
Each editor window has the same structure (see the figure 2.2). It is divided in
two vertical panels.
The left panel contains the list of existing models (either conceptual or concrete) referenced by their names, or the projects hierarchies. In Mimosa, these
models are also referred to as ontologies. One can select an existing conceptual model (in the conceptual model editor) or concrete model (in the concrete
CHAPTER 2. RUNNING MIMOSA
13
Figure 2.3: The category list editor of ontologies
Figure 2.4: The graphical editor buttons
model editor) or any of these (in the project browser) by left-clicking on its
name. By right-clicking on the panel, one accesses a popup menu where it is
possible to add a new model, open an existing one, change its name or delete
it. It is highly recommended to create a new model each time one is describing
a different structure for modularity and reuse reasons.
The right panel is editor specific and usually allows multiple views of the
same model or parts of it. In most cases a graphical view is provided. In the
figure 2.2, there are three editor panels. The shown one is the graphical editor
panel. The other two are used to edit categories and influence types (see 5.2.3)
as lists. The figure 2.3 shows the list editor where it is also possible to add,
change the name, edit and remove categories.
On the top of any drawing view, there is a toolbar with a number of model
specific buttons. These buttons are specific and shall be described in the related
chapters. These editing buttons are also available as a popup menu when rightclicking in the drawing area. The last button is a drop down menu to manipulate
the editor window (zooming in and out, reducing, enlarging or hidding/showing
the grid for objects alignment). The figure 2.4 shows the buttons for editing
rather complex conceptual models (just for illustration).
Any created object can be edited by double-clicking on it. On right-clicking
CHAPTER 2. RUNNING MIMOSA
14
Figure 2.5: The scheduler window
on an object, one can access a popup menu for editing (same as double-clicking)
or deleting the object.
2.5
The scheduler window
On the top of the scheduler window (see 2.5), the list of existing models is
provided for inclusion within the list of available models to the scheduler. It
is also possible to add additional models to simulate by loading them from
scheduler specific files. This possibility is used when delivering turn key models.
The bottom of the scheduler window is divided in two vertical panels.
In the left panel, there is the list of existing models (as added from the model
editor or from files). Exactly one model must be selected to be run.
The right panel is divided in three horizontal panels:
1. the top panel has two check boxes for debugging:
Trace: to turn tracing on and off. If the trace is on, the influences posted
and sent are displayed in the trace window.
Verify: to turn verifying on and off. If the verify is on, all the declarations (names, types and cardinality) are checked during simulation.
It slows down the simulation quite a bit but it is very useful for
checking whether the behavior is consistent with the declarations.
as well as a button to visualize the simulated structure as a graph. Currently, the graph is not updated while running the simulation. Therefore,
the button has to be pushed each time, one wants to visualize the current
state (to be improved later on).
2. the middle panel displays the state of the simulation (unknown, initialized,
running or stopped) and the current date (in global time). An end date
can be entered to specify when to stop the simulation. The core simulation
system being event-based, this is NOT a number of steps but really an
end date.
3. the bottom panel has buttons for controlling the simulation:
Reset: for creating the simulation model and control panel out of its
description (either file or concrete model).
Initialize: for putting the model in its initial state. The current date is
always set to 0.
CHAPTER 2. RUNNING MIMOSA
15
Run: to run the simulation until the provided end date is reached. If the
end date is less or equal to the current date, nothing happens.
Step: to run one cycle of the simulation. All the influences scheduled at
the next date are executed.
Stop: to stop the simulation before the end date is reached. The current
cycle is always completed (and cannot be interrupted).
Close: to close the possibly opened outputs (files or data bases) after the
simulation has been stopped.
Each scheduler window is associated to its own thread, so there is a possibility of having several scheduler window opened to run several simulations
simultaneously.
2.6
The project window
It is possible to group a set of related models (conceptual, concrete and simulation models) into a single project. Each model is saved in a separate file and the
project records the set of files which are grouped together. The project window
maintains a list of loaded projects, each project being composed of conceptual,
concrete and simulation models.
The figure 2.6 illustrates the structure of the project window. The left
vertical pane contains a hierarchy made of a list of projects, each one made of a
list of conceptual, concrete and simulation models respectively. Each conceptual
model contains a list of categories. Each concrete model contains a list of
individuals and outputs. By left-clicking on each of these items, one has access
to a corresponding editor if available in the right part of the window. It is the
case for a conceptual model (see figure 2.6) or for a single category (see figure
2.8).
Left-clicking on a simulation model gives access to the panel for running the
simulation as well as its associated control panel (see 8). The resulting display
is illustrated in the figure 2.7.
Right-clicking on an item in the left pane gives access to a conceptual menu
for creating, opening, saving and deleting whatever is appropriate depending on
the clicked item:
• on Projects it is possible to manipulate the projects list.
• on Conceptual models it is possible to manipulate the list of conceptual
models (creating or opening new models).
• on Concrete models it is possible to manipulate the list of concrete models
(creating or opening new models).
• on Simulation models it is possible to manipulate the list of simulation
models. Creating one gives access to the list of available concret models
in the project. Open one allows to load a stand-alone simulation model.
• on a specific conceptual model, it is possible to create new categories by
entering just their name.
CHAPTER 2. RUNNING MIMOSA
16
Figure 2.6: The project window with a selected conceptual model
2.7
The files
Each model is stored in a separate file in XML format with a given extension.
The available extensions are the following:
.pml: the file contains a project as a list of related files;
.aml: the file contains a conceptual model made of categories, relations as well
as initialization and dynamics specifications;
.eml: the file contains a concrete model made of individuals, links a well as
initialization and output specifications;
.sml: the file contains a complete simulation model containing alos the initialization and output specifications to be run stand alone.
CHAPTER 2. RUNNING MIMOSA
Figure 2.7: The project window with a selected simulation model
Figure 2.8: The project window with a selected category
17
Chapter 3
The ontologies
In modeling and simulation, the structure is often understood as a composition
of models, each model computing a function to produce outputs (outgoing events
or values) from inputs (incoming events or values). Of course, this composition
reflects the structure of the system one wants to model but no discourse on how
to describe a system structure is explicitly given. On the other hand, Artificial
Intelligence has focused part of its theories on how people describe the reality.
This part of Artificial Intelligence evolved, partly under the pressure of the web
developments (both about its contents and its services), into what is called today
the description of ontologies.
The term ontology has its origin in philosophy, where it is the name of a
fundamental branch of metaphysics concerned with existence. According to
Tom Gruber at Stanford University, the meaning of ontology in the context of
computer science, however, is “a description of the concepts and relationships
that can exist for an agent or a community of agents.” He goes on to specify that
an ontology is generally written, “as a set of definitions of formal vocabulary”.
Contemporary ontologies share many structural similarities, regardless of
the language in which they are expressed. Most ontologies describe individuals,
links, categories, attributes, and relations. In this section each of these components is discussed in turn as well as the related Mimosa specification. More
descriptions can be found in [10, 12].
3.1
Individuals
Individuals are the basic, "ground level" components of an ontology. The individuals in an ontology may include concrete objects such as people, animals,
tables, automobiles, molecules, and planets, as well as abstract individuals such
as numbers and words. Strictly speaking, an ontology need not include any individuals, but one of the general purposes of an ontology is to provide a means
of classifying individuals into categories, even if those individuals are not explicitly part of the ontology. In Mimosa, the concrete model editor is provided for
defining the individuals, out of the defined categories. Only the individuals can
actually behave and therefore be simulated. In figure 3.1, we have three plots
(p1, p2 and p3) and two people (John and Paul). The name of the individual
is optional and indicated before the “:”. The name after the semi-colon shall be
18
CHAPTER 3. THE ONTOLOGIES
19
Figure 3.1: Farmer and plot individuals.
Figure 3.2: Farmers owning plots.
explained in the following. It actually is the name of the category the individual
belongs to.
3.2
Links
For the model to be properly called a structure, these individuals usually are
linked to each other in some meaningfull way. In our example, the figure 3.2
shows some links between the individuals describing that John is proprietary of
p1 and p2, while Paul is proprietary of p3. The proprietary link is indicated by
the name ownership.
3.3
Attributes
Individuals in the ontology are described by specifying their attributes. Each
attribute has at least a name and a value, and is used to store information that
is specific to the individual it is attached to. For example the p2 individual has
attributes such as:
surface 20
cover tree
The value of an attribute can be a complex data type; in this example, the value
of the attribute called cover could be a list of values, not just a single value.
CHAPTER 3. THE ONTOLOGIES
20
Figure 3.3: The description of the plot p2.
Figure 3.4: A category hierarchy of plots and people
In the figure 3.3, some of the attributes are represented.
3.4
Categories
Categories are the specification of the common features of groups, sets, or collections of individuals. They are abstractions over sets of concrete individuals.
Some examples of categories are:
Person : the category of all people (describing what is common to all people);
Molecule : the category of all molecules (describing what is common to all
molecules);
Number : the category of all numbers;
Vehicle : the category of all vehicles;
Car : the category of all cars;
Individual : representing the category of all individuals.
Importantly, a category can subsume or be subsumed by other categories.
For example, Vehicle subsumes Car, since (necessarily) anything that is a member of the latter category is a member of the former. The subsumption relation
is used to create a hierarchy or taxonomy of categories down to very specific
categories like MaizeFarmer at the bottom. Figure 3.4 shows such a hierarchy
of categories.
Usually what is common to a collection of individuals is that they share
the same attributes. In the figure 3.4, all the people have a name and an
CHAPTER 3. THE ONTOLOGIES
21
Figure 3.5: A category hierarchy of plots and people with a relationship
age. We also assume that each farmer has a cashflow (but not a herder!). By
subsumption, any farmer and any herder has also a name and an age because
they are particular case of Person. In Mimosa an attribute has a name, a type
which can be only a single type (short, integer, long, float, double, string and
color) and a cardinality to have list of values. If an attribute refers to another
category, it is a relationship and no longer an attribute. Therefore an attribute
is nothing but a relation to a simple notion (like numbers).
3.5
Relations
An important use of relations is to describe the relationships between individuals in the ontology. In fact a relation can be considered as an attribute whose
value is another individual in the ontology, or conversely an attribute can be
considered as a relationship with another individual (a number is also an individual, instance of the category of numbers). For example in the ontology that
contains the Farmer and the Plot, the Farmer object might have the following
relation:
ownership Plot
This tells us that a Plot can be owned by a Farmer. Together, the set of
relations describes the semantics of the domain. In the figure 3.5, a relation has
been added accordingly. In addition, we have also declared that a person can be
proprietary of any number of plots. One can see that the individuals described
in figure 3.2 appear to be instances of the categories described in 3.5 and that
their links appear to be instances of the related relations.
In Mimosa, a relation is uni-directional and links a category to another, with
a cardinality.
The most important type of relation is the subsumption relation (is-superclassof, the converse of is-a, is-subtype-of or is-subclass-of) already mentioned in the
previous section.
Another common type of relations is the meronymy relation (written as partof) that represents how objects combine together to form composite objects. For
example, if we extended our example ontology to include objects like Steering
Wheel, we would say that "Steering Wheel is-part-of Ford Explorer" since a
steering wheel is one of the components of a Ford Explorer. If we introduce
part-of relationships to our ontology, we find that this simple and elegant tree
CHAPTER 3. THE ONTOLOGIES
22
structure quickly becomes complex and significantly more difficult to interpret
manually. It is not difficult to understand why; an entity that is described as
’part of’ another entity might also be ’part of’ a third entity. Consequently,
individuals may have more than one parent. The structure that emerges is
known as a Directed Acyclic Graph (DAG).
The part of the ontology consisting of the categories, attribute descriptions
and relations (either taxonomic or semantical) shall be called the conceptual
model. The part of the ontology consisting of the individuals, their attribute
values and their links shall be called the concrete model. In the following the
editor to create the conceptual model shall be described. In addition, we shall
describe how to specify the dynamics associated to each category. Thereafter,
we shall introduce the concrete model editor.
Chapter 4
The conceptual model editor
4.1
The editor
The conceptual model editor is made of three panels for editing the conceptual
model:
• the graph panel for graphical editing.
• the list panel for editing the ontology as a list of definitions (a kind of
dictionary).
• the list panel of influence types to be explained in the section 5.
The list panel is the reference to know all the categories defined in the edited
conceptual model. In effect, a category may not appear in the graph panel.
Conversely, a category may appear several times in the graph panel as well as
categories from other conceptual models. The rational behind this behavior
is that the drawing (hence the graph panel) must have an explanatory power
(not only a definitory one) and therefore any drawing clarifying the explanation
should be possible. We shall concentrate on the graph panel which is nevertheless easier to use for defining the categories and the relationships.
The starting point is the tool bar in the upper part of the window as illustrated in the figure 4.1 where seven buttons appear:
• the first one is the grabber for selecting an object (category or relations)
in the drawing and is always selected by default;
• the second is the note object to write down documentary comments to
associate to categories;
• the third is the link to associate a comment with a category;
Figure 4.1: The buttons of the ontology editor.
23
CHAPTER 4. THE CONCEPTUAL MODEL EDITOR
24
Figure 4.2: An annotated category.
Figure 4.3: The creation dialog for a category.
• the fourth is for creating or selecting categories to draw;
• the fifth one is the taxonomic relationship;
• the sixth is the semantic relationship;
• finally, the seventh is the button to access the push down menu for manipulating the grid behavior as already described in 2.4.
The first three buttons as well as the last one are always present for each graph
editor, so it shall not be explained again. The figure 4.2 shows the use of a note.
The Edit menu contains an additional item called “Export documentation...”
for generating an HTML file containing the exhaustive description of each defined category, including its associated documentation (see 4.2.2). This option is
very useful to generate a lexicon of all the notions introduced in the conceptual
model.
4.2
4.2.1
Category edition
Drawing a category
To draw a category in a given place it is enough to click on the corresponding
button and then at the desired place, or to right click at the desired place to
show up the same toolbar as a popu menu. A new dialog is opened as illustrated
in the figure 4.3.
This dialog is composed of two parts:
• the upper part lists all the categories available in all the opened ontologies.
Selecting one of these and typing either return or pushing the Existing
button shall draw the corresponding category at the selected place;
CHAPTER 4. THE CONCEPTUAL MODEL EDITOR
25
Figure 4.4: The category graphical form.
• the down part is used to create a new category with a name field to enter
a new name (which must be unique within the current ontology).
A rectangle with either one or two subparts shall be drawn at the selected
place 4.4:
• the upper part has two lines:
– the first line is the name of the category prefixed by the name of the
ontology;
– the second line is the name of the way to define the behavior for this
category1. NativeState is chosen by default and does nothing.
• the down part is the list of attributes with their specification.
4.2.2
Editing a category
A category can be edited by double-clicking on it, or by selecting it and selecting
Edit... from the Edit menu, or by right-clicking on it and selecting Edit...
in the popup menu. The category editor dialog (4.5) shows up with the following
parts:
• the name of the category, which cannot be changed;
• an “abstract” check box to specify whether the category can have instances
or not (e.g. most probably, in our example, there shall not be direct
instances of Person, but only of Farmer and Herder);
• the super type, i.e. the category subsuming this category;
• a panel where one can specify either the documentation, the attributes,
the relations and the behavior (see chapter 5).
In figure 4.5, one shows the attribute panel where the local attributes can be
added or deleted through a popup menu. Additionally, one can see the list of
inherited attributes as shown in figure 4.6, but this list cannot be edited. Only
the locally defined attributes can be edited, the inherited list being computed.
4.2.3
Deleting a category
A category can be deleted by selecting it and selecting Remove... from the
Edit menu, or by right-clicking on it and selecting Remove... in the popup
menu. It is asked whether the category must be removed from the ontology:
1 For UML literates, it looks like a stereotype, and in fact it has a related semantics with
respect to the MDA specifications.
CHAPTER 4. THE CONCEPTUAL MODEL EDITOR
26
Figure 4.5: The category editor with the attribute panel.
Figure 4.6: The category editor with the inherited attributes.
• if yes, the category is removed both from the drawing and the list of
categories defined in the ontology;
• otherwise, only the drawing is removed but the category remains as an
existing category.
4.3
4.3.1
Relation edition
Drawing a relation
To draw a relation in a given place it is enough to click on the corresponding
button and then from a category (called the source category) to another one
(called the target category), or to right click at the desired place to show up
the same toolbar as a popu menu. A new dialog is opened as illustrated in the
figure 4.7.
Figure 4.7: The creation dialog for a relation.
CHAPTER 4. THE CONCEPTUAL MODEL EDITOR
27
Figure 4.8: The example of a relation.
Figure 4.9: The relations of a category.
This dialog is also composed of two parts even if in the figure 4.7 only one
shows up:
• the upper part lists all the existing relations available between the two
selected categories. Selecting one of these and typing either return or
pushing the Existing button shall draw the corresponding relation between the two categories.
• the down part is used to create a new relation with three fields:
– a name field to enter a new name (which must be unique within the
source category);
– a cardinality field to specify whether the relation can reference one,
several or any number of objects of the given target category.
The arrow from the source category to the target category is annotated by
all the relevant information as shown in the figure 4.8. Additionally, the “*”
means that each of these links can be drawn with any number of plots.
The list of defined relations for a category also appears in the relation panel
of the category editor as shown in the figure 4.9. A relation can be added or
removed directly from this panel but the added relations shall be drawn only if
requested as an existing relations.
The subsumption or taxonomic relationships is a particular case where nothing need to be specified but the source and target categories.
4.3.2
Editing a relation
A relation can be edited by double-clicking on it, or by selecting it and selecting
Edit... from the Edit menu, or by right-clicking on it and selecting Edit...
in the popup menu. The same editor appears as for creating it.
CHAPTER 4. THE CONCEPTUAL MODEL EDITOR
4.3.3
28
Deleting a relation
A relation can be deleted by selecting it and selecting Remove... from the Edit
menu, or by right-clicking on it and selecting Remove... in the popup menu.
It is asked whether the relation must be removed from the model:
• if yes, the relation is removed both from the drawing and the list of relations defined for the source category;
• otherwise, only the drawing is removed but the category remains unchanged.
A relation can also be removed from the relation panel of the source category
editor. If it is deleted this way, all the drawings of the relation shall disappear
as well.
Chapter 5
The behavior
5.1
Introduction
For each category, one can associate a specification of the behavior of the corresponding individuals. Basically, it is made by selecting a way to specify the
behavior (a state machine, a markov process, a differential equation, and the
list is extensible at will) and then by specifying the behavior according to the
selected way (the states and transitions for a state machine, the states and transition matrix for a markov process, etc.). The behavior itself is defined by the
specification of the state, how the state evolves (the state dynamics) and how to
initialize it. The behavior is specified by opening the category editor as shown
in figure 5.1 and to select the behavior panel.
At the top, there is the specification of the multiplier between the global
time grain and the local time grain1 . Further explanation on the representation
of time in Mimosa can be found in section 5.2.5. Just under it, there is dropdown menu to choose the formalism to use, conditioning the possible states,
initializations and dynamics. This list is extensible through plugins.
The behavior panel is itself made of six subpanels:
• the probe panel is used to define what can be observed from the individuals. It is used for displaying what happens during the simulation or saving
it to any media for further processing (statistics, etc.). The probes shall
be described in the section 5.2.4.
• the incoming influences panel is used to specify the events the individuals
are able to react to. They shall be explained in the sections 5.2.1 and
5.2.3.
• the outgoing influences panel is used to specify the events the individuals
are producing. They shall also be explained in the sections 5.2.1 and 5.2.3.
• the state panel is used to specify the state structure which can be a variable, a set of possible states, a set of attributes, a knowledge base or
anything depending on how one want to describe the behavior of the individuals of this category.
1 The grain is the smallest difference between any two time measure which can be distinguished.
29
CHAPTER 5. THE BEHAVIOR
30
Figure 5.1: The behavior panel of the category.
• the initialize panel describes how to initialize the state of the individuals,
each time the simulation is setup. The initial state can be retrieved from
a data base or set the same for all the individuals.
• the dynamics panel is used to specify the state evolves over time. Once
again, it can be a differential equation, a state machine or whatever
suits the chosen state structure. In the figure 5.1, the chosen way to
specify the behavior is through a state chart as specified in UML called
StateChartState. Therefore a corresponding state chart editor is shown.
To understand the offered possibilities and, more importantly, the behavior one can expect from these various formalisms, i.e. state, initialization and
dynamics specifications, it is necessary to go down to the ground and expose
a little bit of the underlying machinery. This is done in the following section.
Thereafter, we shall introduce some already existing formalisms and their corresponding specifications.
5.2
The operational semantics
Globally, the underlying machinery is nothing but a discrete event simulation
system. The running model is made of entities sending time stamped events
which are delivered to their target entities at the specified dates, possibly generating new time stamped events and so on. The scheduler is in charge of ordering
the events by their time stamps and to execute them in order. The only thing to
specify is how each entity behaves, i.e. generates new time stamped events and
reacts to incoming events. It is the purpose of the next section. In the following
CHAPTER 5. THE BEHAVIOR
31
Figure 5.2: The structure of an M-DEVS entity.
the events are called influences for obscure (another name for historical) reasons
[8].
5.2.1
The model
The underlying simulation semantics is based on an extension of //-DEVS (see
[14]) called M-DEVS as a shorthand for Mimosa-DEVS. Therefore, one must
understand how M-DEVS works in order to master the behavior of the models
although most details are assumed to be hidden by higher level of abstractions
as suggested in the introduction of this chapter.
A M-DEVS entity is a tuple:
< X, Y, P, S, O, init, δext , δint , δlog , δcon , λext , λint , λlog , λstr , λprobe >
where:
X:
is a set of incoming influences which are defined in the incoming infuences
panel;
Y : is a set of outgoing influences which are defined in the outgoing infuences
panel;
P : is a set of probes which are defined in the probe panel;
S: is a set of possible states as defined in the state panel;
O: is a set of output ports the elements of Y are sent to;
At this stage, we have the structure of an entity, regardless of its possible dynamics. This entity is represented in the figure 5.2 where the ports are represented by black triangles, and the arrows shows the incoming influences from
the left, the outgoing influences through the ports on the right and the probes
(or observations on S) from the top.
The function init is called for initializing the entity when created (either at
the beginning of a simulation or when created). The dynamics is described by
the following functions:
δext : is a function to specify the reaction to a set of incoming influences (all the
influences occurring at the same time are given simultaneously);
CHAPTER 5. THE BEHAVIOR
32
δint : is a function to specify the internal change (when and what to do is specified by λint );
δcon : is a function to specify the reaction to the simultaneous occurrence of an
internal change and the arrival of a set of incoming influences;
δlog : is a function to specify the reaction to a set of logical influences, possibly
producing further logical influences;
λext : is a function to provide the outgoing influences (when it is called is also
specified by λint );
λint : is a function to provide the what to do (an internal influence) and when
(called τ the duration to wait before doing the internal change);
λlog : is a function to provide the logical influences to occur after each transition;
λstr : is a function to provide the structural changes to occur also after each
transition;
λprobe : is a function to provide the observables of the state changes after each
cycle;
For all functions but init, the duration since the last cycle (see below) is given
as an argument. Therefore the internal logic of any atomic model is based on
durations.
Although complicated at the first sight, the logics is very simple:
• λext and δext are the functions to issue the events (λext ) and to handle
them (δext ). It corresponds straight away to the intuitive event based
mechanism as explained in the introduction. The events are produced
when τ elapsed since the last transition;
• λint and δint are the functions for specifying the spontaneous behavior,
i.e. what the “box” does (λint ), when (τ ) and how (δint );
• λlog and δlog are used to propagate information (λlog ) and make computations based on this information (δlog );
• λstr specifies the possible modifications in the interconnection topology
(see below).
• λprobe specifies the observations to provide at each cycle.
Mimosa implements a unique so-called M-DEVS bus which is a set of MDEVS entities with interconnected ports. More precisely, a M-DEVS bus is a
pair < E, links > where:
E:
is a set of M-DEVS entities;
links: is a mapping from E × O into E specifying a mutable interconnection
topology;
For simulation, the M-DEVS bus runs in cycles. Each cycle corresponds to
a certain date where everything happening at that date is propagated through
all the M-DEVS entities. At each cycle:
CHAPTER 5. THE BEHAVIOR
33
1. each model is asked for its τ . Let minτ be the smallest value;
2. the global time is advanced by minτ . Let:
• C be the set of models with the same minτ ;
• C ′ ∈ C be the set of models producing outputs;
3. λext is called for each model in C ′ and the outgoing influences are gathered
and their destinations are identified using links;
4. for each model m in C:
• if m has simultaneous incoming influences and an internal change,
δcon is called;
• if m has only an internal change, δint is called;
• if m has only incoming influences, δext is called;
and all the outgoing logical influences are gathered;
5. all the logical and structural influences are dispatched via links by calling
λlog , λstr and δlog until there is no logical influences left (be careful about
possible loops which are not detected).
6. all the observations of the state changes are issued caling λprobe .
For each individual, MIMOSA shall generate a corresponding entity which
shall be initialized from the list of its attribute values in a state specific way as
specified by init. A more formal and detailed account can be found in [11].
5.2.2
The ports
A port provides a way to connect M-DEVS entities together. A port can connect
an entity to any number of other entities. In Mimosa we distinguish between
a port and a port name. A port name can be a simple name (a String),
designating all the entities linked through the given port, or a name with an
index (with the syntax <name>[’(’<int>’)’]), designating one of the entities
linked through this port. In the case the cardinality of the port is one (only one
entity can be linked through this port). The two possible port names <name> or
<name>’(0)’ are equivalent. Therefore the index is optional if the cardinality
is 1.
If the reader perceives some relationship between a port and a link, he is
right. We are here using the vocabulary used in the modeling and simulation
community which is unrelated to the vocabulary used in the ontology community. As for individuals generating M-DEVS entities, the links are used to
produce the initial interconnection topology as ports.
5.2.3
The influences
An influence is an event which is transmitted between two M-DEVS entities. In
Mimosa we also distinguish between influence types and influences as instances
of influence types.
CHAPTER 5. THE BEHAVIOR
34
The influence types are just names but must be declared. These names
are unique in a given conceptual model (or ontology). This type level is not
really useful at this stage but provides a provision for further typing (like the
declaration of the arguments) to be used for connectivity with other buses like
HLA or CORBA where the type of transmitted information has to be declared.
The influences are instances of influence types. For the time being they have:
• a name which is the name of the corresponding influence type;
• a content which is either empty or an array of elements.
For ensuring communication between entities possibly written in various languages, and in particular, in various scripting languages, a standard and limited
format is imposed for the content. A content is necessarily an array (at the
implementation level an instance of Java array) of:
• arrays, allowing recursive structures;
• simple types: shorts, integers, longs, floats, doubles, booleans and strings
(respectively implemented internally in Java as instances of Short, Integer,
Long, Float, Double, Boolean and String).
In principle, no other kind of data can be send through the influences if one
want to ensure consistency between entites writtent in different programming
languages.
5.2.4
The probes
It is possible to associate to any individual (therefore to any M-DEVS entity), a
visualization window for displaying any information evolving over time (e.g. the
entity state changes). Having no hypothesis on the nature of the entity states,
there is NO automatic synchronization between the model and its visualization.
To perform this visualization, one has to declare a list of probes given by their
name, type (only simple types are allowed) and cardinality (in reality, it is
just another type of influence). When specifying the behavior, i.e. the various
transition functions, the user has to explicitly send probe values whenever he
wants to signal a change. The probe value is propagated to the visualization
window which can perform whatever one wants: drawing or saving the data for
further processing.
5.2.5
The time
The underlying time for the whole system is considered discrete (regardless of
the grain which could be as fine as picoseconds) and therefore mapped on natural
numbers. As already mentioned, an M-DEVS entity only considers durations.
In addition, these durations can only be expressed as integers.
When simulating an M-DEVS entity, a local time is deployed. The creation
of an M-DEVS atomic model either at the start of the simulation or during
it, defines the origin of the local time (0). All the durations are added up,
generating a local date as an integer. In particular, this local time is used to
compute the durations transmitted to the M-DEVS entity.
A step further, the M-DEVS bus defines a global time. The origin of the
global time (0) is the start of the simulation (initialization always occurs at the
CHAPTER 5. THE BEHAVIOR
35
global time 0). The M-DEVS entity local times are mapped to the global time
in two ways:
• the origin of the local time is situated in the global time at the (global)
time of creation of the M-DEVS entity;
• the ratio between the local time grain and the global time grain is given.
The global time grain is assumed to be the smallest possible grain able
to take into account the grain of any other atomic model as an integral
multiplier of the global grain.
Still at this stage, the time is a natural number without dimension (without
unit). The correspondence between this time and the real time where the origin
of simulation corresponds to a real date and the global grain has a unit (picosecond, hour or week) shall be specified externally. It is foreseen to be able to
declare this information to the scheduler and use this reference to define in an
easier way the time units of the entities. It is not yet completely implemented
at this stage.
In summary, any M-DEVS entity has
• a grain (the smallest undistinguishable time difference) defined implicitly
by having durations expressed with integers and explicitly by a multiplier
with the global grain;
• an origin defined implicitly by having the entity life starting at 0 and
explicitly by a position of this origin with respect to the global time.
Although each M-DEVS entity has to define the above described functions
for specifying its dynamics and therefore to behave properly, the user do not
necessarily need to know about the existence of these functions. For example,
the user could only provide a differential equation, an integration method and
an integration step and a proper definition of the δ and λ functions shall take
care of integrating the equation correctly. This is done by specifying once and
for all a particular plugin called a formalism. The already provided formalisms
are described in the following section.
5.3
The behavior specification
In order to define a formalism for specifying the behavior of an entity, the
programmer must expect to have to specify each of the mentioned function for
proper functioning of the model, hence the importance to understand the underlying operational semantics as described before. However, as mentioned earlier
higher level specifications can be made as various kind of state machines, petri
nets, directly specified differential equations with various means of integration
as long as there execution can be mapped in the previously described functions.
These extensions can be added at will to the system in a way which is described
in the programmer’s manual.
When editing a category behavior, a number of panes are dedicated for
specifying the behavior (see the figure 5.1):
• the probes to declare which information is dynamically provided during
entity simulation;
CHAPTER 5. THE BEHAVIOR
36
• the incoming influences to declare the list of incoming influences;
• the outgoing influences to declare the list of outgoing influences;
• the state pane for specifying the state structure;
• the initialization pane for specifying the initialization method;
• the dynamics pane to describe the behavior itself.
The chosen formalism as well as the time grain is specified above these panels.
Actually, the available means for specifying the behavior are as follows:
• by writing a piece of Java program and declare it to the Mimosa system
to make it available in the user interface: the so-called hard coded or
programmatic way;
• by specifying the behavior of each of the mentioned function using a scripting language. Several scripting languages are available: java, scheme, jess
(unavailable due to a need for a license), python, smalltalk and prolog
(not fully tested yet);
• with a state/transition diagram where the conditions and actions can be
specified in one of the scripting languages mentioned before;
• with any higher level mean of specification as markov processes, etc. depending on the availability of the corresponding plug-in.
These various technics shall be described in turn in the next sections.
5.3.1
Programmatic specification
This section is more appropriate for the programmer’s manual but is included
here to introduce the basics which are made available in the other ways of
specifying the model behavior. With your favorite Java IDE (for example Eclipse
(http://www.eclipse.org)), create a new project with a package (let’s call it
example) in which you have to create a number of classes:
• a subclass of mimosa.state.DefaultState describing your behaviour state.
In case of a parameterizable formalism, the resulting class shall be considered as the name of your formalism.
• for each particular way you want to provide for initializing your state,
define a subclass of mimosa.init.AbstractStateInitializer.
• for each particular way you want to provide the dynamics of your state
(how the state changes), define a subclass of mimosa.dynamics.AbstractDynamics
or mimosa.dynamics.DefaultDynamics.
For example, for defining a new behavior called MyState, the result is a file
with the following content:
CHAPTER 5. THE BEHAVIOR
37
package example;
import mimosa.state.DefaultState;
public class MyState extends DefaultState {
public void setParameter(String name, Object value)
throws EntityException {
....
}
public void doInstanceInitialize(StateSpecification stateSpecification)
throws EntityException {
....
}
}
The two provided methods are called when an entity is created: setParameter
for possibly storing the parameter values if necessary and doInstanceInitialize
for building the structure of the state. The latter method is parameterized by
an externally setup specification which is entirely dependent on the way the
state is defined. We shall not describe further this later possibility but see the
programmer’s manual for more details.
For defining how to initialize the state each time the simulation is run, the
resulting file could be like this one:
package example;
import mimosa.init.AbstractStateInitializer;
import mimosa.scheduler.EntityException;
import mimosa.state.State;
public class MyStateInit extends AbstractStateInitializer {
public void initialize(State state) throws EntityException {
....
}
}
The method initialize is called each time the simulation is run. The state is
given as a parameter because the role of this class is to initialize the state. If the
way to intialize the state is parameterized externally, the variable initializerSpecification
contains the related specification. Once again this structure is completely programmer dependent and shall not be explained further here.
Finally defining the dynamics would result in the following class:
package example;
import mimosa.dynamics.AbstractDynamics;
CHAPTER 5. THE BEHAVIOR
38
import mimosa.scheduler.EntityException;
import mimosa.state.State;
public class MyStateDynamics extends AbstractDynamics {
public void doConfluentTransition(State self) throws EntityException {
....
}
public void doExternalTransition(State self) throws EntityException {
....
}
public void doGetExternal(State self) throws EntityException {
....
}
public void doGetInternal(State self) throws EntityException {
....
}
public void doGetLogical(State self) throws EntityException {
....
}
public void doGetStructural(State self) throws EntityException {
....
}
public void doInternalTransition(State self) throws EntityException {
....
}
public void doLogicalTransition(State self) throws EntityException {
....
}
}
AbstractDynamics defines eight (8) methods:
• public void doExternalTransition(State self) throws EntityException;:
equivalent to δext .
• public void doInternalTransition(State self) throws EntityException;:
equivalent to δint .
• public void doLogicalTransition(State self) throws EntityException;:
equivalent to δlog .
• public void doConfluentTransition(State self) throws EntityException;:
equivalent to δcon .
CHAPTER 5. THE BEHAVIOR
39
• public void doGetExternal(State self) throws EntityException;:
equivalent to λext .
• public void doGetInternal(State self) throws EntityException;:
equivalent to λint together.
• public void doGetLogical(State self) throws EntityException;: equivalent to λlog .
• public void doGetStructural(State self) throws EntityException;:
equivalent to λstr .
If something is going wrong, just throw an EntityException with the entity
and a message as parameters. The exception will be taken into account by the
architecture in an appropriate way. Do not forget to catch any possible exception
and raise an EntityException accordingly for securing the model execution.
Because they are predefined for doing nothing, you can only define the methods
you actually need. By using DefaultDynamics instead of AbstractDynamics,
all the methods are programmed for doing nothing, so it is only necessary to
define the one you really need (not all the methods needs to do something).
When calling each method, this variable is defined and appropriately bound
in the context:
time: contains the duration since the previous transition (remember that these
methods are called in a given cycle and the M-DEVS bus advances time
from a cycle to another);
The following methods are defined for accessing the incoming influences:
• getAllInfluences(): to get the list of incoming influences in any order;
• getInfluence(String name): to get the list of incoming influences with
the given name. It is used to control the order in which to handle the
incoming influences;
• getInternalInfluence(): to get the incoming internal influence.
To program each functionality, a number of methods are defined by categories:
• to manipulate random generators2:
– public Random newRandom();
– public Random newRandom(long seed);
– public boolean newBoolean(Random rand);
– public int newInt(Random rand,int max);
– public double newDouble(Random rand);
• to easily create ports and port references:
– public Port port(String name,int index);
2 it is necessary to hide which kind of generator is used. Currently the Mersenne Twister
random generator is known as one of the best and provided in Mimosa.
CHAPTER 5. THE BEHAVIOR
40
– public Port portRef(Port port...);
• to manipulate the influence content:
– Object[] contentOf(Influence influence): which returns either
null if there is no content or an array of objects (as defined in 5.2.3).
– Object[] list(Object... objects): to create an array of objects as a content or sub-content.
– Object[] array(Object... objects): to create an array of objects as a content or sub-content.
– Object object(T i): where T is one of the Java simple types (short,
int, etc.) to encapsulate them within the corresponding class instance
(Short, Integer, etc.).
– T toT(Object o): where T is one of the Java simple types (short,
int, etc.) to unbox them from the corresponding class instance (Short,
Integer, etc.).
• to get the initial value of a parameter:
– public Object getParameter(String name).
• to post an influence at a given port:
– void sendExternal(String portName, String influenceTypeName),
– void sendExternal(Port portName, String influenceTypeName),
– void sendExternal(String portName, String influenceTypeName,
Object... args),
– void sendExternal(Port portName, String influenceTypeName,
Object... args).
– void sendLogical(String portName, String influenceTypeName),
– void sendLogical(Port portName, String influenceTypeName),
– void sendLogical(String portName, String influenceTypeName,
Object... args),
– void sendLogical(Port portName, String influenceTypeName,
Object... args).
– void sendInternal(int duration, String influenceTypeName),
– void sendInternal(int duration, String influenceTypeName,
Object... args),
– void reply(LogicalInfluence influence, String influenceTypeName),
– void reply(LogicalInfluence influence, String influenceTypeName,
Object... args),
These methods can be called in most methods.
• to signal a state change by a probe:
– public void sendProbe(String name,Object... args).
• to destroy itself:
CHAPTER 5. THE BEHAVIOR
41
– public void die().
It removes the entity from the scheduler, removes of the link references as
well as all the scheduled incoming influences.
• and finally to stop the entire simulation:
– public void stop().
It is used to be able to stop the simulation whenever some conditions
occur.
In addition, a number of methods are defined to dynamically create and link
entities during the simulation:
• void addPort(PortReference name, String categoryName, Map<String,Object>
parameters): creates an entity as an instance of the given category,
whether it is traced or not and the map of attribute values;
• void addPort(String name, String categoryName, Map<String,Object>
parameters): same as above when there is a simple syntax for the port
reference;
• void linkPort(PortReference portRef1, PortReference portRef2):
links the port reference to the entities referenced by the second port reference, creating new links;
• void linkPort(String portRef1, PortReference portRef2): same as
above;
• void linkPort(PortReference portRef1, String portRef2): same as
above;
• void linkPort(String portRef1, String portRef2): same as above;
• void removePort(PortReference portRef): removes the entities from
the given port, without destroying the referenced entities (they kill themselves using die).
• void removePort(PortReference portRef): same as above.
To simplify the specification of the parameters in addPort, two additional methods are provided:
• public Pair pair(String name,Object args...): for creating a pair
(parameter name, value);
• public Map<String,Object> parameters(Pair args...): for creating
the adequate map from the pairs.
For example, if we want to program the behavior of a clock which sends a
influence named tick to its clocked port at interval time, we could have the
state defined this way:
CHAPTER 5. THE BEHAVIOR
42
package example;
import mimosa.state.DefaultState;
public class MyClock extends DefaultState {
private int interval;
public int getInterval() { return interval; }
public void setParameter(String name, Object value)
throws EntityException {
if (name.equals("interval")) interval = ((Integer)value).intValue();
}
public void doInstanceInitialize(StateSpecification stateSpecification)
throws EntityException {
}
}
The state is composed of a single variable recording the interval between two
ticks from the attribute values. And the dynamics is as follows:
package example;
import mimosa.dynamics.AbstractDynamics;
import mimosa.scheduler.EntityException;
import mimosa.state.State;
public class MyClockDynamics extends DefaultDynamics {
public void doGetExternal(State self) throws EntityException {
self.sendExternal("clocked","tick");
}
public void doGetInternal(State state) throws EntityException {
self.sendInternal(((Clock) self).getInterval(),"tick");
}
}
in which we declare a variable to use the interval between two ticks stored in the
state, the τ function which signals an output after the given interval and λext
where a single influence is sent to the port. Notice the use of DefaultDynamics
for not defining all the methods when only two are necessary.
Of course, it is not enough to write the code. This code has to be known by
Mimosa. In order to do that, you have to create an XML file in which Mimosa
can read the following declarations:
<?xml version="1.0"?>
<mimosamodule name="Example" package="example">
CHAPTER 5. THE BEHAVIOR
43
<behaviour notion="EntityType" implementation="MyClock">
<parameters>
<parameter name="interval" cardinality="1" type="java.lang.Integer"/>
</parameters>
<outInfluences>
<influenceType name="tick"/>
</outInfluences>
</behaviour>
<dynamics state="MyClock" dynamics="MyClockDynamics"/>
</mimosamodule>
This XML file contains everything you would have declared through the user
interface and additionnaly defines through the package and implementation
attributes where to find the corresponding class for the state. The dynamics
tag declares that MyClockDynamics is one way (in this case the only way) to
define the dynamics of MyClock.
You then have to create a folder called example, to put the .jar containing
the compiled class, to define a file called example-config.xml containing the
content above and to put the whole folder in the plugins subdirectory of Mimosa.
By trying this example, the behavior MyClock will appear in the list of available
formalisms.
In general, any new behavior (or way of defining behaviors) can be added
to Mimosa by putting in the plugins directory a folder called xxx with a file
called xxx-config.xml in it with the related XML content and as many .jar
as necessary. Further details as well as the complete syntax of the XML file
shall hopefully be presented in the programmer’s manual.
5.3.2
Scripted specification
The previous procedure being relatively heavy but necessary if one wants either
an efficient piece of code or to use Java to encapsulate a legacy simulation
software, we provide the same functionality by using scripting languages directly
through the user interface. The basic principles are the same and we are using
the same names for the variables and functions or equivalent for consistency. For
using this functionality, you have to select Scripting in the drop down menu of
the behavior pane. In the state panel, you will have another drop down menu
to select the desired scripting language as well as an editor for specifying the
structure of the state.
In a model, any combination of scripting languages can be used because
all the specific data structures are translated into a standard Java format and
back to the specific data structures. So feel free to use any one you find most
appropriate for your usage. Of course, it requires to be multi-lingual!
Java scripting
Java scripting makes available the full Java language by using the bean shell
library (see [5] for getting the related documentation). In particular, all the
methods defined in the section 5.3.1 are readily available. However to call them,
a new variable is defined: self. The methods can be called by addressing them
to self. For example, for the λext function, the code is:
CHAPTER 5. THE BEHAVIOR
44
self.sendExternal("clocked","tick");
There is one drawback in using Java scripting: all the Java types have to
be prefixed explicitly by the package name (for example java.lang.Integer
instead of simply Integer). Conversely, one can use undeclared variables providing flexibility.
Scheme scripting
The Scheme language is a kind of pure functional language (based on lambdacalculus). The facilities for manipulating symbols and lists make it particularly
useful for qualitative and symbolic manipulations, much less for numerical computations. We are using the Kawa library ([6]: fast and complete but with
scoping problems) as well as JScheme ([3]: limited and slow but semantically
consistent) for providing Scheme. The documentation for the language itself
can be found on the corresponding web site. The appendix A provides a short
reference to the Scheme language as well as the list of provided functions for
calling Mimosa.
Jess scripting
Jess is a rule base language with a forward chaining semantics (see [2]). The
behavior is described as a single set of rules of the form <conditions> =>
<actions>. Whenever the conditions are met, the corresponding rule is fired
and the actions executed. In our case, each M-DEVS function introduces the
time, the influences and the function name in the fact based and the rules are
fired accordingly until no rule is applicable. The example of the clock looks like
this:
(defrule initialize1
(initialize)
=>
(make (interval (getParameter "interval"))))
(defrule getExternal
(getExternal)
=>
(sendExternal "clocked" "tick"))
(defrule getInternal
(getInternal)
(interval $value)
=>
(sendInternal $value "tick"))
It is no longer maintained because Jess requires a licence which is free for
academics but costly for others. The library is not provided with the distribution
for that reason but can be downloaded from [2].
Python scripting
The implementation uses the Jython library whose documentation can be found
on [7]. We are using the possibility in this version of Python to call Java objects
with the standard Python syntax. Accordingly, the variable self is defined as
CHAPTER 5. THE BEHAVIOR
45
well as all the variables as in Java and the corresponding methods can be called
directly. So, there is not much difference with Java. However, for facility, we
have defined the corresponding functions which can be called directly without
using the reference to self.
Prolog scripting
Prolog ia a rule base language with a backward chaining semantics. The behavior is described as a single set of rules of the form <conclusion> :- <conditions>.
The program is run by asking for a conclusion and the program tries to find
the possible proofs. As in Jess, each M-DEVS function introduces the time,
the influences and the function name in the fact based and the rules are fired
accordingly until no rule is applicable. The run predicate must be defined. The
example of the clock looks like this:
run :- initialize,
X is getParameter(interval),
asserta(interval(X)).
run :- getExternal,
sendExternal(clocked,tick).
run :- getInternal,
interval(X),
sendInternal(X,tick).
Implemented but not yet fully tested. The implementation uses the tuProlog
library whose documentation can be found on [4].
Smalltalk scripting
The implementation uses Athena (see the we site [1]) which is a lightweight implementation of Smalltalk for embedded applications and has been fully tested.
A class called Self has been implemented with a number of class methods to
access Mimosa from Smalltalk. The list of implemented methods can be found
in the appendix B.
5.3.3
State charts
Coming soon.
5.3.4
Further extensions
This level being extensible at will by adding further meta-ontologies, this chapter
shall only describe some of them as provided in the first versions of Mimosa.
How to define new meta-ontologies is described in the programmer’s manual. In
this chapter, we shall introduce the meta-ontologies for object, space, cellular
automata and multi-agent systems.
The objects
Most categories have very simple behavior corresponding roughly to what is
available in objet-oriented programming. For the categories, it is not necessary
to provide the full M-DEVS functionality (although object-orientedness can be
CHAPTER 5. THE BEHAVIOR
46
mapped in a subpart of M-DEVS). We have provided two versions corresponding
to most needs:
• StaticObject is used when the only functionality is around state variable
values being set and get;
• SimpleObject is an extension of StaticObject where external and logical
influences are considered as method calls: the external influences when
the SimpleObject will change state in response, and the logical influences
when only information updates and requests have to be handled.
StaticObject contains a set of state variables to choose among the attributes3 . The following incoming influences are expected:
• setState name value: as an external influence to change the value of
one of the variables;
• getState name: as a logical influence to ask for the value of one of the
variables.
The following outgoing influences are issued in response to the getState influence:
• state name value: as a logical influence to communicate the value of the
requested state variable;
• undefinedState name: as a logical influence to communicate the state
variable has no value.
SimpleObject has the same semantics as StaticObject and as such provides to the same incoming and outgoing influences. In addition to defining the
state variables, the modeler can add as many additional incoming and outgoing
influences as he wants. SimpleObject allows to associate a piece of code to
execute to each incoming influence. In figure 5.3, the upper part shows on the
left the list of defined attributes and on the right the list of attributes which
have been chosen as state variables. In the bottom part, one can see the chosen
scripting language, the chosen incoming influence and the associated code. The
arguments of the influence if any are stored in the variable arguments as a list.
The spaces
Coming soon.
The cellular automata
Coming soon.
The multi-agent systems
Coming soon.
3 It is assumed that a state variables always has an initial value to be set from the corresponding attribute.
CHAPTER 5. THE BEHAVIOR
Figure 5.3: The behavior panel of a simple object.
47
Chapter 6
The concrete model editor
At this stage, the conceptual model has been completely defined both with
its structural part (the ontology properly speaking) with the categories, their
attributes and their relations, and its dynamical part by specifying in a way
or another the dynamics of the individuals specified by each category. The
concrete model editor shall use these definitions for providing the user with
the possibility to describe as many concrete models as he wants as a set of
individuals, attribute values and links. These individuals, attribute values and
links are nothing but the instances of the corresponding categories, attribute
descriptions and relations. Their edition shall be described in the sections 6.1
and 6.2.
In addition, the user must specify what to do with the probes (see 5.2.4). As a
reminder, the probes are specified in the dynamical description of the categories
and must be sent to signal a state change of interest, using sendProbe. The
concrete model editor provides the mean to specify the outputs where one wants
to send these probes. These outputs can be visual as graphs, plots, grids, etc.
or can be files, databases or even channels to various tools running in parallel
like R, Excel, etc.. This part shall be described in the section 6.3.
Finally, the user can visually specify a control panel to be used during the
simulation which includes:
• the visual outputs;
• the widgets to parameterize the model.
This latter part shall be described in section 6.4.
The concrete model editor is made of two panels:
• on the left pane, there is a list of existing models. These models can be
created or removed by double-clicking in this pane.
• on the right pane, there are two graph panels:
– the first one is a graph panel very similar to the one used for creating
conceptual models. The top of the panel is occupied by a drop down
menu to select the conceptual model from which one wants to instantiate the individuals and links. A concrete model can be drawn from
several conceptual models combining various sources of knowledge.
48
CHAPTER 6. THE CONCRETE MODEL EDITOR
49
Figure 6.1: The buttons of the model editor.
– the second one is used to visually draw the control panel for the
simulation of the corresponding model.
Apart from the conceptual model drop down menu, the starting point is the
tool bar in the upper part of the first graph panel as illustrated in the figure 6.1
where six buttons appear:
• the first one is the grabber for selecting an object (individual or links) in
the drawing and is always selected by default;
• the second is the note object to write down documentary comments to
associate to individuals;
• the third is the link to associate a comment with an individual;
• the fourth is for creating or selecting individuals to draw;
• the fifth one is the link;
• the sixth is used for creating an output;
• the seventh is a link between an individual and an output to specify where
to send the probes;
• finally, the sixth is the button to access the push down menu for manipulating the grid behavior as already described in 2.4.
6.1
6.1.1
Individual edition
Drawing an individual
To draw an individual in a given place it is enough to click on the corresponding
button and then at the desired place, or to right click at the desired place to
show up the same toolbar as a popu menu. A new dialog is opened as illustrated
in the figure 6.2.
This dialog is composed of two parts:
• the upper part lists all the individuals available in the selected model.
Selecting one of these and typing either return or pushing the Existing
button shall draw the corresponding individual at the selected place.
• the down part is used to create a new individual with two fields:
– a drop down menu from which to select the category one wants to
create an individual from;
– a name field to enter a name which is optional but can be used for
documentation purpose.
CHAPTER 6. THE CONCRETE MODEL EDITOR
50
Figure 6.2: The creation dialog for an individual.
Figure 6.3: The individual graphical form.
A rectangle is drawn as illustrated in the figure 6.3 with a name which
composed of the optional name of the individual, a semi-colon and the category
name which is itself composed of the ontology name and the category name.
Under its identification, the list of attribute values is available. Under the
name of the individual, there is a stereotype mentioning how the individual
can be initialized. As it is possible to describe how to initialize a state for all
the individuals in the category behavior part, it is possible to specify for each
single individual how to initialize it. It is usefull when the individual is itself
a complicated structure, for example when it generates additional individuals
before running the simulation.
6.1.2
Editing an individual
An individual can be edited by double-clicking on it, or by selecting it and
selecting Edit... from the Edit menu, or by right-clicking on it and selecting
Edit... in the popup menu. The individual editor dialog (6.4) shows up with
the following parts:
• the name of the category, which cannot be changed;
• the name of the individual which can be changed at will;
• a panel where one can specify the attribute values.
• a panel where it is possible to select among several ways to initialize the
individual and to edit the associated parameters if necessary. In this case,
it has been chosen to initialize it interactively. A list of the parameters to
be specified is displayed underneath.
CHAPTER 6. THE CONCRETE MODEL EDITOR
51
Figure 6.4: The individual editor with the attribute and the initialization panels.
Figure 6.5: The creation dialog for a link.
6.1.3
Deleting an individual
An individual can be deleted by selecting it and selecting Remove... from the
Edit menu, or by right-clicking on it and selecting Remove... in the popup
menu. It is asked whether the individual must be removed from the model:
• if yes, the individual is removed both from the drawing and the list of
existing individuals defined in the model;
• otherwise, only the drawing is removed but the individual remains as an
existing individual.
6.2
6.2.1
Link edition
Drawing a link
To draw a link in a given place it is enough to click on the corresponding button
and then from an individual (called the source individual) to another one (called
the target individual), or to right click at the desired place to show up the same
toolbar as a popu menu. A new dialog is opened as illustrated in the figure 6.5.
This dialog is composed of the list of available relations between the two
selected individuals as defined in the corresponding category of the source individual. Depending on the arity of the relation (i.e. the number of indices to
fully specify the relation), as many text fields are displayed underneath to enter
the indices values. In the figure 6.5, the relation is of arity 1, so only one index
must be specified.
The arrow from the source individual to the target individual is annotated
by the relation name as shown in the figure 6.6. The index values are written
between parenthesis.
CHAPTER 6. THE CONCRETE MODEL EDITOR
52
Figure 6.6: The example of links.
6.2.2
Deleting a link
A link can be deleted by selecting it and selecting Remove... from the Edit
menu, or by right-clicking on it and selecting Remove... in the popup menu.
It is asked whether the link must be removed from the model:
• if yes, the link is removed both from the drawing and the list of links
defined for the model;
• otherwise, only the drawing is removed but the link remains unchanged.
6.3
Output specification
The figure 6.7 shows a concrete model with three individuals and one output.
The arrows are connecting the individuals to an output which is, in this case,
a 2D grid view, specifying that the corresponding probes must be sent to that
output.
6.3.1
Drawing an output
To draw an output in a given place it is enough to click on the corresponding
button and then at the desired place, or to right click at the desired place to
show up the same toolbar as a popu menu. A new dialog is opened as illustrated
in the figure 6.8.
This dialog is composed of two parts:
• the upper part lists all the outputs available in the selected model. Selecting one of these and typing either return or pushing the Existing button
shall draw the corresponding output at the selected place.
• the down part is used to create a new output with a drop down menu from
which to select the kind of output one wants to create.
CHAPTER 6. THE CONCRETE MODEL EDITOR
Figure 6.7: A concrete model with an output specification.
Figure 6.8: The creation dialog for an output.
Figure 6.9: The output graphical form.
53
CHAPTER 6. THE CONCRETE MODEL EDITOR
54
Figure 6.10: The output editor with an attribute panel.
An ellipse is drawn as illustrated in the figure 6.9 with a name which composed of the kind of chosen output and an automatically generated name between parenthesis to uniquely identify this output for further manipulation.
6.3.2
Editing an output
An output can be edited by double-clicking on it, or by selecting it and selecting
Edit... from the Edit menu, or by right-clicking on it and selecting Edit...
in the popup menu. The output editor dialog (6.10) shows up with two parts:
• a drop down menu to choose the kind of output;
• a panel which depends entirely on the kind of output. In the figure 6.10,
it is an editor to attribute colors to various probe values for visualization.
If the output is directed to a file, the file should be defined, etc.
The available outputs depend on the behavior associated to the corresponding individual and are therefore described with the possible dynamical specifications. However, a number of general purpose outputs are provided and shall
be described in the following.
General
A number of general probe observers are defined:
• the probe view to monitor any probes.
• the probe output for saving the probes to a file.
A probe view is a probe observer that displays sequentially all the received
probes. It is useful to monitor any entity.
A probe output is a probe observer that saves sequentially in a file the
selected probes. It is parameterized by:
• the file name;
• the separator between the saved fields;
• whether the probe name, global time and local time has to be saved too;
CHAPTER 6. THE CONCRETE MODEL EDITOR
55
• the list of saved probes.
It can receive any probe of which the arguments shall be saved in the file, one
per line, optionally preceded by its name and its global and local time stamps.
Plots
A number of probe observers for plotting data has been introduced:
• the category chart view is plotting series of which values are given by
categories;
• the series chart view is plotting series given by x,y coordinates.
• the times chart view is plotting series against the probe time stamps.
More precisely, a category chart view is a probe observer that visualizes
series plotted by categories. It is parameterized by:
• the chart name;
• the x axis name;
• the y axis name;
• the type of chart;
• whether it has a legend or not;
• whether it has tool tips or not;
It understands probes of the form: ’category’,<categoryName>,[<seriesName>],<value>
where the names can be any string and the value is expected to be a double or
convertible to a double. The name of the series is optional when there is only
one series to display.
A series chart view is a probe observer that visualizes series given by x,y
pairs. It is parameterized by:
• the chart name;
• the x axis name;
• the y axis name;
• the type of chart;
• whether it has a legend or not;
• whether it has tool tips or not.
It understands probes of the form: ’series’,[<seriesName>],<xValue>,<yValue>
where the name can be any string and the values are expected to be doubles or
convertible to doubles. The name of the series is optional when there is only
one series to display.
A time chart view is a probe observer that visualizes series of which values
depends on time. It is parameterized by:
CHAPTER 6. THE CONCRETE MODEL EDITOR
56
• the chart name;
• the x axis name;
• the y axis name;
• whether it has a legend or not;
• whether it has tool tips or not;
• whether time is local or global;
• whether time is used straight or converted to date.
It understands probes of the form: ’time’,[<seriesName>],<value> where
the name can be any string and the value is expected to be a double or convertible to a double.The name of the series is optional when there is only one series
to display.
Discrete2DSpaceView
A discrete 2D space view is a probe observer that visualizes spatial information.
The space is considered continuous by default, it becomes discrete when the
number of lines and columns (hence of cells) is specified. The cells are considered
to have layers corresponding to attributes. Only one cell layer can be displayed
at a time. The space is populated by objects of various types. Each object type
also has layers. Each object is referenced by an id which is unique for each type.
The parametrization is as follows:
• one can specify for any cell layer value range a color;
• one can specify for each object type layer value range a shape, a color and
a shadow color.
It understands probes of the forms:
• ’csize’,<width>,<height> to specify the extent of the continuous space;
• ’dsize’,<line>,<column> to specify the number of lines and columns of
the discrete space;
• ’cellLayers’{,<layerName>} to specify the names of the cell layers;
• ’objectLayers’,<type>,{,<layerName>} to specify the names of the
object layers for a given type;
• ’cellState’,<x>,<y>[,<layerName>],<value> to specify the value of a
layer of a cell;
• ’objetState’[,<type>],<id>,[,<layerName>],<value> to specify the
value of a layer of an object;
• ’cPosition’[,<type>],<id>,<x>,<y> to specify the position of an object of a given type in continuous space;
• ’dPosition’[,<type>],<id>,<x>,<y> to specify the position of an object of a given type in discrete space;
CHAPTER 6. THE CONCRETE MODEL EDITOR
57
Figure 6.11: The creation dialog for an output edge.
• ’cellEntity’,<x>,<y>,<port> to specify the entity associated to a cell
(used to associate an observer to it);
• ’objectEntity’[,<type>],<id>,<port> to specify the entity associated
to an object (used to associate an observer to it);
The names can be any string, the values are expected to be doubles or convertible
to a doubles. All other values are integers. The object type is optional if there
is only one object type, and so it is for the layers.
GraphView
Coming soon.
6.3.3
Deleting an output
An output can be deleted by selecting it and selecting Remove... from the Edit
menu, or by right-clicking on it and selecting Remove... in the popup menu.
It is asked whether the output must be removed from the model:
• if yes, the output is removed both from the drawing and the list of existing
outputs defined in the model;
• otherwise, only the drawing is removed but the output remains as an
existing output.
6.3.4
Drawing an output edge
To draw an output edge in a given place it is enough to click on the corresponding
button and then from an individual (called the source individual) to an output
(called the target output), or to right click at the desired place to show up the
same toolbar as a popu menu. A new dialog is opened as illustrated in the figure
6.11.
This dialog is composed of the list of available output edges between the
individual and the output.
6.3.5
Deleting an output edge
An output edge can be deleted by selecting it and selecting Remove... from
the Edit menu, or by right-clicking on it and selecting Remove... in the popup
menu. It is asked whether the output edge must be removed from the model:
CHAPTER 6. THE CONCRETE MODEL EDITOR
58
Figure 6.12: The control panel toolbar.
• if yes, the output edge is removed both from the drawing and the list of
output edges defined for the model;
• otherwise, only the drawing is removed but the output edge remains unchanged.
6.4
Control panel definition
The control panel editor is used to position the various control panel elements
on the control panel. The toolbar is shown in the figure 6.12 where, apart from
the usual buttons, we have two main buttons:
• the green button is used to add an output view to the control panel;
• the yellow button is used to add a parameter editor to the control panel.
The figure 6.13 shows a control panel with two parameter editors (yellow)
and one output view (green).
6.4.1
Drawing an output view
To draw an output view in a given place it is enough to click on the corresponding
button and then at the place where to put the output view, or to right click at
the desired place to show up the same toolbar as a popu menu. A new dialog
is opened as illustrated in the figure 6.14.
This dialog is composed of two parts:
• the upper part lists all the output views available in the selected control
panel. Selecting one of these and typing either return or pushing the
Existing button shall draw the corresponding output view at the selected
place.
• the down part is used to create a new output view with a drop down menu
from which to select one of the output view defined in the concrete model
graph panel (see 6.3).
6.4.2
Deleting an output view
An output view can be deleted by selecting it and selecting Remove... from
the Edit menu, or by right-clicking on it and selecting Remove... in the popup
menu. It is asked whether the output view must be removed from the control
panel:
• if yes, the output view is removed both from the drawing and the list of
output views defined for the control panel;
• otherwise, only the drawing is removed but the output view remains unchanged.
CHAPTER 6. THE CONCRETE MODEL EDITOR
Figure 6.13: The control panel view.
Figure 6.14: The creation dialog for an output view.
59
CHAPTER 6. THE CONCRETE MODEL EDITOR
60
Figure 6.15: The creation dialog for a parameter editor.
6.4.3
Drawing a parameter editor
To draw a parameter editor in a given place it is enough to click on the corresponding button and then at the place where to put the parameter editor or to
right click at the desired place to show up the same toolbar as a popu menu. A
new dialog is opened as illustrated in the figure 6.11.
This dialog is composed of two parts:
• the upper part lists all the parameter editors available in the selected
control panel. Selecting one of these and typing either return or pushing
the Existing button shall draw the corresponding parameter editor at
the selected place.
• the down part is used to create a new parameter editor with two drop
down menus:
– the first one is for selecting one of the individuals created in the
concrete model panel (see 6.1.1);
– the second one is for selecting one of the attribute to edit of the
individual.
6.4.4
Deleting a parameter editor
A parameter editor can be deleted by selecting it and selecting Remove... from
the Edit menu, or by right-clicking on it and selecting Remove... in the popup
menu. It is asked whether the parameter editor must be removed from the
model:
• if yes, the parameter editor is removed both from the drawing and the list
of parameter editors defined for the model;
• otherwise, only the drawing is removed but the parameter editor remains
unchanged.
Chapter 7
Some examples
7.1
Introduction
This chapter is considered as a stepwise tutorial to develop your own models.
All these examples are provided in the distribution in the example folder.
7.2
The rolling ball example
As an example, we shall model a simple system composed of one rolling ball and
a kicker. This example allows the illustration of a combination of continuous
and discrete time:
• the rolling ball is submitted to uniform movement described by the following equations:
x(t) = x0 + vx × t; y(t) = y0 + vy × t
• at random time, the kicker computes a random two-dimensional vector
< kx , ky > which is sent to the ball to change its trajectory in the following
way:
vx = vx + kx ; vy = vy + ky
This example has been programmed in Java and the user could look at
the source code of the package example where the classes Clock, RollingBall,
Kicker and Observer have been defined. To run it, open the project example.pml
in the folder example. The project contains two conceptual models:
Example1:
is the conceptual model of the rolling ball example;
Example2: is the conceptual model of a cellular automata for simulating fire
spread.
To the conceptual models correspond two concrete models defining an instantiation, the definition of some outputs and the associated control panel. To
actually run the simulation, select the corresponding simulation model and successively push on the buttons Reset, Initialize and then Step as many time
as you want (or Run after having entered an end date.
61
CHAPTER 7. SOME EXAMPLES
62
Figure 7.1: The conceptual model for a kicked and observed rolling ball.
7.2.1
Defining the conceptual model
The conceptual model will be composed of two categories: RollingBall and
Kicker. The RollingBall is characterized by four attributes: two for the initial
position (x0 and y0 corresponding to x0 and y0 ) and two for the speed (vx and
vy corresponding to vx and vy ). The Kicker is characterized by one attribute:
the seed of its random generator used for the time of kicking the ball and the
generation of the random vector1 .
If we want to visualize the position of the ball, the event-based nature of the
simulation will only be able to provide state changes when the ball is kicked.
To see the ball rolling between two successive kicks, we have to sample the
trajectory. In order to do that, a third category is added to the model to
sample the trajectory by asking at each fixed time step to the ball its position.
The resulting ontology in shown in figure 7.1.
In addition, you have the definition of three relations:
• kicked which a relation of Kicker to send a kick to a RollingBall. Note
that a Kicker can kick simultaneously any number of balls.
• observer which is a port of RollingBall to send its position to an observer (and it can have as many observers as it wants).
• observed which is a port of Observer to send a request for position (it
will always be a logical influence, of course).
The parameters can be edited (added, changed or removed) through the
category editor as shown in the figure 7.2.
The relations (i.e. the definition of the relation name, cardinality and type)
can be either drawn through the graphical editor or entered in the category
editor dialog as in figure 7.3. If the relation are defined by the category editor,
they will not show up in the graphical editor. They can be visualized by drawing
an arc and specifying an existing link as shown in figure 7.4.
At that stage, the structure of the conceptual model (i.e. the ontology) is
entirely defined: the categories, attributes and relations.
7.2.2
Defining the dynamics
For defining the behavior, you have to define:
• the incoming and outgoing influences;
1 To put the seed as a parameter is recommended if one wants to control the outcome of
the simulation, i.e. to produce exactly the same result for each simulation.
CHAPTER 7. SOME EXAMPLES
63
Figure 7.2: The conceptual model for a rolling ball with the attribute panel.
Figure 7.3: The rolling ball category with the relations panel.
Figure 7.4: Definition of an arc from an existing relation definition
CHAPTER 7. SOME EXAMPLES
64
Figure 7.5: The rolling ball category with the probes panel
• the probes;
• the M-DEVS functions.
We assume that RollingBall receives kicks and observation requests and sends
positions, Kicker sends kicks and the Observer sends observation requests and
receives positions. The checking of the consistency between what is sent or
received is currently very loose but can be reinforced by selecting the “verify”
check-bon in the scheduler. In a future release the possibility to check for
model consistency when defining the conceptual model will be enforced (at least
optionally).
We shall define two identical probes: one for the RollingBall to signal the
state change (new x0, y0, vx and vy, see figure 7.5) and one for the Observer
for the ball position, each time it receives the actual coordinates.
These declarative parts of the dynamics being made, we have to focus on
specifying each of the function of the corresponding M-DEVS model. The figure
7.6 shows how to define the initialization of the rolling ball. In the shown panel,
the Scripting behavior has been selected, which allows to specify the behavior
with script languages. In this case, the Java scripting language has been selected
(JavaInterpreter).
Note that we distinguish the attributes and the state of the model. The attributes define the structure of the ball for an external observer and corresponds
semantically to the specification of its initial state. The state itself changes continuously, spontaneously or in response to incoming influences. In this case the
state is created and initialized from the parameters.
The figure 7.7 shows the code for handling incoming external influences.
The principle is to loop through the set of influences (put in the variable
externalInfluences), to check its type for each one and compute the state
change accordingly. Note that after the state change, a probe value is issued to
update all the possible visualization windows.
CHAPTER 7. SOME EXAMPLES
65
Figure 7.6: The rolling ball category with the initialize panel
The user is asked to further explore the model which is available as an
example, to see how the behaviors are defined in the various scripting languages.
7.2.3
Defining the concrete model
As said before, the definition of the structure and dynamics is part of the conceptual model and cannot be run directly. From the conceptual model, a concrete
and simulatable model can be instantiated. You have to open a concrete model
editor. At the top of the right panel, you have a list of conceptual models you
can take your definitions from. The figure 7.8 shows a window in which a model
has been built by creating an instance of each of the categories (an instance of
clock has been added to define the time rate at which the observer samples the
rolling ball). In this figure, each port is linked to the proper entity. The drawing
panel uses a modified UML object diagram. The links are named (which is not
the case in UML). As in UML, the name of the instances is optional and for
documentation purpose only.
The actual structure of an individual is not only composed by its links but
also by the values of its attributes (interpreted as the specification of the initial
state of the simulation). By editing an individual, the dialog of the figure 7.9
appears where you can change the name of the individual (optional), trace or
untrace the individual2 , define or change the attribute values.
2 while tracing in the scheduler traces the posted and sent influences, tracing an individual
traces the call to the M-DEVS functions.
CHAPTER 7. SOME EXAMPLES
Figure 7.7: The rolling ball category with the external transition panel
Figure 7.8: The concrete model as an instance of the conceptual model.
66
CHAPTER 7. SOME EXAMPLES
67
Figure 7.9: The edition dialog for an individual.
Figure 7.10: The view on the rolling ball state
Once all the model has been instantiated and all the parameters defined (a
further version should also check for the model completeness), the user can open
the scheduler, select the model to run, initialize and run it, either step by step
or in a single run until the end date is reached as described in more details in
the chapter 8.
In addition, a visualization window can be opened. For example, a possible view looks like the figure 7.10 and is updated each time the individuals
change3 . The top left panel displays the clock value, the top right panel displays
“KICKED” for some time each time the kicker is issuing a kick, the bottom left
panel displays the rolling ball state (updated only when kicked) and the bottom
right panel displays the actual position of the ball at each time step.
Such a display cannot be created interactively yet. A number of visualization items can be created, positioned within a control board and linked to the
individuals receiving its probes and using them to update the visualization. An
editor for such a control panel (including the possibility to change the parameters shall be available in a near future.
7.3
The stupid model
In [13], it is proposed as series of simple multi-agent models of increasing complexity to both tach and benchmark the modelling and simulation platforms.
It is used here to illustrate designing models using Mimosa. We shall use the
Python scripting language for the details.
All the examples which follow can be loaded at once by opening the project
StupidModel in the example folder. This project contains the eight versions
3 Sorry
if we did not program a panel to visualize trajectories yet.
CHAPTER 7. SOME EXAMPLES
68
with their corresponding concrete and simulation models. Feel free to lokk at
and to try each of these.
7.3.1
Stupid model 1
A number of bugs are randomly positioned in a toroidal grid and move at fixed
time steps into a random position within a +/- 4 cells distance.
Defining the conceptual model
As suggested in [9], we propose for conceptual modeling to extensively use the
notions of wholes, parts and relations. Hence bugs are parts of a bug population, cells are part of a space, and a position is a relation mapping the bug
population within the space. Accordingly, we propose a conceptual model with
five categories:
BugPopulation : is a population of bugs of which attribute is the number of
bugs;
Bug: is a bug with a given id and, of course, a part of a bug population;
Space: is a set of cells of which attributes are the number of lines and columns;
Cell: is a cell with given x,y coordinates and, of course a part of a space;
Position: is a mapping from the bugs into the cells giving the individual position of each bug. It also encodes the topology of the space by defining the
cells neighborhood. We provide a seed attribute for its random generator.
The resulting conceptual model is shown in the figure 7.11. The position references both the bug population and the space. Each bug knows the position to
be able to position itself and move.
From the dynamical point of view, we shall describe in turn each of the
category.
• the bug population has only the function to create the bug population.
Therefor we define the initialize function as follows:
for i in range(nbBug):
p = port("bug",i)
addPort(p,"StupidModel1.Bug",\
parameters(pair("no",i)))
linkPort(portRef(p,’position’),portRef(’observer’))
sendProbe(’population’,nbBug)
sendLogical(’observer’,’populationSize’,nbBug)
The first four lines are used to generate the bug population. The last two
lines informs the position, respectively any probe observer of the population size.
• the space is doing exactly the same for the cells:
CHAPTER 7. SOME EXAMPLES
69
Figure 7.11: The stupid conceptual model 1
for i in range(nbLine):
for j in range(nbCol):
addPort(port(’cell’,i*nbLine+j),"StupidModel1.Cell",\
parameters(pair(’x’,i),pair(’y’,j)))
sendProbe(’space’,nbLine,nbCol)
sendLogical(’observer’,’spaceSize’,nbLine,nbCol)
• a bug has in charge to position itself randomly at initialization (it could
also be done by the position!), and to move at each time step. For initialization, it just asks to the position to do it4 :
sendLogical(’position’,’randomPlace’,no)
For moving, it is a combination of three functions: λint to say when to
perform the next move, λext to ask the position to move the bug and δint
to perform the internal transition. Given that the only action to do is to
ask the position to move the bug, the latter function does nothing. So we
define λext :
sendExternal(’position’,’randomMove’,no,4)
assuming that position shall perform the random move within the given
distance (4) and λint :
sendInternal(1,’moveRandom’)
• a cell is doing strictly nothing.
4 notice that it is a logical influence because it is just used to initialize the simulation model:
it is not properly speaking an action
CHAPTER 7. SOME EXAMPLES
70
• the position is doing all the work by managing the position of each bug and
by positioning and moving the bugs around on request. The initialization
prepares the needed structures and functions:
populationSize = 0
spaceWidth = 0
spaceHeight = 0
positions = {}
random = newRandom(seed)
def put(id,x,y):
positions[id] = (x,y)
sendProbe(’dPosition’,id,x,y)
In particular, a function to put a bug in a given place is defined and
just adjusts the table of positions and signals the move to any interested
observer. The only external influence it receives is the request for random
moves, so δext is defined as:
for inf in getInfluences(’randomMove’):
id,amount = contentOf(inf)
x,y = positions[id]
incr = nextInt(random,amount)
if nextBoolean(random):
newX = (x+incr)%spaceWidth
else:
newX = (x-incr)%spaceWidth
incr = nextInt(random,amount)
if nextBoolean(random):
newY = (y+incr)%spaceHeight
else:
newY = (y-incr)%spaceHeight
put(id,newX,newY)
The move is randomly generated according to the toroidal grid. Finally,
the position must register the population and grid sizes as well as initialize
the bugs initial positions by defining δint :
for inf in getInfluences(’populationSize’):
populationSize, = contentOf(inf)
for inf in getInfluences(’spaceSize’):
spaceHeight,spaceWidth = contentOf(inf)
sendProbe(’dSize’,spaceHeight,spaceWidth)
for inf in getInfluences(’randomPlace’):
if type(inf,’randomPlace’):
id, = contentOf(inf)
x = nextInt(random,spaceWidth)
y = nextInt(random,spaceHeight)
put(id,x,y)
Notice the possibility to decide the order in which to handle the influences. Here the size declarations are handled before positioning the bugs,
CHAPTER 7. SOME EXAMPLES
71
Figure 7.12: The concrete model 1
although all these influences are received at once. For simplicity, we do
not test whether a cell is already occupied.
Defining the concrete model
Given that the bug population and the space automatically generate the bugs
and the cells. It is enough to define the bug population, the space and the
position, as well as defining the initial values. The resulting concrete model is
illustrated in the figure 7.12. In addition, we define a probe observer to visualize
the position of the bugs in the grid space. The Discrete2DSpaceView (see 6.3.2)
is used for this purpose.
Finally a control panel containing the Discrete2DSpaceView is defined (see
7.13).
Running the simulation model
Finally, the concrete model is used to generate the simulation model for the
scheduler. The scheduler “reset” button is used to actually generate the initial simulation model and the control panel. The “init” button initializes the
simulation model calling the initialization of each initial entity (i.e. the bug
population, the space and the position). It is at this stage that the bugs and
cells are created. Finally, the simulation model is ready to run (see figure 7.14).
7.3.2
Stupid model 2
The bugs are allowed not only to move but also to grow starting from a size of
1 increased incrementally by 1. It is visualized as a changing shade color of the
bugs in the control panel.
CHAPTER 7. SOME EXAMPLES
Figure 7.13: The concrete model 1 control panel
Figure 7.14: The simulation model 1 control panel
72
CHAPTER 7. SOME EXAMPLES
73
Figure 7.15: The conceptual model 2
Defining the conceptual model
The only change in the conceptual model structure is the addition of a relation
from the bug to the population in order to be able to inform it of the size changes
(see figure 7.15).
The only change concerns the bug population to create this new link and
the behavior of each individual bug. It touches:
• the initialization of the bug population:
for i in range(nbBug):
p = port("bug",i)
addPort(p,"StupidModel2.Bug",parameters(pair("no",i)))
linkPort(portRef(p,’position’),portRef(’observer’))
linkPort(portRef(p,’population’),’self’)
sendProbe(’objectLayers’,’bug’,’size’)
sendLogical(’observer’,’populationSize’,nbBug)
where a new port link is created from each bug to the population (notice
the use of the always defined port “self”).
• the initialization of the bug for setting the initial size to 1:
sendLogical(’position’,’randomPlace’,no)
size = 1
sendLogical(’population’,’size’,no,size)
• the λint of the bug to emphasize the double activity:
sendInternal(1,’moveRandomAndGrow’)
• λext of the bug remains the same
CHAPTER 7. SOME EXAMPLES
74
Figure 7.16: The concrete model 2
sendExternal(’position’,’moveRandom’,no,4)
• but the δint of the bug is now doing something:
if type(getInternalInfluence(),’moveRandomAndGrow’):
size = size+1
sendLogical(’population’,’size’,no,size)
Provision is made for the possibility to have a variety of internal behaviors,
hence the test.
• Given the logical influences sent to the bug population, these must be
handled appropriately by defining the δlog of the bug population:
for inf in getAllInfluences():
if type(inf,’size’):
id,size = contentOf(inf)
sendProbe(’objectState’,’bug’,id,’size’,size)
Both in initialization and in the δlog of the bug population, probes are sent for
the visualization of the bug sizes.
Defining the concrete model
In order to account for the bug growth, the concrete model is slightly changed by
adding a link between the bug population and the visualizer in order to monitor
the changes in the bug size. The result is illustrated in the figure 7.16. The
figure 7.17 shows the definition of the color codes parameterizing the visualizer.
Running the simulation model
The figure 7.18 shows the resulting visualization while running the simulation.
A colored shadow appears and is modified while the bugs are growing. It illustrates the possibility to get the probes from various sources to compose a
CHAPTER 7. SOME EXAMPLES
75
Figure 7.17: Defining the visualization of the bug size
single visualization in addition to the possibility to send probes to a variety of
observers.
7.3.3
Stupid model 3
The cells contain food of which quantity is growing over time. The bugs are
eating what is on the current cell and grow accordingly.
Defining the conceptual model
The resulting conceptual model is shown in the figure 7.19. The only modification is the reciprocal relation between the bug and the cell because of their
interactions.
Because of the important induced changes, we shall describe again in turn
each of the category.
• the bug population does not incur any change because everything is in
place for monitoring the bug size changes.
• the space has to work the same way as the bug population for monitoring
the cell food availability. Consequently, a link has to be created from each
cell to the space:
for i in range(nbLine):
for j in range(nbCol):
cell = port(’cell’,i*nbCol+j)
addPort(cell,"StupidModel3.Cell",\
parameters(pair(’x’,i),pair(’y’,j)))
linkPort(portRef(cell,’space’),’self’)
sendProbe(’cellLayers’,’food’)
sendLogical(’observer’,’spaceSize’,nbLine,nbCol)
# <= HERE
As for the bug population, the space is informed of the food availability
changes through logical influences to be handled by the δlog function:
for inf in getAllInfluences():
if type(inf,’food’):
CHAPTER 7. SOME EXAMPLES
Figure 7.18: The simulation model 2 control panel
Figure 7.19: The stupid conceptual model 3
76
CHAPTER 7. SOME EXAMPLES
77
x,y,food = contentOf(inf)
sendProbe(’cellState’,x,y,’food’,food)
• a bug has now in charge to define its size and maximum consumption rate
at initialization:
size = 1
maxConsumptionRate = 1
sendLogical(’position’,’randomPlace’,no)
sendLogical(’population’,’size’,no,size)
For moving and eating, it is again the combination of three functions:
λint to say when to perform the next actions, λext to ask the position to
move the bug and the cell to get food, and δint to perform the internal
transition. Given that the only actions are requests to others, the latter
function does nothing as in function one. So we define λext :
sendExternal(’position’,’randomMove’,no,4)
sendExternal(’cell’,’consume’,maxConsumptionRate)
and λint :
sendInternal(1,’moveRandomAndEat’)
Finally, the cell shall inform the bug of the eaten quantity by a logical
influence to be handled by δlog :
for inf in getAllInfluences():
if type(inf,’consumed’):
consumed, = contentOf(inf)
size = size+consumed
sendLogical(’population’,’size’,no,size)
The bug grows according to the actually received food. The influence
could have been an external influence, but, because an external influence
is only issued at the next transition, the food would have been consumed
only at the next step.
• a cell has now a certain quantity of food which is growing over time. Additionally, it has to react to food consumption requests. The initialization
becomes as follows:
availableFood = 0
maxFoodProduction = 0.1
rand = newRandom(6538672547)
sendLogical(’space’,’food’,x,y,availableFood)
Notice that the growth is random within a given range (maxFoodProduction). The spontaneous growth is managed by the usual functions λint :
sendInternal(1,’grow’)
CHAPTER 7. SOME EXAMPLES
78
and δint :
availableFood = availableFood+maxFoodProduction*nextDouble(rand)
sendLogical(’space’,’food’,x,y,availableFood)
The reaction to the consumption request is naturally managed by δext :
for inf in getAllInfluences():
if type(inf,’consume’):
request, = contentOf(inf)
consumption = min(request,availableFood)
sendLogical(’bug’,’consumed’,consumption)
availableFood = availableFood-consumption
sendLogical(’space’,’food’,x,y,availableFood)
where the consumption depends on both the request and the available
food. However, it could happen that the spontaneous growth and the
consumption occurs at the same time, provoking a confluent transition
δext . It combines both δint and δext and decides in which order things
happen (in this case growth is before consumption):
for inf in getAllInfluences():
if type(inf,’consume’):
availableFood = availableFood+maxFoodProduction*nextDouble(rand)
request, = contentOf(inf)
consumption = min(request,availableFood)
sendLogical(’bug’,’consumed’,consumption)
availableFood = availableFood-consumption
sendLogical(’space’,’food’,x,y,availableFood)
• the position incurs only one change: changing the position of a bug implies
to modify the reciprocal links between the bug and the cell it is on:
def put(id,x,y):
bug = port(’bug’,id)
newCell = port(’cell’,y*spaceWidth+x)
if id in positions:
oldX,oldY = positions[id]
oldCell = port(’cell’,oldY*spaceWidth+oldX)
removePort(portRef(’population’,bug,’cell’))
removePort(portRef(’space’,oldCell,’bug’))
positions[id] = (x,y)
linkPort(portRef(’population’,bug,’cell’),portRef(’space’,newCell))
linkPort(portRef(’space’,newCell,’bug’),portRef(’population’,bug))
sendProbe(’dPosition’,’bug’,id,x,y)
It illustrates the full power of the link references to remove and create
links dynamically throughout the simulation.
CHAPTER 7. SOME EXAMPLES
79
Figure 7.20: The concrete model 3
Defining the concrete model
In order to account for the cell food availability, the concrete model is slightly
changed by adding a link between the space and the visualizer in order to also
monitor the changes in the food availability. The result is illustrated in the figure
7.20. The figure 7.21 shows the definition of the color codes parameterizing the
visualizer.
Running the simulation model
The figure 7.22 shows the resulting visualization while running the simulation.
The cell colors are shown according to the quantity of available food. Once
again it illustrates the possibility to combine multiple sources of data within a
single visualization.
7.3.4
Stupid model 4
This version does not add any new behavior but provides the possibility to
monitor individually the cells and bugs through the grid interface.
Defining the conceptual model
The conceptual model structure does not change and remains the one shown in
the figure 7.19. The grid visualizer as described in 6.3.2 already provides the
possibility to probe the cells and objects which are visualized. However, for it
to work:
• the BugPopulation and the Space must provide the ports to access the
entities to monitor by using the probes ’cellEntity’,<x>,<y>,<port>
and ’objectEntity’,<type>,<id>,<port> as described in 6.3.2.
• each cell and bug must also send probe to advertise their state changes.
Accordingly:
CHAPTER 7. SOME EXAMPLES
Figure 7.21: Defining the visualization of the food availability
Figure 7.22: The simulation model 3 control panel
80
CHAPTER 7. SOME EXAMPLES
81
• the bug population does inform the probe observer for each of its bugs:
for i in range(nbBug):
p = port("bug",i)
addPort(p,"StupidModel4.Bug",parameters(pair("no",i)))
linkPort(portRef(p,’position’),portRef(’observer’))
linkPort(portRef(p,’population’),’self’)
sendProbe(’objectEntity’,’bug’,i,p) # <= HERE
sendProbe(’objectLayers’,’bug’,’size’)
sendLogical(’observer’,’populationSize’,nbBug)
• the space has to do the same thing for its cells:
for i in range(nbLine):
for j in range(nbCol):
cell = port(’cell’,i*nbCol+j)
addPort(cell,"StupidModel4.Cell",\
parameters(pair(’x’,i),pair(’y’,j)))
linkPort(portRef(cell,’space’),’self’)
sendProbe(’cellEntity’,i,j,cell) # <= HERE
sendProbe(’cellLayers’,’food’)
sendLogical(’observer’,’spaceSize’,nbLine,nbCol)
• each bug has to send probes when its state changes in its initialization:
size = 1
maxConsumptionRate = 1
sendLogical(’position’,’randomPlace’,no)
sendLogical(’population’,’size’,no,size)
sendProbe(’size’,no,size)
# <= HERE
and in its growth behavior (δlog ):
for inf in getAllInfluences():
if type(inf,’consumed’):
consumed, = contentOf(inf)
size = size+consumed
sendLogical(’population’,’size’,no,size)
sendProbe(’size’,no,size)
# <= HERE
• and the same for the cells, as an example, in initialize:
availableFood = 0
maxFoodProduction = 0.1
rand = newRandom(6538672547)
sendLogical(’space’,’food’,x,y,availableFood)
sendProbe(’food’,x,y,availableFood) # <= HERE
but also in δext , δint and δcon .
CHAPTER 7. SOME EXAMPLES
82
Figure 7.23: Choosing a probe observer for cells and bugs
Defining the concrete model
The concrete model remains strictly the same.
Running the simulation model
The figure 7.23 shows dialog which appears when clicking on a cell. There are
two drop down menus:
• the top one is a list containing the clicked cell if any (there is no cell in a
continuous space) and the objects in the cell or around the click position.
• the bottom is a list of available probe observers for monitoring the chosen
object.
Clicking on the “add” button creates and connects the chosen probe observer.
7.3.5
Stupid model 5
This version still does not add any new behavior but provides the possibility to
parameterize the simulation by the initial number of bugs, the maximum daily
food consumption of the bugs and the maximum food production of the cells.
Defining the conceptual model
The conceptual model structure changes slightly to have the maximum food
consumption and food production appear as attributes in the relevant categories
(see 7.24). Now each cell and bug has the maximum food consumption and
production as attributes, as well as the bug population and space because these
two last categories are in charge of initializing the bugs and cells respectively.
Accordingly:
• the bug population does initialize each bug:
for i in range(nbBug):
p = port("bug",i)
addPort(p,"StupidModel5.Bug",\
parameters(pair("no",i),\
pair("maxFoodConsumption",maxFoodConsumption))) # <= HERE
linkPort(portRef(p,’position’),portRef(’observer’))
linkPort(portRef(p,’population’),’self’)
sendProbe(’objectEntity’,’bug’,i,p)
sendProbe(’objectLayers’,’bug’,’size’)
sendLogical(’observer’,’populationSize’,nbBug)
CHAPTER 7. SOME EXAMPLES
83
Figure 7.24: The stupid conceptual model 5
• the space has to do the same thing for its cells:
for i in range(nbLine):
for j in range(nbCol):
cell = port(’cell’,i*nbCol+j)
addPort(cell,"StupidModel5.Cell",\
parameters(pair(’x’,i),pair(’y’,j),\
pair(’maxFoodProduction’,maxFoodProduction))) # <= HERE
linkPort(portRef(cell,’space’),’self’)
sendProbe(’cellEntity’,i,j,cell)
sendProbe(’cellLayers’,’food’)
sendLogical(’observer’,’spaceSize’,nbLine,nbCol)
• each bug and each cell has now this variable defined and, therefore, it is
no longer necessary to initialize it separately.
Defining the concrete model
Given the need to define the maximum food production and consumption for
the space and the bug population respectively in addition to the initial bug
population, the concrete model includes these two new attributes. The result
is illustrated in the figure 7.25. The control panel is now changed to add three
new parameters editor (see 7.25). In effect, any attribute of the concrete model
can be associated to an editor to be put on the control panel if needed.
CHAPTER 7. SOME EXAMPLES
Figure 7.25: The concrete model 5
Figure 7.26: The control panel 5 with the attribute editors
84
CHAPTER 7. SOME EXAMPLES
85
Figure 7.27: The control panel
Running the simulation model
The figure 7.31 shows the control panel in which the three editors for the parameters are displayed and can be changed before initializing the model (after
initialization, the changes in the parameter values are no longer taken into account until the next initialization).
7.3.6
Stupid model 6
This version still does not add any new behavior but provides the possibility to
display an histogram of the bug sizes.
Defining the conceptual model
The conceptual model structure does not change and remains the one of the
figure 7.24. The only difference is for the bug population to compute a size
distribution and to signal the changes of this distribution to any interested
probe observer:
CHAPTER 7. SOME EXAMPLES
86
• in the bug population two data structures are added: one for recording
the bug sizes and the histogram itself (here with 10 bins):
import math
bugSizes = []
sizeHisto = []
for i in range(10):
sizeHisto.append(0)
sendProbe(’category’,i,’size’,0)
for i in range(nbBug):
p = port("bug",i)
bugSizes.append(0)
addPort(p,"StupidModel6.Bug",\
parameters(pair("no",i),\
pair("maxFoodConsumption",maxFoodConsumption)))
linkPort(portRef(p,’position’),portRef(’observer’))
linkPort(portRef(p,’population’),’self’)
sendProbe(’objectEntity’,’bug’,i,p)
sendProbe(’objectLayers’,’bug’,’size’)
sendLogical(’observer’,’populationSize’,nbBug)
Each time the sizes of the bug sizes are signaled through logical influences,
the histogram is updated in δlog :
for inf in getAllInfluences():
if type(inf,’size’):
id,size = contentOf(inf)
bugSizes[id]=size
sendProbe(’objectState’,’bug’,id,’size’,size)
for i in range(len(sizeHisto)):
sizeHisto[i] = 0
for size in bugSizes:
if size>10:
sizeHisto[9] += 1
else:
sizeHisto[int(size)] += 1
for i,v in enumerate(sizeHisto):
sendProbe(’category’,i,’size’,v)
Nothing else is needed. Notice that the systematic use of aggregates like the
bug population and the space simplifies dramatically how to compute aggregated values as the histogram. A similar computation could be done for the
distribution of food availability.
Defining the concrete model
In the concrete model, one must add a new visualizer for the histogram and link
it to the bug population instance. The result is illustrated in the figure 7.28. The
histogram visualizer is described in the section 6.3.2 and can be parameterized
as shown in the figure 7.25. The control panel is now changed to add three new
parameters editor (see 7.31). In effect, any attribute of the concrete model can
be associated to an editor to be put on the control panel if needed.
CHAPTER 7. SOME EXAMPLES
Figure 7.28: The concrete model 6
Figure 7.29: The parameters for a histogram visualizer
87
CHAPTER 7. SOME EXAMPLES
88
Figure 7.30: The control panel 6 specification with the new histogram
Running the simulation model
The figure 7.30 shows the control panel in which the new histogram is shown
after 18 steps.
7.3.7
Stupid model 7
This version illustrates the possibility to stop the simulation when some conditions occur. In this case the condition is when a bug gets a certain size.
Defining the conceptual model
The conceptual model structure does not change and remains the one of the
figure 7.24. The only difference is for the bug stop the simulation when a given
condition arises:
• in the bug growth (i.e. in δlog ) the condition is tested and the simulation
stopped is met:
for inf in getAllInfluences():
if type(inf,’consumed’):
consumed, = contentOf(inf)
size = size+consumed
sendLogical(’population’,’size’,no,size)
sendProbe(’size’,no,size)
if size > 3:
# <= HERE
stop()
CHAPTER 7. SOME EXAMPLES
89
Figure 7.31: The control panel with the histogram
Running the simulation model
The simulation shall stop whenever the end date or the condition is met, either
case comes first. If one want the simulation to stop only when the condition is
met, one must provide a very large end date. It is thought as being a security
in case the condition is never met.
7.3.8
Stupid model 8
This version illustrates the possibility to output information to a file. In this
case, it is desired to output the minimum, mean and maximum bug size at each
cycle.
Defining the conceptual model
The conceptual model structure does not change and remains the one of the
figure 7.24. The only difference is the computation of the desired values:
• all the necessary information is already recorded in the bug population for
the histogram. It is easy to also compute the min, max and mean from the
available information each time the sizes change in δlog (the management
of the histogram has been removed for readability):
for inf in getAllInfluences():
if type(inf,’size’):
CHAPTER 7. SOME EXAMPLES
90
Figure 7.32: The concrete model 8
id,size = contentOf(inf)
bugSizes[id]=size
sendProbe(’objectState’,’bug’,id,’size’,size)
min = max = bugSizes[0]
mean = 0
for size in bugSizes:
mean += size
if size<min:
min = size
elif size>max:
max = size
mean = mean/len(bugSizes)
sendProbe(’sizes’,min,mean,max)
Defining the concrete model
It is enough to add to the concrete model a new probe observer for the output
of the probe information to a file. A probe observer is already defined for this
purpose and described in the section 6.3.2. The resulting concrete model is illustrated in the figure 7.32. The probe observer can be parameterized as illustrated
in the figure 7.33. Here we choose to not output the dates of occurrence.
Running the simulation model
The result of the simulation on 10 steps is shown in figure 7.34.
CHAPTER 7. SOME EXAMPLES
Figure 7.33: The file output parametrization
Figure 7.34: The result of the simulating the stupid model 8
91
Chapter 8
The scheduler
This chapter is really about running simulations. The concrete models one
wants to run are available from the drop down menu on the top of the scheduler
window (see 8.1). All the models defined in the concrete model editor are shown
in this drop down menu to select from. Additionally, files can be loaded within
the scheduler if saved in the scheduler format from the concrete model editor.
This possibility is offered to deliver turn key models to be run independently of
all the previously described editors.
A concrete model has to be selected from the list on the left. The initialize
button shall actually generate the simulation model out of the concrete model
description. The first step shall initialize the simulation model (the time shall
remain at 0). Further steps shall advance the time depending on the closest
scheduled next date.
In the scheduler menu, the first item opens an inspector to visualize the list
of all created entities (see 8.2). This list is updated during the simulation to
reflect the current list of entities. Clicking on an entity opens an entity inspector
to monitor what is going on in the given entity (see figure 8.3). The panel is
divided in four panes:
• the first pane lists the current parameters of the entity and their values;
• the second pane is the list of current ports with the list of entities their
are associated to;
• the third pane is used for managing the probe observers;
• finally the fourth pane displays the warning messages when necessary.
Figure 8.1: The scheduler window.
92
CHAPTER 8. THE SCHEDULER
93
Figure 8.2: The main inspector window.
The most important pane certainly is the third pane because it monitors
what is going on inside of the inspected entity. It is composed of a drop-down
menu for selecting a probe observer and a panel to display the probe observer
when it is displayable. By default, two probe observers are available:
• the probe view which displays the probes when received one after the
other. A button to clear the display is available if necessary;
• the probe output which send the probes to a file. When selecting the
probe observer, a file name as well as a separator string is asked. The
resulting file can be loaded in excel or any similar tool.
At each time step it is possible to open a window showing the structure of
the simulated model as a graph where each node is an entity and each edge is
a connection between the entities. The corresponding window is shown in the
figure 8.4 and is made of three parts:
• The upper part is a drop down menu to select the kind of graph manipulation: either transforming for changing the place of the graph, zoom it in
or out, etc., or picking for selecting one node and move it on the screen;
• The graph itself;
• A button to switch between two algorithms to layout the graph. Choose
the one which seems more appropriate to visualize the model.
CHAPTER 8. THE SCHEDULER
Figure 8.3: The entity inspector window.
94
CHAPTER 8. THE SCHEDULER
Figure 8.4: The graph of the simulated model.
95
Appendix A
Introduction to Scheme
Scheme is a functional language close to Lisp but with a purer semantics.
Roughly speaking only two constructs are provided in scheme:
• the function (called procedure in the Scheme community) written: (lambda
<parameters> <body>) where parameters is a list of parameter names
and body is a sequence of expressions.
• the application written (<function> <arg1>. . .<argn>) where function
is a function as defined before and argi are expressions.
Of course, an expression is either a function or an application. This seems overly
simplistic but it has been shown that it is enough to express any computation
one could dream of. Nevertheless, the resulting syntax would become unreadable
for any reasonable computation. The simplest way to overcome this problem
is to provide the possibility to associate names to expressions with the form:
(define <name> <expressions>). A number of names have been predefined
in Scheme for all the current arithmetic operations as well as the operations on
very common data structures.
By the way, define is not a function name but the name of a syntactic
form which is transformed behind the scene in a proper application. The set
of possible syntactic forms can itself be extended, parameterizing the Scheme
interpreter with high level constructs at will (not explained in this introduction).
A structure or object is also called a literal expression is of the form: (quote
<something>) or (alternatively) ’<something>. The something is either:
• a number
• #t and #f
• a character #\..
• a string "..."
• a symbol
• a pair (<something1> .
<somethingn>) or a list (<something1>. . .<somethingn>)
• a vector #(<something1>. . .<somethingn>)
96
APPENDIX A. INTRODUCTION TO SCHEME
97
The first four categories do not need the quote because they self-evaluate, i.e.
their value is themselves.
Finally, an additional power is acquired by the relationships between structures (or objects) and expressions. Of course, expressions transform structures
into structures (it is what functions or all about). The nice thing is that (eval
<exp>) transforms the structure produced by the expression into an expression...and computes its value as well. Therefore, one can write programs producing programs which are further executed.
This appendix is not suppose to give a full course on Scheme but just provide a summary of the most common definitions for reference, including the
definitions introduced for use within Mimosa.
A.1
Control syntax
As in any language, there are some constructs for the usual control structures:
the sequence, the conditional and the loop.
(define <symbol> <exp>)
the definition
(set! <symbol> <exp>)
to change the definition
(begin <exp1 >. . .<expn >)
the sequence of expressions
(if <exp> <exptrue > <expf alse >)
the conditional
(cond (<exp1> . . .). . .(else . . .)) the multiple contitional
(or <exp1>. . .<expn>)
sequence until true
(and <exp1 >. . .<expn >)
sequence until false
The loop is more complicated with the form (do (<iter1>. . .<itern >) (<cond>
. . .) . . .) where iteri is a variable of iteration of the form (<vari > <expinit >
<expstep >) with a variable name, an initialization expression and a step computation expression, the condition expression must be true for stopping the
iteration and the corresponding expressions are computed accordingly.
Finally, one must introduce the binding construct to create local variables
for various purposes:
(let ((<sym1> <exp1 >) . . .) <expi >. . .)
parallel binding
(let* ((<sym1> <exp1>) . . .) <expi >. . .)
sequential binding
(letrec ((<sym1> <exp1>) . . .) <expi >. . .)
complete binding
The main difference is that the association of values to symbols are avalaible
from the body alone in the first case, directly after the definition (and then for
the next definitions) in the second case and from the start in the third (allowing
self reference).
A.2
Booleans
There are two booleans #t and #f which are two symbols which evaluates to
themselves. Apart from and and or, we also have the following functions:
(boolean? <exp>)
tests if boolean
(not <exp>)
the negation
(eq? <exp1> <exp2>)
strict equality
(eqv? <exp1 > <exp2 >)
slight extension of strict equality
(equal? <exp1> <exp2 >) recursive (or structural) equality
APPENDIX A. INTRODUCTION TO SCHEME
A.3
98
Numbers
Scheme recognizes the integers (e.g. 51236457), rationals (e.g. 6235645/23672573),
reals (e.g. 4.6565e-3) and complex numbers (e.g. 3+5i). The main distinction
is between exact and inexact representations of these. The predefined functions
are:
(number? <exp>)
tests if number
(complex? <exp>)
tests if complex
(real? <exp>)
tests if real
(rational? <exp>) tests if rational
(integer? <exp>)
tests if integer
(exact? <exp>)
tests if exact
(inexact? <exp>)
tests if inexact
(zero? <exp>)
tests if zero
(positive? <exp>) tests if positive
(negative? <exp>) tests if negative
(odd? <exp>)
tests if odd
(even? <exp>)
tests if even
(= x1 . . .)
equality
(< x1 . . .)
monotonically increasing
(> x1 . . .)
monotonically decreasing
(<= x1 . . .)
monotonically non decreasing
(>= x1 . . .)
monotonically non increasing
(abs x)
the absolute value of the number
(min x1 . . .)
the min of the numbers
(max x1 . . .)
the max of the numbers
(+ z1 . . .)
the sum of the numbers
(- z1 . . .)
the difference of the numbers
(* z1 . . .)
the product of the numbers
(/ z1 . . .)
the quotient of the numbers
(quotient n1 n2 )
the quotient of the numbers
(remainder n1 n2 )
the remainder of the numbers
(modulo n1 n2 )
the modulo of the numbers
(gcd n1 . . .)
the greatest common divisor of the numbers
(lcm n1 . . .)
the lowest common multiple of the numbers
(numerator q)
the numerator of the rational
(denominator q)
the denominator of the rational
(floor x)
the floor of the real
(ceiling x)
the ceiling of the real
(truncate x)
the truncate of the real
(round x)
the round of the real
(real-part z)
the real part of the complex
(imag-part z)
the imaginary part of the complex
As well as most transcendant functions.
A.4
Dotted pairs and lists
The most common data structure in Scheme is the dotted pair written (<left>
. <right>). A list (<elt1 > <elt2> . . . <eltn>) is nothing but (<elt1 > .
APPENDIX A. INTRODUCTION TO SCHEME
99
(<elt2> . . . . (<eltn > . ()). . .) where () is the empty list. We have the
following functions:
(pair? <exp>)
tests if dotted pair
(null? <exp>)
tests if empty list
(list? <exp>)
tests if empty list or dotted pair
(car <exp>)
left of dotted pair or first element of list
(cdr <exp>)
right of dotted pair or rest of list
(set-car! <pair> <obj>)
modifies left of dotted pair
(set-cdr! <pair> <obj>)
modifies right of dotted pair
(list <obj1> . . . <objn>)
creates a list
(length <list>)
length of a list
(reverse <list>)
reverse of a list
(list-tail <list> <k>)
the k-th rest of a list
(list-ref <list> <k>)
the k-th element of a list
(append <list1> . . . <listn>) append of lists
(memq <object> <list>)
member using eq?
(memv <object> <list>)
member using eqv?
(member <object> <list>)
member using equal?
An additional structure is the so-called a-list which is a list of pairs whose car is
considered as a key and the cdr as the associated value. The related functions
are:
(assq <object> <list>)
has key using eq?
(assv <object> <list>)
has key using eqv?
(assoc <object> <list>) has key using equal?
and returns the found pair if any, #f otherwise.
A.5
Mimosa primitives
For Mimosa, we added three very common control structures for better readability:
(when <cond> <exp1>. . .<expn>)
executes if #t
(unless <cond> <exp1 >. . .<expn>)
executes if #f
(for (<var> <list>) <exp1>. . .<expn>) a simple loop over a list
(times (<var> <nb>) <exp1>. . .<expn>) a simpler loop repeated nb times
Some functions are provided to access the Mimosa random generator:
(newRandom <seed>)
creates a random generator
(nextBoolean <random>) generates a boolean randomly
(nextInt <random> <n>) generates an integer from 0 to n
(nextDouble <random>)
generates a real from 0 to 1
Finally, the access to the DEVS entity functionalities are provided as follows:
• the variable self is linked to the current Java state;
• for each parameter, the variable with the same name is defined with the
associated value within the global context. It can additionally be accessed
through the function (getParameter <sym>);
• when a script for a DEVS function is called, the global variable time is
linked to the duration elapsed since the last internal or external transition;
100
APPENDIX A. INTRODUCTION TO SCHEME
• each influence is a Java object whose structure can be accessed by the
following functions:
(is <influence> <name>)
(contentOf <influence>)
(getAllInfluences)
(getInfluence <name>)
(getInternalInfluence)
#t if the influence has the given name
the list of arguments
the list of incoming influences
the list of influences of the given name
the internal influence
• the various events can be posted with the following functions:
(port <sym> n1 . . . nn )
(sendExternal <port> <sym> <exp1>. . .<expn>)
(sendInternal n <sym> <exp1 >. . .<expn >)
(sendLogical <port> <sym> <exp1 >. . .<expn >)
(reply <influence> <sym> <exp1>. . .<expn>)
(sendProbe <sym> <exp1 >. . .<expn >)
creates a port
post an external event
post an internal event
post a logical event
reply to an influence
post a probe
A port can be a string or a symbol when there is no indices.
Finally the structure changes can be made through the following functions:
(portRef <port1>. . .<portn>)
creates a port reference
(pair <sym> <exp>)
creates a pair for the parameters
(parameters <pair1>. . .<pairn>)
creates parameters from the pairs
(addPort <portref> <category> <parameters>) creates a new entity
(linkPort <portref1> <portref2>)
links referenced ports
(removePort <portref>)
removes a references port
Appendix B
Introduction to Smalltalk
Smalltalk is a pure object oriented language but here a simplified version of
which documentation can be found in [1] is used. The following section provides
the primitives for Mimosa.
B.1
Mimosa primitives
In general, we defined the class Self with the class methods which are defined
in this section.
For Mimosa, we added two methods to create and access local variables (it
is guaranteed to have a copy of these for each entity):
Self at: <var> put: <value> to create or change a local variable
Self @ <var>
to access the local variable value
Some functions are provided to access the Mimosa random generator:
Self newRandom
creates a random generator
Self newRandom: <seed>
creates a random generator
Self nextBoolean: <random>
generates a boolean randomly
Self nextInt: <random> in: <n> generates an integer from 0 to n
Self nextDouble: <random>
generates a real from 0 to 1
Finally, the access to the DEVS entity functionalities are provided as follows:
• for each parameter, the variable with the same name is defined with the
associated value within the local variables. It can be accessed through the
method Self @ <parameter>;
• when a script for a DEVS function is called, the local variable time is
linked to the duration elapsed since the last internal or external transition
and can be accessed by Self @ <time>;
• each influence is a Java object whose structure can be accessed by the
following functions:
Self
Self
Self
Self
Self
is: <influence> type: <name>
contentOf: <influence>
getAllInfluences
getInfluences: <name>
getInternalInfluence
101
True if the influence has the given name
the list of arguments
the list of incoming influences
the list of influences of the given name
the internal influence
APPENDIX B. INTRODUCTION TO SMALLTALK
102
• the various events can be posted with the following functions where the
arguments are expected to be an array:
Self
Self
Self
Self
Self
Self
Self
Self
Self
Self
Self
port: <name> index: <ind>
sendExternal: <port> name: <sym>
sendExternal: <port> name: <sym> withArguments: <args>
sendInternal: n name: <sym>
sendInternal: n name: <sym> withArguments: <args>
sendLogical: <port> name: <sym>
sendLogical: <port> name: <sym> withArguments: <args>
reply: <influence> name: <sym>
reply: <influence> name: <sym> withArguments: <args>
sendProbe: <sym>
sendProbe: <sym> withArguments: <args>
creates a indexed port
post an external event w
post an external event
post an internal event w
post an internal event
post a logical event with
post a logical event
reply to an influence wit
reply to an influence
post a probe without ar
post a probe
A port can be a string or a symbol when there is no indices.
Finally the structure changes can be made through the following functions:
Self portRef: <args>)
Self pair: <sym> with: <exp>)
Self parameters: <pairs>)
Self addPort: <portref> type: <category> parameters: <parameters>)
Self linkPort <portref1> to: <portref2>)
Self removePort: <portref>)
Self die
creates a port refe
creates a pair for
creates parameter
creates a new enti
links referenced p
removes a referenc
destroys itself
Appendix C
The structure package
The aim of the structure package is first to provide the new data structures
suitable to represent the structural part of the model as well as, eventually, the
information exchanged by the DEVS modules. In the long run, this generic
data structure is assumed to be the target implementation described by an
ontology. Therefore, we also developed an ontology language structure suitable
to be mapped into this implementation. For the time being, it is used to provide
useful data structures for implementing the DEVS module states.
The structure package is divided into four main boxes:
• The data box implements the data structure itself. The management of
dimensions, units, quantities and references is factored out for genericity.
• The meta-data box implements the description of the data structures. It
is used for consistency checking in data structure manipulations.
• The assertion box (abox) implements the corresponding part of the ontology language. It is implemented to test its capability to fully generate an
associated data structure.
• The terminological box (tbox) implements the corresponding part of the
ontology language. It is implemented to test its capability to derive a
corresponding abox in the one end, and the meta-data structure on the
other end.
C.1
The meta-data box
The meta-data box (in the package structure.metabox) is described first because it defines the structure of the data box, and, in particular, constrains the
set of possible value structures. This box introduces the notion of Classifier.
A classifier is the specification of a set of possible value structures. In particular, it defines a test whether a value is in the given set. For the time-being the
classifiers are defined into four categories:
• the types to describe the data structures within hierarchies of descriptions;
• the dimensions to describe the quantities;
103
APPENDIX C. THE STRUCTURE PACKAGE
104
• the tests to describe possible values in intension;
• the values to describe themselves.
A classifier defines only one important method:
check(Value value): that returns true if the value is member of the set specified by the classifier, false otherwise .
C.1.1
The types
A type is the representation of a set of values. The types are organized into
hierarchies specifying set inclusions. For example, LivingBeing is a type describing the set of all living beings. Animal is the set of all the animals, which
happens to be a subset of LivingBeing. LivingBeing is said to be the super
type of Animal and, conversely, Animal is said to be a subtype of LivingBeing.
A type does not need to have a name, allowing for anonymous types. Therefore
we have two constructors:
Type(): for anonymous types;
Type(String name): for named types.
Used this way, having the same name does not mean it is the same type. We
use name spaces to guarantee this property (see section ??).
A type is an instance of the class Type with the following methods:
addSubtype(Type type): adds a subtype to a type;
setSupertype(Type type): sets the super type of a type (a type can only
have one super type);
removeSubtype(String symbol): removes a subtype from a type;
isSubtypeOf(Type type): checks whether it is a subtype of the given type;
isSupertypeOf(Type type): checks whether it is a supertype of the given
type;
C.1.2
The dimensions
The quantities are anything that result from a measure or a count. More than
one feature can be measured or counted on an object. For example, one can
measure the weight or the height of a tree, or the number of apples in it. The
feature that can be measured or counted is called the dimension. More specifically, something is measured along a dimension called a magnitude, or counted
along a dimension called a multitude. Therefore, the length, the weight or the
number of apples are dimensions and any quantity is characterized by the dimension it measures. Weights and lengths are magnitudes, while the number of
apple is a multitude. The International System of Measure defines seven atomic
dimensions or magnitudes to describe all the possible physical dimensions: the
length, the duration, the mass, the electric current, the thermodynamic temperature, the amount of substance, and the luminous intensity. Any other physical
dimension can be expressed as a combination of those using multiplication or
APPENDIX C. THE STRUCTURE PACKAGE
105
power. For example, the acceleration is a length multiplied by a duration at
the power −2, or, equivalently, a length divided by a duration at the power 2.
We generalize the idea by providing the possibility to define an arbitrary set
of atomic dimensions (like, for example, the monetary value or the number of
apples), all the others being combinations of those. Additionally, let us mention
the special case of the dimensionless dimensions obtained when dividing a dimension by itself (for example, a length by a length) as it is the case for ratios
and angles for example.
The dimension spaces
Given a set D of atomic dimensions, any dimension is a combination of these
atomic dimensions, using the operations ∗, / and the relative integral powers.
It is easy to see that the operations ∗ and / behave like the + and − operations
of a vector space of dimension |atomic(D)| and the power as the multiplication
by an integer. Therefore, we propose to represent the set of all the possible
dimensions as a vector space S = (K, +, ∗) where K = Z is the set of relative
integers, + is the vectorial sum and ∗ the multiplication by an element of Z.
Any vector space S of dimensions is implemented as an instance of the class
DimensionSpace with the following methods:
add(String symbol): creates and defines a new magnitude (dimension) noted
with the given symbol;
add(Type type): creates and defines a new multitude (dimension) defined as
a number of instances of the given type;
getDimensions(): to get the ordered list of atomic dimensions;
getSize(): to get the number of defined dimensions;
isCompatible(DimensionSpace dimensionSpace): true if the two dimension
space are compatible.
A dimension space will be the reference for all the dimensions defined as a
combination of these atomic dimensions. In particular, it is not possible to
combine two dimensions from two incompatible dimension spaces.
The DimensionSpace class defines the following constant:
• ONE as the dimensionless dimension with no symbol;
as well as the following constructors:
DimensionSpace(DimensionSpace... dimensionSpaces): that creates and
defines a new dimension space as a combination (possibly empty) of existing dimension spaces.
The possibility to build dimension spaces from others allows to factorize the
definitions that are very often used, although not necessarily standardized. In
particular, it allows to build on the following predefined dimension spaces:
• the physical dimension space defines once and for all the seven standard
physical dimensions;
• the economic space defines the monetary value dimension.
APPENDIX C. THE STRUCTURE PACKAGE
106
The physical dimension space, referenced by PhysicalSpace.PHYSICAL_SPACE
is defined with the seven basic physical dimensions:
• PhysicalSpace.LENGTH with the symbol L;
• PhysicalSpace.MASS with the symbol m;
• PhysicalSpace.DURATION with the symbol t;
• PhysicalSpace.ELECTRIC_INTENSITY with the symbol I;
• PhysicalSpace.TEMPERATURE with the symbol θ;
• PhysicalSpace.AMOUNT_OF_SUBSTANCE with the symbol J;
• PhysicalSpace.LUMINOUS_INTENSITY with the symbol n;
The economic dimension space, referenced by EconomicSpace.ECONOMIC_SPACE
defines only one dimension
• EconomicSpace.MONETARY_VALUE with the symbol V ;
Any dimension space needing one and/or the other can be build on them using,
e.g.:
• new DimensionSpace(PhysicalSpace.PHYSICAL_SPACE,
EconomicSpace.ECONOMIC_SPACE);
The dimensions
A dimension is an instance of the class Dimension with the following methods:
multiply(Dimension dimension): creates a new dimension as a product of
two dimensions;
divide(Dimension dimension): creates a new dimension as a quotient of two
dimensions;
power(int i): creates a new dimension as a power of a dimension;
root(int i):
creates a new dimension as a root of a dimension;
isDimensionless(): true if the coordinates in the dimension space are all 0;
isAtomic(): true if the dimension is atomic;
sameSpace(Dimension dimension): true if the two dimensions are defined in
the same dimension space;
As we have seen in the previous section, they are created by specific methods
of a dimension space.
APPENDIX C. THE STRUCTURE PACKAGE
C.1.3
107
The tests
The tests are classifiers to specify sets in intention. For the time being, the
following tests have been implemented:
Any: that specifies the set of all the possible values;
Comparison: that specifies the set of all the values comparable to a given value,
where the comparison can be the equality, inequality, less than, etc.;
And: that conjoins two classifiers that must be simultaneously true;
Or: that conjoins two classifiers that cannot be simultaneously false;
The two first classifiers are created by using the following static methods of the
class Classifier:
any(): creates an Any test;
compare(Comparator comparator,Value value): creates a new Comparison
test;
Two methods are used to conjoin a classifier with another:
and(Classifier classifier): creates an And test;
or(Classifier classifier): creates an Or test;
C.1.4
The values
The values will be described in the section on the data box. However, a value
is always considered as a classifier specifying the set of values containing only
itself. Therefore, the corresponding test amounts to the equality test.
C.2
The data box
Any data structure is an instance of a value (implemented by the class Value).
They are implemented in the package structure.data with the exception of
the units implemented in the package structure.unit. There are several kind
of values among which:
• the atomic values:
– a booleans: either true or false;
– a names: any string of characters;
– a quantities: a value along a dimension;
– a units: is a value used as a reference for quantities.
• the composed values:
– the attributes are sets of heterogeneous values indexed by strings of
characters;
– the tuples are sets of heterogeneous values indexed by positive integers (including 0);
APPENDIX C. THE STRUCTURE PACKAGE
108
– the maps are sets of heterogeneous values indexed by coordinates;
– the sets are sets of homogeneous values with no indexation.
We will describe the values in turn.
C.2.1
The boolean
The boolean is made of two possible values of class Boolean: one is called
true, the other is called false. They are distinguished from the value true and
false of a programming language, although they can be converted into them
for computational purposes.
C.2.2
The names
The names are strings of characters of class Name. They are distinguished from
the strings (String in Java) of a programming language, although they can be
converted into them for computational purposes. They corresponds more to
symbols in Lisp without the guarantee of unicity.
C.2.3
The quantities
The quantities are values along a dimension of class Quantity. They can be
converted into an integer or a float (or any numerical value, as short, int, long,
float, double in Java, existing in a programming language) for computational
purposes. The corresponding numerical value only exists relative to a unit which
is considered as a reference with respect to quantities.
C.2.4
The units
Bibliography
[1] http://bergel.eu/athena/.
[2] http://herzberg.ca.sandia.gov/jess/.
[3] http://jscheme.sourceforge.net/jscheme/main.html.
[4] http://www.alice.unibo.it:8080/tuprolog/.
[5] http://www.beanshell.org/.
[6] http://www.gnu.org/software/kawa/.
[7] http://www.jython.org/.
[8] Jacques Ferber and Jean-Pierre Müller. Influences and reaction: a model
of situated multiagent systems. In Mario Tokoro, editor, Proceedings of
2nd International Conference on Multi-Agent Systems, pages 72–79, Kyoto,
Japan, December 1996. AAAI.
[9] Jean-Pierre Müller. The mimosa generic modeling and simulatiion platform: the case of multi-agent systems. In Herder Coelho and Bernard
Espinasse, editors, 5th Workshop on Agent-Based Simulation, pages 77–86,
Lisbon, Portugal, May 2004. SCS.
[10] Jean-Pierre Müller. Mimosa: using ontologies for modelling and simulation.
In Proceedings of Informatik 2007, Lecture Notes in Informatik, September
2007.
[11] Jean-Pierre Müller. Towards a formal semantics of event-based multiagent
simulations. In Proceedings of the Multi-Agent Based Simulation Workshop,
Estoril, Portugal, May 2008.
[12] Jean-Pierre Müller and Pierre Bommel. An introduction to UML for modeling in the human and social sciences, volume Agent-based Modelling and
Simulation in the Social and Human Sciences, chapter 12. Bardwell Press,
2007.
[13] Steve Railsback, Steve Lytinen, and Volker Grimm. Stupidmodel and extensions: A template and teaching tool for agent-based modeling platforms.
2005.
[14] Bernard P. Zeigler, Tag Gon Kim, and Herbert Praehofer. Theory of Modeling and Simulation. Academic Press, 2000.
109