1
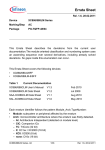
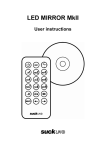
User Manual ZNet LHT v3
1st March 2009
JLM Innovation Dr. Jan Mitrovics
Beethovenweg 41; 72076 Tübingen; Germany
Phone: 07071 940641; Fax: 07071 940642
[email protected] www.jlm-innovation.de
User Manual ZNetLHT v3
©2009 JLM Innovation
1
Introduction
ZNet is a wireless sensor network based on IEEE 802.15.4. It consists of sensor nodes that contain a
wireless transceiver, a microcontroller and one or more sensors.
The sensor network is connected to a PC via a USB stick or an Ethernet access point. The network is
controlled via software running on a PC under Microsoft Windows. The software is configuring the
sensor network and records the measurement data.
ZNetLHT is the first type of sensor node available and contains light, temperature and humidity
sensors. Additionally 2 analog inputs may be used to connect other sensors. Measurement data can
be stored to internal non volatile memory of 128kB.
ZNet Telnet Server is software running under Windows XP / Vista. This software allows configuring
the sensor network and recording of measurement data to a text file. It also operates as a telnet
server, feeding measurement data to other software, which may run on the same computer, or
another computer connected via Ethernet. This allows for the sensor network to be integrated with
common software packages like LabView or Matlab.
User Manual ZNetLHT v3
©2009 JLM Innovation
2
The Sensor Nodes ZNetLHT
switch
SW3
LED3
(yellow)
JP2
(buzzer)
lightsensor
humidity- and
temperature sensor
connector
X1
wireless transceiver
LED2 (red)
LED1 (green)
switch
SW2
switch
SW1
power supply
4-6V 200mA
EUI64-address of
the transceiver
Figure 1: A Sensor node ZNetLHT
Figure 1 shows a sensor node ZNetLHT with connectors, sensors and controls.
The Transceiver
Standard ZNet nodes are using the Telegesis ETRX2 ZigBee modules with built in antenna, operating
in the 2.4GHz ISM band. Optionally power amplified versions (identified by the suffix –PA) and
modules with external antenna are available for long range applications.
Typical range for standard nodes is 10-20 (indoors) to 50-150 meters (open field) and will be affected
by any obstacles in the transmission path as well as other senders operating in the same frequency
range. Power amplified modules will increase the range by a factor of 2 to 4.
User Manual ZNetLHT v3
©2009 JLM Innovation
3
The Light Sensor
The light sensor is a Rohm BH1710VFC . This sensor is characterized by small size and low power
consumption. It is connected via a digital I2C interface and measures light in the range of 1 -65536 lx.
The Temperature and Humidity Sensor
To measure temperature and humidity a SHT-11 from Sensirion is used. This sensor has a proprietary
digital interface similar to I2C and measures temperatures in the range of -20 to 100°C and humidity
in the range of 0 – 100% r.H. (optimum range: 20 – 80% r.H.).
Push Buttons und LEDs
There are 3 bush buttons SW1 to SW3 and 3 LEDs LED1 to LED3 onboard the node.
SW1 and SW2, as well as LED1 und LED2 are connected to the micro controller. Their function
depends on the installed firmware. Please refer to the firmware operation manual for further
details.
SW3 und LED3 are connected to the wireless transceiver. Pushing SW3 wakes up the wireless
transceiver from power save mode. LED3 can be switched on and off from the server software in
order to identify nodes or to test the communication between the PC and a node.
JP2 Buzzer
An optional piezo buzzer may be connected to JP2. A command issued from the server software will
play a short melody on the buzzer, e.g. to identify or find a sensor node.
Power Supply
Power is typically supplied by three 1.5V batteries. The ZNet nodes are delivered with a battery
holder for three AAA batteries. Alternatively other power supplies providing 4 bis 6 V and 200mA
minimum can be used. Please contact JLM Innovation for options!
Analog Inputs
In single ended mode 2 analog signals may be connect to the ZNet node via connector X1. Input
range of the analog signals is 0 to 2.56V against common ground. The resolution is 10 bit.
In differential mode one analog signal may be measured. Connect the positive input to channel 1
and the negative input to channel 2. Native resolution is 10 bit. A gain stage allows amplifying the
input by 1, 10, or 200. If gains of 1 or 10 are used the effective resolution is 8 bit. At a gain of 200 the
effective resolution is decreased to 6 bit.
Digital Inputs
Digital signals with TTL levels of 3.3V may be connected via connector X1. Various interfaces are
possible (UART, SPI, I2C). This allows to connect high resolution AD converters or integrated digital
sensors. However, firmware adaptations are required to operate any serial interface. Please contact
JLM Innovation with your requirements.
User Manual ZNetLHT v3
©2009 JLM Innovation
4
Connector X1
Additional sensors may be connected via connector X1. Additionally the firmware of the micro
controller may be updated via this connector. Depending on the firmware version a UART-interface
on the connector may be used to connect to sub systems or may be used for debugging purposes.
Figure 2: Connector X1
Connector X1 is shown in figure 2. The orientation is equal to the orientation of the connector in
figure 1, i.e. pin B6 is in the upper right end of the PCB.
Description of the pins:
A1 /RESET
Reset Input of the micro controller
SPI connections:
A2 SCK
Clock of the SPI interface
B1 MISO
MISO of the SPI inteface
B2 MOSI
MOSI of the SPI interface
Analog inputs:
A3 ADC0
A/D channel 1 or A/D positive input or digital IO (depending on firmware)
B3 ADC1
A/D channel 2 or A/D negative input or digital IO (depending on firmware)
Power supply:
A4 +3V3
3.3V output (max 50mA may be provided)
B4 GND
common ground
I2C-Bus:
A5 SDA
I2C data
A6 SCL
I2C clock
UART interface:
B5 TXD
TXD of the UART (3.3V TTL)
B6 RXD
RXD of the UART (3.3V TTL)
User Manual ZNetLHT v3
©2009 JLM Innovation
5
Set-up of the Network
During initial operation of the network the first step is to install the USB-Stick on the PC.
Subsequently the ZNet Server program is started. Then the batteries are inserted into the sensor
nodes.
Installation of the USB-Stick:
Please install the drivers for the USB-Stick by running the program PreInstaller before connecting the
Stick to the PC.
Connect the USB-Stick to the PC. A COM-Port will be assigned to the USB-Stick. Please note that
COM-Port. You may check the assigned COM-Port by opening the device manager of Windows. The
Com-Port will be shown under Connections (COM&LPT) as long as the USB-Stick is connected to the
PC.
Installation of the ZNetServer Software:
The program ZNetServer does not require specific installation. Please copy the program to a folder
of your choice and execute the program via double click.
Subsequently the COM-Port of the USB-Stick needs to be selected. The baud rate should be set to
19200.
Figure 3: Options of ZNetServer
The Telnet Server Port is the Ethernet Port that may be used by other programs to connect to the
ZNetServer.
Legend and Max.Points set display options for the graphs in ZNetServer.
Initial Operation of the Sensor Nodes:
Please insert the batteries into the sensor nodes now.
After a few minutes the sensor nodes should have automatically connected to the sensor network.
User Manual ZNetLHT v3
©2009 JLM Innovation
6
By pressing the button “Scan” all nodes connected to the network will be shown in ZNetServer. For
each sensor node a message in the form of FFD<EUI64-Adresse> should show up in the message
area.
Now the sensor nodes have to be added to the list “Sensor Nodes”. Please click on the “Add” button.
(This has to be done for every sensor node in the network). Following dialog will open:
Figure 4: Settings for a sensor node.
Please set the EUI64-Address, that is printed on the wireless transceiver of the sensor node. The
EUI64-Addresses can be selected by clicking on the small arrow in the field “Address”.
The Fields “Position” and “Description” may be set-up to any values. “Position” is used to identify
sensor nodes in the log file and in transmissions to subsequent programs. “Description” can be used
to enter any text that describes the sensor node (e.g. placement of the sensor node).
Button “Del” will delete any selected sensor nodes in the list. Button “Edit” can be used to change
above settings for a sensor node.
Configuring Sensor Nodes as End Device or Router
An end device is asleep most of the time and only wakes up to send new measurement data, or to
check for new messages. This provides for long battery operation of up to 2 years depending on the
acquisition rate.
Figure 5: Configuring a sensor node as end device.
User Manual ZNetLHT v3
©2009 JLM Innovation
7
A router is awake all the time and may relay messages from other nodes in order to extend the
range of wireless network. The power consumption of a router is therefore considerably higher.
Routers will normally be operated by a power supply.
To change the mode of a sensor node select the node in the list and click on the “Config”. The
“Sensor Node Configuration” dialog will open (see figure 5). Select the Node Type and press
“Execute changes”. Configuring a node will take about half a minute.
Using the ZNetServer Program in Normal Operation
After options and sensor nodes have been correctly configured, a measurement can be started and
stopped by clicking on the buttons “Start” and “Stop”.
The field “Interval” allows to set the acquisition rate in seconds .
A log file may be selected by clicking into the field “Log File”. If the selected file exists, new
measurement data will be appended to the end of the file.
The buttons „Sensors“, Buzzer“, „LED3 On“ und „LED3 Off“ send commands those nodes, that are
selected in the „Sensor Nodes“ List:
„Sensors“: perform a single acquisition of all sensors.
„Buzzer“: play a short melody (connect a buzzer to JP2!).
„LED3 On“: switch on LED3
„LED3 Off“: switch off LED3
The lower left area is a text area that shows messages from the sensor nodes and any connect
clients.
The list “Clients” nest to the “Sensor Nodes” list shows and client programs that are connected to
the SNetServer via telnet.
The right side of the window diplays graphs for each sensor type. Within each graph the
measurement data received from all connected sensor nodes is shown.
User Manual ZNetLHT v3
©2009 JLM Innovation
8
Figure65: ZNetServer program
User Manual ZNetLHT v3
©2009 JLM Innovation
9