1
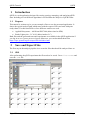
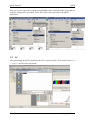
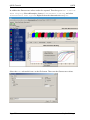
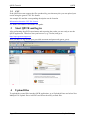
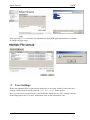
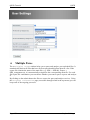
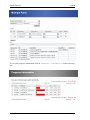
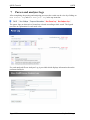
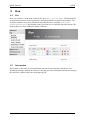
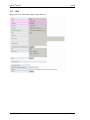
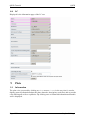
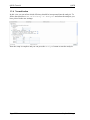
QPCR Tutorial Version 3.0 Create Date Sep 10, 2008 Last modified May 25, 2009 by Stephan Pabinger QPCR Tutorial QPCR Table of content Table of content....................................................................................................................... 2 1 Introduction ..................................................................................................................... 3 1.1 Purpose.................................................................................................................... 3 2 Save and Export Files...................................................................................................... 3 2.1 SDS ......................................................................................................................... 3 2.2 LC............................................................................................................................ 4 2.3 CSV ......................................................................................................................... 6 3 Start QPCR and log in..................................................................................................... 6 4 Upload files ..................................................................................................................... 6 5 User Settings ................................................................................................................... 7 6 Multiple Parse ................................................................................................................. 8 7 Parser and analyzer logs................................................................................................ 10 8 Run ................................................................................................................................ 11 8.1 List......................................................................................................................... 11 8.2 Information............................................................................................................ 11 8.3 SDS ....................................................................................................................... 12 8.4 LC.......................................................................................................................... 13 9 Plate............................................................................................................................... 13 9.1 Information............................................................................................................ 13 9.2 SDS ....................................................................................................................... 14 9.3 LC.......................................................................................................................... 15 10 Cq Analyze Results ................................................................................................... 16 11 Charts ........................................................................................................................ 17 11.1 Information............................................................................................................ 17 11.2 SDS ....................................................................................................................... 17 11.3 LC.......................................................................................................................... 18 12 Experiment ................................................................................................................ 19 13 Analysis..................................................................................................................... 20 13.1 Cq Calculation Methods........................................................................................ 20 13.2 Sample/Detector.................................................................................................... 21 13.3 Reference Genes.................................................................................................... 21 13.4 Normalization........................................................................................................ 22 14 Analysis results ......................................................................................................... 23 14.1 Overview ............................................................................................................... 23 14.2 Multiple Targets .................................................................................................... 23 14.3 Single Target ......................................................................................................... 24 14.4 Quality Control...................................................................................................... 25 15 Statistical Test ........................................................................................................... 26 15.1 Setup...................................................................................................................... 26 15.2 Result..................................................................................................................... 27 16 Export........................................................................................................................ 30 Page 2/30 Stephan Pabinger QPCR Tutorial 1 QPCR Introduction QPCR is a web application designed for storing, parsing, managing, and analyzing qPCR data. Including several different algorithms it can facilitate the analysis of qPCR results. 1.1 Purpose This tutorial is written to give you an example of how to use the presented application. It shows the typical analysis path which starts with the export of files and ends with print ready charts. For this tutorial files of two different vendors are used: Applied Biosystems – Abi Prism SDS 7000 (abbreviated as SDS) Roche Lightcycler – LC 4.05 (abbreviated as LC) Both files and the generated runs and experiments are available in the QPCR application if you log in as user: guest; password: guest. Moreover you can download them from https://rtpcr.genome.tugraz.at/rtpcr/info/infoindex.html 2 Save and Export Files The first step in the analysis pipeline is to create the files that should be analyzed later on. 2.1 SDS After performing the qPCR experiment the file needs to be saved. Go to file -> save and save the .sds file. Page 3/30 Stephan Pabinger QPCR Tutorial QPCR Next you need to export the component and deltaRn values which hold the values that are needed to analyze the experiment. These files will be later uploaded to the QPCR application. 2.2 LC After performing the qPCR experiment the file is exported in the .IXO format. Select file -> export and save the experiment. Page 4/30 Stephan Pabinger QPCR Tutorial QPCR In addition the fluorescence values need to be exported. Therefore go to Run -> Online Data Display. Select all samples, choose fluorescence history, and select Fluorescence over Cycles. Right click on the chart and select Export. Select the Data tab and tick XML as the file format. Then save the fluorescence values. Page 5/30 Stephan Pabinger QPCR Tutorial 2.3 QPCR CSV If the QPCR does not support the files produced by your thermocycler you can upload your results using the generic CSV file format. An example file and the corresponding description can be found at Information about the CSV file format For further information consult the user guide. 3 Start QPCR and log in After performing the qPCR experiments and exporting the results you are ready to use the QPCR application. Therefore start your browser (e.g.: firefox) and go to http://rtpcr.genome.tugraz.at/ . Next you have to log in with your provided username and password (guest, guest). 4 Upload files To upload the created files into the QPCR application, go to Upload & Parse and select New Multiple File Upload. Press Add Files and select the newly created files. Page 6/30 Stephan Pabinger QPCR Tutorial QPCR After pressing Upload the files are transmitted to the QPCR application and now available for further analysis steps. 5 User Settings Before the uploaded files are parsed and analyzed it is necessary to take a look at the user settings, which can be found by pressing User Settings in the top bar. Here you can select your preferred Cq and Efficiency Analyzers, the NTC settings, and the chart background color. For more information click on the information icon. Page 7/30 Stephan Pabinger QPCR Tutorial 6 QPCR Multiple Parse The (Multiple) Parse window helps you to parse and analyze your uploaded files. It automatically detects all files that have not been parsed and displays them in a list. If the export file contains the name of the main file (e.g.: SDS -> SDS.sds, Export -> SDS_component.txt), it is automatically assigned to the corresponding main file. For each file/export file combination you can choose whether you want to parse or parse and analyze it. By clicking on the submit button the files are sent to the parse and analyze services. Using the Progress Information page (accessible through a link in the top menu) you can keep track of the ongoing processes. Page 8/30 Stephan Pabinger QPCR Tutorial QPCR To view the progress information click on Progress Information in the top menu bar. Page 9/30 Stephan Pabinger QPCR Tutorial 7 QPCR Parser and analyzer logs After completing the parsing and analyzing processes the results can be view by clicking on New Parser Log and New Analyzer Log in the top menu bar. The parser logs are shown in a list and are colored according to their result. The legend provides an explanation for each used color. For each analyzed file an Analyzer Log is provided which displays information about the performed analysis. Page 10/30 Stephan Pabinger QPCR Tutorial 8 Run 8.1 List QPCR Now you can have a look at the created runs; go to Run -> Find Runs. Each parsed file is associated with a run which represents a performed qPCR run (qPCR experiment). The first three symbols are used to inform the user that the run is currently analyzed, parsed, or deleted. By clicking on the gird icon you are linked to the plate layout. The chart symbol is a direct link to the charts of the run. 8.2 Information By clicking on the name of a run information about the used software, hardware, and instrument setting is displayed. Moreover this page provides information about the category, the used files, and the latest successful parsing job. Page 11/30 Stephan Pabinger QPCR Tutorial 8.3 QPCR SDS Displayed is the information page of the SDS run. Page 12/30 Stephan Pabinger QPCR Tutorial 8.4 QPCR LC Displayed is the information page of the LC run. 9 Plate 9.1 Information The plate view (accessed by clicking on Show next to Plate in the run view) is used to display general information about the plate (barcode, description, used files) and to provide a list showing all wells or capillaries. By clicking on a well detailed information about this well is displayed. Page 13/30 Stephan Pabinger QPCR Tutorial 9.2 QPCR SDS Page 14/30 Stephan Pabinger QPCR Tutorial 9.3 QPCR LC Page 15/30 Stephan Pabinger QPCR Tutorial QPCR 10 Cq Analyze Results By clicking on the Show button next to Display Cq Analyze Results an overview page is shown, which lists the performed Cq analysis results. Each result can be exported or displayed in detail, shown in the next image. Here you can check the calculated Cq and efficiency values. Page 16/30 Stephan Pabinger QPCR Tutorial QPCR 11 Charts 11.1 Information The chart view (accessed by clicking on Show next to Display Charts in the plate view) is used to display graphs of dissociation and fluorescence data (if available). To switch between the different views click on the tabs in the top bar. Below the chart a grid/list is shown which represents the used plate layout. By clicking on a well, it is included/excluded from the chart which is then automatically updated. You can select multiple wells at once by holding the “ctrl” key while selecting them. Additionally you can click on every well individually. Here you can check whether the melting curve analysis was successful and you can get a rough overview of the shape of the fluorescence curves. 11.2 SDS The grid beneath the chart displays the used plate layout. It colors empty and omitted wells and currently selected wells are colored in red. Page 17/30 Stephan Pabinger QPCR Tutorial QPCR 11.3 LC Since the Lightcycler 2.0 uses a linear plate layout the grid beneath the chart changed to a list view. Page 18/30 Stephan Pabinger QPCR Tutorial QPCR 12 Experiment Since the upcoming steps are the same for the SDS and the LC files, only the SDS run is considered in the next steps. However you can view the results of the LC run by using the guest account of the QPCR application. After you have taken a look at the generated runs and evaluated the parsed and analyzed results it is necessary to create a new experiment. Experiments consist of one or many runs (e.g.: experiment is spread over multiple plates because of the limited amount of wells on one plate) which are analyzed together. To create an experiment click on Experiment and select New Experiment. Define name, date, and description and choose the runs which should be in this experiment. Multiple runs are selected by holding the ctrl key. Now you see the created experiment. The first icon links you directly to the analysis page and skips the experiment information page. By clicking on the name of the experiment you are guided to the following screen which provides links to the runs in the experiment and the calculated Cq/efficiency results. Page 19/30 Stephan Pabinger QPCR Tutorial QPCR 13 Analysis To analyze an experiment you have to define several parameters. In this tutorial one way to analyze the experiment is shown. In order to get detailed information about the parameters please consult the user guide. During the analysis relative quantities are calculated using averaging of technical replicates, normalization against reference genes, and inter-run calibration. For more details consult the paper “qBase relative quantification framework and software for management and automated analysis of real-time quantitative PCR data” by Hellemans et al. (2007). 13.1 Cq Calculation Methods Please pick the Cq calculation method you have selected in the user settings. Therefore the Cq values for the used runs exist and can be used in the upcoming analysis. Page 20/30 Stephan Pabinger QPCR Tutorial QPCR 13.2 Sample/Detector Here you can specify which samples and targets are used in the analysis. In this tutorial all samples and targets are used. Please tick “Use Replicate Handling” and leave “Average technical replicates over plate” unticked. 13.3 Reference Genes This tab lets you choose which tragets should act as reference genes. It is possible to select multiple reference genes or analyze the experiment without a reference gene. Page 21/30 Stephan Pabinger QPCR Tutorial QPCR 13.4 Normalization In this view you can select which efficiency should be incorporated into the analysis. To follow the tutorial use Use Efficiency of Analyzer and select the analyzer you have picked in the user settings. Now the setup is complete and you can press the Analyze button to start the analysis. Page 22/30 Stephan Pabinger QPCR Tutorial QPCR 14 Analysis results 14.1 Overview The page displayed, after the analysis has been performed, lists the calculated results and the provided legend gives information about the meaning of each result. By clicking on one or more Reference Samples you can select the samples used as a reference. By clicking on the Show/Hide log2 button you can display log2 values of the calculated results. By clicking on Display Bars & Quality Control you are directed to the page which graphically displays the analysis results. 14.2 Multiple Targets Here you can graphically view the calculated results and compare them for several targets. It allows you to customize it in many ways including error type, the used sample references, the grouping performed in the chart, title of the chart, and the samples displayed. Page 23/30 Stephan Pabinger QPCR Tutorial QPCR 14.3 Single Target The Single Target tab lets you view the results of a single selected traget. It provides the same customizability as the Multiple Target tab and additionally lets you choose the color of each sample and allows you to give each sample an alternative name. By using drag and drop you can rearrange the list of the displayed samples. In the customize Chart section you can edit the appearance of the chart to your needs. The customize chart section lets you additionally adjust the chart. Page 24/30 Stephan Pabinger QPCR Tutorial QPCR 14.4 Quality Control Quality control for reference genes can only be performed by selecting multiple reference genes. An example is provided below. Please consult the user guide for more information. Moreover quality controls are performed for NTCs and technical replicates. Page 25/30 Stephan Pabinger QPCR Tutorial QPCR 15 Statistical Test 15.1 Setup Statistical tests are used to test several groups (in the software named as class) of samples for significant difference between them. Here you can define which samples should be included in the test and which samples or which class should act as reference. Moreover you can choose the method and which p-Value type should be used. For more information click on the icon or consult the user guide. In this tutorial the standard settings are used. You can add as many classes as you want to the statistical test. On class acts as the statistical reference (reference class) and all other classes are tested for their statistical significant difference to this reference class. Do not confuse this with the sample references which are used to reference the samples to a given set of samples (no statistical test). Each class has a color or pattern associated, is given a specific name, and needs to consist of at least one sample. In one class the property Set As Statistical Reference is set which specifies to which class all other classes are compared. In this case the classes consist of 3 biological replicates and are therefore named “replicates 1” and “replicates 2”. Those replicates are then tested for their statistical significant difference. Page 26/30 Stephan Pabinger QPCR Tutorial QPCR 15.2 Result The upper section of the statistical result page provides links back to the various analysis pages and gives you the opportunity to export the generated results. Page 27/30 Stephan Pabinger QPCR Tutorial QPCR The combined targets view displays the averaged results of each class (in this case the classes replicates1 and replicates2) for the selected targets. Next the results for each target are shown. As an example detector1 is presented in this document. Page 28/30 Stephan Pabinger QPCR Tutorial QPCR In addition to the graphical view results of the statistical test can be displayed in text format. This view is accessed by clicking on show next to Display Test Result Page 29/30 Stephan Pabinger QPCR Tutorial QPCR 16 Export All relevant result can be exported using the provided mechanism. In addition each graph can be saved by right clicking on it and selecting e.g.: “save image as”. If you want to save it as SVG file you can use the provided button right beneath the displayed image. For more information about the QPCR application please consult the user guide. Page 30/30 Stephan Pabinger