1
IXP12xx ATM OC12/Ethernet IP
Router Example Design
Performance and Headroom Analysis
April, 2002
Document Number: 301144-001
Version 1.0, 4/10/02
Information in this document is provided in connection with Intel products. No license, express or implied, by estoppel or
otherwise, to any intellectual property rights is granted by this document. Except as provided in Intel’s Terms and Conditions of
Sale for such products, Intel assumes no liability whatsoever, and Intel disclaims any express or implied warranty, relating to sale
and/or use of Intel products including liability or warranties relating to fitness for a particular purpose, merchantability, or
infringement of any patent, copyright or other intellectual property right. Intel products are not intended for use in medical, life
saving, or life sustaining applications.
Intel may make changes to specifications and product descriptions at any time, without notice.
Designers must not rely on the absence or characteristics of any features or instructions marked "reserved" or "undefined." Intel
reserves these for future definition and shall have no responsibility whatsoever for conflicts or incompatibilities arising from
future changes to them.
The IXP12xx ATM OC12/Ethernet IP Router Example Design may contain design defects or errors known as errata which may cause
the product to deviate from published specifications. Current characterized errata are available on request.
Contact your local Intel sales office or your distributor to obtain the latest specifications and before placing your product order.
Copies of documents which have an ordering number and are referenced in this document, or other Intel literature, may be
obtained from:
Intel Corporation
www.intel.com
or call 1-800-548-4725
*Other brands and names are the property of their respective owners.
Copyright © Intel Corporation 2002
Page 2 of 17
Version 1.0, 4/10/02
IXP12xx ATM OC12/Ethernet IP Router Example Design
Performance and Headroom Analysis
OVERVIEW
This documents details the performance and headroom analysis done on the IXP12xx ATM
OC12 / Ethernet IP Router Example Design. It covers the general performance aspects of the
protocols; cycle and instruction budgets; testing under different workloads; and performance
measurements in both, simulation and hardware environments.
This document also attempts to analyze the amount of headroom available in this design for
customers to add additional features by providing microengine and memory utilization metrics.
Three different configurations are supported:
One ATM OC-12 port &
eight 100Mbps Ethernet ports
Four ATM OC-3 ports &
eight 100Mbps Ethernet ports
Two ATM OC-3 ports &
four 100Mbps Ethernet ports
For use with the IXP1240/1250 with hardware CRC capability
Similar to the above configuration (requires the IXP1240/50), except
that it uses four OC-3 ports.
For use with the IXP1200 (which does not have hardware CRC
capability). Instead, CRC computation is performed by two
microengines (thus the reduced data rates).
Since in each configuration aggregate Ethernet port bandwidth exceeds aggregate ATM port
bandwidth, ATM port bandwidth is the limiting external factor. This example design supports
full-duplex, full-bandwidth ATM communication on all available ATM ports.
The design is able to simultaneously transmit and receive any traffic pattern on all available ATM
ports at line rate. Line rate means that no idle cells should appear on the ATM links.
Furthermore, no ATM PHY FIFO overflows or Ethernet MAC FIFO overflows or underflows
should occur.
MEASUREMENT ENVIRONMENT
Simulation and hardware performance testing was performed under the following conditions:
o 232 MHz IXP1240 with an 80 MHz IX Bus
(IXP1200 measurements do not use the hardware-CRC on the IXP1240)
o 133 MHz SDRAM – ‘-75’ speed-grade
(some results for 143 MHz (‘-7E’ speed-grade) are also provided where indicated)
Alternate DRAM Timing
The project ships with two FLASH files for two different DRAM speed grades.
atm_ether\tools\flash contains files for 133MHz (-75) and 143 MHz (-7E) DRAM. Most
measurements were repeated with both settings to illustrate the sensitivity of the design to DRAM
performance. Where not specifically mentioned in this document, the slower 133MHz settings
were used.
Page 3 of 17
Version 1.0, 4/10/02
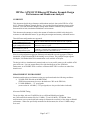
KEY WORKLOADS & APPROACHES TO TESTING THE EXAMPLE DESIGN
Protocol Performance of IP over ATM vs. Ethernet
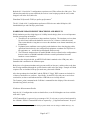
Figure 1 details the protocol processing required to carry an IP packet over ATM and Ethernet. .
Figure 1 – Protocol Processing
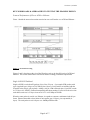
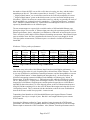
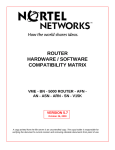
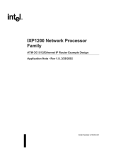
Figures 2 and 3 show that as the size of the IP packet varies so do the efficiencies of ATM and
Ethernet. This section details those efficiencies and the resulting performance implications
Single Cell PDU Workload
Single-cell PDUs result from IP packets of size 20 to 32 bytes – for example UDP packets with
up to 4 payload bytes (8 bytes of LLC/SNAP plus 8 bytes of AAL5 trailer are included with the
IP packet in the 48-byte cell payload). Adding a 4-byte ATM cell header plus 1-byte HEC results
in a 53-byte cell. SONET overhead transparently adds about another 2 bytes/cell to the wire-time
such that its total cost is 55-bytes in terms of a 155 or 622 Mbps ATM link.
When the same packet is carried over Ethernet, it expands to consume a minimum-sized 64-byte
frame. Ethernet then adds at least 960ns of inter-packet gap (12-bytes), plus a preamble (8bytes). The total packet cost is 84-bytes on a 100Mbps Ethernet link.
Page 4 of 17
Version 1.0, 4/10/02
The result is that ATM is significantly more efficient that Ethernet in terms of Mbps for carrying
very small PDUs. Every Mbps of single-cell-PDUs on the ATM link requires (84/55) Mbps on
the matching Ethernet link(s).
176
160
144
128
112
96
80
64
48
32
16
0
0
20
40
60
80
100
120
140
IP P a c ke t Le ngth [Byte s]
Ethernet Frame Bytes
AAL5 PDU Length
Figure 2 – Frame and PDU Length versus IP Packet Length
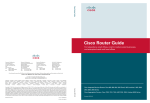
1000
900
800
700
600
OC- 12 Input
OC- 3 Input
500
400
300
200
100
0
0
100
200
300
400
500
600
700
800
900
IP P a c ke t Le ngth [Byte s]
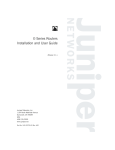
Figure 3 – Expected Ethernet Transmit Bandwidth
Page 5 of 17
1000
1100
1200
1300
1400
1500
Version 1.0, 4/10/02
As shown graphically in Figure 3, 622Mbps of single-cell-PDU input requires 622*(84/55) = 949
Mbps of Ethernet output.
This example design supplies 800Mbps of Ethernet bandwidth (IXP1240 configurations), so
under a single cell/PDU workload the design can be expected to transmit Ethernet at line rate, and
to discard the excess ATM input. In the reverse direction, if Ethernet data is received at wire rate
(even with all 8 ports running at wire-rate), ATM transmit will not be saturated under a single
cell/PDU workload.
Multiple Cells/PDU Workload
Following Figure 2 from left to right, it is clear that once a PDU size overflows from one cell into
two, Ethernet becomes more efficient in terms of Mbps.
When the packet completely fills two or three cells, ATM is again more efficient, but not by
much. For example, two full cells require 622(118/110) = 666 Mbps; and three full cells require
622/(166/159) = 625 Mbps of Ethernet bandwidth for 622Mbps of ATM bandwidth. These
numbers are well below the 800Mbps of Ethernet bandwidth available in the example
configuration.
Thus for multi-cell/PDU workloads, this design has more Ethernet bandwidth available than
ATM bandwidth, and excess Ethernet input will be discarded. In the reverse direction, Ethernet
transmit bandwidth will not be exceeded even if all ATM ports receive data at wire-rate (Figure
3).
While this design supports any IP packet size between 20 and 1500 bytes, 40 byte packets are
expected to be the most common. 40-byte packets corresponds to a 20-byte IP header plus a 20byte TCP header, with no payload. 40-byte IP packets form AAL5 PDUs that consume 2 ATM
cells.
The largest PDU supported by the design contains a 1500-byte packet. This packet is carried by a
1518-byte Ethernet frame or by a 32-cell AAL5 PDU.
CYCLE AND INSTRUCTION BUDGETS
Cycle Budgets to support Line Rates
OC-12 line rate is 622Mbps, but SONET overhead reduces it to 599Mbps available to ATM cells.
53 bytes/cell * 8 bits/byte / 599 Mb/sec = 708 ns/cell. So 232MHz * 708 ns/cell = 164
cycles/cell.
OC-3 line rate is 155Mbps, but SONET overhead reduces it to 149Mbps available to ATM cells.
53 bytes/cell * 8 bits/byte / 149 Mb/sec = 2.85 us/cell. So 232MHz * 2.85 us/cell = 660
cycles/cell.
Ethernet has a variable sized frame, and thus a variable per-frame cycle budget. The worst-case
is minimum-sized 64-byte frames, thus they are the focus for per-frame calculations here. A 64byte frame actually occupies 84 bytes on the wire. {(12 byte Inter Packet Gap) + (8 byte
preamble) + (46 byte IP packet) + (14 byte Ethernet Header) + (4 byte Ethernet FCS) = 84
Page 6 of 17
Version 1.0, 4/10/02
bytes/minimum frame}. 84 bytes/frame * 8 bits/byte / 100Mb/sec = 6.72 usec/frame. 232MHz *
6.72 usec/frame = 1559 cycles/frame
These cycle budgets specify how frequently a cell or frame goes over the wire. If multiple
threads handle multiple frames on the same wire, then the budgets are multiplied accordingly.
For example, the OC-12 cycle budget is 164 cycles/cell, but since the four threads on a single
microengine can work on four frames simultaneously, the equivalent per-thread cycle budget
becomes 4 * 164 cycles, or approximately 660 cycles/frame. That is, four threads working on 4
different cells can each take up to 660 cycles to process a cell and still keep up with line rate.
This per-thread per-packet cycle budget is independent of how the thread consumes the cycles – it
specifies only the maximum time (in cycles) between the beginning and end of packet processing.
The cycles may be used for instruction execution, aborted instructions due to branches,
microengine stalls due to command queue pushback, or idle cycles. Changes in any of these uses
of time can cause a thread to meet or exceed its cycle budget.
The Developer’s Workbench IX Bus Device Simulator is typically configured to show
performance in Mbps based on frames/sec. However, it can also be configured to display
cycles/frame, which is useful in tuning a design to reach cycle budgets.
Developer’s Workbench IX Bus Simulator – Bounded and Unbounded Wire Rates
Simulations can be run with ports “bounded” or “unbounded” to the wire rate. Simulations run
with ports “bounded” to wire rate will always show exactly the correct cycle budget/frame –
because it is bound to the desired wire rate. It is also useful to run a simulation with the ports
“unbounded” to wire-rate (infinite bandwidth on the wire). This means that on the receive side
there is always data waiting on the wire, and on the transmit side the wire is always ready to
accept more data. If the design is able to run faster than wire-rate, then setting the IX Bus Device
Simulator to display in cycles/frame can be useful to relate that to instructions.
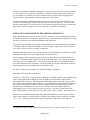
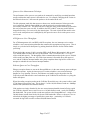
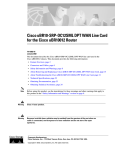
This technique was used to measure the OC-12 Receive Microengine over several workloads
against its 164 cycles/cell budget. The 8 interleaved VC workloads were used to make sure that
the VC-cache experienced a 100% miss rate. Figure 4 shows the results for both the –75 and –7E
DRAM speed grades.
Cells/PDU
1*
1*
1*
2
2
32
32
Virtual Circuits
1
4 random
8 interleaved
1
8 interleaved
1
8 interleaved
Cycles/Cell –75
154.6
163.9
172.8**
161.0
158.4
152.5
131.5
Cycles/cell –7E
137.9
149.8
159.0
137.1
149.2
141.9
127.4
* Simulations show that ATM Receive can handle the 1-cell/PDU workload, but that the IP Router in the
next pipeline stage falls behind.
** For –75 DRAM, the ATM Receive cycle budget is exceeded for a workload of single-cell, interleaved
PDUs.
Figure 4 – OC-12 Unbounded ATM Receive simulations versus 164 cycle budget
Page 7 of 17
Version 1.0, 4/10/02
One issue with running simulations unbounded to wire-rate is that it can hide errors because there
is no concept of device overflows or underflows. Further the design can become un-balanced,
say for example if an efficient receiver races ahead of the rest of the design, hogging shared
system resources and potentially penalizing another part of the system.
Another approach is to simulate bounded, but to bind to a wire-rate that is faster than the actual
wire-rate. The disadvantage of this technique is that it is an iterative process. To discover the
maximum performance one must raise the wire rate until the design fails to keep up, and then one
must lower it until the design runs correctly without any overflows or underflows.
SIMULATION MEASUREMENT PROCEDURE AND RESULTS
In the simulation environment, 29, 40, and 1500 byte packets are measured using the Developer’s
Workbench IX Bus Device Simulator’s streams facility. The workloads are homogeneous, in that
the same sized packets are sent into both Ethernet and ATM ports.
To measure the performance of the design, the simulation is run with the Ethernet ports bounded
to 100Mbps, and the ATM ports bounded to 155 or 622 Mbps, as appropriate. The simulator is
set to stop if it detects a device overflow or underflow.
Full-bandwidth input streams of the specified packet size are simultaneously applied to all ATM
and Ethernet ports present in the configuration for at least 1M cycles.
Upon completion of the simulation run, the line rates in the IX Bus Device Status window are
observed. The Ethernet ports should be receiving at 100 Mbps each. The ATM port(s) should be
receiving at 622 (or 155 Mbps each). For 29-byte packets, the Ethernet side should transmit at
wire-rate and discard excess ATM input. For 40 and 1500-byte packet workloads the ATM side
should transmit at wire-rate and discard excess Ethernet input.
No device overflows or underflows were detected during the simulation.
Simulated 29-byte packet performance1
For the OC-12 and 4xOC-3 configurations running the 1 cell/PDU workload, the simulation stops
with a watch-point when the MSGQ from the ATM Receive Microengine to the IP Route
Microengine fills to capacity. This means that the IPR Microengine is not able to keep up with
the 1 lookup/cell workload (1.4M lookups/sec). Upon disabling the watch-point and completing
the 1M cycle simulation, the number of PDUs dropped due to the ATM_RX_IPR_FULLQ is
compared to the total number of cells received via ATM. This shows that the IP Router
Microengine drops 19-22% of the cells received via ATM. Conversely, it shows that the IP
Router Microengine is routing 78-81% of the 1.4M cells/sec input, or about 1.1M routes/second.
While this observation shows that under this workload the IP Router does not keep up with the
input, it shows that for a workload with 2-cell PDUs, the IP Router has the capability of routing
(1.1 – 1.4/2) = 400K routes/second more than the maximum 700K routes/second required.
1
Simulations for 29-byte, 40-byte, and 1500-byte packet loads were run using 133 MHz memory (-75).
Page 8 of 17
Version 1.0, 4/10/02
Both the OC-12 and 4xOC-3 configurations experience an ATM overflow after 1M cycles. This
indicates that under this system workload, the receiver is not keeping up with the wire, but has
dropped a cell in the first 6,000 cells.
Simulated 40-byte and 1500-byte packet performance2
The OC-12 and 4xOC-3 configurations perform at ATM wire-rate under full-duplex, fullbandwidth 40-byte and 1500-byte packet loads.
HARDWARE MEASUREMENT PROCEDURE AND RESULTS
While simulation provides a high degree of visibility into the design, there are several important
benefits to measuring on hardware:
1. The ability to do experiments on large numbers of packets. The simulator receives about
10 cells/second, whereas the hardware can receive OC-12 data at 1.4M cells/second.
Thus events that take a long time to occur on the simulator occur almost immediately on
the hardware.
2. Unplanned error conditions occur regularly on the hardware due to hot plugging cables,
optical and electrical noise, mis-configured lab equipment or random error injection via
lab equipment, etc – and the design must handle them correctly.
3. The Transactor simulator does not model DRAM refresh overhead, and so configurations
that are sensitive to DRAM bandwidth will notice a small performance hit on the
hardware versus simulation.
To measure the design in the lab, an ADTECH AX/4000 is attached to the ATM ports, and a
Smartbits 600 is attached to the 8 Ethernet ports.
Both pieces of equipment simultaneously generate traffic (at line-rate), and also observe the data
that is being transmitted through the system from the other end of the design. Example AX/4000
sequence files are included in the project under atm_ether\tools\AX4000.
After the experiment, the Octal MAC and the IXF6012 “Volga” PHY counters are checked for
evidence of underflows or overflows. Specifically, for the PHY, idle cells sent or received are
searched for, as these would indicate that the ATM links were not fully utilized.
The Counters_print() command at the VxWorks* command line also displays if the microcode
discarded any packets, and why.
Hardware Measurement Results
Only the OC-12 configuration results are detailed here, as no WAN daughter-card was available
with 4xOC-3 ports.
ATM Transmit Rate is expressed as a percentage of OC-12 wire rate, as received and reported by
the AX/4000. IXF6012 Transmit Idle cells are reported by “_VolgaGetChanCounters” to report
2
Simulations for 29-byte, 40-byte, and 1500-byte packet loads were run using 133 MHz memory (-75).
Page 9 of 17
Version 1.0, 4/10/02
the number of times the PHY was not fed a cell in time to keep the wire busy, and thus had to
manufacture an idle cell. The number reported here is from the 2nd counters query when 2
“_VolgaGetChanCounters” are issued on the same line at the VxWorks prompt (this is because
“_VolgaGetChanCounters” prints out the delta between a previous invocation and the present
invocation). IXF6012 Overflows are measured the same way, and they are generally the result of
the StrongARM* core overhead involved in running the “_VolgaGetChanCounters” command
itself. “Ethernet Transmit Kframe/sec” captures the lowest and highest results as received and
reported by SmartBits600 over the 8 Ethernet ports.
The test measurements are repeated with a variable number of full-bandwidth Ethernet ports
driving the design. The test with “0” Ethernet input ports shows the maximum possible ATM-toEthernet performance, that is, when there is no Ethernet-to-ATM traffic to load down the system.
This is effectively a half-duplex ATM-to-Ethernet forwarding measurement. More Ethernet input
ports are added to show how the system handles the increase in load, even though for 40 and
1500-byte packet measurements, 6-8 Ethernet ports over-subscribe available ATM transmit
bandwidth.
Hardware 29-byte packet performance
Ethernet
Input
Ports
8
7
6
0
ATM
Transmit
Rate [%]
84
73
63
0
IXF6012
Transmit
Idle
N/A
N/A
N/A
N/A
ATM
Receive
Ports
1
1
1
1
IXF6012
Overflows
4000
1000
0
0
Ethernet
Transmit
KFrame/s
132 – 138
127 – 147
133 – 148
148.8
Ethernet
Transmit
[MB/s]
8–9
8.5 – 9.5
8.5 – 9.5
9.5
Figure 5 – Single-cell/PDU Performance using 133MHZ DRAM
The bottom entry in the table with 0 Ethernet Input Ports shows half-duplex performance – i.e.
what the design does when it is only forwarding this workload from ATM to Ethernet. The result
is wire-rate ATM Receive and Ethernet Transmit performance, and the StrongARM core can run
“_VolgaGetChanCounters” without disturbing the data plane at all. As discussed above, this
workload is attempting to transmit 949Mbps out the 800Mbps of Ethernet ports. Indeed, 8
Ethernet ports X 148,808 frames/sec = 1.19M packets/second; while the ATM Receive packet
rate is 1.4M packets/sec. Looking at the microengine counters, The ratio between the packets
dropped due to full Ethernet Transmit queues and the packets dropped due to a full IP Router
input MSGQ shows that about 37% of the dropped packets are due to Ethernet transmit queues
being full, and the remaining 63% are due to the IP Router Microengine not being able to route
1.4M packets/second. This is consistent with the simulation result for the same workload that
showed the IP router couldn’t keep up with 1.4 routes/second.
Transmitting from Smartbits on 6 full-bandwidth Ethernet ports impacts Ethernet Transmit
performance, but only on a couple of ports. But this is not enough Ethernet input to saturate
ATM Transmit.
Increasing the Ethernet workload to 7 ports, and then 8 ports, increases the ATM Transmit
performance, but with the ratio of 949Mbps Ethernet to 622Mbps ATM, this is still not enough
Ethernet input to saturate the ATM Transmitter. Also, Ethernet Transmit performance starts to
Page 10 of 17
Version 1.0, 4/10/02
degrade in these scenarios, and the design becomes subject to ATM overflows from running
“_VolgaGetChanCounters”.
Ethernet
Input
Ports
8
7
6
0
ATM
Transmit
Rate [%]
84
73
63
0
IXF6012
Transmit
Idle
N/A
N/A
N/A
N/A
ATM
Receive
Ports
1
1
1
1
IXF6012
Overflows
0
0
0
0
Ethernet
Transmit
KFrame/s
138 - 147
142 - 148
144 – 148
148,808
Ethernet
Transmit
[MB/s]
8.8 – 9.4
9.0 – 9.5
9.2 – 9.5
9.5
Figure 6 – Single-cell/PDU Performance using 143MHz DRAM
Repeating the same measurements for 143 MHz DRAM results in the same ATM transmit
bandwidth in all cases (Figure 6). Interference from “_VolgaGetChanCounters” is gone however,
even in the 8 port configuration. Ethernet Transmit performance is slightly better, but still subwire-rate in the 8 port configuration. When there is no Ethernet input at all, the ratio between
packets dropped by the IP Router versus full Ethernet transmit queues improved such that the
Ethernet Transmit queues drop 45% and the IP Router drops only 55% of the excess input.
Hardware 40-byte packet performance
Ethernet
Input
Ports
8
7
6
5
4
ATM
Transmit
Rate [%]
97
100
100
100
84
IXF6012
Transmit
Idle
30,000
1,500
700
0
N/A
ATM
Receive
Ports
1
1
1
1
1
IXF6012
Overflows
700
69
0
0
0
Ethernet
Transmit
KFrame/s
88,300
88,300
88,300
88,300
88,300
Ethernet
Transmit
[MB/s]
5.6
5.6
5.6
5.6
5.6
Figure 7 – Two-cell PDU Performance on 133MHZ DRAM
For the 40-byte (2 cell/PDU) workload there are half as many IP lookups/second as are required
in the 29-byte (1 cell/PDU) workload. As expected, the IP Router was able to keep up with this
workload and didn’t drop any packets.
For five Ethernet input ports, the design performed perfectly, and “_VolgaGetChanCounters” did
not cause any dropped cells.
Reducing the Ethernet input to 4 ports did not allow enough input to saturate ATM Transmit.
Increasing the Ethernet input ports to 6, 7 and 8 allowed over-subscription in the Ethernet to
ATM forwarding direction, as evidenced by the ATM Transmit idle cells and ATM Receive
overflows. Indeed, even under nominal conditions, the 8 port input configuration was able to
drive only 97% of the ATM wire.
For this packet size, Ethernet is more efficient that ATM, and the Ethernet transmitter cannot be
expected to be driven at wire rate. Indeed, under nominal conditions the Ethernet transmitter
performed perfectly for all tested configurations.
Page 11 of 17
Version 1.0, 4/10/02
Ethernet
Input
Ports
8
ATM
Transmit
Rate [%]
100
IXF6012
Transmit
Idle
0
ATM
Receive
Ports
1
IXF6012
Overflows
0
Ethernet
Transmit
KFrame/s
88,300
Ethernet
Transmit
[MB/s]
5.6
Figure 8 – Two-cell/PDU Performance on 143MHZ DRAM
Using 143 MHz DRAM, the 40-byte (2-cell/PDU) workload performed perfectly, even with 8
Ethernet ports over-subscribing the ATM Transmitter (Figure 8). “_VolgaGetChanCounters”
recorded zero ATM Transmit Idle cells and zero ATM Receive overflows.
This illustrates the sensitivity of the design to DRAM speed grade selection.
Hardware 1500-byte packet performance
Ethernet
Input
Ports
8
7
6
5
ATM
Transmit
Rate [%]
100
100
100
92
IXF6012
Transmit
Idle
2
0
0
N/A
ATM
Receive
Ports
1
1
1
1
IXF6012
Overflows
500
200
0
0
Ethernet
Transmit
KFrame/s
5,450
5,518
5,518
5,518
Ethernet
Transmit
[MB/s]
8.33
8.37
8.37
8.37
Figure 9 – 32-cell/PDU Performance on 133MHz DRAM
Results for 1500-byte packets (32-cells/PDU) were similar to the 2-cell case. The design worked
flawlessly with six input Ethernet ports. Five ports was not enough to drive ATM to saturation,
and the design degraded slightly as it was over-subscribed by adding the 7th and then 8th Ethernet
input port (Figure 9).
Ethernet
Input
Ports
8
ATM
Transmit
Rate [%]
100
IXF6012
Transmit
Idle
0
ATM
Receive
Ports
1
IXF6012
Overflows
0
Ethernet
Transmit
KFrame/s
5,517
Ethernet
Transmit
[MB/s]
8.37
Figure 10 – 32-cell/PDU Performance on 143 MHz DRAM
Analogous to the 2-cell/PDU case, the 32-cell/PDU case performed perfectly using 143 MHz
DRAM, even in the face of over-subscription with 8 Ethernet input ports and
“_VolgaGetChanCounters” running on the core (Figure 10).
StrongARM CORE PERFORMANCE
This example design sends exception cells, PDUs and frames to the StrongARM core. It uses up
to 4 message queues for this purpose – one for each of the microengines that can send data to the
core. The core is alerted by an interrupt when data is put into the core message queues.
Page 12 of 17
Version 1.0, 4/10/02
Queue to Core Measurement Technique
The performance of the queue-to-core path can be measured by modifying a nominal input data
stream such that the entire stream is forwarded to core. For example, changing the IP version in
the IP header from 4 to 5 will cause the packets to be forwarded to the core.
The lab equipment sends this data stream at a known rate, and the amount of it that gets to the
core is measured. Both the StrongARM core and the microcode count how many packets
successfully reach the core. The microcode also counts how many packets failed to get queued to
the core because the queue was full. In addition, the PHY or MAC count any packets that are
dropped before they were received by the microengines. The ratio of packets that made it to the
core over the total packets sent is multiplied by the input wire-rate to arrive at the queue to core
success rate.
ATM Queue to Core Throughput
For ATM management cells, and PDUs with IP exceptions, the core interrupt service routine
schedules a user-context interrupt handler that consumes the appropriate message queue. Then it
simply re-cycles the buffer descriptors by pushing them back onto the freelist without further
processing.
When faced with a stream of 100% exception PDUs, the IP Router Microengine is able to send
over 200,000 PDUs/second to the core by this method. This is over half of OC-3’s 353,207
cells/second link capacity. The throughput of this communication method peaks at over 320,000
cells/second, but at that point over 10% of the input streams is discarded due to full queues to
core, and the VxWorks interrupt handler sub-system complains about ring buffer overflow as it
attempts to schedule the user-context interrupt handlers.
Ethernet Queue to Core Throughput
Ethernet exception frames are sent to the StrongARM core via the same message queue technique
as ATM exceptions. Again, the interrupt service routine schedules a user-context interrupt
handler for every interrupt. However, the Ethernet core handler copies the packets into the
VxWorks pseudo-Ethernet driver and sends them up the VxWorks IP stack before re-cycling the
buffer descriptors.
When forwarding exception packets to the VxWorks IP stack this way, the system is able to send
37,500 frames/second to the core. This is about 1/3 of the 148,810 frames/second on a 100Mbps
Ethernet link (minimum-sized Ethernet frames).
If the packets are simply discarded by the user-context interrupt handler instead of being copied
into VxWorks, then the success rate rises to over 145,000 frames/second – nearly full 100Mbps
link bandwidth. The system is able to send more packets to the StrongARM core – rising to over
500,000 frames/second when faced with 4 ports at full bandwidth. However, the more it is oversubscribed, the higher percentage of packets the system drops – particularly as VxWorks
succumbs to ring buffer overflow at about 200,000 frames/second.
Page 13 of 17
Version 1.0, 4/10/02
RESOURCE UTILIZATION AND HEADROOM ANALYSIS
This section details system resource utilization, including per-microengine resources such as
registers and microstore instructions; as well as shared resources such as Scratchpad RAM,
SRAM, and DRAM. The memory utilization is shown using the default system memory map as
shipped.3 One of the ATM utilities, config_print(), prints out the Scratchpad RAM, SRAM, and
DRAM address maps to show the memory map in detail. Almost all of the data structure sizes in
these memories are configurable.
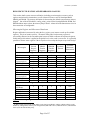
Microengine Register and Microstore Headroom
Register utilization is measured by using the free_register_test() macro to soak up all available
registers. This is an iterative process – the macro either prints out how many registers it
successfully allocated, or the assembler quits because it failed to allocate the requested registers.
In this analysis this macro is applied at the global level, so the result is worst-case. It is generally
possible to allocate more registers if their scope does not overlap the deepest scope in the design.
Microengine
Available
General
Purpose
Registers
Available
SRAM
Transfer
Registers
Available
SDRAM
Transfer
Registers
Available
Threads
Available
Microstore
Instructions
Configuration 1 – IXP1240 1xOC-12, 8xEthernet
ATM Receive
IP Route
Ethernet Receive
(2 microengines)
ATM Transmit
Ethernet Transmit
2
11
1
1
12
5
0
4
0
0
3
0
5
0
0
0
2
6
0
0
0
0
1
0
Configuration 2 – IXP1240 4xOC-3, 8xEthernet
ATM Receive
12
0
6
0
IP Route
11
4
0
0
Ethernet Receive
1
0
0
0
(2 microengines)
1
0
0
0
ATM Transmit
8
1
2
0
Ethernet Transmit
5
0
6
0
1514
1677
1363
1363
1728
1235
1724
1677
1348
1348
1716
1235
Configuration 3 – IXP1200 2xOC-3, 4xEthernet
ATM Receive
& IP Route
Ethernet Receive
CRC Check
CRC Generate
ATM Transmit
Ethernet Transmit
9
0
0
0
1403
1
12
16
8
5
0
3
0
1
0
0
2
2
4
6
0
0
0
2
0
1370
1811
1847
1805
1235
Figure 12 – Microengine register and microstore headroom
3
So that a single version of the ATM utilities in the foreign model DLL and the vxWorks utilities could
handle any configuration, all three port configurations (IXP1240 1xOC12, IXP1240 4xOC3, and IXP1200
2xOC3) use the same memory map.
Page 14 of 17
Version 1.0, 4/10/02
Microstore utilization can be observed by opening a microengine list window with line numbers
enabled, and recording the last line number plus 1. Available instructions = 2048 – used
instructions.
Figure 12 shows the results for each of the three configurations.
The CRC Check and CRC Generate microengines apply only to the IXP1200 configuration. In
the IXP1200 configuration the ATM Receive and IP Route functions run on the same
microengine. See the Application Note for this example design for more detail on microengine
and thread allocation.
Scratchpad RAM Capacity
There are 1024 32-bit Scratchpad RAM locations on-chip, and just over 50% of them are
available.
This design uses 256 locations (25%) for statistics counters, including 16 counters for each of the
12 ports; plus global counters.
7 message queues consume 112 entries (11%), and a table to map port numbers to MAC
addresses consumes 16 more entries. There are some smaller users of Scratchpad RAM locations
that cause some address map fragmentation, but there are basically two blocks of about 256
entries available at 0x100 and 0x300.
SRAM Capacity
The IXM1240 Network Processor Base Card comes with 8MB of SRAM. This design is
currently configured so it uses less than 4MB, leaving over 50% available.
As various configurations of this project may be integrated with other code that utilizes memory
below 0x20000 (.5MB), the area below 0x20000 was simply left alone to avoid potential address
map conflicts.
The SRAM portion of the IP Lookup Table begins at 0x20000, and can grow almost to 0x80000,
(1.5MB).
For convenience, the same utilities are compiled to run on both Software and Hardware CRC
configurations. Thus the current project taxes all configurations with a 64K location (256KB)
CRC-32 lookup table.
The VC Table occupies 0x50000 (320K) locations, corresponding to a 64K entry table with 5
locations per entry. The VC Miss Table has 8K additional entries consuming 0xA000 locations.
All totaled, the VC tables consume 360K locations (1.4MB).
The system is configured with 16K Buffer Descriptors at 4 words each, consuming 64K locations
(265KB).
Page 15 of 17
Version 1.0, 4/10/02
SDRAM Capacity
The IXM1240 Network Processor Base Card comes with 128MB of SDRAM. The project is
configured to use less than 64MB: 32MB of Packet Data Buffers, 16MB for VxWorks, and the
balance for IP Route Table Entries. This leaves over 50% available.
The IP Route Table Entries live at 0x8100, simply because they do so by default in all the
example designs.
Associated with each of the 16K Buffer Descriptors in SRAM is a 2KB Data Buffer in SDRAM,
for a total of 32MB of Data Buffers in SDRAM.
Note that the Data Buffers span the multiple SDRAM bank selects as described in the IXP1200
Hardware Reference Manual. Further, the descriptor freelist is “mixed” at initialization time to
give the SDRAM controller the opportunity to access addresses from the multiple DRAM banks.
See the appendix (“Buffer Allocation in DRAM”) for more information on “mixing” the freelist.
VxWorks consumes the top 16MB of DRAM.
SRAM and SDRAM Bandwidth
Bandwidth measurements are taken on the Transactor simulator using the full-duplex, fullbandwidth 40-byte packet workload on a 2Mcycle simulation. Percent idle cycles are 100%
minus the active percentage shown in the Developer’s Workbench Statistics/Summary box.
Configuration
IXP1240 1xOC-12 8x100Mbps Ethernet
IXP1240 4xOC-3 8x100Mbps Ethernet
IXP1200 2xOC-3 4x100Mbps Ethernet
SRAM % Idle
65.2
57.0
43.0
SDRAM % Idle
42.9
43.3
57.5
Figure 13 – SRAM and SDRAM bandwidth headroom
The IXP1200 configuration handles ½ the throughput of the IXP1240 configurations, but it has
much less SRAM bandwidth available. This is because it uses a CRC-32 lookup table in SRAM.
The two IXP1240 configurations handle exactly the same bandwidth, and their SDRAM usage is
essentially the same. The 4xOC-3 configuration uses more SRAM bandwidth, however, because
its ATM Transmitter uses an array of SRAM Buffer Descriptor Queues (BDQ) in SRAM, while
the simpler OC-12 configuration uses a pair of Message Queues (MSGQ) in Scratchpad RAM.
The OC-12 configuration’s VC Cache may also reduce accesses to the VC Table in SRAM.
From a high-level, one could say that the IXP1200 configuration is SRAM bandwidth limited;
and that the IXP1240 configurations are DRAM bandwidth limited. This can be explored further
with unbounded simulations, which allow the design to not be limited by wire-rate. Additional
SRAM and SDRAM accesses can be added to the design to observe the impact on performance;
and the design can be run on different SDRAM speed grades.
Page 16 of 17
Version 1.0, 4/10/02
APPENDIX
Buffer Allocation in DRAM
The microengines in this example design uses two DRAM command queues. The ordered queue
is used by all sdram_crc[] commands to transfer packet data between DRAM and the receive and
transmit FIFOs. The priority queue is used for all other microengine DRAM accesses, including
access to IP lookup table entries, and modifications to packet headers.
While the instruction set mandates that the sdram_crc[] commands use the ordered queue, the
design has the flexibility to use different queues for the other DRAM accesses. system_config.h
defines DRAM_QUEUE to either "ordered", "optimize_mem", or "priority", for this purpose.
The choice of the priority queue as the default was made by comparing the alternatives for the
OC-12 full-bandwidth configuration in simulation.
As described in the IXP1200 Hardware Reference Manual, the IXP12xx performs "Active
Memory Optimization" to eliminate latencies when it accesses different DRAM banks. This is
true even if the chip uses the ordered and priority queues as in this design. Thus there is a
performance benefit if the system's DRAM accesses frequently alternate between DRAM banks.
To take advantage of this optimization, the DRAM data buffer pool is positioned to equally span
multiple DRAM banks. Further, the descriptor freelist describing this pool is initialized such that
subsequent buffer allocations refer to buffers from alternate DRAM banks.
Page 17 of 17