1
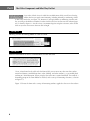
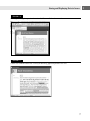
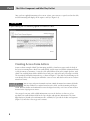
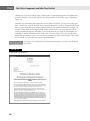
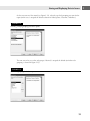
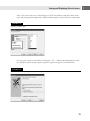
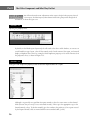
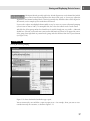
TE
RI
AL
Storing and Displaying
Data in Access
MA
S
TE
D
ince its earliest days — about 14 years ago — Access has been a relational database program, storing data in tables and using its own
queries, forms, and reports to sort, filter, display, and print data. With
successive Office versions, moving data among Office components (especially Word, Excel, and Outlook) has become so much easier that it is now
often more efficient to use another Office component rather than an Access
report for a task such as printing letters or analyzing numeric data.
PY
RI
GH
Additionally, using other Office components to display or print data from
Access makes the data stored in Access tables more widely accessible. Many
Office users have an edition of Office that doesn’t include Access — but they
all have Word and Excel, and many also have Outlook, so they can easily
work with Word documents, Outlook messages or appointments, and Excel
worksheets, filled with data from Access tables.
CO
Whether you plan to present your data as an Access report, PivotChart, or
PivotTable; or a Word document or Excel worksheet, the data is stored in
Access tables, and entered and edited in Access forms.
A Brief History of Office
Data Exchange
As the Windows operating system has progressed from Windows 3.0 to
Windows XP and Vista, data transfer techniques have improved, from simple
cut and paste using the Windows 3.0 clipboard, to Dynamic Data Exchange
(DDE) and Open Database Connectivity (ODBC), to Automation (originally
3
IN THIS CHAPTER
A brief history of Office data
exchange
Storing data in Access
Displaying Access data in forms
and reports
Working with rich text in
Memo fields
New report interactivity
Using Access as a control
center for working with
Office documents
Part I
The Office Components and What They Do Best
called Object Linking and Embedding [OLE], then OLE Automation) and Extensible Markup
Language (XML).
In early Windows and Office versions, DDE and ODBC were difficult to use, cranky and unreliable
in operation, and ODBC in particular often required elaborate setup. I know — I used both DDE
and ODBC, when they were the only connectivity tools available. But I gladly dropped them when
OLE became available in Windows 95/Office 95, because it offered a much simpler way to connect
Office applications, though at first only in a limited manner.
Before Office 97, there was a distinction between Office components that were OLE servers, which
could be manipulated by code running from other applications, and OLE clients, which could
work with objects in OLE server applications’ object models. Back in the days of Access 1.0 or
even 2.0, Access developers had few tools available for connecting to other Office applications
such as Word or Excel. Access, for example, was only a client, whereas Word was only a server.
In Office 95 AccessBasic was upgraded to standard Office VBA, and Access became an OLE server
(previously it was only an OLE client). By Office 2000, all the major Office applications (Access,
Word, Excel, Outlook, and PowerPoint) had been upgraded to support Automation both as clients
and servers, so the OLE server/client distinction is no longer significant.
You can write Automation code in any major Office application to connect to any other Office
application’s data and functionality (and some third-party applications as well).
Storing Data in Access
Access was designed from the start to store data, so (if you have a choice — which is not always the
case) it is the place where you should store your data. You may need to use that data to produce
Word letters, SharePoint lists, Excel worksheets, or Outlook mail messages, but the data itself
should be kept in Access tables, unless there is a very strong reason to store it elsewhere.
One valid exception is storing data in SQL Server back-end databases, using Access as
the front end. SQL Server is usually the choice for huge corporate databases, not smallto medium-sized databases used by individuals or small companies, where Access can easily handle
the number of records. See Chapter 18 for more information on this option.
CROSS-REF
Data entry and editing, too, should be done in Access, for the most part, because you can create
Access forms that offer an attractive interface for entering and editing data. You can write VBA code
that runs from form and control events for purposes of error handling, and create functions that
automate repetitive data-processing operations.
In my earlier book, Expert One-on-One Microsoft Application Development, I discussed creating
Access applications, with details on using queries, forms, reports, and code. I won’t duplicate this
information here, but instead in this chapter I concentrate on new or improved features in Access
2007, which enhance the utility of Access forms and reports.
4
Storing and Displaying Data in Access
Displaying Data in Access Forms and
Reports
Sometimes you don’t need to go outside of Access to present your data — if you are designing an
Access application, displaying data in forms and printing it in reports may be all you need.
Over the years, Access forms and reports have been significantly upgraded. In Access
2007, one long-requested feature has finally arrived in a workable form (I recall an
early and unreliable implementation that made a brief appearance in Access 95). Memo fields can
now store and display rich text, using the Text Align property, which takes a value of either Plain Text
or Rich Text. When you select Rich Text for this property, you can apply various fonts, colors, and
other attributes to selected portions of text in a table field or a control bound to that field.
NEW FEATURE
In earlier versions of Office, if you wanted to generate a letter or other document including a block
of text with color, bolding, or other attributes applied to selected words or phrases within the
block, you had to create a Word letter and use Word’s formatting features. In Access 2007, you
can produce Access reports with varied formatting within text blocks, displaying text entered into
Access memo fields in a textbox on a form.
NOTE
The sample database for this section is RichText.accdb.
To create a field that can store data in Rich Text format (behind the scenes, this is done using
HTML code, but you don’t have to worry about writing the code), start by creating a table field of
the Memo data type, and selecting Rich Text as the Text Format value (see Figure 1.1).
FIGURE 1.1
Creating a Memo field to hold Rich Text data.
5
1
Part I
The Office Components and What They Do Best
If you select a block of text in a Rich Text–enabled Memo field, you will see a floating
toolbar that lets you apply some formatting, including indenting or outdenting, similar
to Word (this works fine; see Figure 1.2). However, if you apply bullets or numbering from this toolbar, you will get the bullets or numbers, but the text that runs over one line won’t be indented properly, as shown in Figure 1.3. For this reason, I recommend against using these features, unless all the
items on your lists are no more than one line in length.
WARNING
FIGURE 1.2
Indenting text from the floating toolbar in a Rich Text field.
FIGURE 1.3
Incorrect indentation of an item in a numbered list in a Rich Text field.
Create a form bound to the table with the Memo field; you can now enter data into this textbox
control and format it with different fonts, color, bolding, and other attributes, as you would while
working in a Word document. When you place the cursor into a control with Rich Text enabled, a
formatting group on the Form Ribbon is enabled, with a variety of formatting selections, as shown
in Figure 1.4.
Figure 1.5 shows the form with a variety of formatting attributes applied to the text in the textbox.
6
Storing and Displaying Data in Access
FIGURE 1.4
Selecting formatting for a portion of text in a Rich Text–enabled textbox on a form.
FIGURE 1.5
A Rich Text–enabled textbox with a variety of formatting applied to portions of its text.
7
1
Part I
The Office Components and What They Do Best
Once you have applied formatting to the text on a form, you can create a report based on the table,
and the formatting will display on the report as well (see Figure 1.6).
FIGURE 1.6
A report showing Rich Text formatting applied in a textbox on a form.
Creating Access Form Letters
A more realistic example of Rich Text formatting would be a form letter report, with the body of
the letter text coming from a Rich Text–enabled field, and the name and address information from
a table of contacts or customers. I created a table called tblLetterText in the sample database, with
a Rich Text–enabled Memo field to hold the letter body text, and an ID and a LetterType text field.
The LetterBody field holds formatted text, as shown in Figure 1.7 (the Rich Text formatting can be
seen directly in the table, though you will find it easier to create and edit the rich text in a textbox
control on a form).
You can copy and paste formatted text from a Word document into a Memo field with
Rich Text enabled (or a textbox bound to such a field), and the formatting will be preserved. However, bullets and numbered lists won’t be aligned correctly, so it is best to turn off those
features before copying text to Access.
TIP
I also created a one-row table to hold information to use in the database; in this case, it has
two Rich Text–enabled Memo fields for the letter header and signature information. The form
fdlgSelectLetter (bound to the information table, zstblInfo) lets you edit the header and signature
(Figure 1.8) and select a letter type and a contact.
8
Storing and Displaying Data in Access
FIGURE 1.7
A table with formatted letter body text.
FIGURE 1.8
A dialog form for editing header and signature block information and selecting a letter and contact.
9
1
Part I
The Office Components and What They Do Best
Clicking the Create Letter button opens a filtered Access report displaying name and address data
from the selected Contact record, and the letter body from the selected letter type, as depicted in
Figure 1.9.
With Rich Text formatting now supported in Access forms and reports, you may not need to produce a Word letter to get the look you want in printed documents. However, compared with Word,
Access reports using Rich Text–enabled Memo fields have one significant limitation. In Word, you
can place merge fields or DocProperty fields within a block of text, so that merged data or data
stored in document properties will print at a certain point in the text, with the surrounding text
wrapping as needed, depending on the length of the text in the fields. This is not possible with a
Memo field on an Access report, so if you need to embed merge fields or DocProperty fields within
the letter body text, you still need to create Word documents.
CROSS-REF
See Chapter 2 for information on creating Word documents of various types filled with
Access data.
FIGURE 1.9
A report with formatted text.
10
Storing and Displaying Data in Access
Using a Naming Convention
I
first realized what a problem it is to work in a database with no naming convention when I took
over a database created by another programmer. The database had a table, a query, a form, a
report, a function, and five or six variables (of different data types) all called Sales (this was only one
of a number of sets of objects with the same name). This meant that when I encountered the word
“Sales” in VBA code, I had no idea whether it was a reference to a table, form, query, function, or
variable, unless the context made it clear. There were numerous errors because of the use of the
same name for different types of objects, because (among other possible sources of errors) you can
set the value of a field with a variable, or with a function — and if several variables and a function
are all called Sales, the code may use the wrong one.
You can also get circular reference errors when a control has the same name as the field to which it
is bound — which is still the case in Access 2007, when you create a form bound to a table using the
Form Wizard. To prevent these reference errors, it is an excellent idea to use a naming convention for
database objects, controls, and variables. Using a naming convention also makes your database selfdocumenting (to some extent, at least), and prevents confusion when selecting an object from a
drop-down list.
About 10 years ago, I wrote an Access 97 add-in (LNC Rename.mda) to automate the process of giving the appropriate tags to database objects and controls on forms and reports, using the Leszynski
Naming Convention (LNC). This add-in was updated for Access 2000, and that version still works in
Access 2007; it is available as Code Sample #10 (for Access 2000 or higher databases) from the
Code Samples page of my web site, www.helenfeddema.com.
Creating Worksheet-type Reports in Access
If you need to produce a report formatted in familiar worksheet-type rows and columns, you can
do this with an Access report. Access 2007 reports have some new features, letting you sort and filter interactively — and if you want full interactivity, you can create a PivotTable or PivotChart form.
To demonstrate these features, I used a variation of the Northwind sample database, with objects
renamed according to the Leszynski Naming Convention.
Plain Datasheet Reports
NOTE
The sample database for this section is Modified Northwind.accdb.
The query qryNorthwindAll links all the tables in the Modified Northwind database. To produce
a plain datasheet report, start by selecting qryNorthwindAll, and selecting Report Wizard in the
Reports group on the Create tab of the Ribbon, as shown in Figure 1.10.
11
1
Part I
The Office Components and What They Do Best
FIGURE 1.10
Selecting the Report Wizard to create a report.
Select the fields to include on the report (see Figure 1.11) and click Next.
FIGURE 1.11
Selecting fields for a report.
12
Storing and Displaying Data in Access
On the next screen of the wizard (see Figure 1.12), select the top-level grouping you want for the
report (in this case, I accepted the default selection of OrderQuarter, Customer, OrderDate).
FIGURE 1.12
Selecting a major grouping level for a report.
The next screen lets you select sub-groups, if desired; I accepted the default (no further subgrouping, as shown in Figure 1.13).
FIGURE 1.13
Select sub-grouping levels for a report.
13
1
Part I
The Office Components and What They Do Best
Next, select sorting and summarizing options; I selected ProductName for sorting, as shown in
Figure 1.14.
FIGURE 1.14
Selecting sorting and summarizing options for a report.
On the report layout screen, depicted in Figure 1.15, I selected the Block option.
FIGURE 1.15
Selecting the Block report layout option.
14
Storing and Displaying Data in Access
Select a style on the next screen, shown in Figure 1.16 (bear in mind that some of the more artistic
styles won’t look good when printed on a black-and-white printer). I selected None for a plain report.
FIGURE 1.16
Selecting a report style.
Give the report a name on the Finish screen (Figure 1.17) — I called it rptNorthwindSales. Select
the “Modify the report’s design” option to open the report in design view, and click Finish.
FIGURE 1.17
The Finish screen of the Report Wizard.
15
1
Part I
The Office Components and What They Do Best
You will need to make some adjustments to the report’s design in the property sheet; if
it is not open, click the Property Sheet button in the Tools group on the Design tab of
the Ribbon, as shown in Figure 1.18.
TIP
FIGURE 1.18
Opening the property sheet.
By default, in the Block report layout only the cells with values have visible borders, so to create an
overall worksheet-type layout, select all the controls in the Detail section of the report, and turn off
display of duplicate data values by setting the Hide Duplicates property to No on the Format tab of
the properties sheet, as shown in Figure 1.19.
FIGURE 1.19
Setting the Hide Duplicates property to No to eliminate duplicate data on a report.
Although it is generally not a problem for report controls to have the same names as their bound
fields (because they are rarely, if ever, referenced in code), I like to give the appropriate tags to the
bound controls at least. To do this manually, give the textboxes the prefix txt. (On a report created
by the Report Wizard, labels are named with the non-standard suffix _Label.)
16
Storing and Displaying Data in Access
The Report Wizard generally applies the default alignment to each column label, which
may result in inconsistent alignment. That doesn’t look good, so (if necessary) adjust the
alignment of the column headings labels as desired (generally they should be either all left-aligned or
all centered); on the sample report I made them all centered.
NEW FEATURE
If you need to adjust an individual column width, it may be necessary to turn off control grouping
(a new feature in Access 2007). To accomplish this, first select the controls in the Detail section
and click the yellow group anchor that should now be visible (though not very visible — Microsoft
should have selected a color with more contrast than dull mustard yellow) at the upper-left corner
of the group, then right-click any control in the group and select Remove from the Layout submenu
(see Figure 1.20).
FIGURE 1.20
Turning off control grouping.
Figure 1.21 shows the finished worksheet-type report.
You can interactively sort and filter a report in report view — for example, when you want to view
records from only one customer, as shown in Figure 1.22.
17
1
Part I
The Office Components and What They Do Best
FIGURE 1.21
A worksheet-type Access report.
FIGURE 1.22
Filtering a report by a selected value in the Customer field.
18
Storing and Displaying Data in Access
After making the selection, the report shows only Gourmet Lanchonetes records (Figure 1.23).
FIGURE 1.23
A report filtered by a Customer value.
PivotTables
If you need more advanced interactivity, you can make a PivotTable based on the same
qryNorthwindAll query. In Access 2007, the process of creating a PivotTable has been simplified; just select the data source query or table, then, as depicted in Figure 1.24, select PivotTable
from the More Forms menu of the Forms group in the Create tab of the Ribbon.
19
1
Part I
The Office Components and What They Do Best
FIGURE 1.24
Creating a PivotTable.
A new form based on the data source opens in PivotTable view (see Figure 1.25), with the Field
List open so you can drag fields to the drop zones of the PivotTable, one field each to the Row
Fields, Column Fields, and (optionally) Filter Fields drop zones, which are indicated in gray text at
the upper-left corner of the form. The data field to be displayed in the body of the table is dragged
to the drop zone in the center of the form; Access will automatically create a Count or Sum field
when appropriate.
CROSS-REF
See Chapter 5 of my book, Expert One-on-One Microsoft Application Development, for
more information on creating and using PivotTables and PivotCharts.
Figure 1.26 shows the PivotTable with Salesperson selected as the Row field and CategoryName as
the Column field, with Price as the Totals field.
20
Storing and Displaying Data in Access
FIGURE 1.25
A newly created PivotTable, ready to select fields.
FIGURE 1.26
A completed PivotTable.
21
1
Part I
The Office Components and What They Do Best
PivotCharts
Making a PivotChart is even easier: select the data source query or table and click the PivotChart
button in the Forms group in the Create tab of the Ribbon. Figure 1.27 shows the new, blank
PivotChart with drop zones at the top and right sides of the form.
FIGURE 1.27
A new, blank PivotChart.
As with a PivotTable, you simply drag fields from the field list to the appropriate drop zones.
I dragged the OrderQuarter field to the Category field drop zone, the Supplier field to the Series
drop zone, the CategoryName to the Filter drop zone, and the Price field to the Data drop zone,
and I selected the Dairy Products category for filtering the data. Figure 1.28 shows the PivotChart
at this point.
22
Storing and Displaying Data in Access
FIGURE 1.28
The PivotChart with fields assigned to its drop zones.
The next step is to give names to the chart’s vertical and horizontal axes. To name the axes, select an
Axis Title label, open the property sheet, and select its Format tab; enter the name you want to display for that axis in the Caption property, as shown in Figure 1.29. Repeat for the other axis label.
FIGURE 1.29
Naming the vertical axis of a PivotChart.
23
1
Part I
The Office Components and What They Do Best
To make the chart’s Legend visible (generally a good idea), click the Legend button in the
Show/Hide group of the Design tab of the Ribbon, as shown in Figure 1.30.
FIGURE 1.30
Making the PivotChart’s Legend visible.
The finished Pivot Chart is shown in Figure 1.31.
FIGURE 1.31
A completed PivotChart.
Access 2007 reports have some interactivity, and PivotTables and PivotCharts have almost unlimited interactivity, but both have a serious limitation: the interactivity is available only when you are
working in the Access database; when you send an Access report, PivotTable, or PivotChart to
someone else who doesn’t have Access, say as a PDF file, the recipient gets a read-only image of the
report, PivotTable, or PivotChart, with no interactivity. This may be what you want in some cases;
but if you need to deliver data in a worksheet or chart format that users can interact with, you
need to create an Excel worksheet or chart from your Access data, rather than a report, PivotTable,
or PivotChart.
24
Storing and Displaying Data in Access
CROSS-REF
See Chapter 3 for information on creating Excel worksheets and charts filled with
Access data, and Chapter 12 for information on creating Excel PivotCharts filled with
Access data.
Summary
In this chapter you have learned about some new features of Access 2007, especially those related
to producing Access reports to display data stored in Access tables. But sometimes you need to display your data in Word documents or Excel worksheets, rather than Access reports; or you may
need to create Outlook appointments, tasks, contacts, or mail messages, using Access as a control
center for working with Office documents.
When you need to produce Word documents, Excel worksheets, or Outlook items, either to make
use of the special features of these Office components or to distribute your data in formats that can
be used by everyone who has Office, you have two options: use the built-in Export selections on
the Ribbon, or write VBA code to create the Office documents and fill them with Access data. The
next three chapters describe how to create Word documents, Excel worksheets or charts, and
Outlook items, and fill them with Access data.
25
1