1
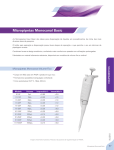
Photometric Analyzer
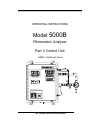
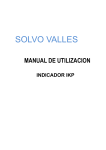
OPERATING INSTRUCTIONS
Model 5000B
Photometric Analyzer
DANGER
HIGHLY TOXIC AND OR FLAMMABLE LIQUIDS OR GASES MAY BE PRESENT IN THIS MONITORING SYSTEM.
PERSONAL PROTECTIVE EQUIPMENT MAY BE REQUIRED WHEN SERVICING THIS SYSTEM.
HAZARDOUS VOLTAGES EXIST ON CERTAIN COMPONENTS INTERNALLY WHICH MAY PERSIST FOR A
TIME EVEN AFTER THE POWER IS TURNED OFF AND DISCONNECTED.
ONLY AUTHORIZED PERSONNEL SHOULD CONDUCT MAINTENANCE AND/OR SERVICING. BEFORE
CONDUCTING ANY MAINTENANCE OR SERVICING CONSULT WITH AUTHORIZED SUPERVISOR/MANAGER.
Teledyne Analytical Instruments
M5000B
11/02/2006
i
Model 5000B
Copyright © 1999 Teledyne Analytical Instruments
All Rights Reserved. No part of this manual may be reproduced, transmitted,
transcribed, stored in a retrieval system, or translated into any other language or computer
language in whole or in part, in any form or by any means, whether it be electronic,
mechanical, magnetic, optical, manual, or otherwise, without the prior written consent of
Teledyne Analytical Instruments, 16830 Chestnut Street, City of Industry, CA 917491580.
Warranty
This equipment is sold subject to the mutual agreement that it is warranted by us
free from defects of material and of construction, and that our liability shall be limited to
replacing or repairing at our factory (without charge, except for transportation), or at
customer plant at our option, any material or construction in which defects become
apparent within one year from the date of shipment, except in cases where quotations or
acknowledgements provide for a shorter period. Components manufactured by others bear
the warranty of their manufacturer. This warranty does not cover defects caused by wear,
accident, misuse, neglect or repairs other than those performed by Teledyne or an authorized service center. We assume no liability for direct or indirect damages of any kind and
the purchaser by the acceptance of the equipment will assume all liability for any damage
which may result from its use or misuse.
We reserve the right to employ any suitable material in the manufacture of our
apparatus, and to make any alterations in the dimensions, shape or weight of any parts, in
so far as such alterations do not adversely affect our warranty.
Important Notice
This instrument provides measurement readings to its user, and serves as a tool by
which valuable data can be gathered. The information provided by the instrument may
assist the user in eliminating potential hazards caused by his process; however, it is
essential that all personnel involved in the use of the instrument or its interface, with the
process being measured, be properly trained in the process itself, as well as all instrumentation related to it.
The safety of personnel is ultimately the responsibility of those who control process
conditions. While this instrument may be able to provide early warning of imminent
danger, it has no control over process conditions, and it can be misused. In particular, any
alarm or control systems installed must be tested and understood, both as to how they
operate and as to how they can be defeated. Any safeguards required such as locks, labels,
or redundancy, must be provided by the user or specifically requested of Teledyne at the
time the order is placed.
Therefore, the purchaser must be aware of the hazardous process conditions. The
purchaser is responsible for the training of personnel, for providing hazard warning
methods and instrumentation per the appropriate standards, and for ensuring that hazard
warning devices and instrumentation are maintained and operated properly.
Teledyne Analytical Instruments, the manufacturer of this instrument, cannot
accept responsibility for conditions beyond its knowledge and control. No statement
expressed or implied by this document or any information disseminated by the manufacturer or its agents, is to be construed as a warranty of adequate safety control under the
user’s process conditions.
ii
Teledyne Analytical Instruments
Photometric Analyzer
Table of Contents
Part I: Control Unit ................................ Part I: 1-1
Part II: Analysis Unit ............................ Part II: 4-1
Appendix ......................................................... A-1
Teledyne Analytical Instruments
iii
Model 5000B
iv
Teledyne Analytical Instruments
Part I: Control Unit
OPERATING INSTRUCTIONS
Model 5000B
Photometric Analyzer
Part I: Control Unit
NEMA 4 Bulkhead Mount
Teledyne Analytical Instruments
Part I: i
Model 5000B Photometric Analyzer
Table of Contents
1 Introduction
1.1 Overview ........................................................................ 1-1
1.2 Typical Applications ....................................................... 1-1
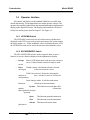
1.3 Main Features of the Analyzer ....................................... 1-5
1.4 Operator Interface .......................................................... 1-6
1.4.1 Up/Down Switch .................................................... 1-6
1.4.2 Escape/Enter Switch .............................................. 1-6
1.5 Control Section Interface Panel...................................... 1-8
2 Installation
2.1 Unpacking the Control Unit/Analysis Unit ...................... 2-1
2.2 Electrical Connections ................................................... 2-1
2.3 Testing the System ........................................................ 2-9
3 Operation
3.1 Introduction .................................................................... 3-1
3.2 Using the Data Entry and Function Buttons ................... 3-1
3.3 The System Function ..................................................... 3-4
3.3.1 Setting up an Auto-Cal ........................................... 3-4
3.3.2 Password Protection .............................................. 3-6
3.3.2.1 Entering the Password ................................... 3-6
3.3.2.2 Installing or Changing the Password ............. 3-7
3.3.3 Logging Out ........................................................... 3-8
3.3.4 System Self-Diagnostic Test .................................. 3-9
3.3.5 The Model Screen ................................................. 3-10
3.3.6 Checking Linearity with Algorithm ......................... 3-10
3.3.7 Digital Flter Setup .................................................. 3-11
3.3.8 Filter or Solenoid Setup ......................................... 3-12
3.3.9 Hold/Track Setup ................................................... 3-13
3.3.10 Calibration/Hold Timer Setup ................................ 3-13
3.3.11 Analog 4 to 20 mA Output Calibration .................... 3-14
ii: Part I
Teledyne Analytical Instruments
Part I: Control Unit
3.3.12 Model ..................................................................... 3-15
3.3.13 Show Negative ...................................................... 3-15
3.4 The Zero and Span Functions ....................................... 3-16
3.4.1 Zero Cal ................................................................. 3-16
3.4.1.1 Auto Mode Zeroing ........................................ 3-16
3.4.1.2 Manual Mode Zeroing .................................... 3-17
3.4.1.3 Cell Failure .................................................... 3-18
3.4.2 Span Cal ................................................................ 3-19
3.4.2.1 Auto Mode Spanning ..................................... 3-19
3.4.2.2 Manual Mode Spanning ................................. 3-19
3.4.3 Offset Function ....................................................... 3-20
3.5 The Alarms Function ...................................................... 3-22
3.6 The Range Select Function ........................................... 3-24
3.6.1 Manual (Select/Define Range) Screen .................. 3-24
3.6.2 Auto Screen ........................................................... 3-25
3.6.3 Precautions ............................................................ 3-26
3.7 The Analyze Function .................................................... 3-28
3.8 Programming ................................................................. 3-28
3.8.1 The Set Range Screen .......................................... 3.29
3.8.2 The Curve Algorithm Screen ................................. 3-31
3.8.2.1 Manual Mode Linearization ........................... 3-31
3.8.2.2 Auto Mode Linearization ................................ 3-31
4 Maintenance
4.1 Fuse Replacement......................................................... 4-1
4.2 System Self Diagnostic Test ........................................... 4-2
4.3 Major Internal Components ............................................ 4-3
Teledyne Analytical Instruments
Part I: iii
Model 5000B Photometric Analyzer
iv: Part I
Teledyne Analytical Instruments
Photometric Analyzer
Part I: Control Unit
Introduction
1.1
Overview
The Teledyne Analytical Instruments Model 5000B Control Unit,
together with a 5000B Analysis Unit, is versatile microprocessor-based
instrument.
Part I, of this manual covers the Model 5000B General Purpose NEMA
4 Bulkhead Mount Control Unit. (The Analysis Unit is covered in Part II of
this manual.) The Control Unit is for indoor/outdoor use in a nonhazardous
environment only. The Control or Analysis Unit in the folded optics design
can accomodate a variety of hazardous environments with either full explosion proof housings or Z, X, Y or Cenelec Purging functions.
1.2
Typical Applications
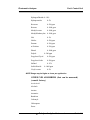
A few typical applications of the Model 5000B are:
WATER MONITORING
Background
Typical Range
Acids, including:
0–4000 PPM
Acetic
Formic
Sulfuric
Acetaldehyde
0–1000 PPM
Air
0–2%
Alcohols, including:
0–400 ppm
Butanol
Teledyne Analytical Instruments
Part I: 1-1
1 Introduction
Model 5000B
Ethanol
Isopropanol
Methanol
Alkanes, including:
0–500 ppm
Heptane
Hexane
Ammonia
0–1000 ppm and up
Aromatics, including:
0–500 ppm
Benzene
Cumene
Toluene
Xylene
Chlorinated Hydrocarbons including:
0–200 ppm
Carbon Tetrachloride
Ethyl Chloride
Ethylene Dichloride
Methyl Chloride
Perchloroethylene
Propylene Dichloride
Trichloroethylene
Vinyl Chloride
Chloroprene
0–200 ppm
Chloropicrin
0–200 ppm
Deuterium Oxide
0–200 ppm
Epichlorohydrin
0–2000 ppm
Ethylene Glycol
0–500 ppm
Freons
0–500 ppm
Gasoline
0–500 ppm
1-2: Part I
Teledyne Analytical Instruments
Photometric Analyzer
Part I: Control Unit
Hydrogen Fluoride 0–10%
Hydroperoxides
0–5%
Kerosene
0–500 ppm
Ketones
0–1000 ppm
Methyl Acetate
0–1000 ppm
Methyl Methacrylate 0–1000 ppm
Oils
0–1%
Olefins
0–500 ppm
Pentane
0–300 ppm
α-Picolene
0–300 ppm
Phenol
0–1000 ppm
Polyols
0–500 ppm
Propylene Glycol
0–500 ppm
Propylene Oxide
0–200 ppm
Sulfinol
0–15%
Sulfur Dioxide
0–1000 ppm
Vinyl Acetate
0–2%
NOTE:Range may be higher or lower per application.
OTHER NIR ABSORBERS (that can be measured)
(consult factory)
Acetic Acid
Alcohols
Amines
Aromatics
Butadiene
Carbonyls
Chloroprene
Esters
Teledyne Analytical Instruments
Part I: 1-3
1 Introduction
Model 5000B
Hydroxyl Value
Hydrocarbons
Hydrogen Chloride
Hydrogen Fluoride
Hydroxyl Value
Ketones
Olefins
Oximes
Epoxides
Methylene
Ketones
1-4: Part I
Teledyne Analytical Instruments
Photometric Analyzer
1.3
Part I: Control Unit
Main Features of the Analyzer
The Model 5000B Photometric Analyzer is sophisticated yet simple to
use. The main features of the analyzer include:
•
A 2-line alphanumeric display screen, driven by microprocessor
electronics, that continuously prompts and informs the operator.
•
High resolution, accurate readings of concentration from low
ppm levels through to 100%. Large, bright, meter readout.
•
Versatile analysis over a wide range of applications.
•
Microprocessor based electronics: 8-bit CMOS microprocessor
with 32 kB RAM and 128 kB ROM.
•
Three user definable output ranges (from 0-1 ppm through
0-100 %) allow best match to users process and equipment.
•
Calibration range for convenient zeroing or spanning.
•
Auto Ranging allows analyzer to automatically select the proper
preset range for a given measurement. Manual override allows
the user to lock onto a specific range of interest.
•
Two adjustable concentration alarms and a system failure alarm.
•
Extensive self-diagnostic testing, at startup and on demand, with
continuous power-supply monitoring.
•
RS-232 serial digital port for use with a computer or other digital
communication device.
•
Analog outputs for concentration and range identification.
(0-1 V dc standard, and isolated 4–20 mA dc)
•
Superior accuracy.
•
Internal calibration-Manual or Automatic (optional).
Teledyne Analytical Instruments
Part I: 1-5
1 Introduction
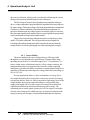
1.4
Model 5000B
Operator Interface
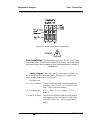
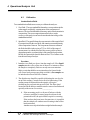
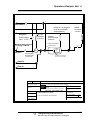
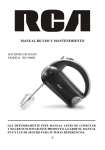
All controls and displays on the standard 5000B are accessible from
outside the housing. The instrument has two simple operator controls. The
operator has constant feedback from the instrument through an alphanumeric
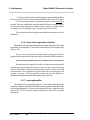
display, and a digital LED meter. The displays and controls are described
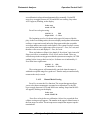
briefly here and in greater detail in chapter 3. See Figure 1-1.
1.4.1 UP/DOWN Switch
The UP/DOWN switch is used to select between any subfunctions
displayed on the VFD screen such as in the main menue, the system menue,
the Alarm menue, etc. When modifiable values are displayed on the VFD,
the UP/DOWN switch can be used to increment or decrement the values.
1.4.2 ESCAPE/ENTER Switch
The ESCAPE/ENTER switch is used to input the data, to enter a
function, or to exit a function displayed in the alphanumeric display:
•
Escape
Moves VFD display back to the previous screen in a
series. If none remains, returns to Analyze mode
screen.
•
Enter
Within a menue: the funtion selected is entered
moving on
to the next screen in a series.
With Value selected: Enters the value into the
analyzer as
data. Advances cursor on VFD to the
next operation.
Functions
In the Analyze mode: it calls the main menue.
called out by the main menue:
-System This function is a menu that calls a
number
of functions
that regulate the analyzer
operation.
-Span
This function spans the instrument.
-Zero
This function zeros the instrument.
-Alarms
This functions sets the alarm
preferences.
1-6: Part I
Teledyne Analytical Instruments
Photometric Analyzer
-Range
Part I: Control Unit
This function selects whether analyzer is
autoranging or locked on one range.
-Standby Places the analyzer in a sleep mode.
WARNING:
The power cable must be disconnected to fully remove
power from the instrument.
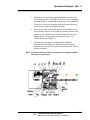
Figure 1-1: Model 5000B Controls, Indicators, and Connectors
Digital Meter Display: The meter display is a Light Emitting Diode
LED device that produces large, bright, 7-segment numbers that are legible
in any lighting. It is accurate across all analysis ranges. The 5000B models
produce continuous readout from 0-10,000 ppm and then switch to
continuous percent readout from 1-100 %.
Teledyne Analytical Instruments
Part I: 1-7
1 Introduction
Model 5000B
Alphanumeric Interface Screen: The backlit VFD screen is an easyto-use interface between operator and analyzer. It displays values, options,
and messages for immediate feedback to the operator.
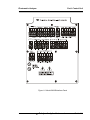
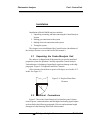
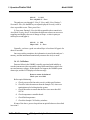
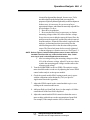
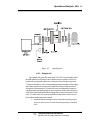
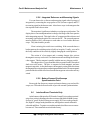
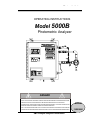
1.5
Control Section Interface Panel
The Control Section interface panel, shown in Figure 1-2, contains the
electrical terminal blocks for external inputs and outputs. The input/output
functions are described briefly here and in detail in the Installation chapter of
this manual.
•
Power Connection
AC power source, 115VAC, 50/60 Hz
•
Analog Outputs
0-1 V dc concentration and 0-1 V dc
range ID. Isolated 4-20 mA dc and 4-20
mA dc range ID.
•
Alarm Connections
2 concentration alarms and 1 system
alarm.
•
RS-232 Port
Serial digital concentration signal output
and control input.
•
Remote Bench
Provides all electrical interconnect to the
Analysis Section.
Remote Span/Zero
Digital inputs allow external control of
analyzer calibration.
•
Calibration Contact
To notify external equipment that
instrument is being calibrated and
readings are not monitoring sample.
•
Range ID Contacts
Four separate, dedicated, range relay
contacts.
•
Network I/O
Serial digital communications for local
network access. For future expansion.
Not implemented at this printing.
Note: If you require highly accurate Auto-Cal timing, use external
Auto-Cal control where possible. The internal clock in the
Model 5000B is accurate to 2-3 %. Accordingly, internally
scheduled calibrations can vary 2-3 % per day.
1-8: Part I
Teledyne Analytical Instruments
Photometric Analyzer
Part I: Control Unit
Figure 1-2: Model 5000B Interface Panel
Teledyne Analytical Instruments
Part I: 1-9
1 Introduction
1-10: Part I
Model 5000B
Teledyne Analytical Instruments
Photometric Analyzer
Part I: Control Unit
Installation
Installation of Model 5000B Analyzers includes:
1. Unpacking, mounting, and interconnecting the Control/Analysis
Section
2. Making gas connections to the system
3. Making electrical connections to the system
4. Testing the system.
This chapter covers installation of the Control Section. (Installation of
the Analysis Section is covered in Part II of this manual.)
2.1
Unpacking the Control/Analysis Unit
The analyzer is shipped with all the materials you need to install and
prepare the system for operation. Carefully unpack the Control/Analysis
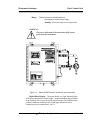
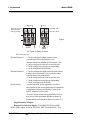
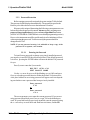
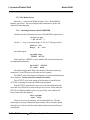
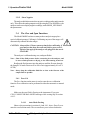
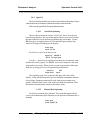
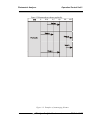
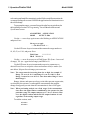
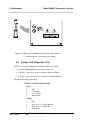
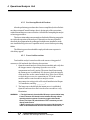
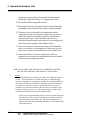
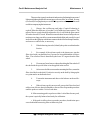
Unit and inspect it for damage. Immediately report any damage to the shipping agent. Figure 2-2: Required Front Door Clearance
Allow clearance for the door to open in a 90-degree arc of radius 15.5
inches. See Figure 2-2.
Figure 2-2: Required Front Door
Clearance
”
.5
15
2.2
Electrical Connections
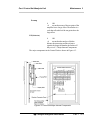
Figure 2-3 shows the Control/Analysis Unit interface panel. Connections for power, communications, and both digital and analog signal outputs
are described in the following paragraphs. Wire size and maximum length
data appear in the Drawings at the back of this manual.
Teledyne Analytical Instruments
Part I: 2-1
1 Introduction
Model 5000B
Figure 2-3: Interface Panel of the Model 6600 Control Section
For safe connections, ensure that no uninsulated wire extends
outside of the terminal blocks. Stripped wire ends must insert completely
into terminal blocks. No uninsulated wiring should come in contact with
fingers, tools or clothing during normal operation.
Primary Input Power: The power supply in the Model 6600 will
accept a 115 Vac, 50/60 Hz power source. See Figure 2-4 for detailed
connections.
DANGER: Power is applied to the instrument's circuitry as
long as the instrument is connected to the power
source. The standby function switches power on or
off to the displays and outputs only.
2-2: Part I
Teledyne Analytical Instruments
Photometric Analyzer
Part I: Control Unit
Figure 2-4: Primary Input Power Connections
115VAC,
Fuse Installation: The fuse holders accept 5 x 20 mm, 4.0 A, T type
(slow blow) fuses. Fuses are not installed at the factory. Be sure to install
the proper fuse as part of installation (See Fuse Replacement in chapter 4,
maintenance.)
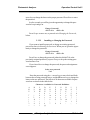
Analog Outputs: There are eight DC output signal connectors on
the ANALOG OUTPUTS terminal block. There are two connectors per
output with the polarity noted. See Figure 2-5.
The outputs are:
0–1 V dc % of Range: Voltage rises linearly with increasing sample concentration, from 0 V at 0% to 1 V at 100%. (Full
scale = 100% programmed range.)
0–1 V dc Range ID:
0.25 V = Range 1, 0.5 V = Range 2, 0.75 V =
Range 3.
4–20 mA dc % Range: Current increases linearly with increasing sample
concentration, from 4 mA at 0% to 20 mA at full
scale 100%. (Full scale = 100% of programmed
range.)
Teledyne Analytical Instruments
Part I: 2-3
1 Introduction
Model 5000B
4–20 mA dc Range ID: 8 mA = Range 1, 12 mA = Range 2, 16 mA =
Range 3.
Figure 2-5: Analog Output Connections
Examples:
The analog output signal has a voltage which depends on the sample
concentration AND the currently activated analysis range. To relate the
signal output to the actual concentration, it is necessary to know what range
the instrument is currently on, especially when the analyzer is in the
autoranging mode.
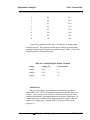
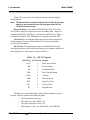
The signaloutput for concentration is linear over currently selected
analysis range. For example, if the analyzer is set on a range that was
defined as 0-10 %, then the output would be as shown in Table 2-1.
Table 2-1: Analog Concentration Output-Examples
Concentration
%
Voltage Signal
Output (V dc)
Current Signal
Output (mA dc)
0
0.0
4.0
1
0.1
5.6
2
0.2
7.2
2-4: Part I
Teledyne Analytical Instruments
Photometric Analyzer
Part I: Control Unit
3
0.3
8.8
4
0.4
10.4
5
0.5
12.0
6
0.6
13.6
7
0.7
15.2
8
0.8
16.8
9
0.9
18.4
10
1.0
20.0
To provide an indication of the range, a second pair of analog output
terminals are used. They generate a steady preset voltage (or current when
using the current outputs) to represent a particular range. Table 2-2 gives the
range ID output for each analysis range.
Table 2-2: Analog Range ID Output - Example
Range
Voltage (V)
Current (mA)
Range 1
0.25
8
Range 2
0.50
12
Range 3
0.75
16
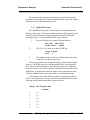
Alarm Relays:
There are three alarm-circuit connectors on the alarm relays block
(under RELAY OUTPUTS) for making connections to internal alarm relay
contacts. Each provides a set of Form C contacts for each type of alarm.
Each has both normally open and normally closed contact connections. The
contact connections are indicated by diagrams on the rear panel. They are
capable of switching up to 3 ampers at 250 V AC into a resistive load
(Figure 2-6).
Teledyne Analytical Instruments
Part I: 2-5
1 Introduction
Model 5000B
Normally closed
Normally open
Moving contact
Normally open
Moving contact
Figure
2-6: Types of Relay Contacts
The connectors are:
Threshold Alarm 1:
Threshold Alarm 2:
System Alarm:
• Can be configured as high (actuates when
concentration is above threshold), or low
(actuates when concentration is below thresh old).
• Can be configured as fail-safe or non-fail-safe.
• Can be configured as latching or nonlatching.
• Can be configured out (defeated).
• Can be configured as high (actuates when concentration is above threshold), or low (actuates when
concentration is below threshold).
• Can be configured as fail-safe or non-fail-safe.
• Can be configured as latching or nonlatching.
• Can be configured out (defeated).
Actuates when DC power supplied to circuits is
unacceptable in one or more parameters. Permanently
configured as fail-safe and latching. Cannot be defeated. Actuates if self test fails.
To reset a System Alarm during installation, disconnect power to the instrument and then reconnect it
Further detail can be found in chapter 3, section 3-5.
Digital Remote Cal Inputs
Remote Zero and Span Inputs: The REMOTE SPAN and REMOTE ZERO inputs are on the DIGITAL INPUT terminal block. They
2-6: Part I
Teledyne Analytical Instruments
Photometric Analyzer
Part I: Control Unit
accept 0 V (OFF) or 24 V dc (ON) for remote control of calibration (See
Remote Calibration Protocol below.)
Zero:
Floating input. 5 to 24 V input across the + and – terminals
puts the analyzer into the ZERO mode. Either side may be
grounded at the source of the signal. 0 to 1 volt across the
terminals allows ZERO mode to terminate when done. A
synchronous signal must open and close the external zero
valve appropriately. See Remote Probe Connector at end of
section 3.3. (With the -C option, the internal valves automatically operate synchronously).
Span:
Floating input. 5 to 24 V input across the + and – terminals
puts the analyzer into the SPAN mode. Either side may be
grounded at the source of the signal. 0 to 1 volt across the
terminals allows SPAN mode to terminate when done. A
synchronous signal must open and close the external span
valve appropriately. See Remote Probe Connector at end of
section 3.3. (With the -C option, the internal valves automatically operate synchronously.)
Cal Contact: This relay contact is closed while analyzer is spanning
and/or zeroing. (See Remote Calibration Protocol below.)
Remote Calibration Protocol: To properly time the Digital Remote
Cal Inputs to the Model 5000B Analyzer, the customer's controller must
monitor the Cal Relay Contact.
When the contact is OPEN, the analyzer is analyzing, the Remote Cal
Inputs are being polled, and a zero or span command can be sent.
When the contact is CLOSED, the analyzer is already calibrating. It
will ignore your request to calibrate, and it will not remember that request.
Once a zero or span command is sent, and acknowledged (contact
closes), release it. If the command is continued until after the zero or span is
complete, the calibration will repeat and the Cal Relay Contact (CRC) will
close again.
For example:
1) Test the CRC. When the CRC is open, Send a zero command
until the CRC closes (The CRC will quickly close.)
2) When the CRC closes, remove the zero command.
3) When CRC opens again, send a span command until the CRC
closes. (The CRC will quickly close.)
4) When the CRC closes, remove the span command.
Teledyne Analytical Instruments
Part I: 2-7
1 Introduction
Model 5000B
When CRC opens again, zero and span are done, and the sample is
being analyzed.
Note: The Remote Bench terminal strip (section 3.6 Part III) provides
signals to ensure that the zero and span gas valves will be
controlled synchronously.
Range ID Relays: Four dedicated RANGE ID CONTACT relays .
The first four ranges are assigned to relays in ascending order—Range 1 is
assigned to RANGE 1 ID, Range 2 is assigned to RANGE 2 ID, Range 3
is assigned to RANGE 3 ID, and Range 4 is assigned to RANGE 4 ID.
Network I/O: A serial digital input/output for local network protocol.
At this printing, this port is not yet functional. It is to be used in future
versions of the instrument.
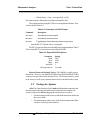
RS-232 Port: The digital signal output is a standard RS-232 serial
communications port used to connect the analyzer to a computer, terminal, or
other digital device. The pinouts are listed in Table 2-3.
Table 2-3: RS-232 Signals
RS-232 Sig
RS-232 Pin Purpose
DCD
1
Data Carrier Detect
RD
2
Received Data
TD
3
Transmitted Data
DTR
4
Data Terminal Ready
COM
5
Common
DSR
6
Data Set Ready
RTS
7
Request to Send
CTS
8
Clear to Send
RI
9
Ring Indicator
The data sent is status information, in digital form, updated every two
seconds. Status is reported in the following order:
• The concentration in percent
• The range is use (HI< MED< LO)
• The span of the range 0-100%, etc.
• Which alarm - if any - are disabled (AL-x DISABLED)
2-8: Part I
Teledyne Analytical Instruments
Photometric Analyzer
•
Part I: Control Unit
Which alarms - if any - are tripped (AL-x ON)
Each status output is followed by a carriage return and line feed.
Three input functions using RS-232 have been implemented to date. They
are described in Table 2-4.
Table 2-4: Commands via RS-232 Input
Command
Description
as<enter>
Immediately starts an autospan.
az<enter>
Immediately starts an autozero.
st<enter>
Toggling input. Stops/Starts any status message output
from the RS-232, Until st<enter> is sent again.
The RS-232 protocol allows some flexibility in its implementation. Table 25 lists certain RS-232 values that are required by the 5000B.
Table 2-5: Required RS-232 Options
Parameter
Baud
Byte
Parity
Stop Bits
Message Interval
Setting
2400
8 bits
none
1
2 seconds
Remote Bench and Solenoid Valves: The 5000B is a single-chassis
instrument. However, the REMOTE BENCH and SOLENOID RETURN
connectors are provided on the interface PCB. The Remote Bench is wired
at the factory as well as any optional solenoid valves included in the system.
2.3
Testing the System
After The Control/Analysis Unit is both installed and interconnected, and
the system gas or liquid stream and electrical connections are complete, the
system is ready to test. Before plugging the unit into its power sources:
• Check the integrity and accuracy of the fluid connections. Make sure
there are no leaks.
• Check the integrity and accuracy of all electrical connections. Make
sure there are no exposed conductors
Teledyne Analytical Instruments
Part I: 2-9
1 Introduction
•
Model 5000B
Check that sample pressure typically between 0 and 30 psig,
according to the requirements of your process.
Power up the system, and test it by performing the following operation:
1. Repeat the Self-Diagnostic Test.
2. Zero the instrument.
3. Span the instrument.
Consult calibration recommendation in the addendum for your
particular application whether liquid or gas phase monitoring.
For steps 2 and 3, refer to part II for calibration.
2-10: Part I
Teledyne Analytical Instruments
Photometric Analyzer
Operation /Control Unit 3
Operation
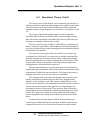
3.1
Introduction
Although the Model 5000B is usually programmed to your application
at the factory, it can be further configured at the operator level, or even,
cautiously, reprogrammed. Depending on the specifics of the application,
this might include all or a subset of the following procedures:
• Setting system parameters:
• Establish a security password, if desired, requiring Operator
to log in (secure in safe file for referrence).
• Establish and start an automatic calibration cycle, if desired.
•
•
Routine Operation:
• Calibrate the instrument.
• Choose autoranging or select a fixed range of analysis.
• Set alarm setpoints, and modes of alarm operation (latching,
fail-safe, etc).
Program/Reprogram the analyzer:
• Define new applications.
• Linearize your ranges.
If you choose not to use password protection, the default password is
automatically displayed on the password screen when you start up, and you
simply press Enter for access to all functions of the analyzer.
3.2
Using the Data Entry and Function
Buttons
Data Entry Buttons: The < > buttons select options from the menu
currently being displayed on the VFD screen. The selected option blinks.
When the selected option includes a modifiable item, the DÑ arrow
buttons can be used to increment or decrement that modifiable item.
Teledyne Analytical Instruments
Part I
3-1
3 Operation/Control Unit
Model 5000B
The Enter button is used to accept any new entries on the VFD screen.
The Escape button is used to abort any new entries on the VFD screen that
are not yet accepted by use of the Enter button.
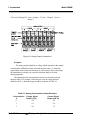
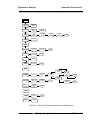
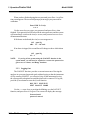
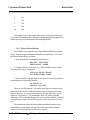
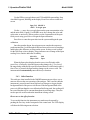
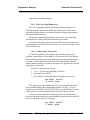
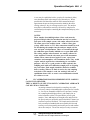
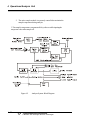
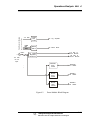
Figure 3-1 shows the hierarchy of functions available to the operator via the
function buttons. The six functions of the buttons on the analyzer are:
• Analyze. This is the normal operating mode. The analyzer monitors
the concentration of the sample, displays the percent or parts-permillion of target fluid or contamination, and warns of any alarm
conditions.
• System. The system function consists of nine subfunctions.
Four of these are for ordinary setup and operation:
•
Setup an Auto-Cal
• Assign Passwords
• Log out to secure system
• Initiate a Self-Test
Three of the subfunctions do auxiliary tasks:
• Checking model and software version
• Adjust electronic filter of the signal
• Display more subfunctions
• Display negative readings
Two of these are for programming/reprogramming the analyzer:
• Define fluid applications and ranges (Refer to programming
section, or contact factory.)
• Use the Curve Algorithm to linearize output. (Refer to
programming section, or contact factory.)
• Zero. Used to set up a zero calibration.
• Span. Used to set up a span calibration.
• Alarms. Used to set the alarm setpoints and determine whether
each alarm will be active or defeated, HI or LO acting, latching,
and/or fail-safe.
• Range. Used to set up three analysis ranges that can be switched
automatically with autoranging or used as individual fixed
ranges.
Any function can be selected at any time by pressing the appropriate
button (unless password restrictions apply). The order as presented in this
manual is appropriate for an initial setup.
Each of these functions is described in greater detail in the following procedures. The VFD screen text that accompanies each operation is reproduced, at
3-2
Part I
Teledyne Analytical Instruments
Photometric Analyzer
Operation /Control Unit 3
System
Dig_filt
Set Digital
Filter
SELF-TEST
Self-Testin
Progress
PWD
Enter
Password
LOGOUT
SecureSystem
setup not allowed
Self-Test
Results
Change
Yes/No
Change
Password
Verify
Password
Enter
MORE
AUTOCAL
FILSOL
Span/Zerostatus
and <>setup
Span/Zero
SolenoidorFilter
TRACK
or
HOLD
Set track or
hold output
CAL-HOLD
TIMER
Set cal. hold and
sampleholdtimer
Span/Zerotiming
and on/off
Enter
Enter
Enter
MORE
Verifydata
Points
ALGORITHM
Selectrange
Displaygasuse
and range
Select
Verify/Setup
Enter
Enter
Input/Output
Enter
EnterSpan
gasvalue
Enter
Auto/Manual
linearCal.
APPLICATION
OUTPUT:
4 or 20 MA
Selectrange
Define
Application/Range
Setcurrent
output
Enter
Display
Model/Version
Enter
Enter
MORE
MODEL
SHOW.NEG
ShowNegative
Reading
Figure 3-1: Hierarchy of System Functions and Subfunctions
Teledyne Analytical Instruments
Part I
3-3
3 Operation/Control Unit
Model 5000B
the appropriate point in the procedure, in a Monospaced type style. Push-button
names are printed in Oblique type.
3.3
The System Function
The subfuctions of the System function are described below. Specific
procedures for their use follow the descriptions:
• Dig_Filt: Adjust how much digital filtering should be on the
signal
•
•
•
•
•
•
•
•
•
•
•
•
SELF-TEST: Performs a self-diagnostic test to check the
integrity of the power supplies, outputs, detector signal and
preamplifier.
PWD: Login security system for accessing to the setup functions.
LOGOUT: Prevents an unauthorized tampering with analyzer
settings.
AUTOCAL: Set the automatic calibrated timer schedule for
Zero and Span cycling.
FILSOL: Select Span/Zero flag (filter) or Span/Zero solenoid
valve for calibration method.
TRACK: Set the system reading to be held or followed by the
concentration “fluid or filter” during calibration.
CAL-HOLD-TIMER: Set the timing for calibration holding
and timing for the sample reading after return to analyze mode.
ALGORITHM: Linearize the output for nonlinear characteristic.
APPLICATION: Used to define the analysis ranges and
application (fluid used).
MODEL: Displays model number and software version.
OUTPUT: 4-20 MA: Adjust 4 and 20 mA output.
SHOW_NEG: Whether to display negative readings or not;
affects analog output too. No negative readings is the default.
3.3.1
Setting up an AUTO-CAL
When proper automatic valving is connected, the Analyzer can cycle
itself through a sequence of steps that automatically zero and span the instrument.
3-4
Part I
Teledyne Analytical Instruments
Photometric Analyzer
Operation /Control Unit 3
Note: Before setting up an AUTO-CAL, be sure you understand the Zero
and Span functions as described in section 4.4, and follow the
precautions given there.
Note: If you require highly accurate AUTO-CAL timing, use external
AUTO-CAL control where possible. The internal clock in the
Model 5000BF is accurate to 2-3 %. Accordingly, internally
scheduled calibrations can vary 2-3 % per day.
To setup an Auto–Cal cycle:
Choose System from the Function buttons. TheVFD will display five
subfunctions.
DIG_FILT SELF—TEST
PWD LOGOUT MORE
Select MORE and press the Enter Key
AUTOCAL
CAL-HOLD-TIMER
FILSOL
HOLD
MORE
Use < > arrows to blink AUTO—CAL, and press Enter. A new screen
for ZERO/SPAN set appears.
ZERO in Ød Øh off
SPAN in Ød Øh off
Press < > arrows to blink ZERO (or SPAN), then press Enter again.
(You won’t be able to set OFF to ON if a zero interval is entered.) A Span
Every ... (or Zero Every ...) screen appears.
Zero schedule: OFF
Day: Ød Hour: Øh
Use DÑ arrows to set an interval value, then use < > arrows to move to
the start-time value. Use DÑ arrows to set a start-time value.
To turn ON the SPAN and/or ZERO cycles (to activate AUTO–CAL):
Press System again, choose AUTO–CAL, and press Enter again. When the
ZERO/SPAN values screen appears, use the < > arrows to blink the ZERO
(or SPAN) and press Enter to go to the next screen. Use < > to select OFF/
ON field. Use DÑ arrows to set the OFF/ON field to ON. You can now turn
these fields ON because there is a nonzero span interval defined.
If instrument is turned off, the next time the instrument is powered, the
instrument will automatically perform a calibration cycle after 3 minutes of
entering the sample mode if AUTOCAL functions were on prior to shut
down.
Teledyne Analytical Instruments
Part I
3-5
3 Operation/Control Unit
3.3.2
Model 5000B
Password Protection
Before a unique password is assigned, the system assigns TAI by default.
This password will be displayed automatically. The operator just presses the
Enter key to be allowed total access to the instrument’s features.
If a password is assigned, then setting the following system parameters can
be done only after the password is entered: alarm setpoints, assigning a new
password, range/application selections, and curve algorithm linearization.
(APPLICATION and ALGORITHM are covered in the programming section.)
However, the instrument can still be used for analysis or for initiating a self-test
without entering the password. To defeat security the password must be
changed back to TAI.
NOTE: If you use password security, it is advisable to keep a copy of the
password in a separate, safe location.
3.3.2.1
Entering the Password
To install a new password or change a previously installed password,
you must key in and ENTER the old password first. If the default password
is in effect, pressing the ENTER button will enter the default TAI password
for you.
Press System to enter the System mode.
DIG_FILT AUTO—CAL
PWD LOGOUT MORE
Use the < > arrow keys to scroll the blinking over to PWD, and press
Enter to select the password function. Either the default TAI password or
AAA place holders for an existing password will appear on screen depending on whether or not a password has been previously installed.
Enter password:
TAI
or
Enter password:
AAA
The screen prompts you to enter the current password. If you are not
using password protection, press Enter to accept TAI as the default password. If a password has been previously installed, enter the password using
the < > arrow keys to scroll back and forth between letters, and the DÑ
3-6
Part I
Teledyne Analytical Instruments
Photometric Analyzer
Operation /Control Unit 3
arrow keys to change the letters to the proper password. Press Enter to enter
the password.
In a few seconds, you will be given the opportunity to change this password or keep it and go on.
Change Password?
<ENT>=Yes <ESC>=No
Press Escape to move on, or proceed as in Changing the Password,
below.
3.3.2.2
Installing or Changing the Password
If you want to install a password, or change an existing password,
proceed as above in Entering the Password. When you are given the opportunity to change the password:
Change Password?
<ENT>=Yes <ESC>=No
Press Enter to change the password (either the default TAI or the
previously assigned password), or press Escape to keep the existing password and move on.
If you chose Enter to change the password, the password assignment
screen appears.
Select new password
TAI
Enter the password using the < > arrow keys to move back and forth
between the existing password letters, and the DÑ arrow keys to change the
letters to the new password. The full set of 94 characters available for password use are shown in the table below.
Characters Available for Password Definition:
A
K
U
_
i
s
}
)
3
=
B
L
V
`
j
t
®
*
4
>
C
M
W
a
k
u
!
+
5
?
D
N
X
b
l
v
"
'
6
@
E
O
Y
c
m
w
#
7
F
P
Z
d
n
x
$
.
8
G
Q
[
e
o
y
%
/
9
Teledyne Analytical Instruments
H
R
¥
f
p
z
&
0
:
I
S
]
g
q
{
'
1
;
J
T
^
h
r
|
(
2
<
Part I
3-7
3 Operation/Control Unit
Model 5000B
When you have finished typing the new password, press Enter. A verification screen appears. The screen will prompt you to retype your password for
verification.
Enter PWD To Verify:
AAA
Use the arrow keys to retype your password and press Enter when
finished. Your password will be stored in the microprocessor and the system
will immediately switch to the Analyze screen, and you now have access to
all instrument functions.
If all alarms are defeated, the Analyze screen appears as:
1.95 ppm SO2
nR1: Ø — 1Ø Anlz
If an alarm is tripped, the second line will change to show which alarm
it is:
1.95 ppm SO2
AL—1
NOTE:
If you log off the system using the LOGOUT function in the
system menu, you will now be required to re-enter the password to
gain access to Alarm, and Range functions.
3.3.3
Logging Out
The LOGOUT function provides a convenient means of leaving the
analyzer in a password protected mode without having to shut the instrument
off. By entering LOGOUT, you effectively log off the instrument leaving
the system protected against use until the password is reentered. To log out,
press the System button to enter the System function.
DIG_FILT SELF-TEST
PWD LOGOUT MORE
Use the < > arrow keys to position the blinking over the LOGOUT
function, and press Enter to Log out. The screen will display the message:
Protected until
password entered
3-8
Part I
Teledyne Analytical Instruments
Photometric Analyzer
3.3.4
Operation /Control Unit 3
System Self-Diagnostic Test
The Model 5000BF has a built-in self-diagnostic testing routine. Preprogrammed signals are sent through the power supply, output board,
preamp board and sensor circuit. The return signal is analyzed, and at the
end of the test the status of each function is displayed on the screen, either as
OK or as a number between 1 and 1024. (See System Self Diagnostic Test in
chapter 4 for number code.) If any of the functions fails, the System Alarm is
tripped.
Note: The sensor will always show failed unless Zero fluid is present in
the sampling cell at the time of the SELF-TEST.
The self diagnostics are run automatically by the analyzer whenever the
instrument is turned on, but the test can also be run by the operator at will.
To initiate a self diagnostic test during operation:
Press the System button to start the System function.
DIG_FILT SELF-TEST
PWD LOGOUT MORE
Use the < > arrow keys again to move the blinking to the SELF–TEST
and press Enter. The screen will follow the running of the diagnostic.
RUNNING DIAGNOSTIC
Testing Preamp — Cell
When the testing is complete, the results are displayed.
Power: OK Analog: OK
Cell: 2 Preamp: 3
The module is functioning properly if it is followed by OK. A number
indicates a problem in a specific area of the instrument. Refer to Chapter 5
Maintenance and Troubleshooting for number-code information. The results
screen alternates for a time with:
Press Any Key
To Continue...
Then the analyzer returns to the initial System screen.
Teledyne Analytical Instruments
Part I
3-9
3 Operation/Control Unit
Model 5000B
3.3.5 The Model Screen
Move the < > arrow key to MORE and press Enter. With MODEL
blinking, press Enter. The screen displays the manufacturer, model, and
software version information.
3.3.6
Checking Linearity with ALGORITHM
From the System Function screen, select ALGORITHM, and press Enter.
sel rng to set algo:
—> Ø1 Ø2 Ø3 <—
Use the < > keys to select the range: 01, 02, or 03. Then press Enter.
Fluid Use: SO2
Range:
Ø — 10%
Press Enter again.
Algorithm setup:
VERIFY SET UP
Select and Enter VERIFY to check whether the linearization has been
accomplished satisfactorily.
Dpt INPUT OUTPUT
Ø Ø.ØØ
Ø.ØØ
The leftmost digit (under Dpt) is the number of the data point being
monitored. Use the DÑ keys to select the successive points.
The INPUT value is the input to the linearizer. It is the simulated output
of the analyzer. You do not need to actually flow fluid.
The OUTPUT value is the output of the linearizer. It should be the
ACTUAL concentration of the span fluid being simulated.
If the OUTPUT value shown is not correct, the linearization must be
corrected. Press ESCAPE to return to the previous screen. Select and Enter
SET UP to Calibration Mode screen. (set-up will not work without a PC
being connected to the analyzer)
Select algorithm
mode : AUTO
There are two ways to linearize: AUTO and MANUAL: The auto
mode requires as many calibration fluides as there will be correction points
along the curve. The user decides on the number of points, based on the precision required.
3-10
Part I
Teledyne Analytical Instruments
Photometric Analyzer
Operation /Control Unit 3
The manual mode only requires entering the values for each correction
point into the microprocessor via the front panel buttons. Again, the number
of points required is determined by the user.
3.3.7
Digital Filter Setup
The 5000BF has the option of decreasing or increasing the amount
filtering on the signal. This feature enhances the basic filtering done by the
analog circuits by setting the amount of digital filtering effected by the
microprocessing. To access the digital filter setup, you must:
1.
Press the System key to start the System function
DIG_FILT SELF-TEST
PWD LOGOUT MORE
2.
DIG_FILT will flash, press the ENTER key,
Weight of digital
Filter:
9
3.
The number on the second row will flash and can be set by
using the Up or Down arrow keys.
The settings go from zero, no digital filtering, to 10, maximum digital
filtering. The default setting is 8 and that should suffice for most applications. In some applications where speeding the response time with some
trade off in noise is of value, the operator could decrease the number of the
digital filter. In applications where the signal is noisy, the operator could
switch to a higher number; the response time is slowed down though.
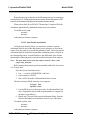
90% response time on the different settings to a step input is shown
below. This response time does not include the contributions of the bench
sampling system and the preamplifier near the detector.
Setting
90% Response time
(seconds)
0
4.5
1
4.5
2
5.0
3
5.0
4
5.5
5
7.0
Teledyne Analytical Instruments
Part I
3-11
3 Operation/Control Unit
6
9.0
7
14.0
8
25.0
9
46.0
10
90.0
Model 5000B
At a setting of “zero”, the response time is purely set by the electronics to
4.5 seconds. The numbers above can and will change depending on application
and they merely serve to illustrate the effect of the digital filter.
3.3.8
Filter or Solenoid Setup
The 5000BF can be spanned or zeroed by calibration fluids or by optical
filters. The proper calibration method should be set at the factory. To access
the Filter or Solenoid Flags, you must:
1. Press the System key to start the System function:
DIG_FILT SELF-TEST
PWD LOGOUT MORE
2. Using the Right or Left arrow keys, select MORE and press Enter.
The second System screen appears:
AUTOCAL FILSOL TRACK
CAL-HOLD-TIMER MORE
3. Select FILSOL using the Right or Left arrow keys and press Enter to
start the method of calibration function.
Set fil/sol for cal
Span: FIL Zero: SOL
There are two flag options: zero and/or span flags are choosen at time
of purchase, one for Zero calibration and the other for Span located in the
Detector housing. To move between the Zero and the Span flags, use the
Right or Left arrow keys. FIL means that a filter will do this particular
calibration. SOL means that the signal to activate a fluid solenoid is enabled.
To toggle between the SOL and FIL options, use the Up and Down arrow
keys.
The connections to drive the filter and the solenoid are found on a strip
terminal located on the interface board. The connections are described in
section 5-6 of the maintenance section of the manual.
3-12
Part I
Teledyne Analytical Instruments
Photometric Analyzer
3.3.9
Operation /Control Unit 3
Hold/Track Setup
The 5000BF has ability to disable the analog outputs and freeze the display
while undergoing a scheduled or remote calibration. The 5000BF will track
changes in the concentration if calibration is started through the front
panel. To setup this feature, the operator must:
1.
Press the System key to start the System function:
DIG_FILT SELF-TEST
PWD LOGOUT MORE
2.
Using the Right or Left arrow keys, select MORE and press
Enter. The Second System screen appears:
AUTOCAL FILSOL TRACK
CAL-HOLDER-TIMER MORE
or
AUTOCAL FILSOL HOLD
CAL-HOLD-TIMER MORE
3.
The option on the right of the first row can be set to TRACK
or HOLD by using the UP or Down keys. By selecting the TRACK option,
the analog outputs are enabled and with the display will track the concentration changes while the instrument is undergoing scheduled or remote calibration (either zero or span). By selecting the HOLD option, the analog outputs
and display are disabled and will not track the concentration changes while
the instrument is undergoing scheduled or remote calibration (either zero or
span). In the HOLD option, the analog outputs and display will freeze on
the last reading before entering calibration.
The analog outputs are both 0 to 1 volt outputs and both 4 to 20 mA
outputs.
3.3.10
Calibration/Hold Timer Setup
This Calibration Timer lets the operator adjust the time thee instrument
purges the calibration fluid prior to actually start the calibration computations. The Sample timer lets the operator adjust the time the instrument
purges sample fluid after finishing a calibration before it lets the analog outputs
and display track the change in concentration.
Teledyne Analytical Instruments
Part I
3-13
3 Operation/Control Unit
Model 5000B
This function and the TRACK/HOLD feature will prevent false alarms
while performing remote or autoscheduled calibrations. These functions are
not applicable if the calibration is initiated through the front panel. To enter
the Calibration/Hold Timer function, you must:
1.
Press the System key to start the System function:
DIG_FILT SELF-TEST
PWD LOGOUT MORE
2.
Using the Right or Left arrow keys, select MORE and press
Enter: The Second System screen appears:
AUTOCAL FILSOL TRACK
CAL-HOLD-TIMER MORE
or
AUTOCAL FILSOL HOLD
CAL-HOLD-TIMER MORE
3.
Select with the Right or Left keys CAL-HOLD-TIMER, and
press the Enter key to access this function menu:
Calbrt hold: 3 min
Sample hold: 1 min
The calibration hold time is set on the first row, while the sample hold
time is set on the second row. To select one or the other, use the Right or
Left keys. To modify the time of either timer, use the Up or Down keys.
The time is in the minutes.
3.3.11
Analog 4 to 20 mA Output Calibration
This function will let the operator calibrate the 4 to 20 mA analog
output to match the display reading. A DMM configure as a DC ammeter is
needed. The DMM should be connected across the output terminals of the 4
to 20 mA output to monitor the output current. To enter the 4 to 20 mA
output adjust function, you must:
1.
Press the System key to start the System function:
DIG_FILT SELF-TEST
PWD LOGOUT MORE
2.
Using the Right or Left arrow keys, select MORE and press
Enter. The second System screen appears:
AUTOCAL FILSOL TRACK
CAL-HOLD-TIMER MORE
3-14
Part I
Teledyne Analytical Instruments
Photometric Analyzer
Operation /Control Unit 3
or
AUTOCAL FILSOL HOLD
CAL-HOLD-TIMER MORE
3.
Using the Right or the Left arrow keys, select MORE and
press Enter. The third System screen appears:
ALGORITHM APPLICATION
MODEL OUTPUT: 4 MA
or
ALGORITHM APPLICATION
MODEL OUTPUT: 20 MA
OUTPUT: 4 MA and OUTPUT: 20 MA can be toggled by moving on
that field and pressing the Up or Down key. 4 mA output should be calibrated first and 20 mA output afterwards.
4.
Select OUTPUT: 4 MA and press the Enter key
Use UP/DOWN arrow to
Adjust 4 ma:
250
The number on the second row is the setpoint of the 4 mA output. It is
analogous to a potentiometer wiper. The number can be set anywhere from
0 to 500. The default is 250, in the middle. At the default setting, the output
should be very close to 4 mA. If not, slowly adjust the number using the Up
or the Down keys until DMM reads 4.00 mA. Press the Enter key when
done.
5.
Now select OUTPUT: 20 MA and press the Enter key. A
screen similar to the one above will appear and the DMM should read close
to 20 mA. If not, slowly adjust the number using the Up or Down key until
DMM reads 20.0 mA. Press the Enter key when done.
The range of adjustment is approximately +/- 10% of scale (+/- 1.6 ma).
Since the 4 to 20 mA output is tied to the 0 to 1 volt output, this function can
be used to calibrate the 0 to 1 volt output, if the 4 to 20 mA output is not
used. By using a digital Volt meter on the 0-1 Volt output.
3.3.12 Model
This selection in the System menu flashes for a few seconds the model
number and the software version installed in this instrument.
Teledyne Analytical Instruments
Part I
3-15
3 Operation/Control Unit
Model 5000B
3.3.13 Show Negative
The analyzer defaults to not to show negative readings on the analyze mode
only. This affects the analog outputs too by pressing the UP or DOWN key, the
analyzer can be set to display negative readings, on the SHOW_NEG field of
the system menu.
3.4
The Zero and Span Functions
The Model 5000BF can have as many as three analysis ranges plus a
special calibration range (Cal Range). Calibrating any one of the ranges will
automatically calibrate the other ranges.
CAUTION: Always allow 4-5 hours warm-up time before calibrating, if
your analyzer has been disconnected from its power source.
This does not apply if the analyzer was plugged in but was in
STANDBY.
The analyzer is calibrated using zero, and span fluides.
Note: Shut off the fluid pressure before connecting it to the analyzer, and
be sure to limit pressure to 40 psig or less when turning it back on.
Readjust the fluid pressure into the analyzer until the flowrate through
the Sample Cell settles between 50 to 200 cc/min (approximately 0.1 to 0.4
SCFH).
Note: Always keep the calibration fluid flow as close to the flowrate of the
sample fluid as possible
3.4.1
Zero Cal
The Zero function on the menu is used to enter the zero calibration
function. Zero calibration can be performed in either the automatic or manual
mode.
Make sure the zero fluid is flowing to the instrument. If you get a
CELL CANNOT BE BALANCED message while zeroing skip to section
4.4.1.3.
3.4.1.1
Auto Mode Zeroing
Observe the precautions in sections 4.4 and 4.4.1, above. Press Zero to
enter the zero function mode. The screen allows you to select whether the
3-16
Part I
Teledyne Analytical Instruments
Photometric Analyzer
Operation /Control Unit 3
zero calibration is to be performed automatically or manually. Use the DÑ
arrow keys to toggle between AUTO and MAN zero settling. Stop when
AUTO appears, blinking, on the display.
Select zero
mode: AUTO
Press Enter to begin zeroing.
####.## %
Slope=#.###
SO2
C—Zero
The beginning zero level is shown in the upper left corner of the display. As the zero reading settles, the screen displays and updates information
on Slope= in percent/second (unless the Slope starts within the acceptable
zero range and does not need to settle further). The system first does a coarse
zero, shown in the lower right corner of the screen as C—Zero, for 3 min, and
then does a fine zero, and displays F—Zero, for 3 min.
Then, and whenever Slope is less than 0.01 for at least 3 min, instead of
Slope you will see a countdown: 9 Left, 8 Left, and so fourth. These are
software steps in the zeroing process that the system must complete, AFTER
settling, before it can go back to Analyze. Software zero is indicated by S–
Zero in the lower right corner.
####.## % SO2
4 Left=#.### S—Zero
The zeroing process will automatically conclude when the output is
within the acceptable range for a good zero. Then the analyzer automatically
returns to the Analyze mode.
3.4.1.2
Manual Mode Zeroing
Press Zero to enter the Zero function. The screen that appears allows
you to select between automatic or manual zero calibration. Use the DÑ
keys to toggle between AUTO and MAN zero settling. Stop when MANUAL appears, blinking, on the display.
Select zero
mode: MANUAL
Press Enter to begin the zero calibration. After a few seconds the first
of three zeroing screens appears. The number in the upper left hand corner is
the first-stage zero offset. The microprocessor samples the output at a predetermined rate.
Teledyne Analytical Instruments
Part I
3-17
3 Operation/Control Unit
Model 5000B
####.##
% SO2
Zero adj:2048 C—Zero
The analyzer goes through C–Zero, F–Zero, and S–Zero. During C–
Zero and F–Zero, use the DÑ keys to adjust displayed Zero adj: value as
close as possible to zero. Then, press Enter.
S–Zero starts. During S–Zero, the Microcontroller takes control as in
Auto Mode Zeroing, above. It calculates the differences between successive
samplings and displays the rate of change as Slope= a value in parts per
million per second (ppm/s).
####.## %
Slope=#.###
SO2
S—Zero
Generally, you have a good zero when Slope is less than 0.05 ppm/s for
about 30 seconds.
Once zero settling completes, the information is stored in the analyzer’s
memory, and the instrument automatically returns to the Analyze mode.
3.4.1.3 Cell Failure
Detector failure in the 5000BF is usually associated with inability to
zero the instrument with a reasonable voltage differential between the reference and measure voltages. If this should ever happen, the 5000BF system
alarm trips, and the LCD displays a failure message.
Detector cannot be balanced
Check your zero fluid
Before optical balancing:
a. Check your zero fluid to make sure it is within specifications.
b. Check for leaks downstream from the Sample Cell, where contamination may be leaking into the system.
c. Check flowmeter to ensure that the flow is no more than 200
SCCM
d. Check temperature controller board.
e. Check fluid temperature.
f. Check the Sample Cell for dirty windows.
If none of the above, proceed to perform an optical balance as described
in section 5.
3-18
Part I
Teledyne Analytical Instruments
Photometric Analyzer
3.4.2
Operation /Control Unit 3
Span Cal
The Span function on the menu is used to span calibrate the analyzer. Span
calibration can be performed in either the automatic or manual mode.
Make sure the span fluid is flowing to the instrument.
3.4.2.1
Auto Mode Spanning
Observe all precautions in sections 3.4 and 3.4.2, above. Press Span to
enter the span function. The screen that appears allows you to select whether
the span calibration is to be performed automatically or manually. Use the
DÑ arrow keys to toggle between AUTO and MAN span settling. Stop
when AUTO appears, blinking, on the display.
Select span
mode: AUTO
Press Enter to move to the next screen.
Span Val: 2Ø.ØØ %
<ENT> To begin span
Use the < > arrow keys to toggle between the span concentration value
and the units field (%/ppm). Use the DÑ arrow keys change the value and/
or the units, as necessary. When you have set the concentration of the span
fluid you are using, press Enter to begin the Span calibration.
####.##%
Slope=#.###
SO2
Span
The beginning span value is shown in the upper left corner of the
display. As the span reading settles, the screen displays and updates information on Slope. Spanning automatically ends when the span output corresponds, within tolerance, to the value of the span fluid concentration. Then
the instrument automatically returns to the analyze mode.
3.4.2.2
Manual Mode Spanning
Press Span to start the Span function. The screen that appears allows
you to select whether the span calibration is to be performed automatically or
manually.
Select span
mode: MANUAL
Teledyne Analytical Instruments
Part I
3-19
3 Operation/Control Unit
Model 5000B
Use the DÑ keys to toggle between AUTO and MAN span settling. Stop
when MAN appears, blinking, on the display. Press Enter to move to the next
screen.
Span Val: 2Ø.ØØ %
<ENT> To begin span
Use the < > arrow keys to toggle between the span concentration value
and the units field (%/ppm). Use the DÑ arrow keys change the value and/
or the units, as necessary. When you have set the concentration of the span
fluid you are using, press Enter to begin the Span calibration.
Press Enter to enter the span value into the system and begin the span
calibration.
Once the span has begun, the microprocessor samples the output at a
predetermined rate. It calculates the difference between successive samplings
and displays this difference as Slope on the screen. It takes several seconds
for the first Slope value to display. Slope indicates rate of change of the Span
reading. It is a sensitive indicator of stability.
####.##%
Slope=#.###
SO2
Span
When the Span value displayed on the screen is sufficiently stable,
press Enter. (Generally, when the Span reading changes by 1 % or less of
the range being calibrated for a period of ten minutes it is sufficiently stable.)
Once Enter is pressed, the Span reading changes to the correct value. The
instrument then automatically enters the Analyze function.
3.4.3
Offset Function
This software when installed in the 5000BF instruments provides a way to
enter an offset on the zero operation of the analyser. This is useful when the
instrument is zeroed in some inert fluid such as Nitrogen or Argon, but the
background fluid of the process is different. If the background fluid of the
process is different than the zero calibration fluid being used, the reading will
have an offset that will be constant throughout its working range. Thus, the
need to provide an offset when the instrument is being zeroed.
How to access the offset function:
To access this function, the instrument zero mode must be entered by
pushing the Zero key on the front panel of the control unit. The VFD display
will show the following menu selection:
3-20
Part I
Teledyne Analytical Instruments
Photometric Analyzer
Operation /Control Unit 3
Select zero
mode: AUTO
or
Select zero
mode: MAN
Select whether you want the instrument to do an automatic or manual zero. If
you do an automatic zero, the instrument does the zero by itself. If you do a
manual zero you must manually enter inputs to the instrument to accomplish
the zero, see in the corresponding section of the manual on how these two
functions differ.
When the Enter key is pressed, the following menu will appear:
Zero off: 0.0 ppm
<ENT> to begin Zero
The offset value can be modified by using the Up/Down keys. Next section
shows how to select this value. Suffice to say that whatever value you enter,
will be automatically added to the reading. Thus, if you entered -0.1 ppm, at
the end of the zero the display will show -0.1 ppm.
Once the Enter key is pressed the instrument enters the zero mode. If you
chose AUTO zero mode, the instrument will do the work of bringing the
reading back to zero plus the offset value that was entered. If you chose
MANual zero mode, then you must enter input to the instrument as
explained in the corresponding section of the manual but with one
difference: instead of bringing the display to read zero, you must make the
display read zero plus the value entered as offset.
How the offset value is selected:
To find out what the offset value should be, the intended zero calibration
fluid and the a mix of the process background fluid must be procured. This
of course assumes that the zero fluid and the process background fluid are
very different and that an offset will occur.
1. Let the intended zero calibration fluid flow through the 5000BF sample
cell (this assumes that you have started up you system as recommended by
the manual or technical personnel) and do a zero on the instrument. Leave
the offset set to zero value.
2. At the end of the zero function, make sure the analyser reads zero.
3. Flow a zero level of the process background fluid mix through the
5000BF sample cell on the Analyse mode. Wait for the reading to become
stable. Write the reading down. Change the sign of the reading: This is the
Teledyne Analytical Instruments
Part I
3-21
3 Operation/Control Unit
Model 5000B
offset to be entered.
4. Do a manual run to check. Reintroduce the zero calibration fluid. Start a
zero on the analyser but this time enter the offset value.
5. At the end of the zero function, check that the instrument reads the entered
offset.
6. Reintroduce the process background fluid mix to the 5000BF sample cell
in the Analyse mode. It should read close to zero once the reading is stable
(+/- 1% error of full scale).
Spanning the 5000BF:
Since the instrument might be spanned with background fluid the same as
the zero calibration fluid, the span value to be entered should be the span
concentration plus the offset value (if the offset value has a minus sign then
algebraically it becomes a subtraction).
3.5
The Alarms Function
The Model 5000BF is equipped with two fully adjustable set points
concentration with two alarms and a system failure alarm relay. Each alarm
relay has a set of form “C" contacts rated for 3 amperes resistive load at 250
V ac. See Figure in Chapter 2, Installation and/or the Interconnection Diagram included at the back of this manual for relay terminal connections.
The system failure alarm has a fixed configuration described in chapter
2 Installation.
The concentration alarms can be configured from the front panel as
either high or low alarms by the operator. The alarm modes can be set as
latching or non-latching, and either failsafe or non-failsafe, or, they can be
defeated altogether. The setpoints for the alarms are also established using
this function.
Decide how your alarms should be configured. The choice will depend
upon your process. Consider the following four points:
1. Which if any of the alarms are to be high alarms and which if any
are to be low alarms?
Setting an alarm as HIGH triggers the alarm when the
contaminant concentration rises above the setpoint. Setting an
alarm as LOW triggers the alarm when the contaminant
concentration falls below the setpoint.
Decide whether you want the alarms to be set as:
3-22
Part I
Teledyne Analytical Instruments
Photometric Analyzer
Operation /Control Unit 3
• Both high (high and high-high) alarms, or
• One high and one low alarm, or
• Both low (low and low-low) alarms.
2. Are either or both of the alarms to be configured as failsafe?
In failsafe mode, the alarm relay de-energizes in an alarm
condition. For non-failsafe operation, the relay is energized in an
alarm condition. You can set either or both of the concentration
alarms to operate in failsafe or non-failsafe mode.
3. Are either of the alarms to be latching?
In latching mode, once the alarm or alarms trigger, they will
remain in the alarm mode even if process conditions revert back
to non-alarm conditions. This mode requires an alarm to be
recognized before it can be reset. In the non-latching mode, the
alarm status will terminate when process conditions revert to nonalarm conditions.
4. Are either of the alarms to be defeated?
The defeat alarm mode is incorporated into the alarm circuit so
that maintenance can be performed under conditions which
would normally activate the alarms.
The defeat function can also be used to reset a latched alarm.
(See procedures, below.)
If you are using password protection, you will need to enter your
password to access the alarm functions. Follow the instructions in section
3.3.3 to enter your password. Once you have clearance to proceed, enter the
Alarm function.
Press the Alarm button on the front panel to enter the Alarm function.
Use the DÑ keys to choose between % or ppm units. Then press Enter
to move to the next screen.
AL1: 1ØØØ ppm HI
Dft:N Fs:N Ltch:N
Five parameters can be changed on this screen:
• Value of the alarm setpoint, AL1: ####
• Out-of-range direction, HI or LO
• Defeated? Dft:Y/N (Yes/No)
• Failsafe? Fs:Y/N (Yes/No)
Teledyne Analytical Instruments
Part I
3-23
3 Operation/Control Unit
•
•
•
•
Model 5000B
• Latching? Ltch:Y/N (Yes/No).
To define the setpoint, use the < > arrow keys to move the blinking
over to AL1: ####. Then use the DÑ arrow keys to change the
number. Holding down the key speeds up the incrementing or
decrementing.
To set the other parameters use the < > arrow keys to move the
blinking over to the desired parameter. Then use the DÑ arrow
keys to change the parameter.
Once the parameters for alarm 1 have been set, press Alarms
again, and repeat this procedure for alarm 2 (AL2).
To reset a latched alarm, go to Dft– and then press either D two
times or Ñ two times. (Toggle it to Y and then back to N.)
–OR –
Go to Ltch– and then press either D two times or Ñ two times.
(Toggle it to N and back to Y.)
3.6
The Range Select Function
The Range function allows you to manually select the concentration
range of analysis (MANUAL), or to select automatic range switching
(AUTO).
In the MANUAL screen, you are further allowed to define the high and
low (concentration) limits of each Range, and select a single, fixed range to
run.
CAUTION: If this is a linearized application, the new range must be
within the limits previously programmed using the System
function, if linearization is to apply throughout the range.
Furthermore, if the limits are too small a part (approx 10 %
or less) of the originally linearized range, the linearization
will be compromised.
3.6.1
Manual (Select/Define Range) Screen
The Manual range-switching mode allows you to select a single, fixed
analysis range. It then allows you to redefine the upper and lower limits, for
the range.
Press Range key to start the Range function.
3-24
Part I
Teledyne Analytical Instruments
Photometric Analyzer
Operation /Control Unit 3
Select range
mode: MANUAL
If above screen displays, use the DÑ arrow keys to Select MANUAL,
and press Enter.
Select range to run
—> Ø1 Ø2 Ø3 CAL<—
Use the < > keys to select the range: 01, 02, 03, or CAL. Then press
Enter.
Fluid use: SO2
Range: Ø — 10 %
Use the < > keys to toggle between the Range: low-end field and the
Range: high-end field. Use the DÑ keys to change the values of the fields.
Press Escape to return to the previous screen to select or define another
range.
Press Enter to return the to the Analyze function.
3.6.2
Auto Screen
Autoranging will automatically set to the application that has at least
two ranges setup with the same fluides.
In the autoranging mode, the microprocessor automatically responds to
concentration changes by switching ranges for optimum readout sensitivity.
If the upper limit of the operating range is reached, the instrument automatically shifts to the next higher range. If the concentration falls to below 85%
of full scale of the next lower range, the instrument switches to the lower
range. A corresponding shift in the DC concentration output, and in the
range ID outputs, will be noticed.
The autoranging feature can be overridden so that analog output stays
on a fixed range regardless of the contaminant concentration detected. If the
concentration exceeds the upper limit of the range, the DC output will
saturate at 1 V dc (20 mA at the current output).
However, the digital readout and the RS-232 output of the concentration are unaffected by the fixed range. They continue to read beyond the fullscale setting until amplifier saturation is reached. Below amplifier saturation,
the overrange readings are accurate UNLESS the application uses linearization over the selected range.
Teledyne Analytical Instruments
Part I
3-25
3 Operation/Control Unit
Model 5000B
The concentration ranges can be redefined using the Range function
Manual screen, and the application fluides can be redefined using the System
function, if they are not already defined as necessary.
CAUTION: Redefining applications or ranges might require relinearization and/or recalibration.
To setup automatic ranging:
Press Range key to start the Range function.
Select range
mode : AUTO
If above screen displays, use the DÑ arrow keys to Select AUTO, and
press Enter.
Press Escape to return to the previous Analyze Function.
3.6.3
Precautions
The Model 5000BF allows a great deal of flexibility in choosing ranges
for automatic range switching. However, there are some pitfalls that are to be
avoided.
Ranges that work well together are:
• Ranges that have the same lower limits but upper limits that differ
by approximately an order of magnitude
• Ranges whose upper limits coincide with the lower limits of the
next higher range
• Ranges where there is a gap between the upper limit of the range
and the lower limit of the next higher range.
Range schemes that are to be avoided include:
• Ranges that overlap
• Ranges whose limits are entirely within the span of an adjoining
range.
• Ranges where the zero is suppressed, is 1-10, 1-100, etc,
however, 80-100, 90-100 is ok where the zero fluid is actually
100% concentration and the calibration is inverted.
3-26
Part I
Teledyne Analytical Instruments
Photometric Analyzer
Operation /Control Unit 3
Figure 3-2 illustrates these schemes graphically.
0
0.01
0.1
80
90
100
Figure 3-2: Examples of Autoranging Schemes
Teledyne Analytical Instruments
Part I
3-27
3 Operation/Control Unit
3.7
Model 5000B
The Analyze Function
Normally, all of the functions automatically switch back to the Analyze
function when they have completed their assigned operations. Pressing the
Escape button in many cases also switches the analyzer back to the Analyze
function. Alternatively, you can press the Analyze button at any time to
return to analyzing your sample.
The Analyze function screen shows the impurity concentration and the
application fluides in the first line, and the range in the second line. In the
lower right corner, the abbreviation Anlz indicates that the analyzer is in the
Analyze mode. If there is an * before the Anlz, it indicates that the range is
linearized.
1.95 ppm
SO2
R1:Ø —10 *Anlz
If the concentration detected is overrange, the first line of the display
blinks continuously.
3.8
Programming
CAUTION: The programming functions of the Set Range and Curve
Algorithm screens are configured at the factory to the users
application specification. These functions should only be
reprogrammed by trained, qualified personnel.
To program, you must:
1. Enter the password, if you are using the analyzer’s password
protection capability.
2. Connect a computer or computer terminal capable of sending an
RS-232 signal to the analyzer RS-232 connector. (See chapter 2
Installation for details). Send the rp command to the analyzer.
3. Press the System button to start the System function.
DIG_FILT SELF-TEST
PWD LOGOUT MORE
Use the < > arrow keys to blink MORE, then press Enter.
3-28
Part I
Teledyne Analytical Instruments
Photometric Analyzer
Operation /Control Unit 3
AUTOCAL FILSOLL HOLD
CAL-HOLD-TIMER MORE
Select MORE and press ENTER one more time
ALGORITHM
MORE OUTPUT:
APPLICATION
4MA
Now you will be able to select the APPLICATION and ALGORITHM set-up functions.
3.8.1
The Set Range Screen
The Set Range screen allows reprogramming of the three analysis
ranges and the calibration range (background fluid, low end of range, high
end of range, and % or ppm units). Original programming is usually done at
the factory according to the customer’s application. It must be done through
the RS-232 port using a computer running a terminal emulation program.
Note: It is important to distinguish between this System programming
subfunction and the Range button function, which is an operator
control. The Set Range Screen of the System function allows the
user to DEFINE the upper and lower limits of a range AND the
application of the range. The Range button function only allows the
user to select or define the limits, or to select the application, but
not to define the application.
Normally the Model 5000BF is factory set to default to manual range
selection, unless it is ordered as a single-application multiple-range unit (in
which case it defaults to autoranging). In either case, autoranging or manual
range selection can be programmed by the user.
In the autoranging mode, the microprocessor automatically responds to
concentration changes by switching ranges for optimum readout sensitivity.
If the upper limit of the operating range is reached, the instrument automatically shifts to the next higher range. If the concentration falls to below 85%
of full scale of the next lower range, the instrument switches to the lower
range. A corresponding shift in the DC concentration output, and in the
range ID outputs, will be noticed.
The autoranging feature can be overridden so that analog output stays
on a fixed range regardless of the contaminant concentration detected. If the
concentration exceeds the upper limit of the range, the DC output will
saturate at 1 V dc (20 mA at the current output).
However, the digital readout and the RS-232 output of the concentration are unaffected by the fixed range. They continue to read beyond the full-
Teledyne Analytical Instruments
Part I
3-29
3 Operation/Control Unit
Model 5000B
scale setting until amplifier saturation is reached. Below amplifier saturation, the
overrange readings are accurate UNLESS the application uses linearization over
the selected range.
To program the ranges, you must first perform the four steps indicated at
the beginning of section 3.8 Programming. You will then be in the second
System menu screen.
ALGORITHM APPLICATION
MORE
OUTPUT: 4MA
Use the < > arrow keys again to move the blinking to APPLICATION
and press Enter.
Sel rng to set appl:
—> Ø1 Ø2 Ø3 CAL <—
Use the DÑ arrow keys to increment/decrement the range number to
01, 02, 03, or CAL, and press Enter.
Fluid Name
**********
FR:Ø TO:1Ø %
Use the < > arrow keys to move to Fluid Name, FR: (from—lower end
of range), TO: (to—upper end of range), and PPM or %.
Use the DÑ arrow keys to increment the respective parameters as
desired. Press Enter to accept the values and return to Analyze mode. (See
note below.) Repeat for each range you want to set.
Note: The ranges must be increasing from low to high, for example, if
Range 1 is set to 0–10 % and Range 2 is set to 0–100 %, then
Range 3 cannot be set to 0–50 % since that makes Range 3 lower
than Range 2.
Ranges, alarms, and spans are always set in either percent or ppm units,
as selected by the operator, even though all concentration-data outputs
change from ppm to percent when the concentration is above 9999 ppm.
Note: When performing analysis on a fixed range, if the concentration
rises above the upper limit as established by the operator for that
particular range, the output saturates at 1 V dc (or 20 mA). However, the digital readout and the RS-232 output continue to read
regardless of the analog output range.
To end the session, send:
st<enter>
st<enter>
3-30
Part I
Teledyne Analytical Instruments
Photometric Analyzer
Operation /Control Unit 3
to the analyzer from the computer.
3.8.2
The Curve Algorithm Screen
The Curve Algorithm is a linearization method. It provides from 1 to 9
intermediate points between the ZERO and SPAN values, which can be
normalized during calibration, to ensure a straight-line input/output transfer
function through the analyzer.
Each range is linearized individually, as necessary, since each range
will usually have a totally different linearization requirement.
To linearize the ranges, you must first perform the four steps indicated
at the beginning of section 3.8 Programming. You will then be in the second
System menu screen.
3.8.2.1 Manual Mode Linearization
To linearize manually, you must have previous knowledge of the
nonlinear characteristics of your fluides. You enter the value of the differential between the actual concentration and the apparent concentration (analyzer output). TAI has tabular data of this type for a large number of fluides,
which it makes available to customers on request. See Appendix for ordering
information. To enter data:
From the System Functions Screen—
1. Use < > to select ALGORITHM , and Enter.
2. Select and Enter SETUP.
3. Enter MANUAL from the Calibration Mode Select screen.
Dpt INPUT OUTPUT
Ø Ø.ØØ
Ø.ØØ
The data entry screen resembles the verify screen, but the fluid values
can be modified and the data-point number cannot. Use the < > keys to
toggle between the INPUT and OUTPUT fields. Use the DÑ keys to set the
value for the lowest concentration into the first point. Then press Enter.
After each point is entered, the data-point number increments to the
next point. Moving from the lowest to the highest concentration, use the DÑ
keys to set the proper values at each point.
Dpt INPUT OUTPUT
0 Ø.ØØ
Ø.ØØ
Teledyne Analytical Instruments
Part I
3-31
3 Operation/Control Unit
Model 5000B
Repeat the above procedure for each of the data points you are setting (up
to nine points: 0-8). Set the points in unit increments. Do not skip numbers. The
linearizer will automatically adjust for the number of points entered.
When you are done, Press ESCAPE. The message, Completed. Wait for
calculation, appears briefly, and then the main System screen returns.
To end the session, send:
st<enter>
st<enter>
to the analyzer from the computer.
3.8.2.2 Auto Mode Linearization
To linearize in the Auto Mode, you must have on hand a separate
calibration fluid for each of the data points you are going use in your linearization. First, the analyzer is zeroed and spanned as usual. Then, each special
calibration fluid, for each of the intermediate calibration points, is flowed, in
turn, through the sensor. As each fluid flows, the differential value for that
intermediate calibration point is entered from the front panel of the analyzer.
Note: The span fluid used to span the analyzer must be >90% of the
range being analyzed.
Before starting linearization, perform a standard calibration. See section
4.4. To enter data:
From the System Functions screen—
1. Use < > to select ALGORITHM , and Enter.
2. Select and Enter SETUP.
3. Enter AUTO from the Calibration Mode Select screen.
The Auto Linearize Mode data entry screen appears.
19.5 ppm SO2
Input(Ø) :20.00
5. Use the DÑ keys to set the proper value of calibration fluid, and
Enter. Repeat this step for each cal-point number as it appears in
the Input (x) parentheses.
6. Repeat step 5 for each of the special calibration fluides, from the
lowest to the highest concentrations. Press Escape when done.
To end the session, send:
st<enter>
st<enter>
to the analyzer from the computer.
3-32
Part I
Teledyne Analytical Instruments
Part I: Control Unit/Analysis Unit
Maintenance 3
Maintenance
Aside from normal cleaning and checking for leaks at the gas connections,
routine maintenance is limited to replacing filter elements and fuses, and
recalibration.
WARNING: SEE WARNINGS ON THE TITLE PAGE OF THIS
MANUAL.
4.1
Fuse Replacement
The 5000B requires two 5 x 20 mm, 6.3 A, F type (Fast Blow) fuses.
The fuses are located inside the main housing on the Electrical
Connector Panel, as shown in Figure 4-3. To replace a fuse:
1. Disconnect the Unit from its power source.
2. Place a small screwdriver in the notch in the fuse holder
cap, push in, and rotate 1/4 turn. The cap will pop out a
few millimeters. Pull out the fuse cap and fuse, as
shown in Figure 4-1
Teledyne Analytical Instruments
Part I: 4-1
3 Maintenance
Model 5000B Photometric Analyzer
Figure 4-1: Removing Fuse Block Cap and Fuse from Housing
2. Replace fuse by reversing process in step 1.
4.2
System Self Diagnostic Test
NOTE: Always run self diagnostic with the intended zero fluid.
1. Press the System button to enter the system mode.
2. Use the < > arrow keys to move to More, and press Enter.
3. Use the < > arrow keys to move to Self-Test, and press Enter.
The following failure codes apply:
Table 4-1: Self Test Failure Codes
Power
0
1
2
3
OK
5 V Failure
15 V Failures
Both Failed
Analog
0
1
2
3
4-2: Part I
OK
DAC A (0–1 V Concentration)
DAC B (0–1 V Range ID)
Both Failed
Teledyne Analytical Instruments
Part I: Control Unit/Analysis Unit
Maintenance 3
Preamp
0
OK
>0
means that some of the ten gains of the
amplifier have a large offset. The number is a
code that tells which of the ten gtains have the
large offset.
Cell (detector)
0
OK
>0
means that the analyzer failed to
balance the measuring and the reference
signals, the larger the number the farther off
they were.4.3 Major Internal Components
The major components in the Control Unit are shown in Figure 4-3.
Figure 4-3: Control Unit Major Internal Components
Teledyne Analytical Instruments
Part I: 4-3
3 Maintenance
Model 5000B Photometric Analyzer
WARNING: HAZARDOUS VOLTAGES EXIST ON CERTAIN
COMPONENTS INTERNALLY WHICH MAY PERSIST
FOR A TIME EVEN AFTER THE POWER IS TURNED
OFF AND DISCONNECTED.
The 5000B Control Units contain the following major components:
• Power Supply
• Motherboard (with Microprocessor, RS-232 chip, and
Preamplifier PCB)
• Front Panel Display Board and Displays—
5 digit LED meter
2 line, 20 character, alphanumeric, VFD display
See the drawings in the Drawings section or addendum in back of
this manual for details.
4-4: Part I
Teledyne Analytical Instruments
Part II: Analysis Unit
OPERATING INSTRUCTIONS
Model 5000B
Photometric Analyzer
Part II: Analysis Unit
NEC or ATEX Type
5000B - GP, Rack, Panel (Integral or Remote)
5000 - GP, Bulkhead (Z-Purged in Div II or Zone 2 areas)
I, II, B, C, D (Integral)
5000B-(X-Purged, 1,1, B, C, D) (Integral)
5000B-(Purged, Zone 1) (Integral)
Teledyne Analytical Instruments
Part II: i
Model 5000B Photometric Analyzer
Table of Contents
4 Operational Theory
4.0 Operations ..................................................................... 4-1
4.1 Control Function ............................................................ 4-2
4.1.1 Analysis Section .................................................... 4-2
4.1.2 Explosion-Proof Version: Control Module .............. 4-2
4.2 Start Up.......................................................................... 4-3
4.2.1 Preliminary Inspection ........................................... 4-3
4.2.2 Pre-Start Up Electrical Checkout ........................... 4-4
4.2.3 Power On Observations ......................................... 4-4
4.3 Calibration ..................................................................... 4-6
4.4 Operational Theory Continued ....................................... 4-17
4.4.1 Source Module....................................................... 4-17
4.4.2 Sample Cell ........................................................... 4-19
4.4.3 Power ..................................................................... 4-22
4.4.4 Detector Compartment ........................................... 4-22
5 Routine Maintenance
5.0 Routine Maintenance ..................................................... 5-1
5.1 Automatic Operation and Routine Operational Duties ... 5-1
5.2 System Visual Check and Response Procedure ........... 5-1
5.3 Routine Maintenance ..................................................... 5-2
5.4 Suggested Preventive Maintenance Schedule .............. 5-2
5.5 Service Procedures and Adjustments ............................ 5-3
5.5.1 Electronics ............................................................. 5-3
5.5.2 Power Supply Test Points ....................................... 5-3
5.5.3 Setup of the Signal Processing Front-End Amplifier .. 5-3
5.5.4 Oscilloscope Display of the I to E Converter Output .. 5-4
5.5.5 Balancing the Optics for Equal Light Transmission
with Zero Fluid in the Sample Cell ......................... 5-5
5.5.6 Setup of the Logarithmic Amplifier ......................... 5-6
5.5.7 Inverting Amplifier .................................................. 5-6
5.5.8 Integrated Reference and Measuring Signals ........ 5-7
5.5.9 Battery-Powered Oscilloscope Synchronization Point 5-7
5.6 Interface Board Terminal Strip ........................................ 5-7
ii: Part II
Teledyne Analytical Instruments
Part II: Analysis Unit
Appendix
A-1 Specifications ................................................................ A-1
A-2 Recommended 2-Year Spare Parts List ......................... A-4
A-3 Drawing List ................................................................... A-5
Teledyne Analytical Instruments
Part II: iii
Model 5000B Photometric Analyzer
iv: Part II
Teledyne Analytical Instruments
Operations/Analysis Unit 4
4.0
Operations
Before shipment, TAI calibrates the analyzer for your application when
feasible. Calibration data is listed in the Appendix. Prior to calibration, TAI
checks the electronics of the analyzer and makes all of the necessary internal
printed circuit board adjustments. Calibration is performed to determine the
proper or close proximity zero and span settings, and also to verify that the
analyzer response is linear.
After calibration, TAI makes a lengthy stability check to insure that the
analyzer performs within all specifications. We advise that you recalibrate
your equipment as part of start-up for the following reasons:
1. During shipment, it is possible that components have been jarred
out of position or damaged.
2. Your process may be of a proprietary nature. Beyond checking
electrical stability, TAI is unable to make a meaningful calibration of the system, requiring these adjustments to be made by
you.
3. In other cases precise calibration from the original feasibility/
proposal may have determined field calibration of the analyzer
connected to your process stream is required and accuracy will
only be obtainable upon representatiive matching and use of the
actual process fluid background components at the operating
physical conditions of flow, pressure and temperature of the
sample.
In any case, it is important that you calibrate the analyzer when it is first
installed. Zero checks should be made routinely once or twice a week and
span calibration should be performed weekly, at first, and monthly after
reproducibility is assured.
Teledyne Analytical Instruments
A Business Unit of Teledyne Electronic Technologies
4–1
4 Operations/Analysis Unit
4.1
Control Functions
4.1.1 Analysis Section, fully explosion proof, Z or X
purged Nema enclosure or Cenelec Purged (pending).
The control functions for the analysis section are located on the Front
of the Enclosure module:
1. POWER ON/OFF: This function is hard wired into the
enclosure for power to the control/analysis section.
2.a
(C-A)(1000)
(B-A)
For example, if the range of analysis is 20-80%, and a desirable alarm
setpoint is 30%, then A = 20, B = 80, and C = 30
X = (30-20)(1000) = 167
(80-20)
X=
2.b RANGE:
Control unit allows changing the range by some
predetermined amount, such as 4X or 5X; i.e., triple range: low
range of 0-100 ppm, mid of 250ppm and a high range of 0-500
ppm.
3. Mode: Programmable functions for incorporating an automatic
zero, span or autoranging. Autocal also possible with fluids by
valving or by filter solenoid.. Consult control unit sections of the
manual.
4. Digital displayt: indicates the concentration of the component
of interest. Consult control unit section for setting up units as
ppm, mg/l, %, etc.
4.1.2
Explosion-Proof Version: Control Module
When the control module is integral with the analysis section (single explosion-proof enclosure), it has all of the same control functions as the General
Purpose control module, however, the buttons are replaced by two switches.
These switches have different movements to achieve the same functionality as the
4 button model. (Consult factory or assure the manual has the correct version of
the front panel control switches and functions.
4–2
Teledyne Analytical Instruments
A Business Unit of Teledyne Electronic Technologies
Operations/Analysis Unit 4
The control unit digital display must handle functions for both the analysis
section and the control module.
4.2
Start-p
Information contained in this paragraph is based on the premise that the
analyzer has been properly installed and that it is in operable condition. If
difficulties arise during start-up, it is probable that some form of damage has
incurred during shipment or some installation error has inadvertently been made.
Accessory test equipment is not necessary for start-up of the 5000B..
However, if the analyzer malfunctions at start-up, an oscilloscope and a
multimeter will be required for troubleshooting . TAI recommends that a dual
trace oscilloscope be used. A dual trace oscilloscope will permit the operator to
see two different waveforms simultaneously.
4.2.1
Preliminary Inspection
Before power is supplied to the analyzer, all modules should be opened
and inspected for damage or loose components. Plug-in circuit cards should
be firmly seated in their sockets. All barrier strip wiring connections must be
inspected, and user-installed wiring between units verified as being in agreement with the system interconnection diagram.
Control Settings
Prior to turning on the power, the controls on and within the control
module should be positioned as follows:
Analyzers not equipped with Auto Zero
1. ON/OFF functionality hardwired at customers remote terminal
block or power switch.
2. SPAN control preset to the setting noted in Specific Application
Data in the Appendix.
Analyzers equipped with Auto Zero
1. ON/OFF functionality hardwired at customers remote terminal
block or power switch.
2. SAMPLE/ZERO switch on ZERO.
3. SPAN control preset to the setting noted in Specific Application
Data in the Appendix.
Teledyne Analytical Instruments
A Business Unit of Teledyne Electronic Technologies
4–3
4 Operations/Analysis Unit
4.2.2
Pre-Start-up Electrical Checkout
After the preliminary procedures have been accomplished (refer to Preliminary Inspection and Control Settings, above), the integrity of the system interconnection and the power sources must be verified before attempting the analytical start-up procedures.
The observations and measurements described in the following paragraphs
are vital to the operation of the analyzer. If the analyzer does not respond as
described, the equipment has been damaged in shipment or installation, or the
user-installed wiring is in error. If a problem arises, correct it before proceeding
further.
The following procedures should be employed in the same sequence in
which they appear.
4.2.3
Power On Observations
Turn both the analysis/control module at the remote wiring panel of
customer to ON and make the following observations:
1. Open the control/analysis section detector module and verify that
the chopper motor is operating. Open the cover of the
compartment and verify motion. The motor should start turning
the instant power is established. If it does not, check the integrity
of the main fuse on the control module door. If the fuse is blown,
re-check the power service connections on TS2 in the control
module, and the control module to analysis section
interconnection wiring (refer to Electrical Installation in Chapter
3.0: Installation, and dwg. _________).
2. The lamp source should light the instant power is established.
Open the enclosure door and view the source module to verify
illumination.
WARNING:
4–4
1. The light intensity from the Mini IR lamp or quartz iodine lamp
If used is intense and should not be looked at directly without
special protective eyewear. Protective goggles with shaded
lenses (Fed. Spec. #5) should be worn if it is necessary to look
directly at the source.
2. Before opening any of the enclosure covers with the power on,
make certain that the area has been classified as safe to do so.
Teledyne Analytical Instruments
A Business Unit of Teledyne Electronic Technologies
Operations/Analysis Unit 4
3. If the analyzer section has been equipped with the automatic zero
SOL option, the zero solenoid device in the accessory sampling
system should have energized the instant power was established.
The device (or devices) should be energized because the mode
switch has been preset to the ZERO position.
4. If the test procedure was normal, the devices should have been
seen or heard to operate as described by personnel located at the
analysis section installation site, and no further check need be
made at this time. If operation is not as described, refer to
Troubleshooting in Chapter 5.0.
5. Check analyzer operation by completing the calibration
procedure described below in Calibration after allowing the
instrument to warm up. The electrical circuits take from 30 to 40
minutes to stabilize.
NOTE: It will take at least four hours for the analyzer to completely stabilize
with respect to temperature.
Teledyne Analytical Instruments
A Business Unit of Teledyne Electronic Technologies
4–5
4 Operations/Analysis Unit
4.3
Calibration
Standardization Fluids
Two standardization fluids are necessary to calibrate the analyzer:
1. Zero Fluid: The zero standard fluid must have a composition similar
to the sample, and ideally, contains none of the components of
interest. The zero fluid should be laboratory analyzed to determine its
composition. The exact composition must be known, as the
accuracy of the analysis can be no better than the knowledge of the
standardization fluid.
2. Span Fluid: The span fluid must be representative of the sample fluid
in composition (like the zero fluid), and contain a measured quantity
of the component of interest. The component of interest content of
the fluid should be in the region of 75% to 100% of the range of
measurement. As with the zero fluid, the accuracy of the system is
dependent upon the your knowledge of the span fluid composition.
Ideally, the span sample should contain at least 75% of whatever the
instrument is set up to analyze.
Procedure
1. Introduce zero fluid (see above) into the sample cell. Flow liquid
samples into the cell at a flow rate of about 50 cc/minute to allow
the sample to completely flush to a steady state concentration.
Make certain that bubbles are not introduced or formed in the
cell. (Some back-pressure may help avoid this.) Gas samples can
be introduced at about 200-500 cc/minute.
2. The digital meter should be capable of adjusting the zero level to
an on scale reading. Consult section for zero functioning. If the
reading cannot be adjusted then the signals will require
rebalancing for your particular process fluid. The filter wheel
located inside the detector module must be removed and balanced
optically with screens. See section:___________
b. If the measuring peak is so far out of balance with the
reference peak that1 it can no longer be adjusted with
potentiometer R3, the optical filters require re-screening.
If the analyzer has been in use for some time, it is possible
that the sample cell windows need cleaning or that a filter
has deteriorated.
Another cause of peak imbalance might be that the sample
4–6
Teledyne Analytical Instruments
A Business Unit of Teledyne Electronic Technologies
Operations/Analysis Unit 4
chemical background has changed. In some cases, TAI is
not able to duplicate the background your sample for
purposes of optically balancing the analyzer before shipment.
In these cases, it is necessary for you to screen for an
approximate balance, and to then electronically adjust R3 for
precise balance. To do so:
1. Reset R3 to its midpoint.
2. Re-screen the filter wheel, as necessary, to obtain a
measuring voltage within 10% of the reference voltage.
Every time a screen is added or removed from a filter, the
analyzer must be turned off, and the filter wheel removed
from the analyzer. When the filter wheel is replaced in the
analyzer, its rotational position is not critical, but the
white backing must face in the direction of the position
sensor. The filter wheel must also be securely tightened,
so that no slippage or vibration can occur. See Figure 5-1.
NOTE: Refer to Figure 5-1 when installing filter screens. Screens should be
installed in the filter disk cup, under the filter holder. Also, if a balance ring is used, it should be placed over the screen.
c. After screening to bring the measuring voltage to within
10% of the reference voltage, adjust R3 as in step a above
to make the measuring peak voltage read the same as the
reference peak voltage.
5. Turn the NORM/ZERO switch to ZERO. The analysis section
meter should be made to read zero by adjusting the coarse ZERO
control on the analysis section power module.
6. Check the control module SPAN setting to make sure it agrees
with the calibration results obtained by TAI (see Specific
Application Data in the Appendix).
7. Adjust the ZERO control on the control module to give a zero
reading on the control module meter.
8. Add span fluid (see Span Fluid, above) to the sample cell. Make
certain that all of the zero fluid is displaced.
9. Adjust the control module SPAN control to obtain the correct
meter reading with reference to the concentration of span fluid.
For example, if the sample contains 100% of whatever the
Teledyne Analytical Instruments
A Business Unit of Teledyne Electronic Technologies
4–7
4 Operations/Analysis Unit
instrument is set up to analyze, then the SPAN control must be
adjusted for a full scale reading, i. e., 200 ppm water in EDC.
10. Re-check the ZERO setting with zero fluid.
11. If desired, the linearity of the analyzer can be checked with a fluid
intermediate in concentration between the zero and the span fluid.
12. The analyzer is now calibrated. It is often desirable to check
calibration (fine tune) on a dynamic sample from your process,
double checking the 5020 analyzer response with laboratory
analyzed grab samples. This is desirable where there is a
possibility that your sample stream may have some background
materials not in the makeup of the calibration fluid.
13. From time to time, re-check the zero setting. If it is found that
there is no zero drift, re-checking the zero setting may become
unnecessary or may be performed only on an occasional basis.
14. Some optical filters used in some applications will be so
temperature sensitive that screening must be performed with the
filters near the operating temperature.
DIRECTIONS FOR USING TELEDYNE CALIBRATION OPTIONS
FOR ON-LINE PROCESS PHOTOMETRIC ANALYZERS
I
General
These calibration options consists of procedures for calibrating analyzers
on-line. These techniques are offered when process conditions (high
pressures, temperatures, sample phase changes) are extremely difficult to
deal with and calibration standards are impossible, difficult to obtain, are
too expensive to use due to volume consumption into the system, are
unstable, or are difficult to introduce into the analyzer or sample system
because of toxicity, pressure, etc. Also many times the sample stream
composition is difficult to match with a calibration fluid.
In one case an optical absorbing filter(s) is inserted into the light path
of the analyzer. The absorber is actuated by a switch(s) located on
the readout panel of the control unit. The option functions by presenting a calibrated and reproducible absorbance or fluid into the light
path of the analyzer.
4–8
Teledyne Analytical Instruments
A Business Unit of Teledyne Electronic Technologies
Operations/Analysis Unit 4
A zero may be established with a reproducible simulated (offset)
zero absorbance fluid in the sample cell of the analyzer. When
possible this fluid should be stable for H2O content and should
approximate the process being measured to minimize the offset
zeroing, otherwise, dry air or nitrogen can be used. The analyzer
must first be calibrated for sensitivity full scale by using known
certified/analyzed samples containing the component (analyte(s) to be
measured.
NOTES:
These samples (low/mid/high about 1 liter each) must be
prepared and provided for introduction into the zero and/or
span port of the sample system, with outlet collected from the
cal return port of the sample system. A 500 to l liter glass
syringe with Luor-loc to 1/4" tube connections should be used
for introducing the samples into the analyzer sample cell for
zero and span cal adjustments. These are introduced through
the calibration ports usually labelled zero or span fluid inlets.
The exiting samples when nontoxic are usually collected in
waste containers from the cal-return port of the instrument
cabinet. These cannot be used again as water vapor from
containers and atmosphere will contaminate them. They would
require analysis again before reintroducing for correlation
purposes. Also, its is a good practice to flush copiously the
sampling train with each calibration sample prior to accepting
any read value. Each sample should be allowed to stabilize
before reading. When a N2 flush is used to dry the sampling
train before each sample is read, the readings will come to
equilibrium faster since no water cross-contamination should
be evident or occur.
11
IF CALIBRATION PROCESS REPRESENTATIVE SAMPLES
CANNOT BE OBTAINED,
THEN A DIRECT ON-LINE TWO-POINT CALIBRATION APPROACH
CAN BE USED AS FOLLOWS:
Assuming customer has designed in a sampling valve (this
valve may contain a chromatographic septum port for a needle,
i.e., for toxic or flammable samples at low pressure), hookup
for a sampling bomb (high pressure), grab sample port, or
sealed container to draw off representative process grab
samples. Note: All samples are brought to the analytical lab
for speedy analyses (preferably analyzed within 15 minutes) to
correlate to process conditions. The sample analyzed should
be by an analytical method with an acceptable precision and
accuracy as used to normally monitor the process and confirm
the on-line analysis. The on-line analyzer is only as accurate
Teledyne Analytical Instruments
A Business Unit of Teledyne Electronic Technologies
4–9
4 Operations/Analysis Unit
as the off-line method used to verify the process variables.
Below is an example of an on-line calibration when measuring
0-200ppm water in liquid TDI (assumes TDI is a toxic liquid at
standard temperature and pressure conditions).
The first sample should be taken when the analyte (H20)
concentration is known to be low (approximately O-.002 %
water). The sample is quickly withdrawn and analyzed in the
lab to determine the water content via an acceptable lab
method (This may be Karl Fischer titration, gas chromatography, IR spectroscopy or volume extraction/distillation, etc.). At
this time, the instrument zero is made to read exactly zero on
the output of the analyzer (i.e., on the % or PPM of the panel/
digital meter, 4-20 ma current, or 0-1 VDC etc.) using the zero
potentiometer of the analyzer or the digital or microprocessors
zeroing calibration adjustment, Record the lab value, analyzed corresponding to the zero set-point adjustment.
A second sample from the process must be grabbed after a
steady state upscale reading has been reached. Hopefully, at
this time, the customer can make a minor changes in the
process to cause a slight upscale reading (1 0-30% of the full
scale or more if possible) in order to obtain a steady-state
reading at another concentration level. It this is not possible,
then an appropriate time interval must occur when the process
naturally changes to an upscale steady-state level concentration. At this time the second calibration sample is grabbed and
immediately analyzed. Record this value, This higher concentration value is subtracted from the first sample analyzed, Its
difference value1 defines the slope of the calibration
curve.
value1- This value will be used to determine the calibration
slope of the instrument range.
Using the span adjustment of the analyzer, set the output reading to agree
with this difference in concentration. Once the slope is set, adjust the zero
of the instrument to agree with the true concentration to that of the analyzed
steady-state sample presently flowing through the instrument cell. Now the
analyzer is calibrated to the process fluid.
Zero calibration using secondary standard zero and span flag(s)
AFTER the analyzer has been calibrated on the process fluid, a simulation
of this process on-line calibration can be made using internal synthetic
4–10
Teledyne Analytical Instruments
A Business Unit of Teledyne Electronic Technologies
Operations/Analysis Unit 4
optical filters. These optical filters are stable and are chosen to indicate the
measured component at the required instrument wavelengths. Therefore,
future, faster, yet much simpler calibration zero and span checks can be
made without the unnecessary tedious on-line calibration described above
nor the consumption of expensive calibration fluids which may be difficult to
handle or obtain, are unstable, or toxic in nature.
A Fitter(s) at the factory is chosen and installed in the instrument (approximating in absorbance value to the anticipated stream composition background) to give reproducible zero/ span value when nitrogen or air background is in the measuring cell. This capability is possible when the zero
offset between the process fluid and dry air or nitrogen remains close to the
zero point of the actual process fluid (i.e., after calibration, the zero off-set
can be adjusted over the entire range of the meter, plus or minus 100 %
from zero). In the case of the calibration zero check value, the requirement
for installing a zero optical flag with dry nitrogen as the background fluid
depends upon how unbalanced the reference and measure channel peak
heights are with respect to each other as measured using an oscilloscope at
Test Point 1 (TP1 -Violet)) of the AGC- board designated B-1 4521-4. A
good ratio (ref/meas.) estimate to keep within is (1 volt minimum: 2 volt
maximum) to (2 volt maximum: 1 volt minimum) between the zero process
fluid signal levels and the nitrogen calibration fluid background signal levels.
With the process fluid in the cell at the zero point of the calibration range,
the reference and measure pulses are optically balanced using density
screens placed over the reference and/or measure filters. These signals are
balanced to 9 volts each as measured at TP4 (ref-orange) and TP3 (measyellow) on the PEAK LEVEL DETECTOR BOARD designated B- 14074A. The spectral background absorbance at the reference versus measure
wavelengths of the process fluid determines the magnitude of the unbalanced ref/meas ratio. This ratio is kept within the 1:2 to 2:1 values for
proper operation of the AGC circuitry and therefore proper stability and
signal/noise levels of the instrument output. After balancing on a zero
sample of the process fluid, if the ratio is not found to be within the 1:2 to 2:1
range, a zero flag is necessary and installed in the sample cell compartment
along with a span flag if ordered. This zero flag when chosen is also
solenoid actuated to bring the ratio within the 1:2 to 2:1 range between
process zero fluid and zero nitrogen or dry air background. The span flag is
actuated while the zero offset level (usually when nitrogen is used as a zero
calibration fluid) is switched in.
Zero calibration check after process on-line calibration.
To check zero on the analyzer, immediately back-flush out the process fluid
and dry the cell out with a reproducible zero fluid that should never contain
any of the analyte. (This is usually done with N2 assuming the process fluid
has low vapor pressure and can be purged dry in an acceptable short time
Teledyne Analytical Instruments
A Business Unit of Teledyne Electronic Technologies
4–11
4 Operations/Analysis Unit
period). In this case, nitrogen or dry air (typically-100OF dewpoint or 2ppm
water) can be used. Manually switch in the zero offset check from the
control unit to operate the zero solenoid flag (depending upon the application,
this may or may not simultaneously insert a zero flag into the light path;
indeed, 90% of the time it is not needed). The factory zero offset value
was set from its best determined factory calibration and was approximately
set between 10-20% of the full scale range for the zero. After the field online calibration, a zero offset value around a 10-20% meter range should be
set, using the potentiometer adjustment located within the analyzer control
unit to bring it into the 10-20% range. This may require a short term
area declassification (on explosion proof units) in order to make this adjustment.
The zero offset adjustment potentiometer is panel-mount located
within the control unit. The potentiometer identified (zero- offset) is
adjusted while the reproducible zero fluid background is in the sample
cell. (This zero check may be automatically or manually operated
depending upon the sample system and electronic instrument design).
RECORD the zero calibration reading for future reference and
agreement checks of the zero stability.
Note the instrument zero reading should typically be between 10-20%
of full scale calibrated range (chosen at the factory), This reading
should always repeat on nitrogen with the zero offset and/or
flag introduced. If not, readjust the instrument fine or coarse zero
potentiometer (s) or microprocessor/computer etc., to read the
correct concentration value known (determined after the original online process calibration).
Span calibration check after performing a process on-line calibration.
After zero calibration above.
To check span on the analyzer, immediately back-flush out the
process fluid and dry the cell with a reproducible zero fluid that does
not contain any of the analyte. In this case, nitrogen or dry air
(typically -75 ‘C dew point or less than 1 PPM water) should be
used. Manually introduce the span flag from the readout control unit
to operate the solenoid containing the appropriate span filter into the
light path of the analyzer (this may be automatically or manually
operated depending upon the sample system and electronic instrument design). RECORD the span calibration reading for future
calibration reference of the span sensitivity agreement. The filter
span flag is chosen at the factory to represent an upscale reading of
typically between 60-90% of the full scale range.
NOTE:
4–12
The zero or span flag readings should always repeat if the
analyzer remains in calibration. Any drift in the zero or span can
Teledyne Analytical Instruments
A Business Unit of Teledyne Electronic Technologies
Operations/Analysis Unit 4
always be corrected using the calibration zero and/or span features.
SUMMARY
The zero and/or span calibration of 5000 series photometric Teledyne analyzers can be
quickly verified manually by using Zero and/or calibration zero offsets and/or span flags.
Refer to typical Teledyne Analytical 1475 sample system below, 3-way valves 1,2,+ 3
below are used to check internal calibration using zero and/or span filters with N2.
CALIBRATION OF H2O IN SOLVENTS
EXAMPLE
Based upon our experience when suppling photometric NIR analyzers for 0-100ppm water in solvents
like EDC, TDI, benzene and the like, the following can be incorporated for the customers pertinent
solvent.
1
Customer is responsible for introducing a reproducible dry zero fluid, typically (-75deg C)
dewpoint Nitrogen or reproducible dry EDC or TDI etc., within +/- 1 ppm H2O (for accuracy of +/- 1
% full scale).
2
When customer supplies a reproducible dry TDI zero fluid: A span flag option is available to
verify instrument full scale sensitivity. This optical flag may be (manually or automatically) introduced
into the light path within the temperature controlled (within +/- 1 deg C) sample cell compartment. This
optical span flag ( when in this temperature stable environment simulates a very stable upscale ppm
H2O reading on top of the DRY reproducible TDI zero background.
3
Conversely, a zero flag and/or offset is (manually or automatically) switched into the light path
of the analyzer after drying out the sample cell of process fluid. Consult your manual for the factor
calibration values obtained.
Actual concentration
Zero check
5 ppm water/TDI
or
0 ppm water in N2
Span Check
mole-sieve or dried sample
(could be from process)
5ppm water in TDI
85ppm water in TDI
(grab sample from process)
5000/5020 series analyzer meter
5ppm water in the 5020 meter or output. Check.
5ppm water on the 5020 meter or output. with zero flag
offset introduction.
delta 0ppm water or stability check on zero verified.
5ppm water on the 5020 meter or output. Zero verified.
85 ppm water as determined by Karl Fischer titration.
(lab technique must be verified for precision.
(sampling device, Karl Fischer titrator and operator
technique)
Teledyne Analytical Instruments
A Business Unit of Teledyne Electronic Technologies
4–13
4 Operations/Analysis Unit
or
85 ppm simulated water using
span flag on top of dry liquid TDI
delta 80 ppm agreement on slope
sensitivity.
or
0 ppm water in N2
5 ppm water on the 5000B meter
or output with zero-flag/offset
intro.
0 ppm water in N2
delta 80 ppm simulated sensitivity
change of water.
Note: the span flag checks the sensitivity change of the 5000B
and not the zero drift of the analyzer. The mole sieve dried TDI
checks the zero of the instrument provided it can be reproduce the
zero by consistently removing all the water to the same ppm level,
(somewhere in the 2-10 ppm water range). The long term
efficiency of removing the water by mole-sieve contact should be
known for the customers process fluid, otherwise the customer
should have an acceptable off line lab technique to analyze
prepared samples be fore intro into the 5020 field analyzer. With
Teledyne’s approach, using N2 as the dry background for both
zero and span checks, eliminates the concern of the mole-sieve
being saturated with time. Indeed, the N2 Nitrogen background
approach can be used to verify the inefficiency of the mole-sieve
(saturation). Teledyne prefers this approach using easily
reproducible N2 since it is much simpler to flush out the sample
cell and check the instrument provided the original calibration on
TDI is used to set up the zero and span instruments of the optical
filters. See attached piping on how the appropriate valves are
operated to switch in N2 in the reverse mode to provide a stable
zero and or span check.
4–14
Teledyne Analytical Instruments
A Business Unit of Teledyne Electronic Technologies
Operations/Analysis Unit 4
1
Sample Return
Sample
Flowmeter
.2-2 GPH
Nitrogen in - dry purgeout
of cell when manually
zeroing/spanning
Calibration Return
Nitrogen in
By-Pass
Flowmeter
2-30 GPH
Pressure Relief
Valve V-621
Analyzer
enclosure purge
0-200ccm
Sample Temperature
Compensation
Maximum inlet pressure
< 175 psig (12 Bar A)
2
3
5000B
Analyzer
Cell
GO
Sample in
Fast loop and
By-Pass Filter
(5 microns)
zero and/or span optical flags
for manual or auto-calibration
Span in
Zero in
ITEM
PART NO.
TOLERANCE UNLESS
OTHERWISE SPECIFIED
FRAC.
DEG.
ANGULAR
DESCRIPTION
THIS DRAWING IS THE PROPERTY OF TELEDYNE ANALYTICAL INSTRUMENTS AND CONTAINS CONFIDENTIAL
INFORMATION. IT IS NOT TO BE COPIED WITHOUT WRITTEN PERMISSION.
TELEDYNE Analytical Instruments
a business unit of Teledyne Electronic Technologies
SCALE
DATE
1/18/2001
INDUSTRY, CALIFORNIA 91749
CUSTOMER
Measurement(s)
MODEL
LIQUID SAMPLE SYSTEM
5020 SERIES NIR
0-% or ppm H2O in solvents
RFQ No.
R01
SALES ORDER NO.
316SS, VITON OR KALREZ, TEFLON MATERIALS
DESIGN: BY ENGINEER
R. DOWNIE K. KOTHARI
Teledyne Analytical Instruments
A Business Unit of Teledyne Electronic Technologies
APP
4–15
4 Operations/Analysis Unit
ATTACHMENT 5000B/5020 NIR ANALYZER
Quote "Exceptions" and "LIQUID PHASE Conditions" for this application.
1
Response Time is proportional to sample system design for take-off distance, process pressure, line
size, sequencing and bypass, by-pass analyzer flow design, dead-volumes/tee's, sample cell volume
and instrument electronics.
2
Maximum cell operation pressure to be 175 psig, based upon standard Sapphire window cell design.
Higher pressures available.
3
The sample flow through the analyzer should be regulated to within ± 5% of its recommended absolute
nominal set point flow value (typically 20-60ccm). This will avoid any pressure drops across any
orifices or poor temperature control of the sample.
4
The temperature of the sample from the take-off thorough the sample cell must be non-freezing, noncrystallizing, non-coating as provided by customer.
5
The sample temperature should not vary at the inlet more than ± 15 OC of the calibration temperature,
nor exceed the design operating specifications typically 5-45 OC. Assume sample below 45 C and
requires no cooling.
6
Any background components later found to be present and not specified in the original application
feasibility may void the instrument performance should they interfere. particulates assumed none.
7
If compounds are found present, such as moisture, acid gases or corrosive solvents, etc., the sample
system materials may be compromised for corrosion resistance integrity. We assume that the sample
will not polymerize, clog or react in any 1/4" sample line, filter or sample cell when transporting through
the sample systems for all inlet ambient or sample pressures and temperatures from takeoff or derived
from sample conditioning. Special materials may be required for stability, corrosion protection, coalescing, filtering, hazardous protection or due to heating or cooling.
8
We recommend when ambient temperatures exceed outside a 1-50 OC range that the instrument and
sample system be conditioned appropriately for heating/ cooling without condensation, crystallizing,
coating, polymerization, etc.
9
Should the general purpose or explosion proof instrument be supplied on a back-panel or as a bulkmount housing, the customer must install to protect the instrument to meet harsh ambient conditions
for dust, water, snow, wind, corrosion, etc.
10 Teledyne is not responsible for applying a general purpose instrument in a hazardous area or where a
flammable or toxic gas or liquid is brought to an analyzer above its lower explosive limit and the area
has been classified as general purpose and safe.
11 The internal calibration features using optical filters are optimized and used when the sample can be
flushed (backflushed usually) out of the sample cell using dry nitrogen or air to a reproducible background zero. The zero offset and/or span flag is introduced and set-up to simulate the on-line calibration
only after the customer has calibrated the analyzer on the representative process fluid. Thereafter, no
calibration fluids are needed to check analyzer.
4–16
Teledyne Analytical Instruments
A Business Unit of Teledyne Electronic Technologies
Operations/Analysis Unit 4
4.4
Operational Theory Cont'd
The energy source for the analyzer is most commonly provided by as a
high intensity quartz iodine lamp located in the source module. Quartz iodine
was chosen because it produces sufficient NIR to operate the system and
maintains a nearly constant brightness over its lifetime. (See Figures 2-1 and
2.2).
This energy is then fed through the sample, which is temperature
controlled, and into the detector module where it passes through a rotating
filter wheel before reaching the lead sulfide (PbS) detector (PbSe also used
for longer wavelengths (cooled and non-cooled).
The filter wheel, driven at 30 RPS or 1800 RPM by a synchronous AC
motor, contains two optical filters with bandpasses selected for each application, thus providing reference and measuring pulses from which the required
information may be obtained.
The detector receives pulses at the rate of 60 PPS, or two pulses per
revolution of the filter wheel. Every other pulse is from the measuring filter,
while the alternate pulse is from the reference filter, so that pulses through
the measuring filter alternate with pulses through the reference filter. A filter
position sensor, which is an optical device having an integral light source
and light detector, differentiates between the two.
The two entrained pulses received by the detector each revolution are
amplified through a preamplifier which is physically located inside the sealed
compartment with the filter wheel and detector. This signal is then sent to a
clamping circuit where an exact zero reference is established.
This clamped video signal is then fed through a gain control network,
which is controlled by the automatic gain control loop, through another
amplifier, to the electronic switch. This switch is controlled by the switch
driver network which derives its information from the filter position sensor in
order to separate the entrained video signal into its component parts of a
measuring peak and a reference peak. These peaks are then fed through a
balancing network and channeled into separate peak height detectors which
produce DC voltage levels which are exactly equal to the peak height or
absolute magnitude of the voltage from the base to the peak of each of the
pulses.
At this point the reference signal is fed back to the automatic gain
control loop to maintain the desired system gain. In addition, both the measuring and reference levels are fed to selector switches in order to enable
Teledyne Analytical Instruments
A Business Unit of Teledyne Electronic Technologies
4–17
4 Operations/Analysis Unit
direct meter indication, which greatly eases the task of balancing the system
during initial system installation and periods of calibration.
The DC voltage levels are fed to a logarithmic ratio amplifier which produces a voltage output that is proportional to the logarithm of the ratio of the two
DC input voltages. This output voltage, directly proportional to the concentration
of sample, is, within certain limits, a linear function of the concentration. For
purposes of transmission, the voltage signal is converted by an E-to-I converter;
thus, the output signal from the analysis unit is a current signal that is proportional
to the concentration of sample in the sample module.
There is also an option of providing an automatic zero function (see drawing B-14729) in the control unit. This circuit provides electrical signals for
switching a fluid which contains none of the material to be measured into the
sample module, electrically adjusting the zeros and switching back to sample.
4.4.1 Source Module
The source module is the source of infrared energy. This is provided
through the use of a high-intensity mini IR lamp or a quartz iodine lamp
operating directly from a 5.0 volt stable supply or a 6.3 V transformer. To
ensure a stable source of radiation in the face of line-voltage variations, the
lamp transformer derives its input directly from a line voltage-regulating
transformer, selected for its ability to maintain a constant output voltage level
regardless of fluctuations in the input line voltage within the control range of
105 to 130 VAC.
In some applications where we have an abundance of energy due to
low sample absorption, the focusing lens is removed to avoid excess energy
reaching the detector. However, other systems have high energy losses in the
sample module due to strong sample absorbance or exceptionally long
sample path-lengths. These systems require a focusing lens to gather and
collimate the radiation for maximum utilization of source energy. The
collimating lens is usually quartz, but may be CaF2 for longer wavelengths.
Also the source lamp may be a differenct type, to emit more radiation at the
longer measuring wavelengths. (Consult manual addendum descriptions).
4–18
Teledyne Analytical Instruments
A Business Unit of Teledyne Electronic Technologies
Operations/Analysis Unit 4
Figure 4-1.
Optical System
4.4.2 Sample cell
The sample cell, generally constructed of 316SS, is located in the path of
the NIR radiation, between the source and the detector modules. Each compound in the sample path exhibits its own characteristic absorption spectrum.
Cell spacer thicknesses will vary depending upon the absorbance of the component of interest at the measuring wavelength. Due to the possible variation of
absorption with temperature, it is either necessary to maintain the sample at a
constant temperature during analysis or to compensate for the minor frequency
shifts of the water bonding which can change due to sample temperature variations.. To achieve this, two separate methods of temperature control are employed for constant temperature control.
1. A preheater (heat exchanger coil) is used on the incoming sample
stream to raise or lower it to the desired temperature controlled
level.
Teledyne Analytical Instruments
A Business Unit of Teledyne Electronic Technologies
4–19
4 Operations/Analysis Unit
2. The entire sample module is separately controlled to maintain the
sample temperature during analysis.
3. The sample is temperature compensated for by software while inputing the
temperture value at the sample cell.
Figure 4-2
4–20
Analyzer System - Block Diagram
Teledyne Analytical Instruments
A Business Unit of Teledyne Electronic Technologies
From Detector Module
Operations/Analysis Unit 4
15 VDC
MEAS
REF
ZERO
Power
S1
5A
Coarse
Zero
Control
To
Log
Selec tor
Switc h
To
Meter Driver
Amplifier
115 VAC to
Sourc e Module
115 VAC to
Detector Module
Line Voltage
Regulator
Transformer
115 VAC
60 Hz
Input
Figure 4-3
Preheater
Temp.
Control
Thermistor
and Heater
Sample
Module
Temp.
Control
Thermistor
and Heater
Detector
Module
Temp.
Control
Thermistor
and Heater
Power Module - Block Diagram
Teledyne Analytical Instruments
A Business Unit of Teledyne Electronic Technologies
4–21
4 Operations/Analysis Unit
4.4.3 Power
See Figure 4-3. The power to the analyzer unit, enables the switching
functions, and temperature control for the detector compartment.
With the microprocessor control unit, the following information is provided.
Figure 2-3.
Power Module - Block Diagram
The temperature in the detector compartment is controlled by inputs from a
RTD device which feeds to a PID controller capable of set points of temperature
versus temperature readout.
4.4.4
Detector compartment
After energy has passed through the sample, it arrives at the filter wheel
where it is fed alternately through two filters (measuring and reference) before
reaching the detector.
These filters are specially selected for each application according to the
absorption characteristics of the compounds under analysis. The reference
and measuring filter waveforms occur along a baseline at approximately 16
milliseconds intervals; each reference or measuring waveform reoccurs at a
time interval of 33 mS, or one per revolution of the filter wheel.
At the detector, infrared energy is transformed into electrical pulses and
fed through an impedance-matched preamplifier (see dwg. A-14619). Depending upon the application, length of the cell spacer, etc., the gain of the
preamplifier may vary from 1 to 10, depending upon the energy intensity at
the detector, to achieve an AC signal output of approximately 0.1 to 1.0 volt
peak-to-peak.
Additionally, the detector, filters, and preamplifier are housed in an electrically and thermally isolated compartment to provide maximum stability and
minimum noise. This box, or compartment, is normally temperature controlled at
46 °C.
As noted previously, the filter wheel is driven by a synchronous AC chopper motor which operates at 1800 RPM. The filter wheel performs two functions: (1) switching filters, and (2) chopping the optical signal to give pulses
which can be amplified for high quality processing.
4–22
Teledyne Analytical Instruments
A Business Unit of Teledyne Electronic Technologies
Part II: Maintenance/Analysis Unit
Maintenance 5
Maintenance
5.0
Routine Maintenance
5.1
Automatic operation and routine operational duties
The system operates continuously without adjustment. Under normal conditions, after you program the system for automatic operation, only routine maintenance
procedures are necessary. The most common failure condition is a temporary
interruption of the power serving the instrument. If the power service is interrupted, the
source lamp in the analyzer will restart automatically as long as there is no defect in the
lamp circuit or its starter.
You can detect a lamp off condition with the signal failure alarm circuit, but you
must connect the relay contacts from the alarm to your indicating device. In addition,
you will experience an alarm condition when the cell windows are extremely dirty or the
electronics fail in the detector-converter, log amplifier, or inverter circuits. When the
alarm circuit is powered independently from the analyzer power source, the alarm
circuit is fail-safe and will detect power failure.
A message such as "Cell Fail check the detector signal" might be displayed
if a 1amp off condition occurs
5.2
System Visual Check and Response Procedure
1.
Verify that the signal failure alarm is not in failure condition.
2.
Verify that the zero and span control setting have not been
disturbed.
Teledyne Analytical Instruments
Part II: 5-1
5 Maintenance
Model 5000B Photometric Analyzer
3.
Verify that the chart recorder contains a normal display.
4.
Verify that the recorder has a sufficient supply of chart paper and
ink.
5.3
Routine Maintenance
Keep the sample lines and components, including the measuring cell
within the analyzer sample module, free of deposits and leaks. You must
determine the interval between cleaning procedures empirically, because the
duration of time that the system runs without attention is related directly to the
sample’s condition.
5.4
Suggested Preventive Maintenance
Schedule
DAILY
1.
Visually inspect the complete system for obvious defects, such
as leaking tubes or connectors.
2.
Verify that the sample pump (if applicable) is running.
3.
Verify that the signal failure alarm is not in failure condition.
4.
Verify that zero and span settings are correct.
WEEKLY
1.
Examine sample cell windows for accumulation of solids.
Remove and clean as necessary.
2.
Calibrate the system.
ANNUALLY
1.
Check the electronics calibration.
2.
Check the UV source.
NOTE: Be sure to wear UV filtering eye goggles.
3.
5-2: Part II
Check the solenoid valves.
Teledyne Analytical Instruments
Part II: Maintenance/Analysis Unit
5.5
Maintenance 5
Service Procedures and Adjustments
5.5.1 Electronics
TAI aligns the system’s electronics. However, you may
need to touch up the circuitry, using the following procedure.
Equipment Required:
Oscilloscope (dual trace is preferred, but not required) To observe
oscilloscope test points switch the vertical input selector of the scope to DC.
Switch to AC to observe the demodulator switch signals.
DVM (Digital Voltmeter)
PC Board Extender
Use the PC board extender whenever you need to adjust trimpot.
Because all PC board connectors are keyed to avoid wrong positioning in the
connectors, you must remove the key and after testing you need to replace the
key with long-nosed pliers. Turn off the power during this operation. Never
disconnect or connect the PC boards with the power on, because you may damage
the PC board C-MOS devices.
5.5.2 Power Supply Test Points
Measure +15 volt ±1 volt DC and -15 volt ±1 volt DC on the differential power
supply PC board in the control unit. Refer to the power supply schematic in the back
of the manual to identify the power supply test points.
5.5.3 Setup of the Signal Processing Front-End
Amplifiers
Fill the sample cell with air or a stable fluid, such that the photo energy
that strikes the detector is constant. A stable fluid is distilled or tap water. This
step may be omitted when the system is stable in its present state.
Teledyne Analytical Instruments
Part II: 5-3
5 Maintenance
Model 5000B Photometric Analyzer
If you open the detector module, keep stray light out by covering the
opening with a dense black cloth. If you do not take this precaution, the result
is a misinterpretation of the scope patterns. On general-purpose systems, the
scope test points are in the bottom of the detector module and are accessible
without opening the module.
5.5.4 Oscilloscope Display of the I to E Converter Output
The output of the I to E Converter is observed at the output of the second
amplifier. The objective of this operation is to set up the optical system and the
gain of the second amplifier in such a way that the analyzer keeps operating
within its dynamic range.
Connect the oscilloscope to TP3. The oscilloscope displays the measuring and reference pulses in an alternating pattern. The display is created by the
light passing through the reference and measuring filters as they are brought in
and out of the light beam by the rotating filter wheel. These light pulses are
converted to electronic energy which is amplified and brought to TP2. The base
line represents the blocking of the light beam by the opaque part of the filter
wheel.
To identify which of the pulses is the measuring peak, insert the span
filter (when present) or a piece of flat glass or clear plastic in the light beam. The
peak that becomes the shortest (retracts excessively) is the measuring filter pulse.
In case you cannot set the gain properly, because the peaks are too short,
too tall, or too much out of balance, adjust R2 trimpot on the converter PC board
until you obtain the desired peak height as observed on the scope (usually 8 to
9 volt) for the tallest of the two peaks. Never leave the system operating with
peaks exceeding 10 volts or you may saturate the logarithmic amplifier. You
should not permit oscillations or distortions in the peaks.
5.5.5 Balancing the Optics for Equal Light Transmission
with Zero Fluid in the SAMPLE CELL
The objective of this procedure is to obtain measuring and reference
peak heights as displayed on the oscilloscope that are approximately equal, with
the tallest peaks set at 8 to 9 volts. This must be done with air or zero fluid in
the cell.
5-4: Part II
Teledyne Analytical Instruments
Part II: Maintenance/Analysis Unit
Maintenance 5
The procedure is purely mechanical and consists of adjusting the amount of
light passing through either the measuring or reference filter, never both. Screens
(wire mesh) of varying density are used for this operation and are part of the small
took kit accompanying the instrument.
1.
Observe the oscilloscope and judge if optical balancing is
needed. When the difference is less than 1 volt, balancing is not required. The
tallest of the two peaks should be adjusted to 8 or 9 volts with the gain control
R2 on the detector PC board. When this cannot be done because both peaks are
too short or too long, search for screens mounted in the light path, usually located
in a holder on the light pipe which interconnects the detector and sample module,
and remove or add screens, as necessary.
2.
When balancing is needed, identify the peaks as outlined under
Section
3.
For example, if the reference peak is the shorter one, stop the
filter wheel with your hand and see if screens are located behind the reference
filter. The reference filter is identified by the letter “R” engraved on the filter
wheel.
4.
If screens are found, remove them after taking the filter wheel off
the shaft with the special Allen wrench supplied in the tool kit.
5.
After removal of the screens and remounting the filter, mount the
filter wheel back on the shaft. Position it correctly on the shaft by lining up the
two paint marks on shaft and wheel.
6.
Turn on the instrument and observe the balance on the oscilloscope.
a.
If the reference peak is now too tall, remove the filter wheel and
add a screen of lesser density behind the reference filter. Repeat this procedure
until the peaks are within 1 volt of each other.
b. If the measuring peak is equal to or within 1 volt of thereference peak,
the system is optically balanced and ready for calibration.
c. If the peak is still too short, repeat the procedure, but thistime put a
screen behind the measuring filter to shorten its peak.
Teledyne Analytical Instruments
Part II: 5-5
5 Maintenance
Model 5000B Photometric Analyzer
7. After the peaks are balanced, adjust the gain control until the tallest of
the two peaks is 8 to 9 volts. The peaks should still be within1 volt of each other.
8. It is always good practice to operate the analyzer with as low a gain as
possible. Therefore, with the gain control just barely off its stop, once again remove
or add screens in the light path to obtain as high a voltage as possible without
exceeding 9 volts for the highest peak. Read-just gain for 8 to 9 volts.
This concludes the balancing procedure and the instrument is ready for
calibration.
5.5.6 Setup of the Logarithmic Amplifier
The amplifier is inverting and continuously taking the logarithm of the output
signal of the second amplifier. You can observe the output by connecting the scope
probe to TP4.
The correct wave shape has a rounded negative going pulse that is the
signal and a flat-topped positive pulse that depicts saturation of the log amplifier.
You should not permit distortions or oscillations in the rounded peaks.
When the positive going pulse is not flat or is distorted, adjust trimpot R3
only enough to obtain a flat positive pulse. If you over adjust, you may lose part
of the second decade of absorption and affect the accuracy of analysis for high
concentrations of the component of interest where the measuring pulse can
become very short. The log amplifier saturates because the amplifier is
incapable of taking the logarithm of the slightly negative baseline.
5.5.7 Inverting Amplifier
The amplifier is inverting and has a gain of 1. It inverts the output signal of the
logarithmic amplifier and acts as a buffer between the logarithmic amplifier and the
reed switch and integrators. To observe the output of the inverter, connect the scope
probe to TP5. The wave must be a duplicateof that observed on TP4, except that
it is inverted.
5-6: Part II
Teledyne Analytical Instruments
Part II: Maintenance/Analysis Unit
Maintenance 5
5.5.8 Integrated Reference and Measuring Signals
You can observe the reference and measuring signal at the first stage of
integration by connecting the scope probe to TP6 (reference signal) and TP7
(measuring signal) at the detector unit. A dual trace scope is advantageous but
not required for this observation.
The test points’ significance is that they reveal proper switch action. The
display shows a sawtooth pattern that is a charge-discharge of the first capacitor
in the integrating network. This ripple is the AC component of the reference and
measuring signal after the pulses are converted to DC. The sawtooth patterns
must be displayed 180° with respect to each other as viewed with a dual trace
scope. They must both be present.
If one is missing, the switch is not switching. If the sawtooth shows a
broken pattern, the switching action is feeble or irregular. Usually, you can fix
the faulty condition of the switch by slightly changing the switch position.
The action of a bar magnet and a rotating chopper disc activate
themagnetic mercury reed switch. An aluminum motor mounting block houses
a bar magnet. This bar magnet is parallel with the mercury chopper switch.
The chopper disc is a green and black disc mounted on the filter wheel
shaft next to the motor. The disc is composed of both magnetic and nonmagnetic materials. As the shaft rotates, the magnetic portion of the disc shorts
the magnetic flux as it passes between the magnet and the switch. The non-magnetic
portion of the disc enables flux lines from the bar magnet to activate the mercury
switch.
5.5.9 Battery-Powered Oscilloscope
Synchronization Point
Because the line frequency cannot synchronize battery-powered oscilloscopes, use TP8 at the detector module to provide external synchronization.
5.6
Interface Board Terminals Strip
At the bottom of the interface PCB on the Control Unit, are three terminal
strip where wiring is distributed to other sections of the Model 6000B System.
Such as AC power for the D2 lamp power supply, DC Power to the preamplifier, High DC voltage for the photodetector, and signals to control calibration
solenoids and filters. To gain access to this terminals, the silkscreen cover must
be removed. These terminals are wired in the factory.
Teledyne Analytical Instruments
Part II: 5-7
5 Maintenance
Model 5000B Photometric Analyzer
WARNING: DANGEROUS HIGH VOLTAGES ARE PRESENT AT
THESE TERMINALS. TRAINED PERSONNEL MUST
REMOVE THE SILKSCREEN COVER ONLY. EXERCISE EXTREME CAUTION.
The first strip terminal has three contacts labeled N, G and H. The labels
stand for Neutral, Ground, and Hot. This is the AC power strip terminal. It
feeds AC power to other components of the Model 6000B System, such as the
D2 lamp power supply, heater, and temperature controller PCB.
The second strip terminal has four contacts labeled SHLD, SIG, GND,
MEAS and REF. This strip terminals are dedicated to the signals coming
from the photodetector amplifier. The labels stand for:
SHLD: Shield. Shield form the preamplifier cable connects to this contact.
SIG GND: Signal Ground. Ground reference for both the measure and the
reference signal.
MEAS: Measure Signal voltage.
REF: Reference Signal voltage.
The third terminal strip has eight contacts labeled -230 VDC, +15 VDC, -15
VDC, COM, SPAN FLTR, SPAN SOL, ZERO FLTR, ZERO SOL. This
strip feeds the high voltage needed on the cathode of the photodetector, DC
power for the photodetector preamplifier, and control signals for the solenoids and filters. The labels stand for:
-230 VDC: This is the negative high voltage fed to the photodetector
cathode, about -230 VDC.
5-8: Part II
Teledyne Analytical Instruments
Part II: Maintenance/Analysis Unit
Maintenance 5
+15 VDC: Power Supply voltage fed to the photodetector preamplifier,
+15 VDC.
-15 VDC: Power Supply voltage fed to the photodetector preamplifier,
-15 VDC.
COM: Common reference to the +/- 15 VDC and the -230 VDC power
supplies.
SPAN FLTR: Span filter signal, AC voltage.
SPAN SOL: Span solenoid signal, AC voltage.
ZERO FLTR: Zero filter signal, AC voltage.
ZERO SOL: Zero solenoid signal, AC voltage.
Teledyne Analytical Instruments
Part II: 5-9
5 Maintenance
5-10: Part II
Model 5000B Photometric Analyzer
Teledyne Analytical Instruments
Photometric Analyzer, 5000B
Appendix
Appendix
A-1 Specifications
5000B Digital Control Module:
Ranges: Four Programmable Ranges, field selectable
within limits (application dependent) and Auto
Ranging
Display: 2 line by 20 alphanumeric VFD accompanied
by 5 digit LED display
Signal Output: Two 0-1V DC (concentration and range ID)
Two 4-20mADC isolated (concentration and
range ID)
RS232
Alarm: Two fully programmable concentration alarm
set points and corresponding Form C, 3 amp
contacts. One system failure alarm contact to
detect power, calibration, zero/span and
sensor failure.
Mounting: Bulkhead Mount, NEMA-4 rated
Operating Temperature: 0-50oC
Teledyne Analytical Instruments
A-1
Appendix
Models 5000B
Typical Analytical Performance Specifications:
(will vary per application)
Accuracy:
±2% of full scale or better, application dependent
Noise:
Less than ±1%
Diurnal:
Less than 1% per 20oF (10oC (source/detector
dependent)
Sample Cell:
Stainless steel with Sapphire window
standard. Other materials available.
Cell Length:
.01 to 10 inches
Flow Rate:
50 to 1500 cc/min
Light Source:
TungstenMini-Lamp, optional Quartz Halogen
Sensitivity:
.015 to 3 absorbance units.
Reproducibility:
+/- 1% of scale or better
Filter Wavelength:
750nm to 5 microns, application dependant
Sample Pressure:
Sapphire window 250 psi
Response time:
Programmable
Other Specifications:
Ambient temp range: 32-122 °F (0-50 °C)
Internal calibration: Optical span flag/zero and span calibration
NOTE: 5000B/5020B (sample temperature sensing and output correction)
Power Rating: 115/230 VAC, 50/60 Hz, Approx 200 watts
Readout Device: Digital, 2 line alphanumeric vacuum fluorescent display,
(VFD)
Analog Output Signal: 0-1 V (standard), 4-20mA isolated
Area Classification
Non-hazardous:Model 5000B
Hazardous / Explosion-proof:
Model 5020
5000B, 5020B Purge options:X, Y, Z purge, Cenelec IIB
AND H2 (PENDING) FOR ZONE I OR CLASS I, DIV I, B, C, D
AREAS
A-2
Teledyne Analytical Instruments
Photometric Analyzer, 5000B
Appendix
Enclosure Purging:
Purge air startup*:40 – 80 PSI (3 – 6 BAR), 0.5 CFM (15 L / min)
Purge optical path*:15 – 30 PSI (1 – 2 BAR), 10 cc/min, purity of
Nitrogen, - 110 °F (-80 °C) dewpoint
* If ordered with purge option
Other Features:
* Three user selectable ranges
* Signal and Range ID output: 0-1VDC and 4-20maDC (isolated)
* Programmable auto ranging
* Range ID contacts, 3A@250VAC resistive
* Two adjustable concentration alarm set points with programmable relay
function Form C contacts, 3A@250VAC resistive
* Programmable auto calibration with mode ID Form A normally open contacts
* Remotely operated calibration (customer supplied valves) and 24 VDC
signal), application dependent
* Self diagnostics with Form C failure contacts
* Full duplex RS232 communication link
* Alphanumeric VF display for set up and diagnostics
General Installation Note: Protect the instrument from
direct sunlight and rain.
Teledyne Analytical Instruments
A-3
Appendix
Models 5000B
A-2 Recommended 2-Year Spare Parts List
QtyP/NDescription
C-75825A
Motherboard, Control Unit
C-67990
Amplifier, Control Unit
D-67990
5000B Interface PCB
1
A-9306
Differential Power Supply
1
C-40265A
Measuring PCB
1
L323
UV LAMP, 5000B
1
B77609
Parabolic Reflector Assy.
1
B74423
Detector assy (C78194 assy)
1
C-14449
Temperature Controller, Sample Cell
2
O79
O-Ring, Teflon
2
O22
O-Ring, Teflon
1
5
F-1233
F-57
Span Flag Solenoid, new version
Fuse, 5A Slo-Blo
5
F-14
Fuse, 10A Slo-Blo
1
D3
PbS detector standard
2
C128
Sample Cell Window (sapphire)
1
A-16776
Accessory Kit
2
F1268
Fuse, 6.3 A Fast-blo
1
1
1
F1092
F850
F1216
Filter, 1.9 WB
Filter, 1.94 NB (H2O in Acetic Acid, etc.)
Filter, 1.90 NB (H2O in EDC etc.)
_____________________
Note:
Orders for replacement parts should include the part number (if
available) and the model and serial number of the instrument for
which the parts are intended.
Orders should be sent to:
TELEDYNE Analytical Instruments
A-4
Teledyne Analytical Instruments
Photometric Analyzer, 5000B
Appendix
16830 Chestnut Street
City of Industry, CA 91749-1580
Phone (626) 934-1500, Fax (626) 961-2538
TWX (910) 584-1887 TDYANYL COID
Web:
www.teledyne-ai.com
or your local representative.
A-3 Drawing List, 5000B
SEE MANUAL ADDENDUM OF Q FOR COMPLETE DRAWING
LIST.
Teledyne Analytical Instruments
A-5
Appendix
A-6
Models 5000B
Teledyne Analytical Instruments